Contamination of Tea and Tea Infusion with Polycyclic Aromatic Hydrocarbons

1
Department of Food Analysis and Evaluation of Food Quality, Faculty of Food Technology, University of Agriculture in Krakow, Balicka 122, 30-149 Krakow, Poland
2
Laboratory of Food Hygiene and Nutrition, Voivodeship Sanitary-Epidemiological Station in Rzeszow, Wierzbowa 16, 35-959 Rzeszow, Poland
*
Author to whom correspondence should be addressed.
Int. J. Environ. Res. Public Health 2018, 15(1), 45; https://doi.org/10.3390/ijerph15010045
Submission received: 18 October 2017
/
Revised: 23 December 2017
/
Accepted: 25 December 2017
/
Published: 28 December 2017
Abstract
:The aim of this work was to validate the method of determination of polycyclic aromatic hydrocarbons (PAHs), i.e., benzo(a)pyrene and sum of benzo(a)pyrene, benz(a)anthracene, benzo(b)fluoranthene and chrysene in different types of tea, as well as to assess the transfer of these contaminants from tea to tea infusion. The research materials were popular types of black, green, red and white tea. Quantitative and qualitative determination of PAHs was performed by High Performance Liquid Chromatography with fluorimetric detection (HPLC-FLD). The samples were prepared by QuEChERS (Quick, Easy, Cheap, Effective, Rugged and Safe) technique followed by cleaning-up by dispersion solid-phase extraction (d-SPE). Values of limit of detection and limit of quantification obtained in the validation of the method were lower than the respective maximum values given in Commission Regulation (EU) No. 836/2011. The level of contamination of popular teas commercially available on the Polish market with PAHs is similar to that of teas available in other countries, with a very large variation in the concentration of each of the compounds. The highest benzo(a)pyrene and Σ4PAHs contents (209 ± 42 μg/kg and 756 ± 151 μg/kg, respectively) were found for black tea leaves. The transfer of Σ4PAHs from black tea to tea infusions was 0.48%, while it was 1.55–1.72% for red, white and green teas.
1. Introduction
The tea leaf infusion (Camellia sinensis) is one of the most widely consumed beverages in the world due to its palatability, the tradition of preparing and drinking, and the wide variety of commercially available tea species. In addition to the sensory characteristics such as color, taste and aroma, the popularity of tea infusion is determined by its health-promoting effects, which depend on the amount and bioavailability of bioactive compounds in the dried tea [1]. The classification of tea is based on many criteria, including: country of origin, region of cultivation, part of the tea tree, the form of finished product or the tea processing technology, where the latter is the most famous criterion. There are black, green, red, and white teas; however, for white tea there is no general definition. The chemical composition of the finished tea product depends on both chemical composition of the raw material (plant) and on the tea processing. The former is determined by environmental factors including cultivation method, atmospheric conditions and the harvesting period [2]. Moreover, environmental pollution can contribute to contamination of tea with heavy metals, dioxins, pesticide residues and polycyclic aromatic hydrocarbons (PAHs) [3,4]. The latter can be adsorbed with dust particles on tea leaves and buds or can be respired by plant from air [5,6]. Roasting or smoking of tea leaves can also be a source of PAHs in a finished product [7,8,9,10].
According to the current state of knowledge, polycyclic aromatic hydrocarbons have different toxicities: they can cause dangerous in vivo effects, including cytotoxic, immunotoxic, genotoxic, teratogenic and cancerogenic ones [11,12,13,14]. Benzo(a)pyrene is a well-known substance classified by the International Agency for Research on Cancer (IARC) into group 1 of carcinogens—i.e., factors with proven harmful (carcinogenic) effects on the human body—while benzo(b)fluoranthene, chrysene and benz(a)anthracene are classified into group 2B—i.e., group of compounds with a possible carcinogenic effect on the human body [13]. Polycyclic aromatic hydrocarbons are easily absorbed in the human gastrointestinal tract, especially when there is a large amount of fats in the diet. These compounds do not accumulate in the human body; they show relatively low acute toxicity, but very high chronic toxicity [11]. In the first stage of metabolism, PAHs are oxidized by cytochrome P450 oxidase to highly reactive hydroxyl and epoxy PAH derivatives (including diol-epoxides). The oxidized intermediates, in particular epoxy derivatives, can form covalent bonds with DNA, causing its damage and eventual carcinogenesis. In the second stage of metabolism, hydroxy PAH derivatives are coupled with glucuronic or sulfuric acid in the presence of specific transferases. In this form, they are excreted from the body, primarily with bile and to a small extent with urine [11,13,15].
The benzo(a)pyrene (BaP), benz(a)anthracene (BaA), benzo(b)fluoranthene (BbFA) and chrysene (Chr) are limited in foods such as oil, smoked meat and fish products, processed cereal-based foods and baby foods, dietary supplements, cocoa beans, dried herbs and spices [16,17]. European Food Safety Authority (EFSA) has not introduced legislation on maximum permissible PAHs content in tea and fruit teas, although setting such limits has been debated. It was considered that there has not been enough research on the transferring of PAHs from tea to tea infusion in order to estimate the risk of consumer exposure. However, further research is important to estimate the level of PAH contamination of commonly consumed teas [18,19].
According to available scientific studies determination of PAHs in tea is difficult due to the high content of interfering substances such as caffeine, polyphenols, sugars, organic acids and pigments, including chlorophylls. Hence, modern techniques of extraction and purification of samples are used [4,10,20,21,22,23]. One of the modern techniques for purifying samples for pesticide as well as polycyclic aromatic hydrocarbons analyses is QuEChERS (Quick, Easy, Cheap, Effective, Rugged and Safe). The main advantages of this technique are the speed and ease of sample preparation and environmental safety due to the low consumption of chemical reagents, as well as lower cost of analysis compared to other methods [4,21,24].
The aim of this work was to validate the method of determination of polycyclic aromatic hydrocarbons (PAHs), i.e., benzo(a)pyrene (BaP), benz(a)anthracene (BaA), benzo(b)fluoranthene (BbFA) and chrysene (Chr) (individually and as a sum of the four PAHs (Σ4PAHs)), as well as to assess the transfer of these contaminants from tea to tea infusion.
2. Materials and Methods
2.1. Samples
The sampling plan was made according to the classification of tea most often used by consumers, i.e., type of tea: black, green, red and white. Teas branded in this way possess characteristic sensory and health attributes and this classification is related to the method of tea processing. Samples of black, green, red and white leaf teas (28 samples) were of different manufacturers or distributors and were purchased from low and medium price range in local shops. According to the information on the packaging the products consisted mostly of mixtures of teas. The primary three samples from the bath of each kind of tea (10 black tea samples, 6 each green, red and white tea samples) were collected into bulk sample. Two laboratory samples for each type of determination were weighed out of the bulk sample. They were analysed both in a dry form and in form of tea infusions. Before analysis the samples were stored according to the recommendations given on packages, i.e., in a dry place away from light.
2.2. Reagents
For the analysis the following reagents were used: acetonitrile (of HPLC purity) (Merck, Darmstadt, Germany), QuEChERS Bulk Sodium Chloride, SampliQ Anhydrous Magnesium Sulfate for QuEChERs and Primary Secondary Amine (PSA) SPE Bulk Sorbent (all from Agilent Technologies, Santa Clara, CA, USA). Water of HPLC purity was from LiChrosolv (Merck, Darmstadt, Germany). The certified standard PAH Solution Mix from AccuStandard (New Haven, CT, USA) consisted of PAH solution in methanol-dichloromethane (MeOH-DCM), with 200.6 μg/mL of BaP, 197.8 μg/mL of BaA, 198.8 μg/mL of BbFA and 199.0 μg/mL of Chr.
2.3. Apparatus
High Performance Liquid Chromatography with fluorimetric detection (HPLC-FLD) was used for the determination of each of the PAHs. The Nexera X2 (Shimadzu Corporation, Kyoto, Japan) chromatographic system was used, which consisted of SIL-30AC auto-sampler, two LC-30AD pumps, Prominence RF-20Axs fluorescence detector, connected to Lab Solution software ver. 5.57 (Shimadzu Corporation, Kyoto, Japan). The Hypersil Green PAH (Thermo Scientific, Waltham, MA, USA) column (250 × 4.6 mm, I.D., 5 μm) and guard column (10 × 4.0 mm, I.D., 5 μm) were used.
2.4. Methods
2.4.1. Sample Preparation
Three packages of tea of the same batch were taken and their content was mixed, without grinding. The procedure diagram for sample (tea and tea infusion) preparation for the determination of PAHs using HPLC-FLD is presented in Figure 1.
2.4.2. Preparing the Tea Infusion
The amounts of tea and water used to brew the tea have been established experimentally, while the temperature of the brewing water and the brewing time were adjusted according to the instructions on the product packages. The dried tea was infused in freshly boiled water of appropriate temperature and brewed without cover. The water temperature and time of brewing was as follows: 100 °C/5 min, 80 °C/3 min, 95 °C/4 min and 85 °C/3 min for black, green, red and white tea, respectively. On the basis of preliminary analyzes of dried black and white tea, i.e., samples with the highest and lowest PAH content, respectively, it was found that the PAH content in the infusions made of dried tea and water used in a 2:250 mass–volume ratio (commonly used by consumers) is very low and is below LOD. Therefore, further analyses were carried out with the increasing ratio of dried tea to water, so that the PAH content determined in the infusion was above the LOD. As a result of the experiment, it was found that the amount of PAHs determined in both the black and the white tea infusions prepared by infusion of 10 g of dried tea in 50 mL of water was higher than LOD (Table 1). Therefore, the 10:50 tea (g) to water (mL) ratio was used in the study. After brewing, the tea infusion was decanted (without filtration) and allowed to cool down to room temperature. The results of analysis of the blank samples carried out for each series of samples showed no contamination of the water used for brewing.
2.4.3. Extraction and Purification of the Hydrocarbon Fraction
In the initial stage of the research, a comparison of two methods of extraction and purification of the PAHs was made [25]: the method involved use of a glass column filled with aluminum oxide [26] and the QuEChERS procedure. For this purpose, a sample of black tea was used. The results of the determinations, corrected for recovery, are expressed as the content of individual PAHs in the sample under study.
Procedure of sample (tea and tea infusion) preparation by QuEChERS technique for the determination of PAHs is presented in Figure 1. An aliquot of 10 mL of acetonitrile was added to the sample and the sample was hand shaken for PAHs extraction. Then sodium chloride and anhydrous magnesium sulphate were added and then the sample was hand shaken and centrifuged (MPW–350R, MPW Med. Instruments, Warsaw, Poland) in order to separate the phases into the aqueous and the organic ones. The organic extract was purified by adding anhydrous magnesium sulphate and PSA amine sorbent followed by hand shaking and centrifuging. The resulting supernatant was filtered through a syringe filter (0.2 μm, Alchem Grupa Sp. z o.o., Toruń, Poland) [21,27,28].
2.4.4. HPLC-FLD Analysis
The sample was injected into HPLC using an auto-sampler. The temperature of the column was maintained constant at 20 °C. The mobile phase was constituted of acetonitrile and water. The elution conditions applied were: 0–16 min, 60% of acetonitrile; 16–45 min, 100% of acetonitrile; 45–49 min, 60% of acetonitrile. The flow rate was 1.0 mL/min. The effluents were monitored using the following excitation and emission (Ex/Em) wavelengths: 260/420 nm for BaA and Chr and 290/430 nm for BaP and BbFA.
Preparation of Calibration Curves
Calibration curves were performed by external standard method, using the standard substance in five concentrations in the range of 0.10–10.00 ng/mL. The curves were plotted as linear functions: y = a∙x, where x is the peak area of the standard substance and y is of the measured signal [26].
Determination of the Working Range and Linearity of the Method
For each of the PAH calibration curves the coefficients of variation for concentration limits were calculated and then the F-Snedecor test was used for testing homogeneity of coefficients of variation at a 0.05 significance level. Correlation coefficient (r) was also calculated. The limit of detection (LOD) and the limit of quantification (LOQ) were calculated according to the guidelines given in the European Reference Laboratory (EURL) experts’ report concerning the PAHs [29]. For this purpose ten determinations of PAH content in a dried tea sample of the lowest PAH content were made. The LOD and LOQ were calculated according to the following formulas: LOD = 3.9 × Sy,b/b and 3.3 × LOD respectively, where Sy,b—standard deviation of the blank signals, b—slope of the calibration curve. The sensitivity of the method was measured as the slope of the calibration curve.
Measurement of Samples
The PAH determination was performed by a validated method meeting the criteria of Commission Regulation (EU) No. 836/2011 [30]. The measurement procedure consisted of dosing the following samples: blind samples, samples, two calibration solutions (1.00 and 9.00 ng/mL) and samples enriched with certified standard sample.
2.5. Statistical Analysis
Results obtained in the procedure of validation of the method were tested by Dixon Q test for identification and rejection of outliers. Then, for each of PAHs concentrations the following statistical parameters were calculated: recovery factor (correctness), variance, standard deviation, coefficient of variation, standard and expanded uncertainties, confidence interval and relative standard deviation of repeatability. The evaluation of the significance of differences between mean values of PAH concentration was made using Tukey multiple comparison test at a 0.05 significance level. All statistical procedures were computed using Statistica version 12.0 (StatSoft, Krakow, Poland).
3. Results and Discussion
3.1. PAH Content of Tea
The values of the limit of detection (LOD) and the limit of quantification (LOQ) complied with the criteria set out in the Commission Regulation (EU) 836/2011 [30] (Table 2). In the concentration range of 0.10–10.00 ng/mL the calibration curves for each of the standard substances were linear, with values of correlation coefficient higher than 0.998. In order to assess the repeatability of the method, twenty analyses of BaP, BaA, BbFA and Chr contents in black tea were performed. The criteria of Commission Regulation (EU) 836/2011 [30] were fulfilled, since the values of RSDr were lower than 20% and the Horrat coefficient was lower than 2 (Table 2).
The correctness (accuracy) of the method was determined by performing a full analytical procedure in six replicates for black tea samples enriched with a mixture of BaP, BaA, BbFA and Chr at three concentration levels: 5.0 μg/kg and 40.0 μg/kg and 250 μg/kg. The recovery mean values were in the range of 50.75–93.30% (Table 2). Expanded uncertainty was also calculated by multiplying the standard uncertainty with a coverage factor k = 2 and its value for all of the PAHs determined was 20%.
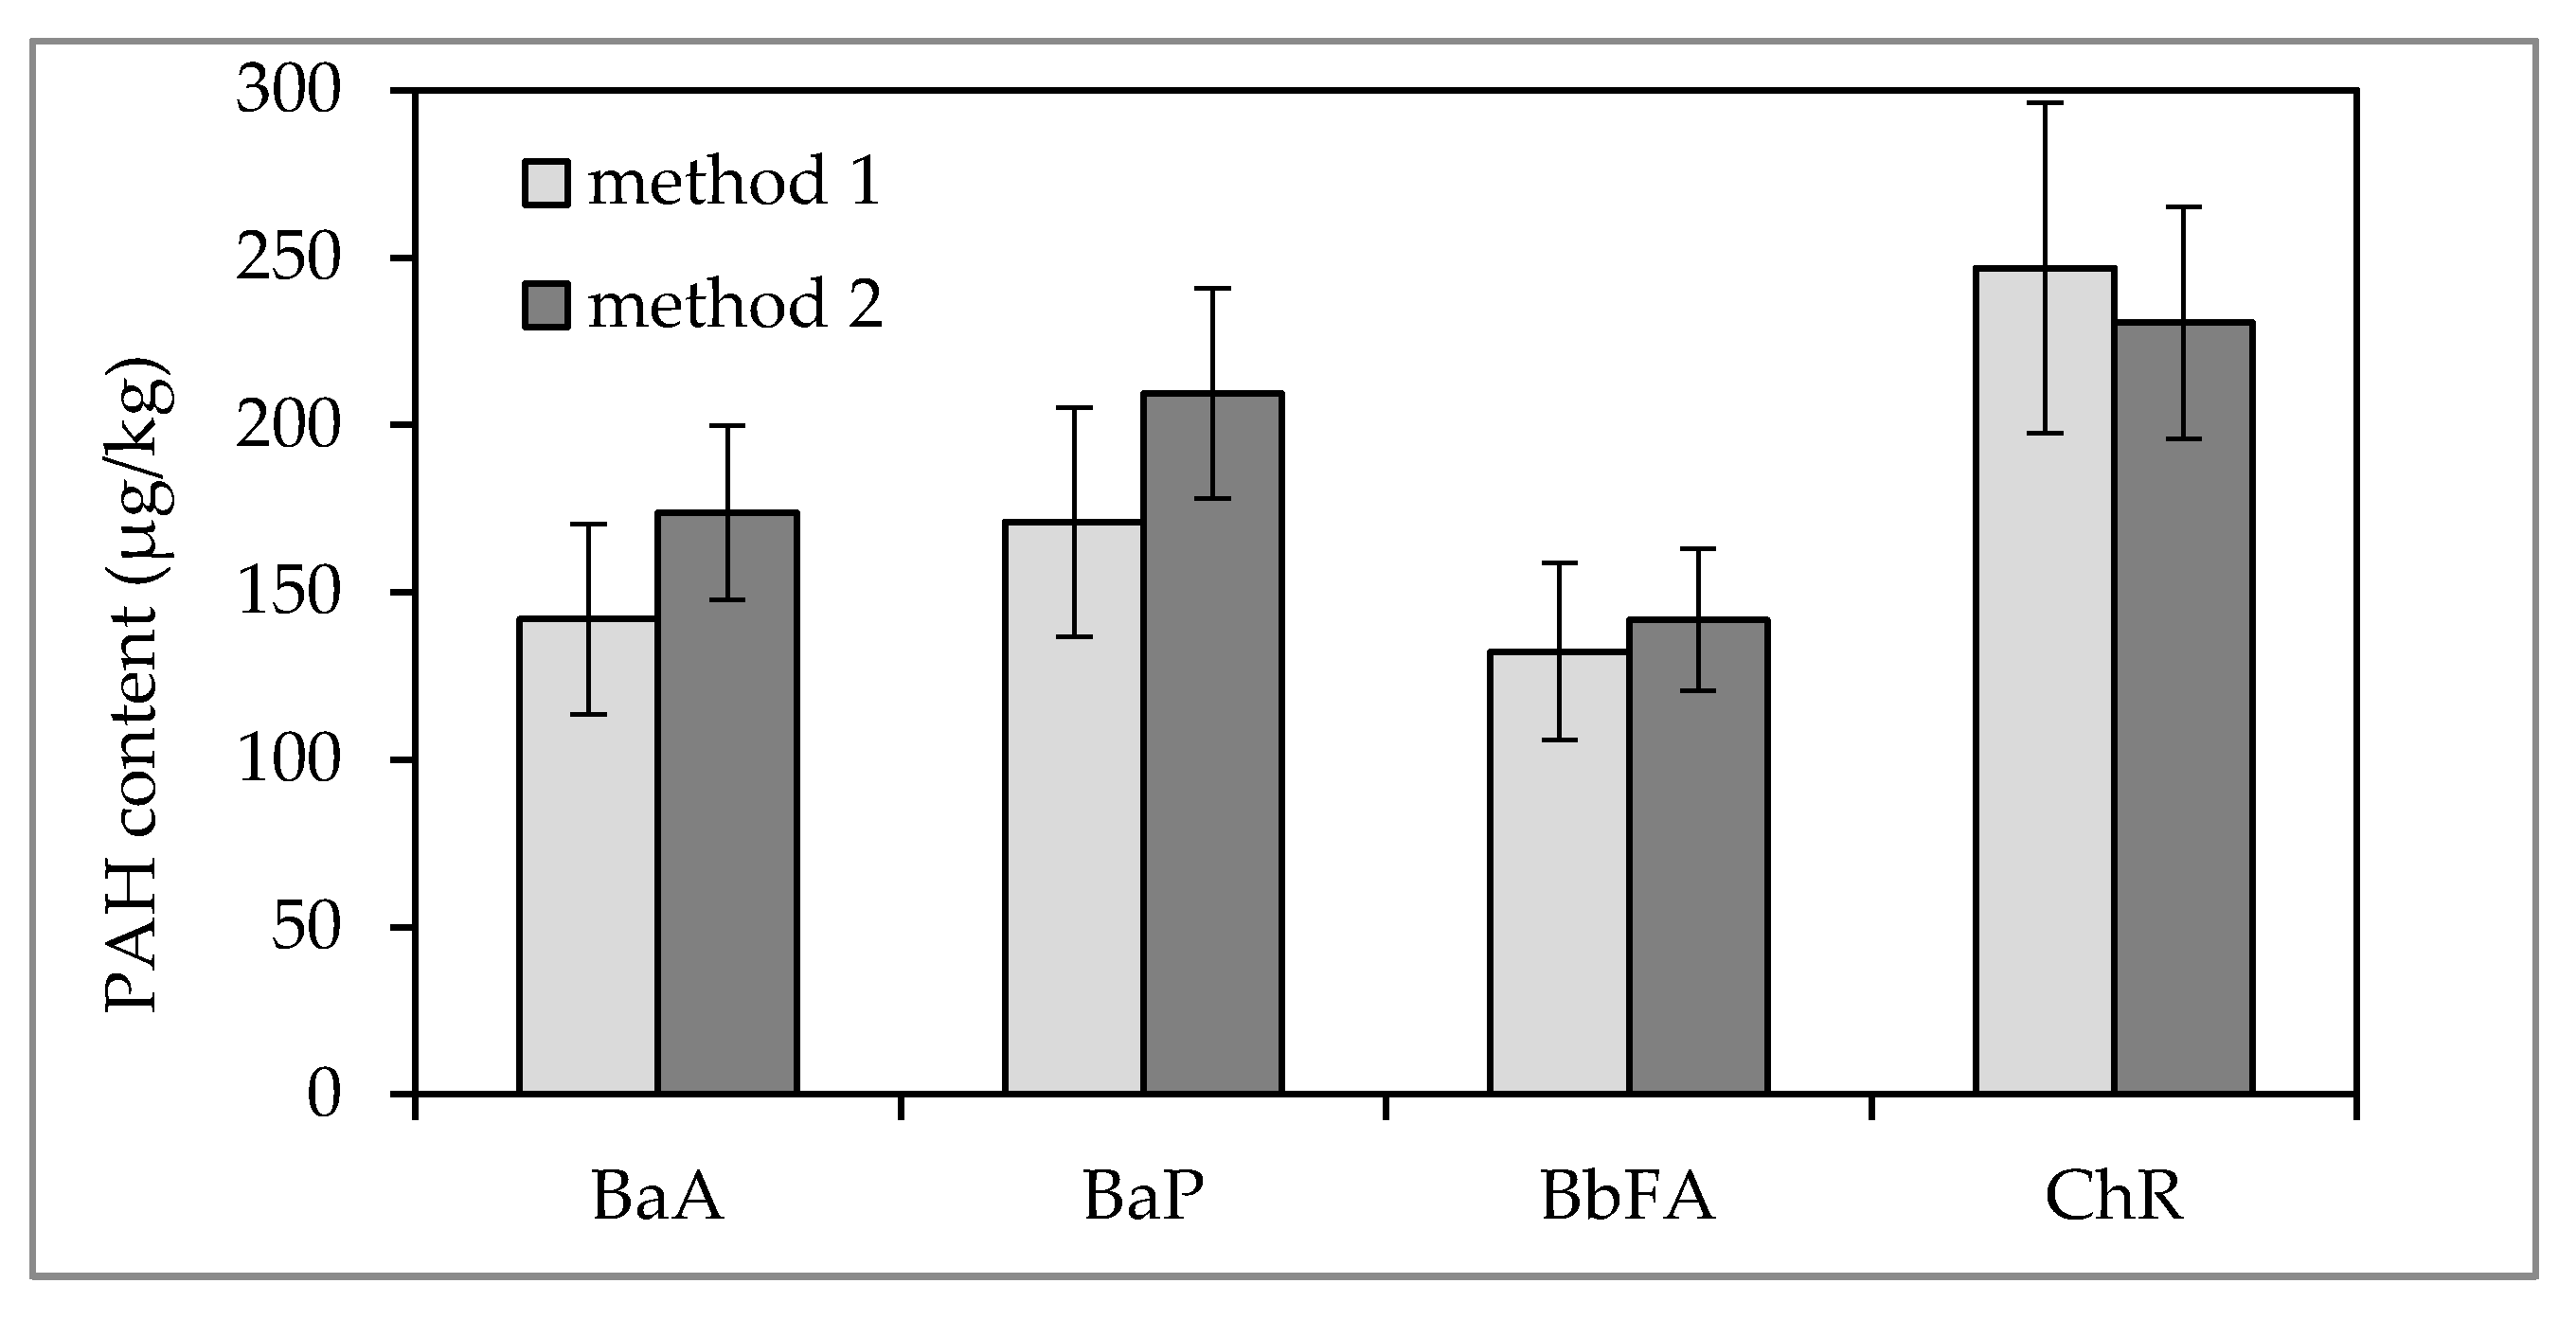
Due to the lack of appropriate reference materials representing the composition of tea, the results of PAH determination in black dried tea by HPLC-FLD method proceeded by extraction and purification procedure by QuEChERS technique were compared to the respective results of PAH determination by the method with use of glass chromatographic column packed with alumina [26]. Taking into account the uncertainty estimated for each of the methods, it was found that there were no statistically significant differences between the obtained results (Figure 2); therefore, the QuEChERS method can be recommended for determination of PAHs in tea due to considerably shorter analysis time and less chemical reagent consumption.
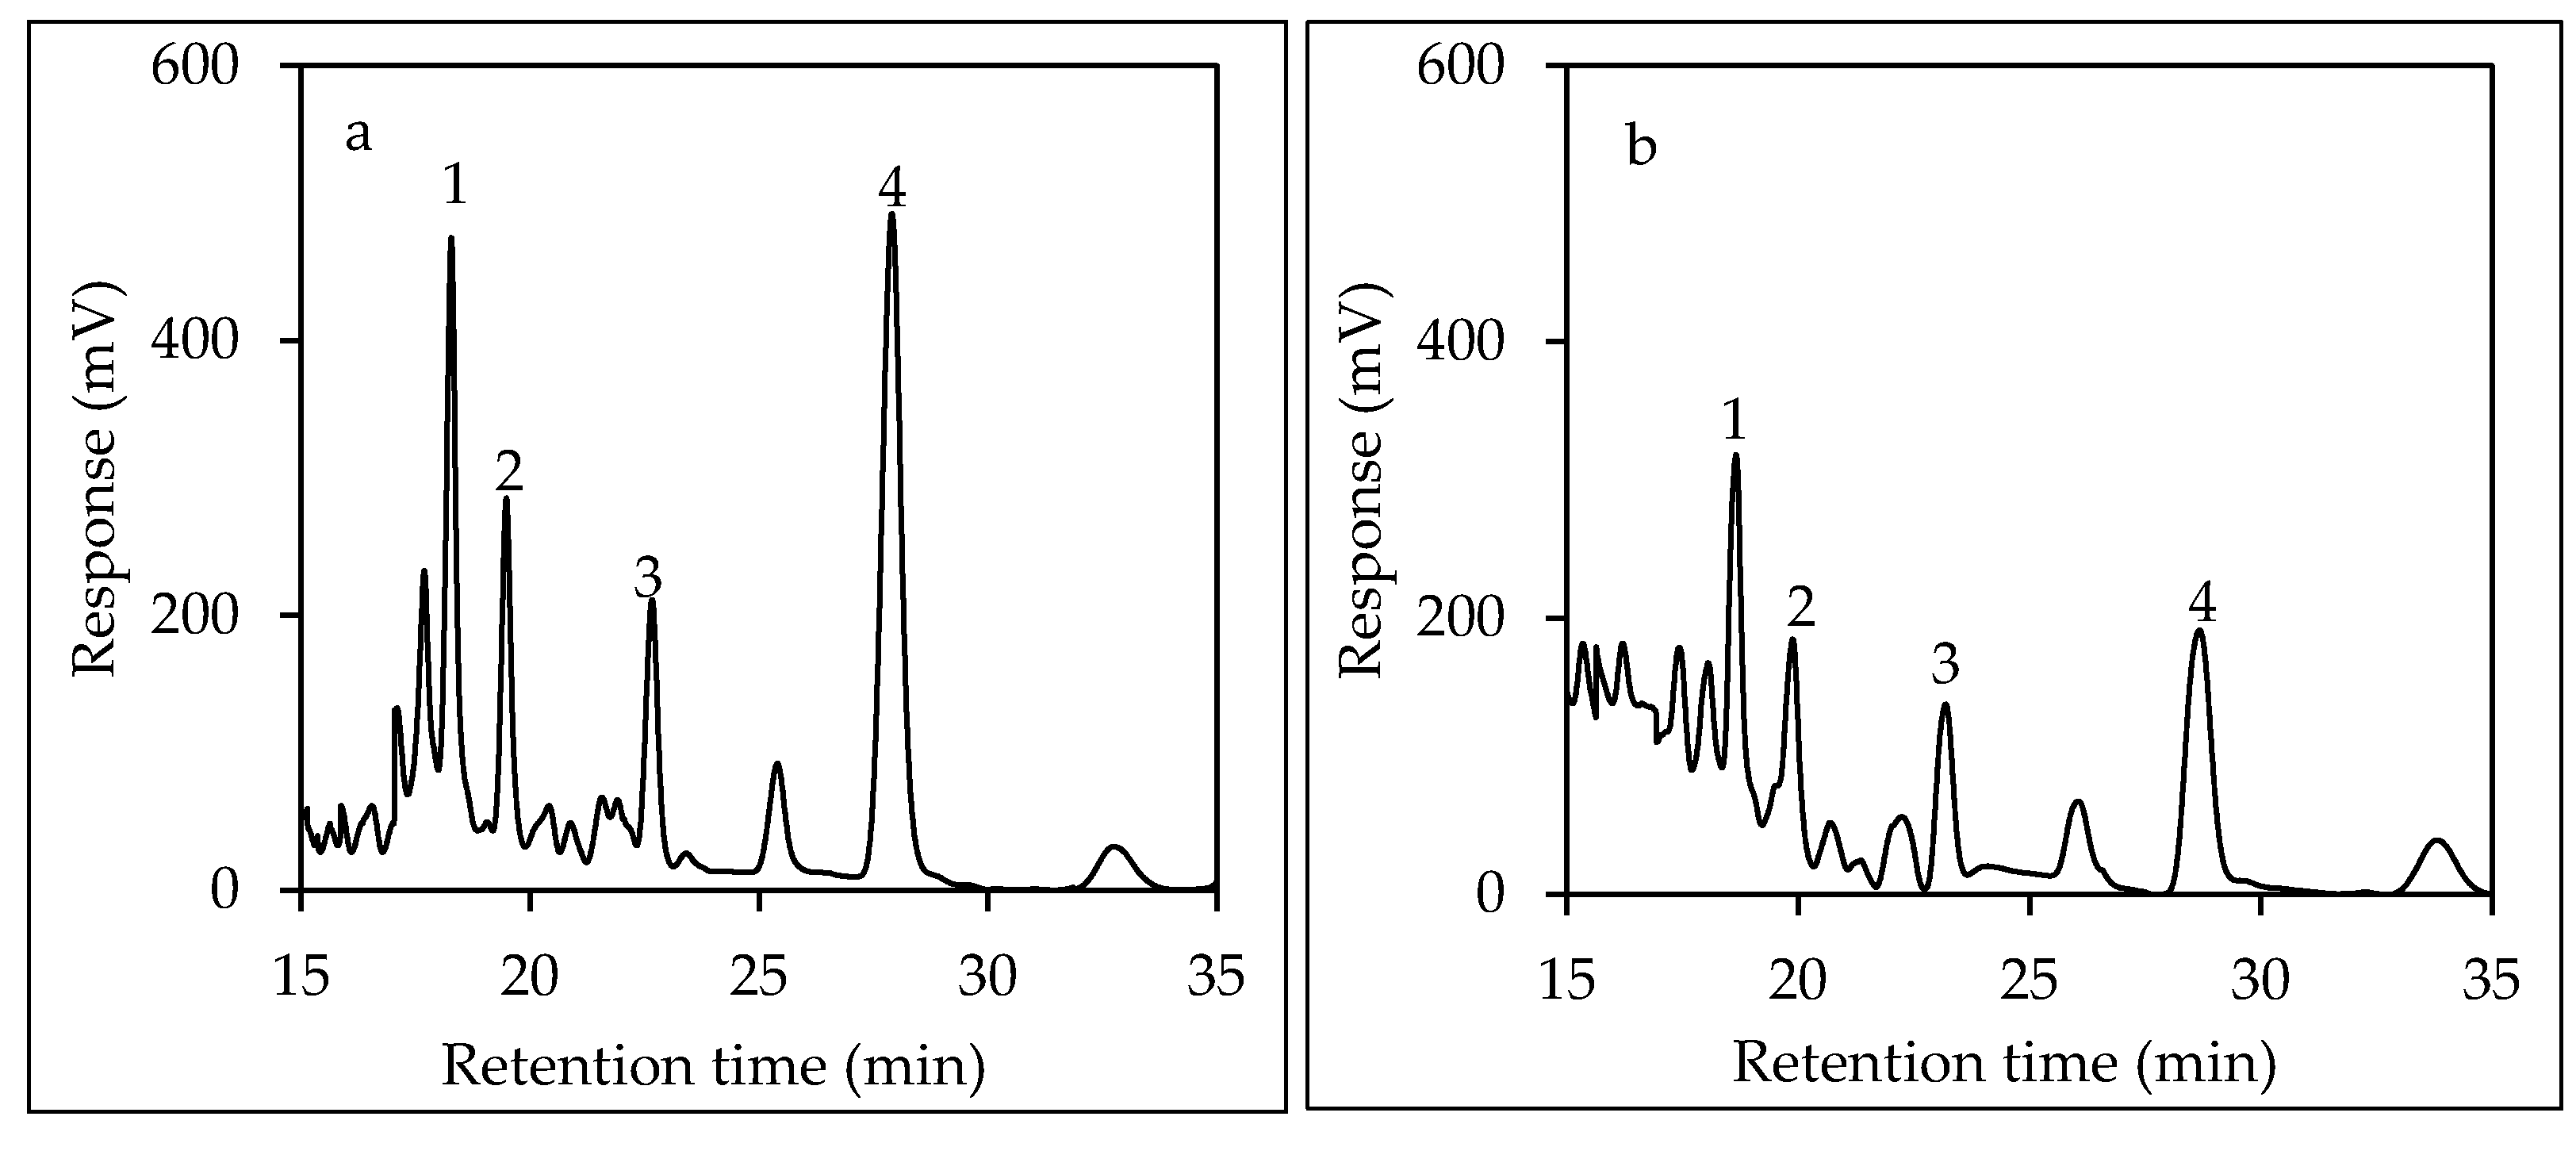
Values of the validation parameters (Table 2) allowed for approval to use the method for determining benzo(a)pyrene and sum of the four PAHs in tea. Chromatogram profiles of the determined PAHs in black and white teas are presented in Figure 3a,b, respectively.
The benzo(a)pyrene, benz(a)anthracene, benzo(b)fluoranthene and chrysene concentration values given in Table 3 were corrected for the recoveries obtained for each of the measurement series, in accordance with the requirements of the Commission Regulation (EU) 836/2011 [30]. The recovery values were within the ranges of 51–82%, 66–93%, 55–75% and 64–111% for benzo(a)pyrene, benz(a)anthracene, benzo(b)fluoranthene and chrysene, respectively.
The tea samples contained the four PAHs in the amount exceeding the respective values of LOQ. The lowest amounts of the analysed PAHs (0.76 ± 0.15 μg/kg of BaP and 5.51 ± 1.10 μg/kg of Σ4PAHs) were found in the Rainforest Alliance Certified™ white tea, while the highest ones were found in Assam Indian (209 ± 42 μg/kg of BaP and 756 ± 151 μg/kg of Σ4PAHs) and Yunnan China (158 ± 32 μg/kg of BaP and 770 ± 154 μg/kg of Σ4PAHs) black leaf teas from the same manufacturer/distributor. According to the information on the packaging these products were mixtures of black teas.
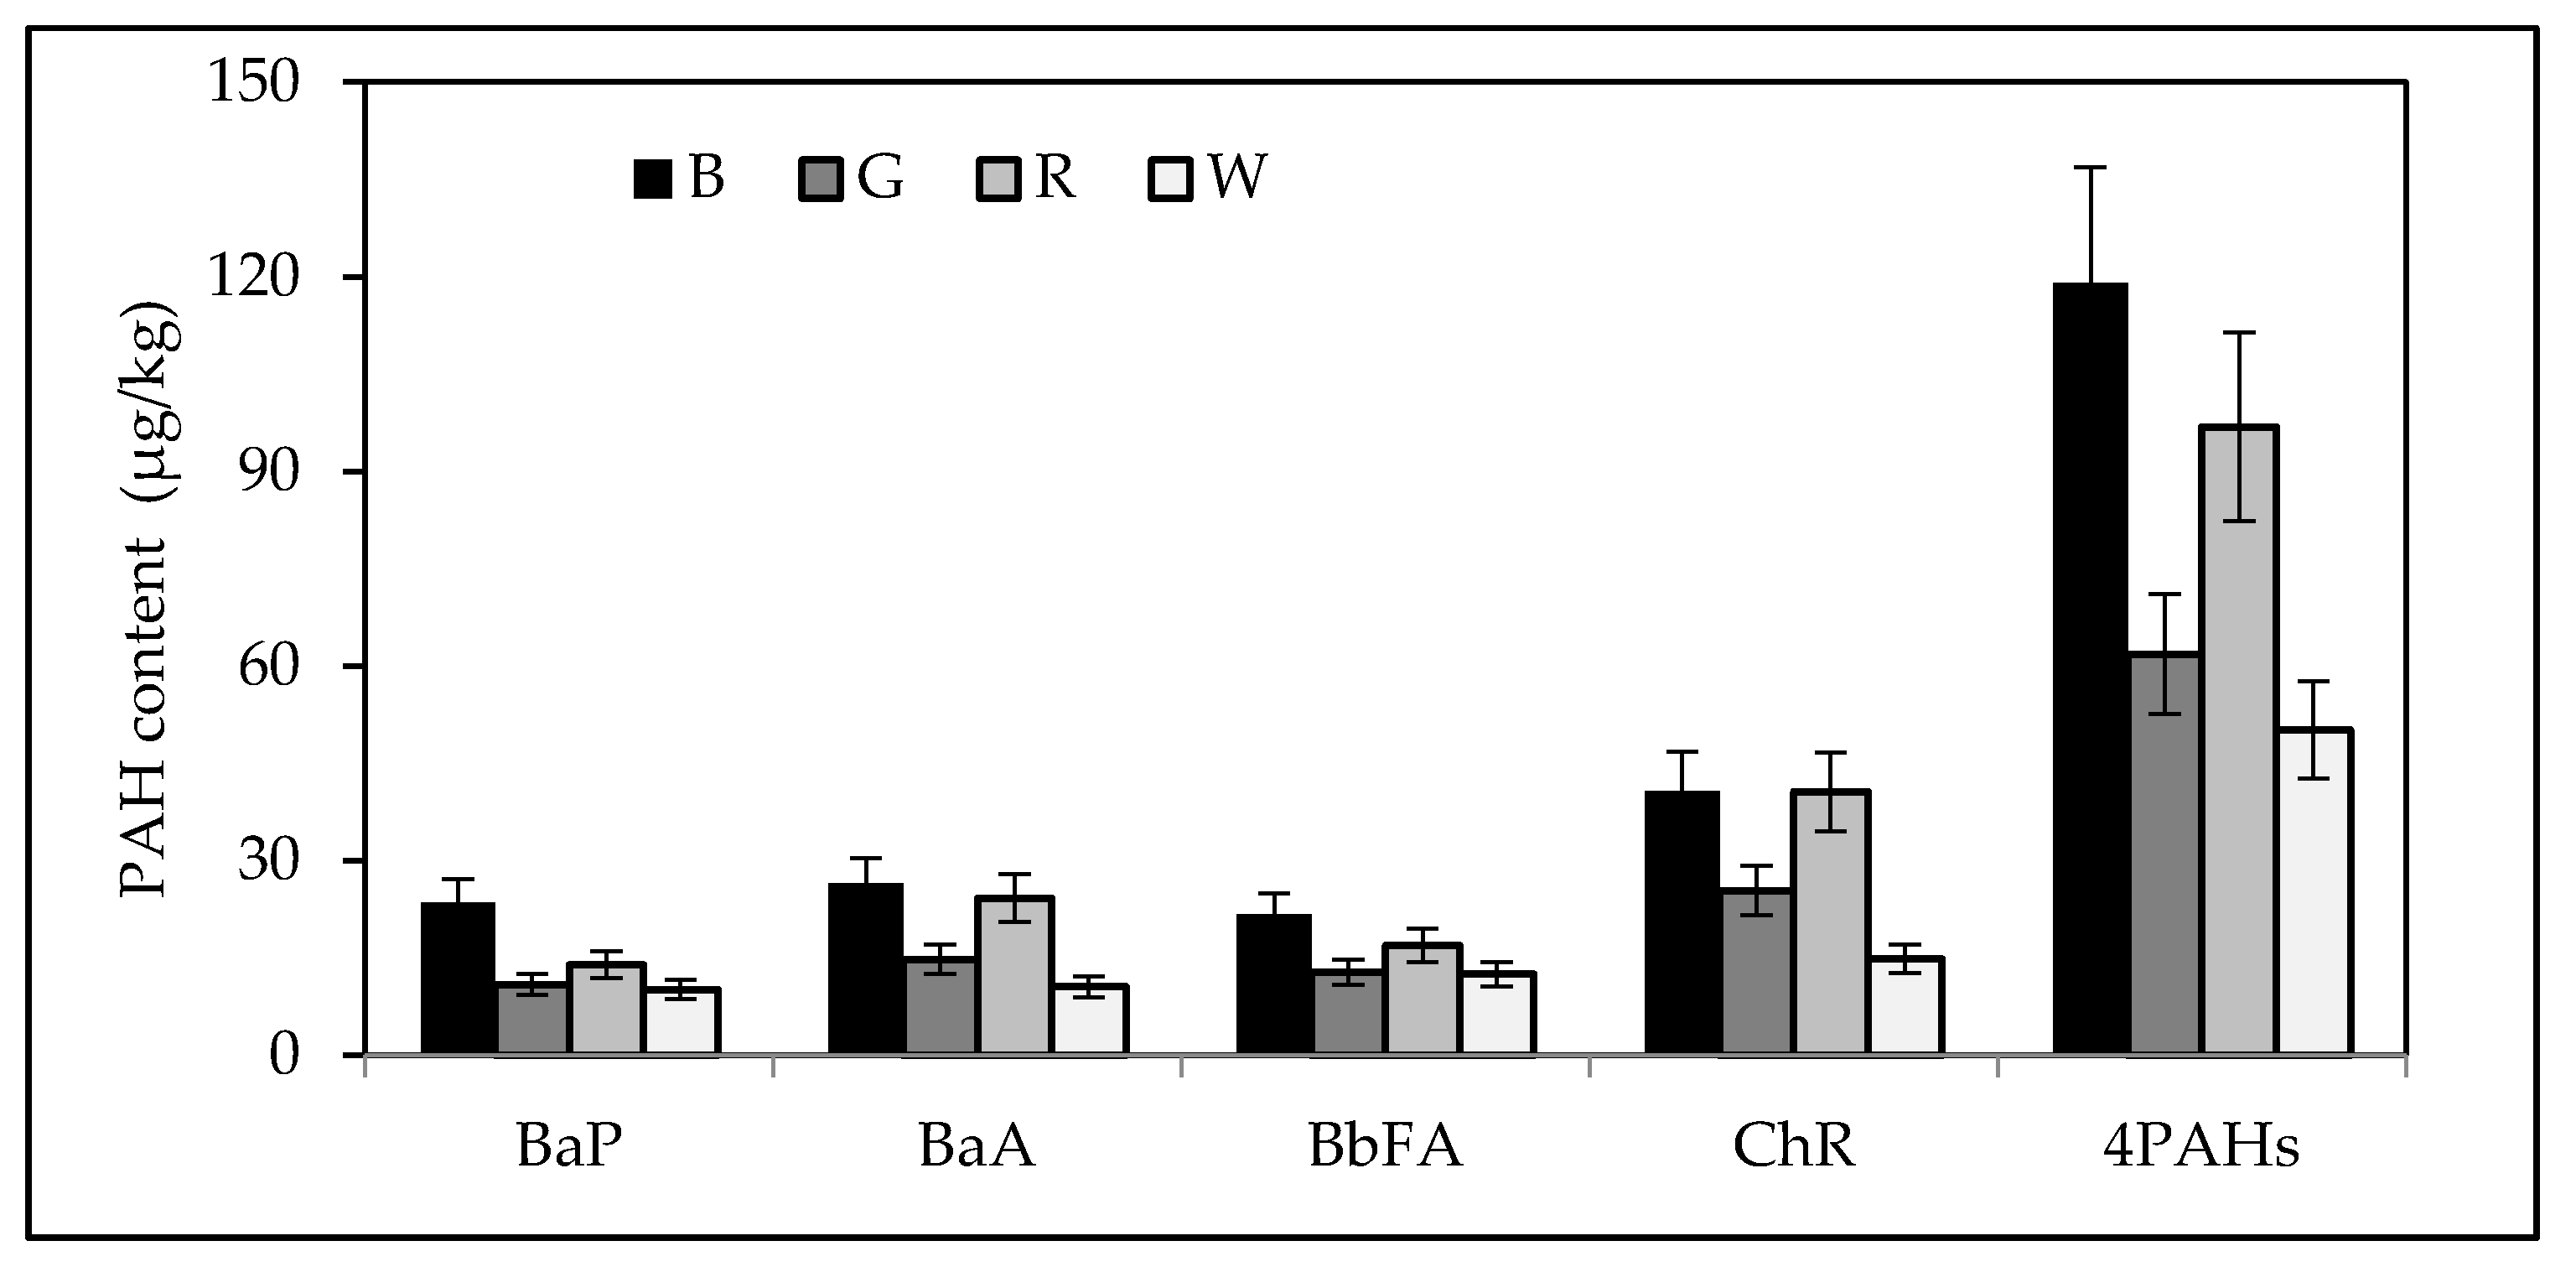
The sum of the four PAHs in black and red teas (119 μg/kg and 97 μg/kg, respectively, expressed as median) were higher than in green and white teas (61.8 μg/kg and 50.1 μg/kg, respectively) (Figure 4). No significant differences were found in benz(a)anthracene, benzo(b)fluoranthene and chrysene contents (expressed as median) between black and red tea samples. The median benzo(a)pyrene content of black tea (23.5 μg/kg) was significantly higher than in green, red and white teas (10.9 μg/kg, 13.9 μg/kg and 10.1 μg/kg, respectively) (Figure 4). For all the tested tea samples, there were large differences between the lowest and the highest PAHs concentrations, in accordance with the results of recent studies (Table 4). The PAH contamination level of teas from the Czech market determined by Drabova et al. [4] was similar to that found in the present study; maximum BaP and Σ4PAHs contents of black tea amounted to 152 μg/kg and 699 μg/kg, respectively. High levels of PAHs in black teas were also reported by Lin and Zhu [7], Iwegbue et al. [31], Lin et al. [32] and Londoño et al. [33] (Table 4). Available literature data indicate that both in EU and in non-EU countries teas with very different levels of polycyclic aromatic hydrocarbons are sold (Table 4). Lin and Zhu [7] analysed tea leaves of each of the processing stages (i.e., before wilting, after wilting, after rolling, after fermentation and after drying) as well as the air above the drying tea leaves in terms of PAH content. The level of the dryer air pollution with polycyclic aromatic hydrocarbons was about one hundred times higher than this of the outdoor air [7]. It was found that large amounts of PAHs in the air resulted from its heating by the burning of pine wood. The PAHs were then consequently absorbed by the tea leaves. The median values of BaA for black and red tea did not differ significantly. There were also no significant differences in median BaFA, Chr and Σ4PAHs contents between black and red tea samples (Figure 4). The level of contamination of tea with PAH compounds reported by Londoño et al. [33] for red tea sold in Argentina, as well as the BaP content of red tea from the Polish market reported by Ciemniak and Mocek [34] do not differ significantly from the results of the present study. On the other hand, the BaP, BbFA and Chr contents determined by Sadowska-Rociek et al. [21] in different types of tea (Table 4) were significantly lower than these of our study.
The level of contamination of both green and white tea with PAHs was significantly lower than that of black tea; this is in accordance with the reports of other researchers (Table 4). The determined BaP content of green tea (4.3–24.8 μg/kg) is similar to that of Drabova et al. [4], Ziegenhals et al. [10] and Ciemniak and Mocek [34] (Table 4). On the other hand, markedly higher amounts of PAHs were determined by Londoño et al. [33] in tea samples from Argentina. The high levels of contamination of some white teas with PAHs may be due to their different processing as compared to the other types of tea. Tea buds are harvested in early spring, when high PAHs concentrations are possible due to emission sources of the heating season. Moreover, at the beginning of the growing season the young tea leaves contain the highest amount of the lipophilic essential oils which facilitate the absorption of PAHs [35].
3.2. PAH Content of Tea Infusion
Prior to determining the BaP, BaA, BbFA and Chr content in tea infusions, the validation parameters of the method were tested. For each of the studied compounds, the limit of detection (LOD), the limit of quantification (LOQ), the recovery and the repeatability were determined (Table 5).
Due to low levels of the PAHs expected in tea infusions, the enrichment of the latter with a mixture of BaP, BaA, BbFA and Chr was performed at the lowest possible concentration level. It was found that it is possible to determine the four PAHs in tea infusions containing no more than 0.15 ng/mL, 0.15 ng/mL, 0.10 ng/mL and 0.15 ng/mL or BaP, BaA, BbFA and Chr, respectively (Table 5).
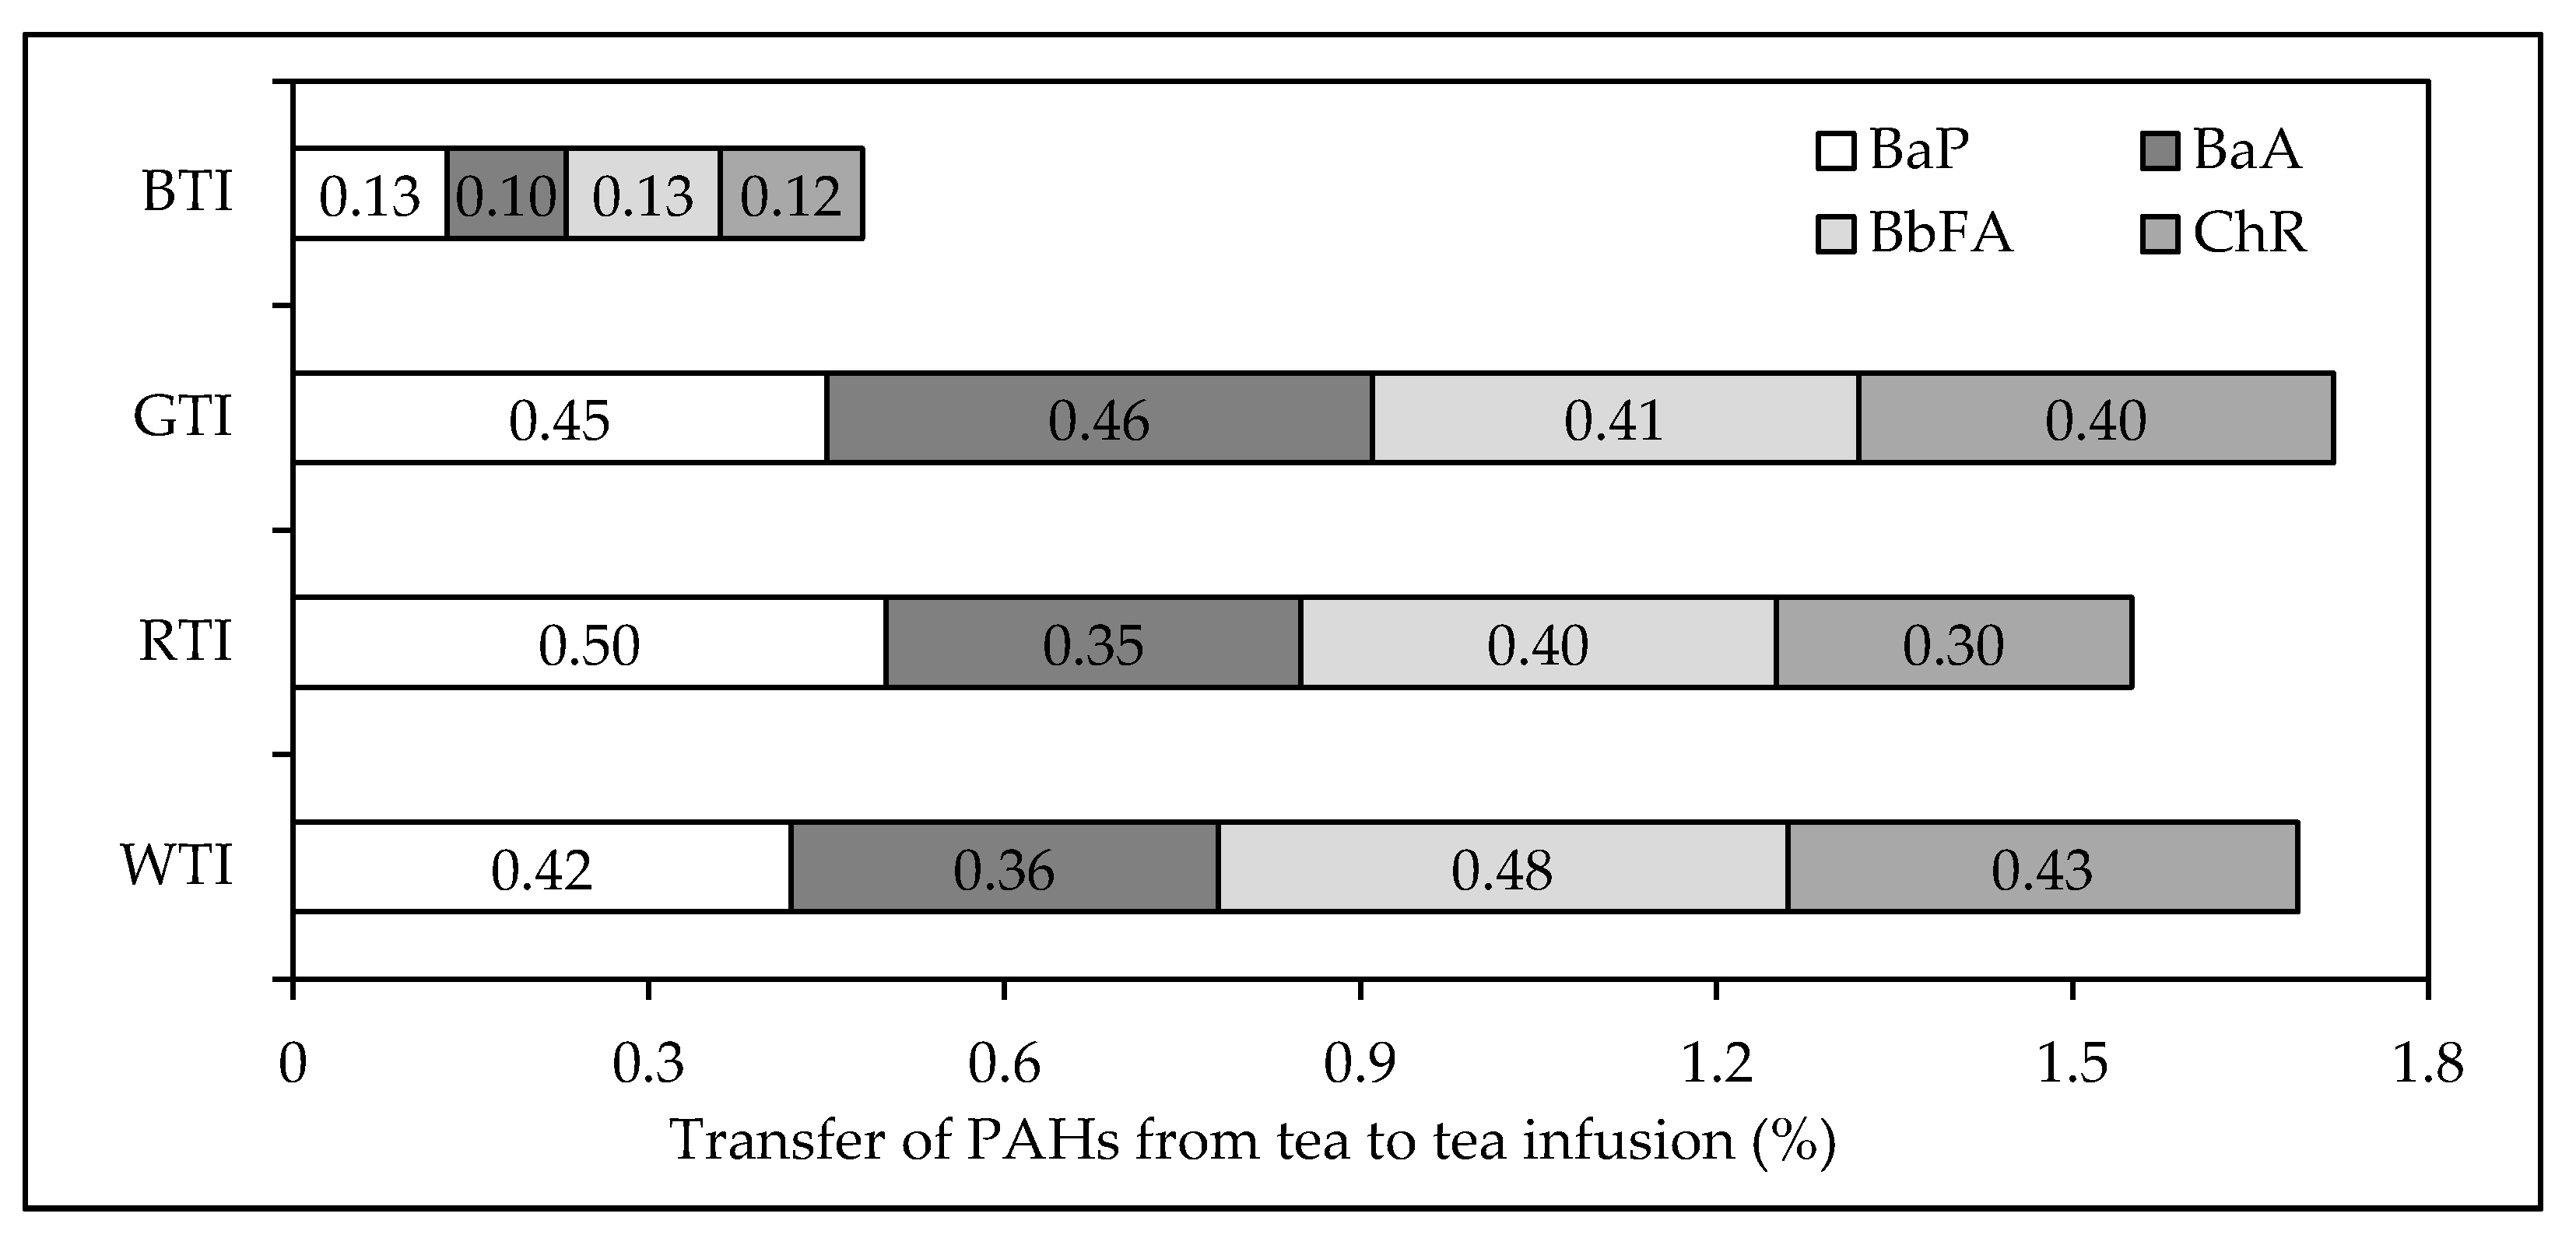
Determination of PAHs in 28 tea infusions was performed according to the procedure presented in Figure 1. PAH contents above LOQ were found only in two black tea infusion samples, two green tea infusion samples, one red tea infusion sample and three white tea infusion samples. For these samples the transfer of the four PAHs from tea to tea infusion was calculated. The percentage transfer of sum of the four PAHs from tea to tea infusion for red, white and green tea samples were found to be similar to each other (1.55%, 1.69% and 1.72%, respectively), while for black tea samples it was significantly lower (0.48%) (Figure 5). Duedahl-Olesen et al. [36] have found the presence of the four PAHs in 55% of the analysed black tea samples. They reported that the maximum level of transfer of sum of the four PAHs amounted to 2.3%, with its mean value of 0.86%. Lin et al. [6] reported, in turn, that the percentage transfer of BaP from China black tea of 246 μg BaP/kg to tea infusion was 0.39%. Lin et al. [6] found that tea variety, tea/water ratio and brewing time affect transfer of 12 polycyclic aromatic hydrocarbons from tea to tea infusion. Moreover, they reported that washing tea immediately before brewing as well as brewing the tea within uncovered cup reduced the percentage transfer of the PAHs up to 30%. It was also found that significantly more polycyclic aromatic hydrocarbons of from two to four aromatic rings are transferred from tea to tea infusion than these of five or six aromatic rings. This phenomenon can result from lower water solubility of PAHs with higher molecular weights. Viñas et al. [37] reported the presence of PAH compounds with two or three aromatic rings in white, green and red tea infusions, while benzo(a)pyrene, benz(a)anthracene, benzo(b)fluoranthene and chrysene were not found. Similarly, BaA and Chr were not detected in tea infusions prepared from black, green and red tea available on the Spain market [38]. Schulz et al. [39] detected BaP and BbFA in the amounts of 0.009 μg/L and 0.006 μg/L, respectively, only in one tea infusion prepared from black tea purchased on the German market. The BaP contents of tea infusions reported by Ciemniak and Mocek [34] were from 0.4 ng/L to 18.7 ng/L for 2.9–63.1 μg of BaP per one kilogram of dried black, green, red and white teas available on the Polish retail market. Maximum BaA, BbFA and Chr contents in these tea infusions were 32.7 ng/L, 17.6 ng/L and 36.4 ng/L, respectively.
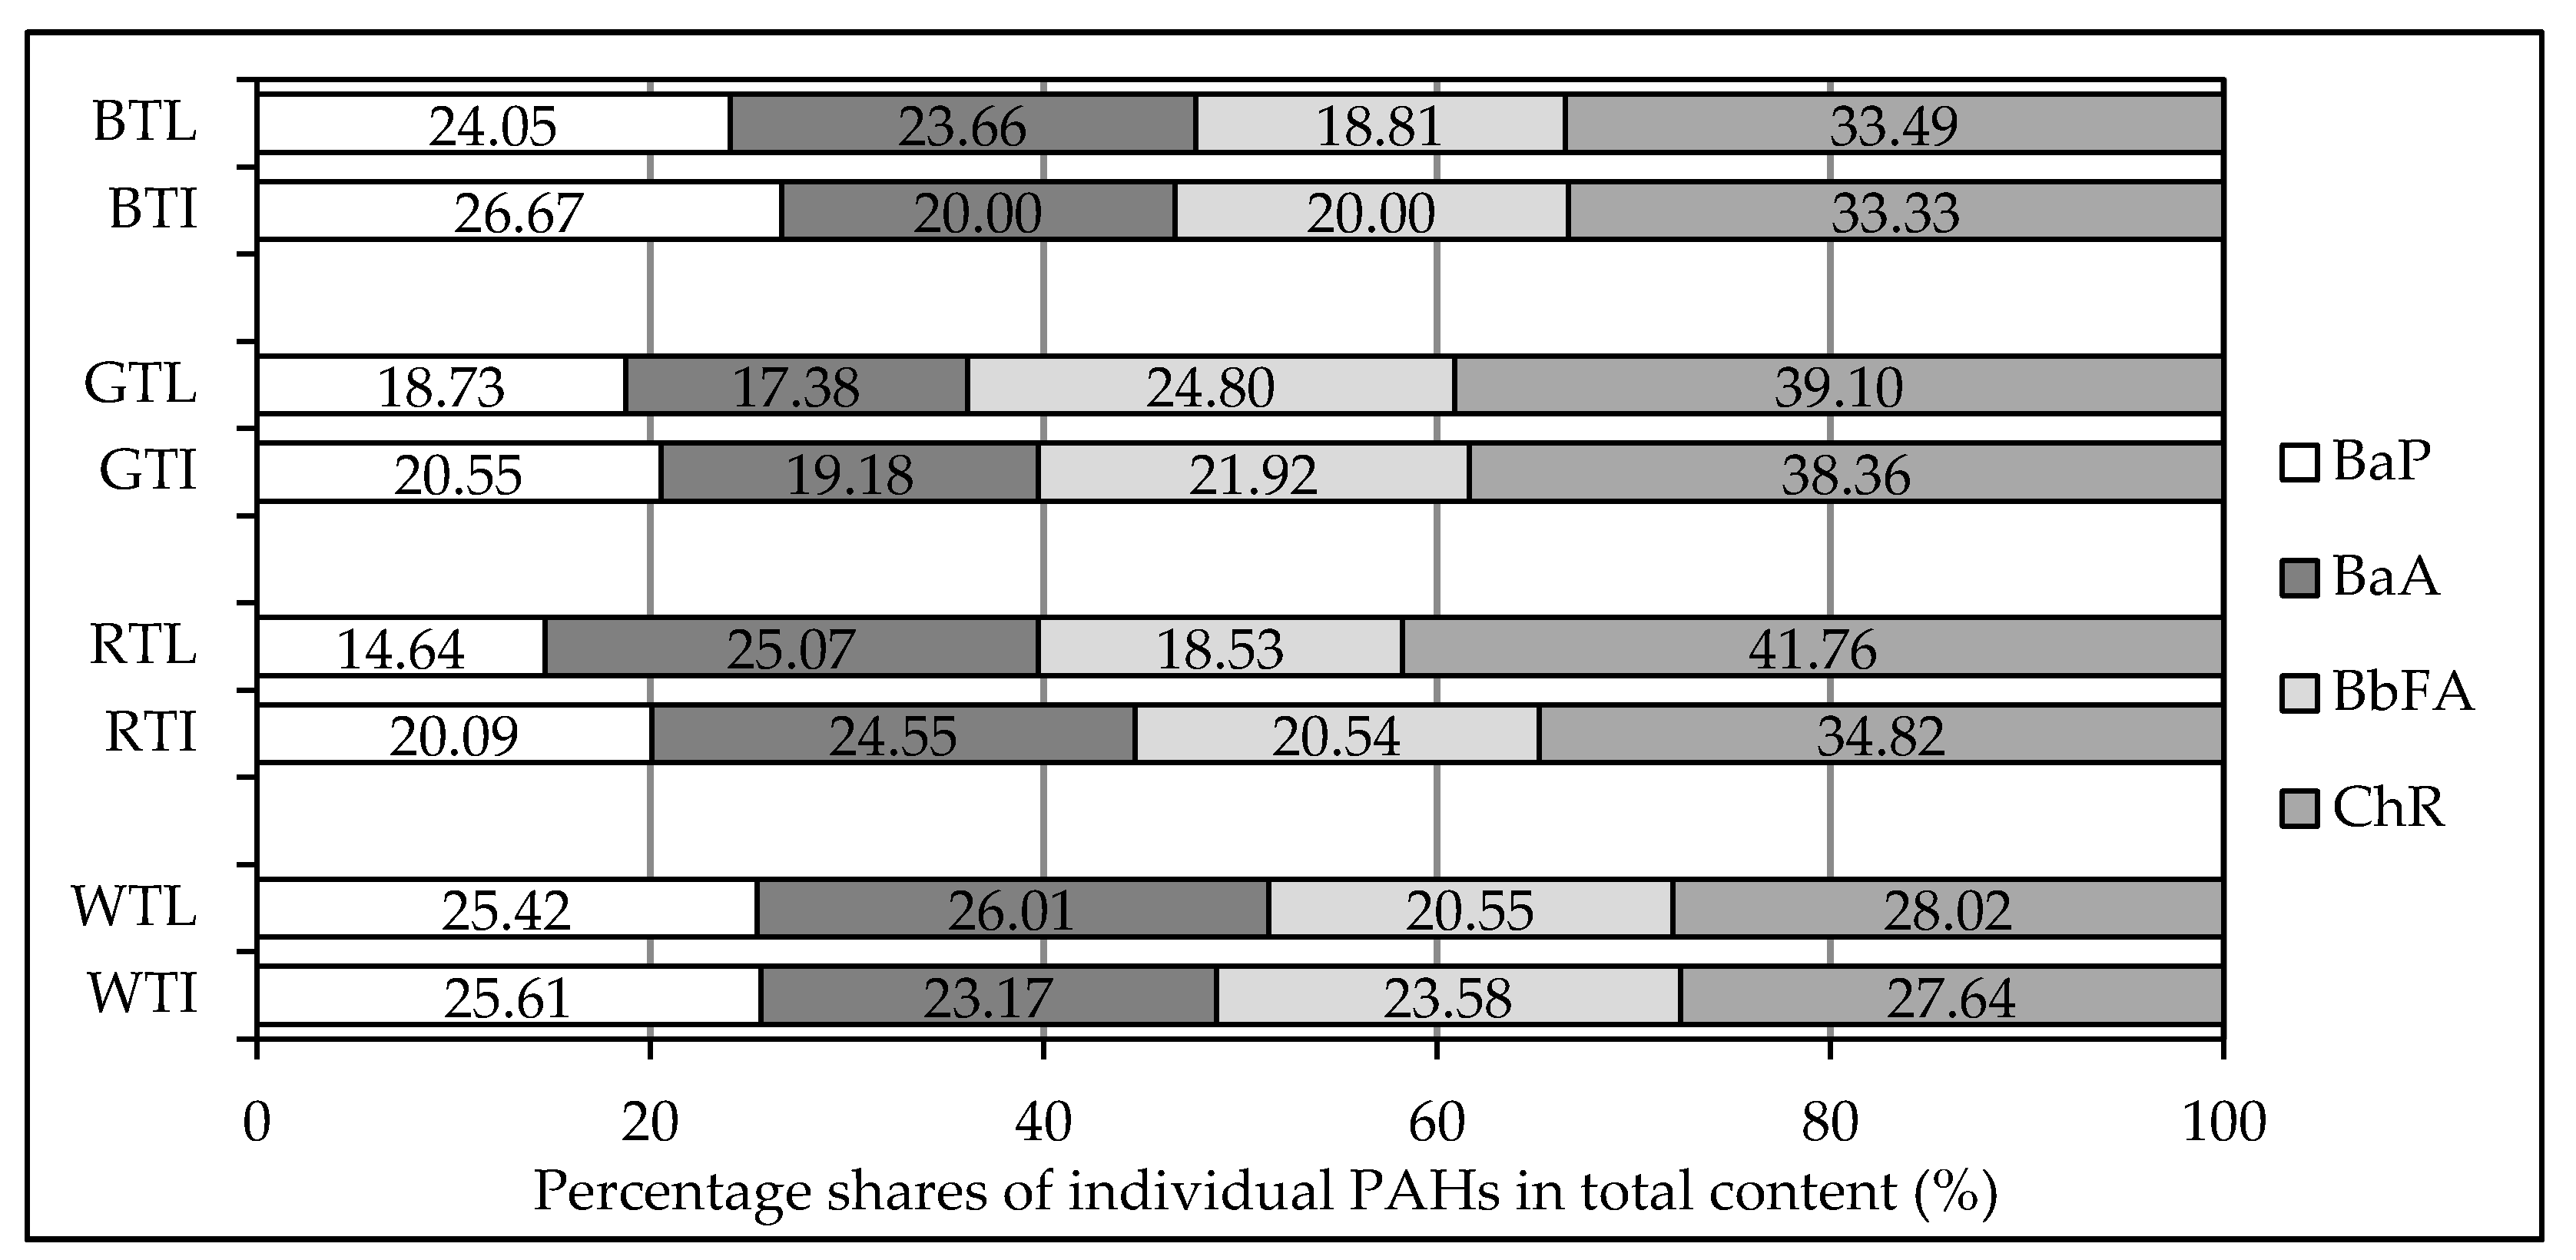
Figure 6 shows the percentage share of individual PAHs in their sum, both for tea leaves and tea infusions. The presented data show that the dominant compound in both tea leaves and tea infusions is chrysene. Its share ranges from 28%, in the case of white tea leaves, to almost 42% in red tea leaves. In the case of tea infusions, the lowest share of chrysene was found for white tea, while the highest one was found for green tea. Noteworthy also is the percentage share of benzo(a)pyrene, which had been a marker of the occurrence of PAH in food for many years. In the case of both black and white tea leaves and infusions, BaP’s share amounted to about 25%; however, in other tea varieties, it was about 20% and below. The lowest share of BaP was found for red tea leaves and infusion (Figure 6).
4. Conclusions
The QuEChERS technique used for the extraction and purification of tea samples for the determination of benzo(a)pyrene, benz(a)anthracene, benzo(b)fluoranthene and chrysene may be successfully used after optimization and validation of the method. Teas commercially available on the Polish market are characterized by great diversity in terms of contamination with polycyclic aromatic hydrocarbons. The highest concentrations of BaP and Σ4PAHs—209.4 ± 41.9 μg/kg and 755.5 ± 151.1 μg/kg, respectively—were found for black leaf tea. The transfer of sum of the four PAHs from tea to tea infusion was 0.48% and 1.55–1.72% for black tea and for red, white and green teas, respectively.
Acknowledgments
The authors thank MSc Katarzyna Grudzień and MSc Elżbieta Nowak for technical assistance in carrying out the analyses.
Author Contributions
Alicja Zachara designed the study, performed collecting data and interpreted the results. Alicja Zachara and Dorota Gałkowska drafted the manuscript. Lesław Juszczak supervised the study and revised the manuscript. All authors read, commented on and approved the final manuscript.
Conflicts of Interest
The authors declare no conflict of interest.
References
- Plust, D.; Czerniejewska-Surma, B.; Domiszewski, Z.; Bienkiewicz, G.; Subda, R.; Wesołowski, T. Quality of selected white tea types. Food Sci. Qual. Technol. 2011, 3, 90–97. [Google Scholar] [CrossRef]
- Ishizaki, A.; Sito, K.; Kataoka, H. Analysis of contaminant polycyclic aromatic hydrocarbons in tea products and crude drugs. Anal. Methods 2011, 3, 299–305. [Google Scholar] [CrossRef]
- Rey-Salgueiro, L.; Martínez-Carballo, E.; García-Falcón, M.S.; Simal-Gándara, J. Effects of a chemical company fire on the occurrence of polycyclic aromatic hydrocarbons in plant foods. Food Chem. 2008, 108, 347–353. [Google Scholar] [CrossRef]
- Drabova, L.; Pulkrabova, J.; Kalachova, K.; Tomaniova, M.; Kocourek, V.; Hajslova, J. Rapid determination of polycyclic aromatic hydrocarbons (PAHs) in tea using two-dimensional gas chromatography coupled with time of flight mass spectrometry. Talanta 2012, 100, 207–216. [Google Scholar] [CrossRef] [PubMed]
- Jánská, M.; Hajslová, J.; Tomaniová, M.; Kocourek, V.; Vávrová, M. Polycyclic aromatic hydrocarbons in fruits and vegetables grown in the Czech Republic. Bull. Environ. Contam. Toxicol. 2006, 77, 492–499. [Google Scholar] [CrossRef] [PubMed]
- Lin, D.; Zhu, L.; Luo, L. Factors affecting transfer of polycyclic aromatic hydrocarbons from made tea to tea infusion. J. Agric. Food Chem. 2006, 54, 4350–4354. [Google Scholar] [CrossRef] [PubMed]
- Lin, D.; Zhu, L. Polycyclic aromatic hydrocarbons: Pollution and source analysis of a black tea. J. Agric. Food Chem. 2004, 52, 8268–8271. [Google Scholar] [CrossRef] [PubMed]
- Lin, D.; Zhu, L.; He, W.; Tu, Y. Tea plant uptake and translocation of polycyclic aromatic hydrocarbons from water and around air. J. Agric. Food Chem. 2006, 54, 3658–3662. [Google Scholar] [CrossRef] [PubMed]
- Pincemaille, J.; Schummer, C.; Heinen, E.; Moris, G. Determination of polycyclic aromatic hydrocarbons in smoked and non-smoked black teas and tea infusions. Food Chem. 2014, 145, 807–813. [Google Scholar] [CrossRef] [PubMed]
- Ziegenhals, K.; Jira, W.; Speer, K. Polycyclic aromatic hydrocarbons (PAH) in various types of tea. Eur. Food Res. Technol. 2008, 228, 83–91. [Google Scholar] [CrossRef]
- European Food Safety Authority. Polycyclic aromatic hydrocarbons in food—Scientific Opinion of the Panel on Contaminants in the Food Chain (Question N° EFSA-Q-2007-136). EFSA J. 2008, 724, 1–114. [Google Scholar]
- Garcı́a-Falcón, M.S.; Simal-Gándara, J. Determination of polycyclic aromatic hydrocarbons in alcoholic drinks and identification of their potential sources. Food Addit. Contam. 2005, 22, 791–797. [Google Scholar] [CrossRef] [PubMed]
- World Health Organization, International Agency for Research on Cancer. Monographs on the Evaluation of Carcinogenic Risks to Humans. Some Non-Heterocyclic Polycyclic Aromatic Hydrocarbons and Some Related Exposures; IARC: Lyon, France, 2010; Volume 92. [Google Scholar]
- Olatunji, O.S.; Fatoki, O.S.; Opeolu, B.O.; Ximba, B.J. Benzo[a]pyrene and benzo[k]fluoranthene in some processed fish and fish products. Int. J. Environ. Res. Public Health 2015, 12, 940–951. [Google Scholar] [CrossRef] [PubMed]
- Nowak, A.; Libudzisz, Z. Carcinogens in human gastrointestinal tract. Food Sci. Technol. Qual. 2008, 4, 9–25. [Google Scholar]
- Official Journal of the European Union. Commission Regulation (EU) 2015/1125 of 10 July 2015 amending Regulation (EC) No 1881/2006 as regards maximum levels for polycyclic aromatic hydrocarbons in Katsuobushi (dried bonito) and certain smoked Baltic herring. Off. J. Eur. Union 2015, L 184, 7–10. [Google Scholar]
- Official Journal of the European Union. Commission Regulation (EU) 2015/1933 of 27 October 2015 amending Regulation (EC) No 1881/2006 as regards maximum levels for polycyclic aromatic hydrocarbons in cocoa fibre, banana chips, food supplements, dried herbs and dried spices. Off. J. Eur. Union 2015, L 282, 11–13. [Google Scholar]
- EFSA A Report from the Unit of Data Collection and Exposure on a Request from the European Commission Findings of the EFSA Data Collection on Polycyclic Aromatic Hydrocarbons in Food. First Issued on 29 June 2007 and Revised on 31 July 2008. Available online: http://www.efsa.europa.eu/en/scdocs/doc/33r.pdf (accessed on 25 April 2016).
- Zachara, A.; Juszczak, L. Food contamination by polycyclic aromatic hydrocarbons—Legal requirements and monitoring. Food Sci. Technol. Qual. 2016, 3, 5–20. [Google Scholar] [CrossRef]
- Garcı́a-Falcón, M.S.; Cancho-Grande, B.; Simal-Gándara, J. Minimal clean-up and rapid determination of polycyclic aromatic hydrocarbons in instant coffee. Food Chem. 2005, 90, 643–647. [Google Scholar] [CrossRef]
- Sadowska-Rociek, A.; Surma, M.; Cieślik, E. Comparison of different modifications on QuEChERS sample preparation method for PAHs determination in black, green, red and white tea. Environ. Sci. Pollut. Res. Int. 2014, 21, 1326–1338. [Google Scholar] [CrossRef] [PubMed]
- Wenzl, T.; Simon, R.; Anklan, E.; Kleiner, J. Analytical methods of polycyclic aromatic hydrocarbons (PAHs) in food and the environment needed for new food legislation in the European Union. Trends Anal. Chem. 2006, 26, 716–725. [Google Scholar] [CrossRef]
- Zelinkova, Z.; Wenzl, T. The occurrence of 16 EPA PAHs in food—A review. Polycycl. Aromat. Compd. 2015, 35, 248–284. [Google Scholar] [CrossRef] [PubMed]
- González-Curbelo, M.Á.; Socas-Rodríguez, B.; Herrera-Herrera, A.V.; González-Sálamo, J.; Hernández-Borges, J.; Rodríguez-Delgado, M.Á. Evolution and applications of the QuEChERS method. Trends Anal. Chem. 2015, 71, 169–185. [Google Scholar] [CrossRef]
- Magnusson, B.; Örnemark, U. Eurachem Guide: The Fitness for Purpose of Analytical Methods—A Laboratory Guide to Method Validation and Related Topics, 2014. ISBN 978-91-87461-59-0. Available online: www.eurachem.org (accessed on 25 April 2016).
- Zachara, A.; Gałkowska, D.; Juszczak, L. Method validation and determination of polycyclic aromatic hydrocarbons in vegetable oils by HPLC-FLD. Food Anal. Methods 2017, 10, 1078–1086. [Google Scholar] [CrossRef]
- Cajka, T.; Sandy, C.; Bachanova, V.; Drabova, L.; Kalachova, K.; Pulkrabova, J.; Hajslova, J. Streamlining sample preparation and gas chromatography–tandem mass spectrometry analysis of multiple pesticide residues in tea. Anal. Chim. Acta 2012, 743, 51–60. [Google Scholar] [CrossRef] [PubMed]
- The Polish Committee for Standardization. Foods of Plant Origin—Determination of Pesticide Residues Using GC-MS and/or LC-MS/MS Following Acetonitrile Extraction/Partitioning and Clean-Up by Dispersive SPE-QuEChERS-Method; PN-EN 15662; The Polish Committee for Standardization: Warsaw, Poland, 2008. [Google Scholar]
- Wenzyl, T.; Haedrich, J.; Schaechtele, A.; Robouch, P.; Stroka, J. Guidance Document on the Estimation of LOD and LOQ for Measurements in the Field of Contaminants in Feed and Food; Publications Office of the European Union: Luxemburg, 2016. [Google Scholar]
- Official Journal of the European Union. Commission regulation (EU) No 836/2011 of 19 August 2011 amending regulation (EC) No 333/2007 laying down the methods of sampling and analysis for the official control of the levels of lead, cadmium, mercury, inorganic tin, 3-MCPD and benzo(a)pyrene in foodstuffs. Off. J. Eur. Union 2011, L 215, 9–16. [Google Scholar]
- Iwegbue, C.M.A.; Agadaga, H.; Bassey, F.I.; Overah, L.C.; Tesi, G.O.; Nwajei, G.E. Concentrations and profiles of polycyclic aromatic hydrocarbons in some commercial brands of tea-, coffee-, and cocoa-based food drinks in Nigeria. Int. J. Food Prop. 2015, 18, 2124–2133. [Google Scholar] [CrossRef]
- Lin, D.; Tu, Y.; Zhu, L. Concentrations and health risk of polycyclic aromatic hydrocarbons in tea. Food Chem. Toxicol. 2005, 43, 41–48. [Google Scholar] [CrossRef] [PubMed]
- Londoño, V.A.G.; Reynoso, C.M.; Resnik, S.L. Polycyclic aromatic hydrocarbons (PAHs) survey on tea (Camellia sinensis) commercialized in Argentina. Food Control 2015, 50, 31–37. [Google Scholar] [CrossRef]
- Ciemniak, A.; Mocek, K. Polycyclic aromatic hydrocarbons in tea and tea infusions. Ann. Natl. Inst. Hyg. 2010, 3, 243–248. [Google Scholar]
- Prajapati, S.K.; Tripathi, B.D. Biomonitoring seasonal variation of urban air polycyclic aromatic hydrocarbons (PAHs) using Ficus benghalensis leaves. Environ. Pollut. 2008, 151, 543–548. [Google Scholar] [CrossRef] [PubMed]
- Duedahl-Olesen, L.; Navaratnam, M.A.; Jewula, J.; Jensen, A.H. PAH in some brands of tea and coffee. Polycycl. Aromat. Compd. 2015, 35, 74–90. [Google Scholar] [CrossRef]
- Viñas, P.; Campillo, N.; Aguinaga, N.; Pérez-Cánovas, E.; Herández-Córdoba, M. Use of headspace solid-phase microextraction coupled to liquid chromatography for the analysis of polycyclic aromatic hydrocarbons in tea infusions. J. Chromatogr. A 2007, 1164, 10–17. [Google Scholar] [CrossRef] [PubMed]
- Cacho, J.I.; Campillo, N.; Viñas, P.; Hernández-Córdoba, M. Use of headspace sorptive extraction coupled to gas chromatography–mass spectrometry for the analysis of volatile polycyclic aromatic hydrocarbons in herbal infusions. J. Chromatogr. A 2014, 1356, 38–44. [Google Scholar] [CrossRef] [PubMed]
- Schulz, C.M.; Fritz, H.; Ruthenschrör, A. Occurrence of 15 + 1 EU priority polycyclic aromatic hydrocarbons (PAH) in various types of tea (Camellia sinensis) and herbal infusions. Food Addit. Contam. A 2014, 31, 1723–1735. [Google Scholar] [CrossRef] [PubMed]
Figure 1.
Procedure diagram for sample (tea and tea infusion) preparation for the determination of polycyclic aromatic hydrocarbons (PAHs) using High Performance Liquid Chromatography with fluorimetric detection (HPLC-FLD).
Figure 1.
Procedure diagram for sample (tea and tea infusion) preparation for the determination of polycyclic aromatic hydrocarbons (PAHs) using High Performance Liquid Chromatography with fluorimetric detection (HPLC-FLD).
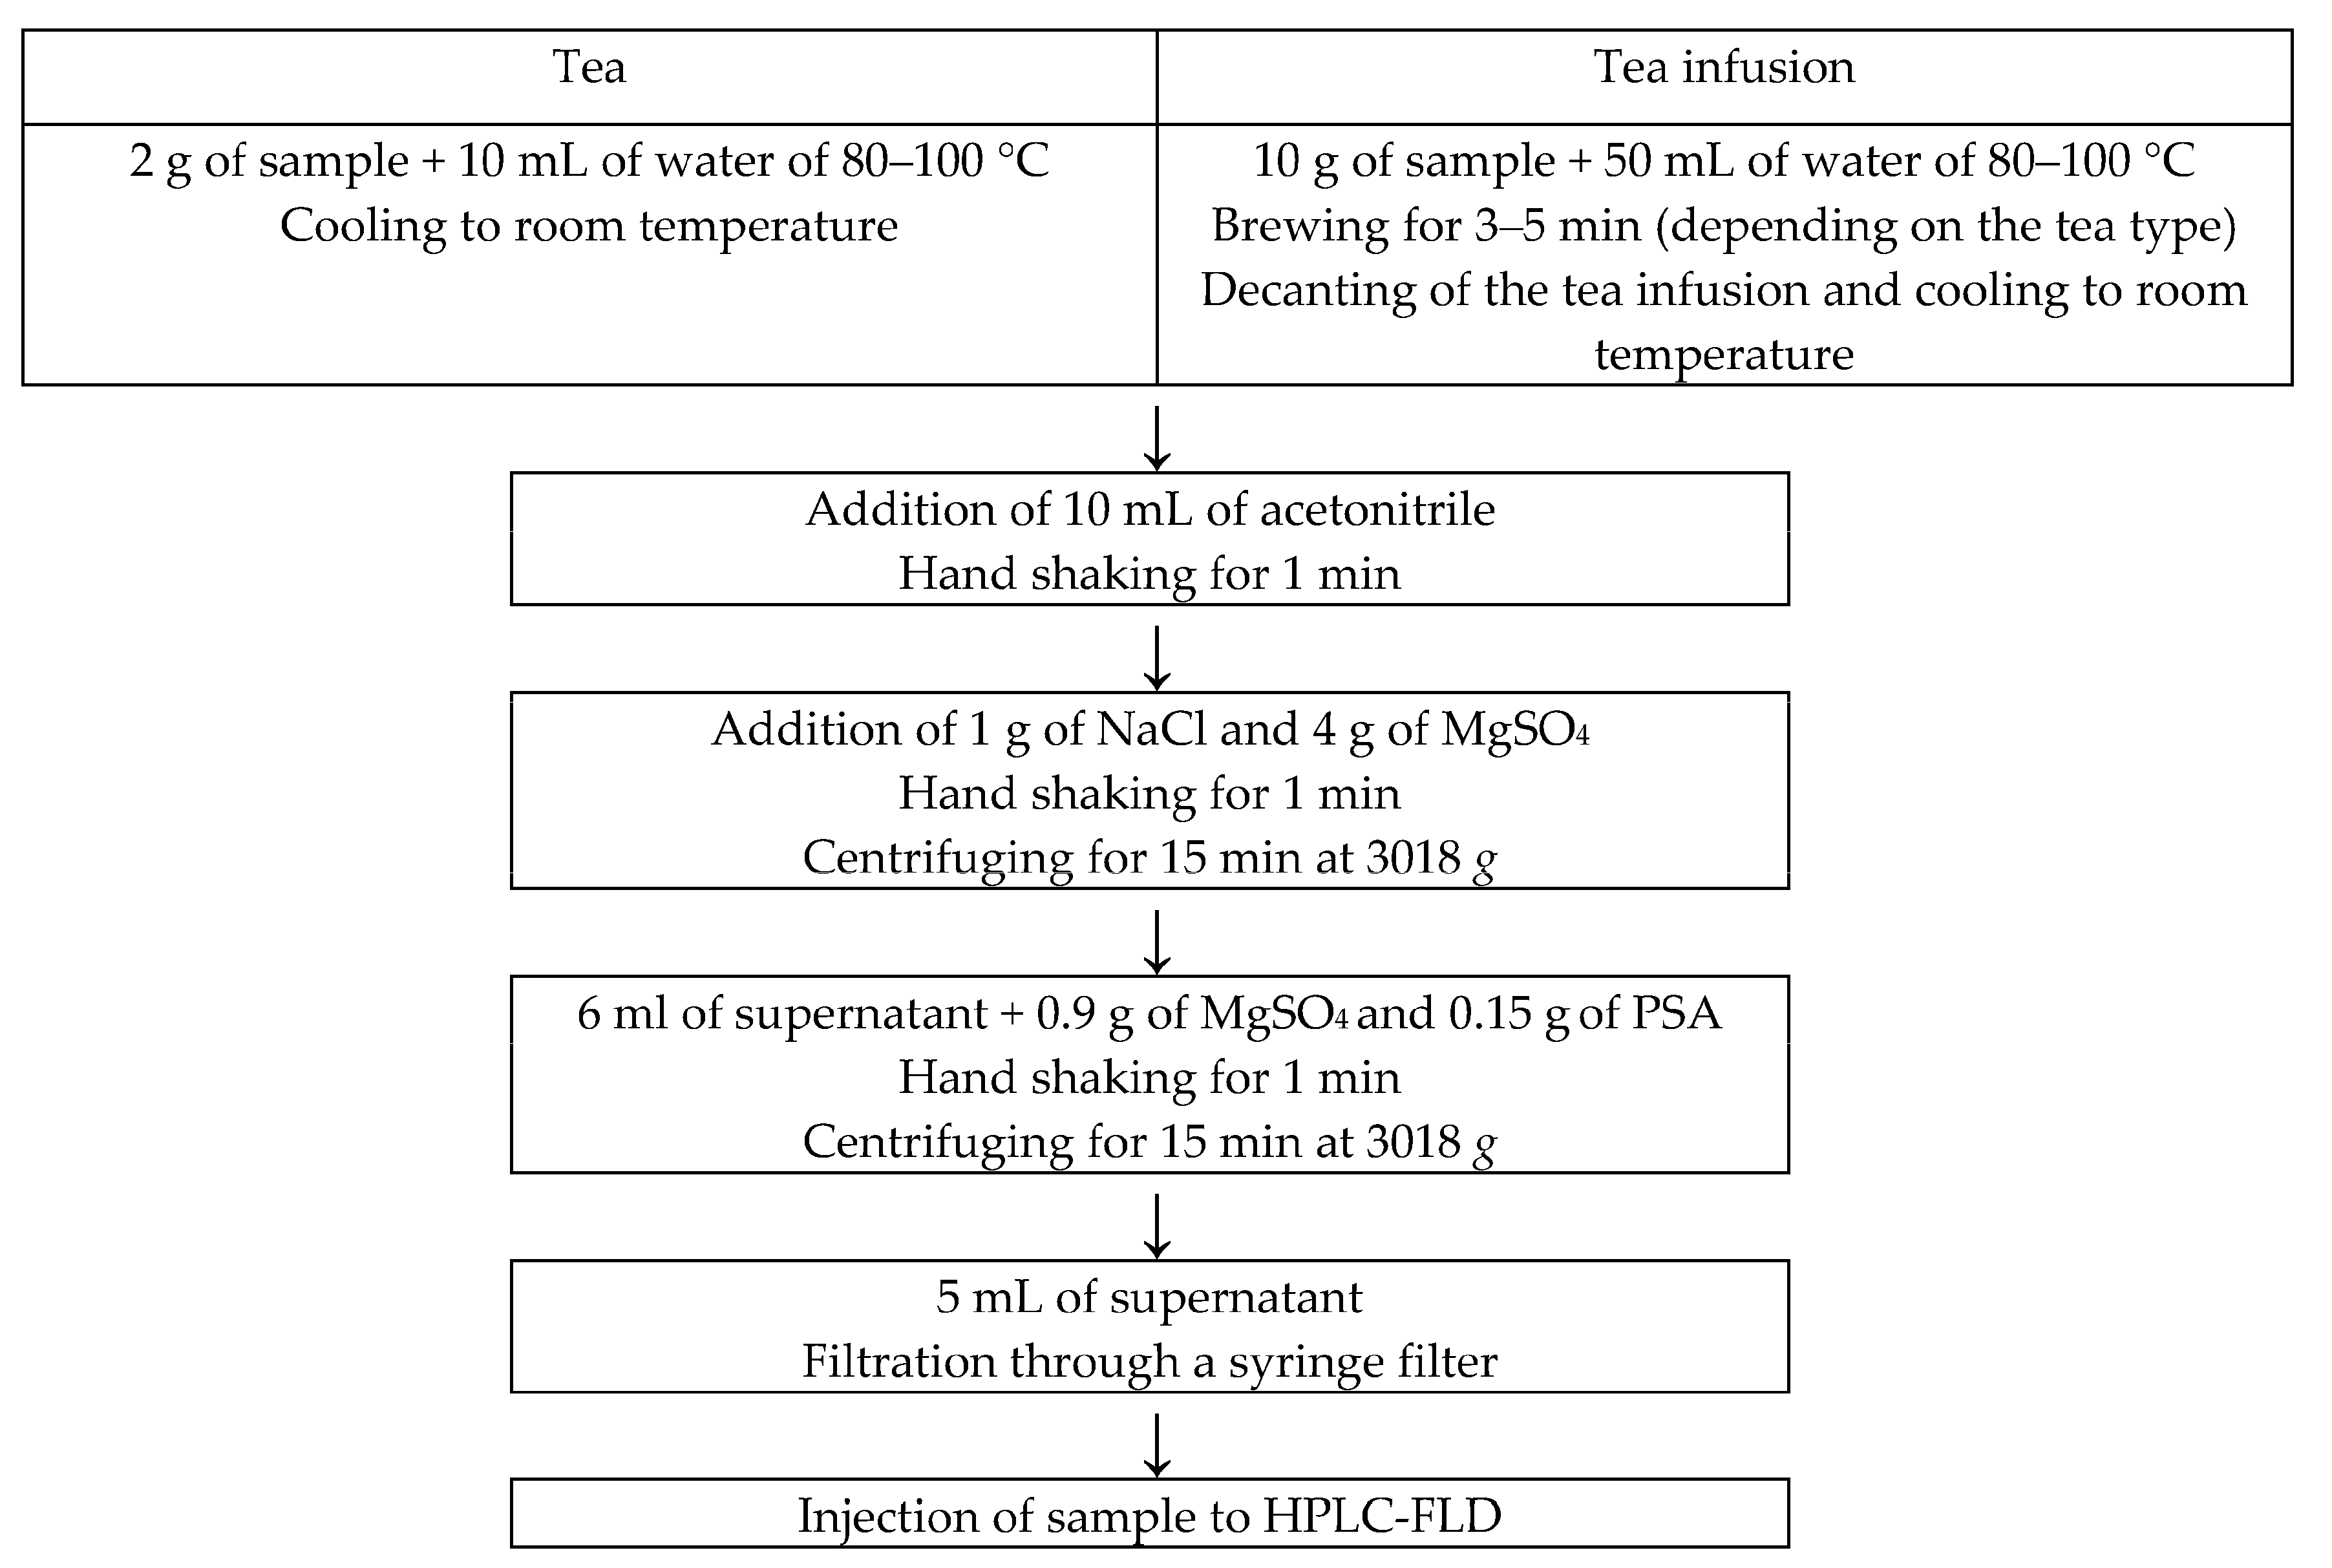
Figure 2.
PAH contents in tea as determined by HPLC-FLD after extraction and purification by Quick, Easy, Cheap, Effective, Rugged and Safe (QuEChERS) technique (method 1) and with use of glass chromatographic column packed with alumina (method 2).
Figure 2.
PAH contents in tea as determined by HPLC-FLD after extraction and purification by Quick, Easy, Cheap, Effective, Rugged and Safe (QuEChERS) technique (method 1) and with use of glass chromatographic column packed with alumina (method 2).

Figure 3.
Enlargement of raw HPLC-FLD chromatogram profile of black tea (a) and white tea (b); benz(a)anthracene (1), chrysene (2), benzo(b)fluoranthene (3), benzo(a)pyrene (4).
Figure 3.
Enlargement of raw HPLC-FLD chromatogram profile of black tea (a) and white tea (b); benz(a)anthracene (1), chrysene (2), benzo(b)fluoranthene (3), benzo(a)pyrene (4).

Figure 4.
PAH contents (median; μg/kg) of black tea (B), green tea (G), red tea (R) and white tea (W) purchased in the Polish market.
Figure 4.
PAH contents (median; μg/kg) of black tea (B), green tea (G), red tea (R) and white tea (W) purchased in the Polish market.

Figure 5.
Percentage transfer of PAHs from tea to tea infusion: BTI—black tea infusion, GTI—green tea infusion, RTI—red tea infusion, WTI—white tea infusion.
Figure 5.
Percentage transfer of PAHs from tea to tea infusion: BTI—black tea infusion, GTI—green tea infusion, RTI—red tea infusion, WTI—white tea infusion.

Figure 6.
Percentage shares of individual PAHs in total content: BTL—black tea leaves, BTI—black tea infusion, GTL—green tea leaves, GTI—green tea infusion, RTL—red tea leaves, RTI—red tea infusion, WTL—white tea leaves, WTI—white tea infusion.
Figure 6.
Percentage shares of individual PAHs in total content: BTL—black tea leaves, BTI—black tea infusion, GTL—green tea leaves, GTI—green tea infusion, RTL—red tea leaves, RTI—red tea infusion, WTL—white tea leaves, WTI—white tea infusion.


Table 1.
PAH contents of black and white tea and tea infusions depending on various tea to water ratios (evaluated to optimize the method of determination of PAHs in tea infusion).
Table 1.
PAH contents of black and white tea and tea infusions depending on various tea to water ratios (evaluated to optimize the method of determination of PAHs in tea infusion).
| Kind of PAH | PAH Content of Tea (μg/kg) | PAH Content of Tea Infusion (ng/mL) | |||
|---|---|---|---|---|---|
| Tea Weight (g)/Water Volume (mL) | |||||
| 2/250 | 20/250 | 10/100 | 10/50 | ||
| black tea | |||||
| BaP | 209 | <LOQ | <LOQ | 0.16 | 0.25 |
| BaA | 174 | <LOQ | <LOQ | 0.11 | 0.18 |
| BbFA | 142 | <LOQ | <LOQ | 0.13 | 0.19 |
| Chr | 231 | <LOQ | 0.18 | 0.20 | 0.33 |
| white tea | |||||
| BaP | 23.9 | <LOQ | <LOQ | <LOQ | 0.15 |
| BaA | 38.4 | <LOQ | <LOQ | <LOQ | 0.15 |
| BbFA | 25.6 | <LOQ | <LOQ | <LOQ | 0.11 |
| Chr | 42.7 | <LOQ | <LOQ | <LOQ | 0.16 |
LOQ—limit of quantification; BaP—benzo(a)pyrene; BaA—benz(a)anthracene; BbFA—benzo(b)fluoranthene; Chr—chrysene.
Table 2.
Validation parameters of the method of determination of PAHs in tea.
| Parameter | Kind of PAH | ||||
|---|---|---|---|---|---|
| BaP | BaA | BbFA | Chr | ||
| Linearity—correlation coefficient | 0.9999 | 1.0000 | 0.9999 | 1.0000 | |
| Sensitivity (slope) by regression equation | 2.451 | 9.050 | 7.398 | 3.667 | |
| Limit of detection (LOD) (μg/kg) (n = 10) | 0.25 | 0.15 | 0.15 | 0.25 | |
| Limit of quantification (LOQ) (μg/kg) (n = 10) | 0.75 | 0.50 | 0.50 | 0.75 | |
| Recovery (%) | Level I (5.00 μg/kg) (n = 6) | 82.25 | 93.30 | 75.00 | 71.35 |
| Level II (40.00 μg/kg) (n = 6) | 50.75 | 66.70 | 57.05 | 64.70 | |
| Level III (250 μg/kg) (n = 6) | 67.20 | 76.20 | 69.90 | 75.80 | |
| Repeatability RSDr (%) (n = 20) | 8.8 | 5.5 | 2.2 | 3.6 | |
| HORRATr | 0.61 | 0.34 | 0.15 | 0.25 | |
Explanations: n—number of determinations; Repeatability RSDr—repeatability relative standard deviation; HORRATr—the observed RSDr divided by the RSDr value estimated from the modified Horwitz equation [30]; BaP—benzo(a)pyrene; BaA—benz(a)anthracene; BbFA—benzo(b)fluoranthene; Chr—chrysene.
Table 3.
Ranges and means of PAH contents (μg/kg) in the selected teas purchased in the Polish market.
Table 3.
Ranges and means of PAH contents (μg/kg) in the selected teas purchased in the Polish market.
| Tea Type | Kind of PAH | ||||
|---|---|---|---|---|---|
| BaP | BaA | BbFA | Chr | Σ4PAHs | |
| Black tea (n = 10) | 3.96–209.36 | 7.58–187.00 | 4.51–145.10 | 14.80–280.00 | 33.12–770.10 |
| 51.13 | 51.53 | 41.08 | 75.06 | 218.80 | |
| Green tea (n = 6) | 4.30–24.82 | 5.62–23.03 | 7.27–46.53 | 9.80–61.20 | 29.62–153.27 |
| 13.34 | 15.10 | 18.25 | 28.91 | 75.96 | |
| Red tea (n = 6) | 7.00–18.09 | 15.81–30.99 | 9.13–22.89 | 23.80–51.61 | 55.74–120.41 |
| 12.93 | 23.24 | 16.25 | 37.79 | 90.21 | |
| White tea (n = 6) | 0.76–26.55 | 1.01–38.41 | 0.85–25.61 | 2.89–42.73 | 5.51–130.74 |
| 11.52 | 14.87 | 13.11 | 18.34 | 57.40 | |
Explanations: Minimum–maximum and mean values are presented; Σ4PAHs—sum of benzo(a)pyrene, benz(a)anthracene, benzo(b)fluoranthene and chrysene; n—number of samples.
Table 4.
Comparison of results generated within presented study with similar studies.
| Tea Type | Sampling Market | Number of Samples | Kind of PAH | Reference | ||||
|---|---|---|---|---|---|---|---|---|
| BaP | BaA | BbFA | Chr | Σ4PAHs | ||||
| Black tea | Poland | 10 | 3.9–209 | 7.6–187 | 4.5–145 | 14.8–280 | 33–770 | present study |
| Poland | 7 | n.d. | 2.4–47 | 1.9–8.1 | 1.6–18 | - | [21] | |
| Poland | 9 | 2.9–63 | - | - | - | - | [34] | |
| Czech Republic | 18 | 0.2–152 | 1.4–196 | 0.9–123 | 3.9–229 | 7.4–699 | [4] | |
| Argentina | 27 | 0.2–93 | 0.2–63 | 0.1–68 | 2.5–109 | 4.1–332 | [33] | |
| Denmark | 10 | 0.30–32 | - | - | - | 2.8–115 | [36] | |
| China | 2 | 20.1–246 | - | - | - | - | [6] | |
| Nigeria | 4 | n.d.–137 | n.d.–44 | n.d.–27 | n.d.–55 | - | [31] | |
| Germany | 11 | 0.8–14 | 1.3–13 | 1.5–8.1 | 3.4–18 | 9.0–44 | [10] | |
| Green tea | Poland | 6 | 4.3–25 | 5.6–23 | 7.3–47 | 9.8–61 | 29–153 | present study |
| Poland | 7 | n.d | 11–19 | 1.8–2.0 | 2.8–3.7 | - | [21] | |
| Poland | 3 | 5.6–31 | - | - | - | - | [34] | |
| Czech Republic | 18 | 0.2–18 | 0.7–28 | 0.7–24 | 2.9–42 | 4.5–102 | [4] | |
| Argentina | 14 | 0.4–61 | 0.7–74 | 0.15–67 | 4.6–154 | 8.0–356 | [33] | |
| China | 1 | 6.8 | - | - | - | - | [6] | |
| Nigeria | 3 | n.d. | n.d. | n.d.–27 | n.d.–55 | - | [31] | |
| Germany | 11 | 1.6–33 | 1.8–40 | 2.2–33 | 6.7–62 | 12–168 | [10] | |
| Red tea | Poland | 6 | 7.0–18 | 16–31 | 9.1–23 | 24–52 | 55–120 | present study |
| Poland | 3 | n.d | n.d.–33 | n.d. | 3.2–12 | - | [21] | |
| Poland | 3 | 9.7–15 | - | - | - | - | [34] | |
| Argentina | 7 | 0.7–16 | 0.5–41 | 0.5–25 | 5.8–64 | 7.4–127 | [33] | |
| White tea | Poland | 6 | 0.8–27 | 1.0–38 | 0.8–26 | 2.9–42 | 5.5–131 | present study |
| Poland | 5 | n.d. | 2.4–17 | 2.2 | 12–19 | - | [21] | |
| Poland | 3 | 7.6–49 | - | - | - | - | [34] | |
| Argentina | 1 | 22 | 16 | 19 | 35 | 92 | [33] | |
| Germany | 3 | 11 | 14–80 | 14–45 | 19–95 | 59–80 | [10] | |
Explanations: Minimum–maximum and mean values (μg/kg) are presented; Σ4PAHs—sum of benzo(a)pyrene, benz(a)anthracene, benzo(b)fluoranthene and chrysene; “-”—no data; n.d.—not detected.
Table 5.
Validation parameters of the method of determination of PAHs in tea infusion.
| Parameter | Kind of PAH | |||
|---|---|---|---|---|
| BaP | BaA | BbFA | Chr | |
| Linearity—correlation coefficient | 0.9999 | 0.9999 | 0.9999 | 0.9999 |
| Limit of detection (LOD) (ng/mL) (n = 10) | 0.05 | 0.03 | 0.03 | 0.05 |
| Limit of quantification (LOQ) (ng/mL) (n = 10) | 0.15 | 0.10 | 0.10 | 0.15 |
| Recovery Level I (0.18 ng/mL) (n = 6) (%) | 110.56 | 105.00 | 107.22 | 99.44 |
| Repeatability RSDr (%) (n = 10) | 8.0 | 4.4 | 5.1 | 6.5 |
| HORRATr | 0.55 | 0.30 | 0.35 | 0.45 |
Explanations: n—number of determinations; Repeatability RSDr—repeatability relative standard deviation; HORRATr = the observed RSDr divided by the RSDr value estimated from the modified Horwitz equation [30].
© 2017 by the authors. Licensee MDPI, Basel, Switzerland. This article is an open access article distributed under the terms and conditions of the Creative Commons Attribution (CC BY) license (http://creativecommons.org/licenses/by/4.0/).
Share and Cite
MDPI and ACS Style
Zachara, A.; Gałkowska, D.; Juszczak, L. Contamination of Tea and Tea Infusion with Polycyclic Aromatic Hydrocarbons. Int. J. Environ. Res. Public Health 2018, 15, 45. https://doi.org/10.3390/ijerph15010045
AMA Style
Zachara A, Gałkowska D, Juszczak L. Contamination of Tea and Tea Infusion with Polycyclic Aromatic Hydrocarbons. International Journal of Environmental Research and Public Health. 2018; 15(1):45. https://doi.org/10.3390/ijerph15010045
Chicago/Turabian StyleZachara, Alicja, Dorota Gałkowska, and Lesław Juszczak. 2018. "Contamination of Tea and Tea Infusion with Polycyclic Aromatic Hydrocarbons" International Journal of Environmental Research and Public Health 15, no. 1: 45. https://doi.org/10.3390/ijerph15010045
Note that from the first issue of 2016, this journal uses article numbers instead of page numbers. See further details here.