Solid Particle Number Emission Factors of Euro VI Heavy-Duty Vehicles on the Road and in the Laboratory

Joint Research Centre–European Commission, via E. Fermi 2749, 21027 Ispra, Italy
Int. J. Environ. Res. Public Health 2018, 15(2), 304; https://doi.org/10.3390/ijerph15020304
Submission received: 22 December 2017
/
Revised: 2 February 2018
/
Accepted: 5 February 2018
/
Published: 9 February 2018
(This article belongs to the Special Issue Air Quality and Health)
Abstract
:Particulate matter (PM), and in particular ultrafine particles, have a negative impact on human health. The contribution of vehicle PM emissions to air pollution is typically quantified with emission inventories, which need vehicle emission factors as input. Heavy-duty vehicles, although they represent a small percentage of the vehicle population in nearly every major country, contribute the majority of the on-road PM emissions. However, the published data of modern heavy-duty vehicle emissions are scarce, and for the newest Euro VI technologies, almost non-existent. The main objective of this paper is to present Solid Particle Number (SPN) emission factors from Euro VI heavy-duty vehicles using diesel, Compressed Natural Gas (CNG), or Liquefied Natural Gas (LNG). Urban, rural and motorway (highway) emissions were determined on the road at various European cities using SPN Portable Emission Measurement Systems (PEMS). Additional tests on a heavy-duty chassis dynamometer showed that the solid sub-23 nm fraction, which is not covered at the moment in the European regulation, is high, especially for CNG engines. The significant contribution of regeneration events and the effect of ambient temperature and engine cold-start on particle emissions were also discussed.
1. Introduction
1.1. PM, Health Effects, and Emission Models
Particulate matter (PM) consists of a complex mixture of solid and liquid particles of organic and inorganic substances suspended in the air. PM causes damage to ecosystems and cultural sites, and reduced visibility. Air pollution, and in particular PM2.5 (smaller than 2.5 μm) is now clearly recognized as an important global risk factor for disease [1].
Ultrafine particles (smaller than 0.1 μm) have been associated with short-term cardiorespiratory and central nervous system adverse health effects [2]. Clinical and toxicological studies have shown that ultrafine particles can act through mechanisms not shared with larger particles [2]. Ultrafine particle have higher deposition fraction, deeper penetration, and higher retention rate in the lungs [3]. The higher surface area to mass ratio enables them to carry other surface adhered hazardous substances that can generate reactive oxygen species, the so-called “Trojan horse” effect [4]. Ultrafine particles can translocate from the lungs to other organs, for instance the heart and the brain [5,6]. The surface characteristics, the chemical composition, the biological components, and the solubility determine the response and the health outcomes [7,8]. Ultrafine particles are typically measured with particle number (PN) [9] or surface area instruments [10,11].
Anthropogenic PM sources include agriculture, waste incineration, energy production, domestic heating, road transport, and, brakes, tires and road wear. Road traffic contributes around 11–25% to the PM concentrations in Europe [12,13], higher in Asia [13,14], and can reach >50% in some cities [15]. Particularly heavy-duty vehicles, which represent <5% of the vehicle population in nearly every major country, contribute 40–60% of the road-traffic PM emissions [16]. A study estimated that trucks and buses within New York City accounted for the largest share of on-road mobile-attributable ambient PM2.5 and contributed 53% of the PM2.5-attributable deaths [17]. The contribution of road traffic in terms of other metrics such as black carbon is larger [18]. For PN the traffic contribution can be even higher (60%) due to the high number of nuclei particles formed from the unburnt fuel and lubricant or secondary formation, reaching 90% in busy roads [19] or even 99% in tunnels [20].
The greenhouse gas emission reduction policies and the goal to keep the global temperature increase below 2 °C commits the European Union (EU) to reduce emissions by at least 20% below 1990 levels by 2020, and by 80–95% by 2050 [21]. The Transport White Paper [22] sets out how the transport system can reduce its emissions by 60% in the same period. Regarding urban transport, the target is 50% shift away from conventionally fueled cars by 2030, phasing them out in cities by 2050. Thus, a big shift to cleaner cars and cleaner fuels is required. Similar policies are followed all over the world [23,24,25].
The contribution of vehicle emissions to air pollution is typically quantified with emission inventories [26]. Emissions are estimated using various calculation tools (models) (e.g., COPERT (Computer Programme to calculate emissions from road transport) [27], HBEFA (Handbook Emission Factors for Road Transport) [28], MOVES (Motor Vehicle Emission Simulator) [29]). Generally, vehicle fleet and activity data with the respective emission factors are combined. These models are increasingly being used not only for emission inventorying purposes but also to assess air quality policies, produce emission projections, and to set environmental targets (e.g., [30]). These tools use vehicle emission factors as default values, but they are frequently updated using experimental results [31]. Different experimental methods can be used, such as remote sensing, chassis dynamometer measurements, and on-road testing with portable systems (for details see [32] and references therein). Remote sensing for PN has not been applied yet and experimental data for PN emissions are limited, especially for the newest Euro VI heavy-duty vehicles [33,34].
1.2. PN Regulation in EU
Based on the findings of the Particle Measurement Program (PMP) [35], the European emissions regulation requires, in addition to PM mass, the measurement of Solid Particle Number (SPN) > 23 nm (for details see Section 2) for type approval of diesel light-duty vehicles since 2011 (Euro 5b) [36], and for Gasoline Direct Injection (GDI) light-duty vehicles since 2014 (Euro 6) [37]. Real Driving Emissions (RDE) testing on the road with Portable Emissions Measurement Systems (PEMS) for SPN and NOx during type approval and in-service conformity testing was recently (in 2017) introduced for light-duty vehicles [38].
Regarding heavy-duty vehicles the type approval of an engine is conducted in a test bed following a prescribed test cycle where the engine rpm and torque are varied. The test is conducted twice: With engine starting with coolant and oil temperature at ambient conditions (20–30 °C) and the engine starting warmed up (the results are weighted 14% and 86% respectively). This engine then can be used for various applications for instance in a truck (category N) or a bus (category M). The SPN limit for heavy-duty engines (6 × 10¹¹ p/kWh) (“p” will be used for particles from now on) was introduced in 2013 (Euro VI) for compression ignition (diesel) engines [39] and in 2014 for positive ignition engines [40]. The SPN measurement procedure is almost identical to the light-duty vehicles procedure [41,42].
The in-service conformity (ISC) (or in-use compliance in the USA) testing of a heavy-duty engine was conducted in the test bed by removing the engine from a vehicle in normal use. Since Euro VI vehicles, the testing is conducted on the road over normal driving patterns, conditions and payloads using PEMS [39]. The testing is conducted over a mix of urban (≤50 km/h), rural, and motorway (highway) (>75 km/h) conditions, with exact percentages of these conditions depending on vehicle category [43]. The first in-use test should be conducted at the time of type approval testing and the result should be lower than the Euro VI limit corrected with a conformity factor (1.5 for gaseous pollutants) that takes into account the PEMS measurement uncertainty. Although the PEMS testing is applicable for both gaseous and PM emissions in US, in Europe it is currently applicable to gaseous emissions only. After a long evaluation of the PM mass method with PEMS [44], in 2015 it was decided to evaluate the SPN method, which should be introduced in 2019.
1.3. Open Points for SPN Emissions
As heavy-duty engines are type approved in a test bed and SPN PEMS were only recently introduced, the real world SPN emissions of modern vehicles are not well known [45]. The limited information available today is based on studies in the USA with a mobile dilution tunnel (e.g., [46]) or systems that mimic the regulated SPN procedure (e.g., [47]). As ISC testing should cover an ambient temperature range from −7 °C to +35 °C, there is a need to better understand the influence of low (or even high) ambient temperatures on SPN. The knowledge of the ambient temperature effect on SPN emissions is based mainly on light-duty vehicle studies [45,48,49], because the facilities worldwide (heavy-duty engine test beds or chassis dynamometers) that can modify the room (ambient) temperature are limited. In general, emissions are higher at lower temperatures, but when the engine is hot the ambient temperature plays a minor role, as long as the combustion strategy remains the same [49,50]. Another topic under investigation is the introduction of (engine) cold start for the ISC testing (i.e., emissions until the coolant temperature reaches 70 °C). Many studies have shown that gaseous emissions are higher during the first minutes of testing due to inefficient operation of the after-treatment devices and the higher engine out emissions (e.g., [51,52]). However, for SPN emissions the trend is not clear. Usually, higher SPN emissions are measured [35], but not always [52].
Another topic under discussion is the existence of solid sub-23 nm particles that the current regulated methodology does not measure [53]. Recent studies have shown that during urea injection not only the >23 nm SPN concentration increases [54], but also the ratio of 10 nm to 23 nm SPN concentrations is higher [55]. For CNG engines most studies have shown that the majority of particle emissions is <23 nm [56], raising concerns for the regulated method.
1.4. Objectives of the Paper
The main objective of this paper is to present SPN emission factors of modern (i.e., Euro VI type approved) heavy-duty vehicles based on on-road measurements with SPN PEMS. Additionally, input on topics that haven’t been covered adequately in the literature will be given; namely correlation of laboratory and on-road SPN emissions, effect of cold start and ambient temperature on SPN emissions, existence of sub-23 nm solid particles, and contribution of regeneration emissions on the SPN emissions.
2. Materials and Methods
The vehicles were tested in one laboratory and/or on the road at various European cities. Some data were extracted from published data.
2.1. Vehicles and Fuels
The test fleet consisted of trucks (N category) or buses (M category) using EN590 diesel or natural gas. Natural gas can be stored either compressed at pressures over 200 bar (Compressed Natural Gas, CNG) or cryogenically in liquid form at temperatures approximately −162 °C (Liquefied Natural Gas, LNG). All vehicles complied to the Euro VI standards (i.e., the cold and hot start weighted SPN emissions of the engine were <6 × 10¹¹ p/kWh). Details of the vehicles can be found in Table 1. The diesel vehicles were all equipped with Diesel Oxidation Catalyst (DOC), DPF, Selective Catalytic Reduction (SCR) for NOx systems and ammonia slip catalyst. The CNG vehicles were stoichiometric with three-way catalyst (TWC). More information can be found in the cited literature.
The experimental details are summarized in Table 2 and will be described in the next sections. The LNG data were taken from The Netherlands Organization for Applied Scientific Research (TNO) [58], some of the diesel vehicles’ data were taken from the Swedish Transport Agency (STA) [59], or published papers [45,52]. Some data were provided by the European Automobile Manufacturers' Association (ACEA) for the SPN PEMS project [60]. The rest of the vehicles were tested during various projects such as the evaluation of SPN PEMS [60], cold start emissions, or tools for calculating CO2 emissions [61] at European Commission’s Joint Research Centre (JRC, Ispra, Italy). None of the vehicles was optimized for low SPN emissions and in some cases on purpose “worst cases” were tested to challenge the instrumentation. Thus, the results of this paper should be representative of the current Euro VI heavy-duty vehicles. The tests were conducted in the 2016–2017 period (except the STA tests in 2014 and DPF N3 #3 in 2015).
2.2. Laboratory Testing
The laboratory tests were conducted on the 2-axis roller dynamometer of the Vehicle Emissions Laboratory (VELA 7) of JRC. The dyno settings were not available from the vehicle manufacturers and for this reason realistic estimated values were used [61]. The test mass was set to simulate approximately 50–60% payload. For the tests described here, the climatic room temperature varied between −7 °C and +35 °C, but typically temperatures between 20 °C and 25 °C were used. The exhaust gas was connected to the full dilution tunnel with a 9 m tube (the last 4 m insulated). The full dilution tunnel with constant volume sampling (CVS) was used with flow rates of 100–120 m3/min depending on the engine size. With this flow rate at least a dilution ratio of 5:1 was achieved, even for the bigger engines.
A SPN measurement system (AVL Particle Counter (APC) 489, Graz, Austria), compliant with the heavy-duty engines [42] regulations, was used at the dilution tunnel (CVS) [62]. The Volatile Particle Remover (VPR) of the system consisted of a hot dilution of approximately 25:1 at 150 °C, an evaporation tube at 350 °C and a final dilution in a porous diluter (10:1) with room temperature filtered air. The system was calibrated by the manufacturer and the dilution, which includes the particle losses (as average of 30 nm, 50 nm and 100 nm), is called Particle number Concentration Reduction Factor (PCRF) (approximately 250 in this study). Downstream of the VPR a butanol Condensation Particle Counter (CPC) (model TSI 3790) with 50% counting efficiency at 23 nm (d50% = 23 nm) was measuring solid particles. In parallel, a butanol CPC (model TSI 3772) (d50% =10 nm) was used in some tests to investigate the presence of particles between 10 and 23 nm. The additional losses below 30 nm were taken into account for the 10 nm CPC results as described in [53], i.e., a correction factor of 1.7 was applied. An Engine Exhaust Particle Sizer (EEPS) (model 3090 from TSI, Shoreview, MN, USA) was used directly at the dilution tunnel (CVS) for some tests with DPF N3 #4b to measure total PN (volatiles and solids). The repeatability of the SPN method (not the variability of the vehicles) is expected to be better than 15% [35,63].
Some vehicles were tested under cold and hot engine start conditions with the Worldwide Harmonized Vehicle Cycle (WHVC), which was developed based on the same set of data used for the development of the engine type approval Worldwide Harmonized Test Cycle (WHTC) [64]. Unlike the WHTC, however, the WHVC is not used for regulatory testing. No slopes were added in most of the cases, thus the work of this cycle in many cases was different to the type approval work of the WHTC. The duration of the WHVC test is 1800 s. The first 900 s represent urban driving, the next 481 s rural, and the last 419 s motorway (highway). A graphical presentation of the cycle can be found in Figure 1. When the test was starting with cold engine (i.e., engine and coolant at ambient temperature), the urban phase was considered as “cold (urban) start”.
Some vehicles were tested in the laboratory with pre-determined ISC (In-Service-Conformity) cycles (approximately 150 km long with >2.5 h duration). For N3 vehicles the cycle consisted of urban (20%), rural (25%) and motorway (55%) phases in this order (excluding idling time) [43]. For the N2 vehicles the shares were urban (45%), rural (25%) and motorway (30%). The rural and motorway phases included short sections with low speeds (≤50 km/h); to simulate for example when stopping at tolls or crossing a village (see e.g., Figure 1). When the test was starting with cold engine (i.e., at ambient temperature), the first 900 s were separately evaluated to estimate the cold start (urban) emissions. In this case, the rest urban part was used for the evaluation of the (hot) urban emissions. The reason of selecting a duration of 900 s instead of a coolant temperature threshold was that the coolant temperature was not available for all vehicles in this paper. For vehicles that the coolant temperature was available, it was confirmed that at 900 s the coolant temperature was >75 °C. Additionally for vehicles that both the WHVC and ISC were available, it was noticed that the coolant temperature increase was similar at the two cycles.
2.3. On-Road Testing
For the on-road tests portable SPN systems were used. The SPN PEMS were the modified TSI NPET (Nanoparticle Emission Tester) from HORIBA (Kyoto, Japan) or the commercial version OBS-ONE from HORIBA (almost identical systems) [65]. The first diluter (10:1) was located directly at the sample probe at the tailpipe. With a 4 m heated line at 60 °C the diluted aerosol was brought to the main cabinet where a heated catalytic stripper at 350 °C removed the volatile and semi-volatile particles. A second dilution (10:1) cooled down the aerosol and brought the concentration to the measuring range of the isopropyl alcohol-based CPC with d50% at 23 nm (a TSI CPC 3007 with modified saturator and condenser temperatures). The SPN-PEMS and the PMP system were compared to each other periodically and the differences were found within 35% [60].
Depending on the vehicle, 4 or 5 inches exhaust flowmeters were used. For some vehicles the exhaust flowmeters were compared to the estimated exhaust flow rate from the difference between the total flow of the dilution tunnel and the dilution air flow and the differences were within 4%.
The on-road ISC cycles were similar to the ISC lab tests but not identical. A graphical presentation of a sample cycle can be found in Figure 1.
2.4. Literature and Received Data
The ACEA, TNO [58], and literature [45,52] received data were on-road tests that followed the procedures described above. The STA [59] data were extracted from a report. Cold and hot WHVCs were conducted at AVL MTC (Motortestcenter) AB (Stockholm, Sweden) using a similar setup as described previously for JRC.
2.5. Calculations
The trip was divided in “cold (urban) start” (first 900 s) (if the engine was cold), “urban” with hot engine (speeds ≤50 km/h), “rural” (speeds 50–75 km/h), and “motorway” phases (speeds >75 km/h). The rural and motorway phases included time periods with speeds <50 km/h and <75 km/h respectively (e.g., crossing a village, stopping at tolls). For the calculations these short section with low speeds were included in the rural and motorway phases respectively (i.e., they were not excluded or transferred to urban emissions). See Figure 1 as an example.
After time alignment of the signals, the SPN concentration of the system at the dilution tunnel was multiplied with the CVS flow rate, while the SPN PEMS at the tailpipe (both in the laboratory and on the road) was multiplied with the exhaust flow rate. The sum of the instantaneous particle number emissions during the urban, rural and motorway phases were divided with the respective distances to obtain the distance specific SPN emissions [p/km]. All emission events were included in the calculations (integrated emissions) and no parts were excluded as required in the regulations (e.g., <10% max power in Europe [39,43] and the Not-To-Exceed (NTE) concept in USA). When total trip emissions are reported, they were calculated weighing 14% the cold start emissions and 86% the mean value of hot start urban, rural, and motorway operation. Note that this approach is not the regulated one and gives higher weight to the urban emissions. Note also that the regulation requires emissions in p/kWh; in this paper results are expressed in p/km because they are more useful for emission factor models.
3. Results
The weighted emissions of the vehicles (14% cold start emissions and 86% mean value of urban, rural, and motorway emissions) are presented in Figure 2. The CNG and LNG vehicles range from 3.3 × 10¹¹ to 4.5 × 10¹² p/km. One of the LNG vehicles is lower than the assumed SPN limit 6 × 10¹¹ p/km. The rest vehicles are higher by a factor of 1.4 to 2.4, with one exception (CNG N3 #1: 4.5 × 10¹² p/km), that is 7.5 times higher. The specific vehicle had <3000 km and the lubricant contribution could be higher. The diesel vehicles (all with DPFs) ranged from 8 × 10⁹ to 7 × 10¹¹ p/km. No particular trend can be seen for the different categories (trucks or buses, N2 or N3).
Figure 3 compares the urban SPN emissions with the engine cold or hot (i.e., after 900 s, coolant temperature >75 °C), rural, and motorway (hot) SPN emissions. In general, the emissions are higher when the engine is at ambient temperature (cold), however, not always, especially when the emission levels are <1011 p/km (see for example DPF N2 #4, DPF N3 #3, #7, #9). The rural and motorway emissions are in general lower than the urban emissions with a few exceptions (e.g., CNG N3 #1, DPF N2 #1, DPF N3 #3a).
The results are based on 1–4 repetitions per vehicle (Figure 3). When 2 or more repetitions were available, the variability (expressed as ratio of maximum value to average minus one) was on average 35% (5–85%) with one exception which exceeded 300% (DPF N2 #2). Comparison of the mean emissions of the vehicles that were tested twice (DPF N3 #3 and #4, repetitions “a” and “b” in Figure 3) gave differences within 35% (except cold start >600%).
4. Discussion
The main objective of this paper was to present SPN emission factors of Euro VI heavy-duty vehicles. Results from 24 diesel, CNG, and LNG vehicles were presented (8 of them from the literature).
4.1. Emission Levels
The emission levels of Figure 2 are summarized in Figure 4 for diesel and natural gas vehicles (cold start weighted 14%). To put the emission levels into perspective Figure 4 summarizes also emission levels of various vehicle categories based on a few studies that focused on the most recent technologies: Euro 5 and Euro 6 light-duty vehicles [53,66] (cold start included in the test cycle), Euro 2 and Euro 3 mopeds and motorcycles [67] (cold start weighted 30%). Emission factors from COPERT and HBEFA [33,34,68] and ranges from the latest SPN emissions review are also plotted [35]. The diesel vehicles have the highest emissions (>3 × 10¹³ p/km), while those equipped with DPF the lowest (<6 × 10¹¹ p/km), in agreement with the literature (e.g., [69,70,71]). The spark ignition vehicles are on the order of 1012 p/km; lower for gasoline Port-Fuel Injection (PFI) vehicles, but higher for Gasoline Direct Injection (GDI) vehicles, mopes and motorcycles.
The emissions of the DPF equipped heavy-duty vehicles are similar with the range reported in a review paper [35] for older DPF equipped vehicles (5 × 10¹⁰–2 × 10¹² p/km), retrofitted vehicles [46,71] or the COPERT and HBEFA estimated emission factors (5 × 10¹⁰–1.6 × 10¹¹ p/km) [33,34]. This indicates that newer DPFs with or without catalytic washcoat alone or in combination with NOx reduction systems remain very efficient. The emissions are much lower than heavy-duty diesel vehicles without DPF, which are in the range of 2 × 10¹³–2 × 10¹⁴ p/km [35,69]. The SPN emissions of the natural gas engines (3.3 × 10¹¹ to 1.5 × 10¹² p/km excluding CNG N3 #1) were higher than the DPF equipped vehicles and similar to what has been reported for Euro V CNG buses [72]. Thus, although natural gas vehicles emit virtually no visible PM or black soot and have less PM mass emissions than non-DPF equipped diesel vehicles [69], this is not necessarily true if they are compared to DPF equipped diesel vehicles for PM [73] and SPN (this study). As expected, the emission levels of LNG and CNG vehicles were similar because the combustion of the two forms of natural gas is identical: LNG is first vaporized and then injected, in a similar manner to CNG. The difference between the two is only the way that the fuels are stored on board the vehicle.
To give indications of the concentration levels emitted from the tailpipe, for example, a vehicle with cold start emissions of 3 × 10¹² p/km, would have SPN concentration (for a few minutes) around 5 × 10⁶ p/cm3. For emission levels of 5 × 10¹⁰ p/km the concentration is between 1 × 10³ p/cm3 and 1 × 10⁴ p/cm3. A vehicle that would emit close to the ambient background level (measured at JRC laboratory ambient air [60] 4000 p/cm3 solid particles >23 nm), would have emissions levels between 2 × 10¹⁰ p/km and 1 × 10¹¹ p/km depending on the engine size and the phase of the route (urban, rural, motorway).
These results should be interpreted with care because they are not based on an extensive research of the literature and haven’t been weighted for the market shares of the evaluated vehicles. In addition, and in particular for the results of this paper, many parameters influence the repeatability (variability) of the reported SPN emission factors, such as instrumentation, DPF fill state, regeneration, test cycle and ambient temperature. For example, the uncertainty of the PMP system in the lab is on the order of 15%, while for the PEMS on the road at least 35% [60]. The rest influencing parameters (for the heavy-duty vehicle results presented in this paper) will be discussed in the next sections.
4.2. Engine Cold Start
The enrichment of the air/fuel mixture during cold-start engine operation or at low ambient temperatures, in order to compensate for the reduced fuel vaporization and elevated engine components friction, leads to incomplete fuel combustion [74]. The higher engine out emissions combined with the lower efficiency of the after-treatment devices, as they haven’t reached their normal operating temperature range, result in higher emissions (Figure 3: compare urban cold start and urban hot). The total particles emitted during cold start (first 900 s) of the vehicles of this study were on average 3.4 × 10¹² particles.
However, the SPN cold start emissions are not always higher than the hot emissions, especially when the emission levels are <1011 p/km (see for example DPF N2 #4, DPF N3 #3, #7, #9). In these cases the SCR system is downstream of the DPF and the emissions increase when the exhaust gas temperature has reached the appropriate range and urea is injected. Figure 5 shows two WHVCs one after the other (the first one with cold engine start). Although at the beginning there are almost no particles, when NOx emissions decrease (due to urea injection), the SPN concentration increases. According to the literature, in addition to the formation of nitrates and sulfates [55], these particles originate from isocyanic acid polymerization, urea pyrolysis and urea micro-explosions [54]. This explains why in some cases the cold start SPN emissions are lower than the hot start. Note also the high concentration of sub-23 nm particles, indicating that the mean size of the formed solid particles is lower than 20 nm.
4.3. Ambient Temperature
Figure 6 presents the effect of ambient temperature on SPN emissions. Beginning with the hot engine start (open symbols) of the DPF vehicles, the emission levels are relatively flat (i.e., similar levels within experimental uncertainty) indicating no influence of the ambient temperature. This is expected, as long as the cylinder, lubricant and after-treatment devices have reached their operation temperature, and as long as the engine strategy does not change (e.g., Exhaust Gas Recirculation (EGR)).
The urban SPN emissions with engine cold start have a tendency to increase with decreasing ambient temperature (solid symbols, Figure 6). According to the literature [35,75], the cold start particles emission can be due to: (i) higher engine out emissions (ii) semi-volatile material escaping oxidation, (iii) blow-out of loose non-volatile particle deposits, (iv) particles penetrating through small filter defects which close as the temperature rises. For light-duty vehicles it was suggested that the last assumption is the most probable: Small defects in the brick or in the mat employed to mount the brick in the canister result in reduced filtration efficiency. The lower canister temperature at −7 °C require prolonged thermal stabilization period, especially for the mounting material being in direct contact with the canister.
However, the SPN emissions during cold start are not always higher at lower temperatures (see e.g., DPF N2 #4 of Figure 6 (or [52]). The DPF fill state plays the most important role and determines the efficiency of the DPF. For example, a study with two DPF equipped heavy-duty vehicles showed that the emissions immediately after a regeneration event were >5 × 10¹² p/kWh and dropped to <1 × 10¹¹ p/kWh after 5 test cycles [76], clearly demonstrating the importance of the soot cake of the DPF on its efficiency. The tests in this paper were not controlled in terms of DPF load state.
Regarding the CNG vehicle, there is an increase of emissions at 0 °C and −7 °C compared to 22 °C, but no difference between 0 °C and −7 °C. There are no studies discussing the effect of low temperature and cold start on SPN emissions of CNG vehicles. One possible explanation is the increased contribution of soot and lubricant due to the incomplete combustion. The smaller relative increase of the emissions at lower ambient temperatures is due to the higher increase of sub-23 nm particles. This indicates that the majority of the emissions at low ambient temperatures are due to lubricant particles (soot particles are usually >20 nm), based also on other studies that found that the non-volatile particles of CNG vehicles were composed mostly of ash from lubricating oil [77,78].
4.4. Urban, Rural, and Motorway Phases
Comparison of the emissions from the hot urban, rural and motorway phases shows that in most cases the hot urban emissions are higher than the rural and motorway phases (Figure 3). One would expect higher emissions at the motorway phase due to higher engine out emissions (as for cases CNG N3 #1, DPF N2 #1, DPF N3 #3). For example, for the CNG N3 #1, the combustion at the motorway phase might be rich and incomplete, resulting in higher emissions. For DPF vehicles the higher exhaust gas temperature passively regenerates the filter and consequently reduces the filter efficiency of the DPF. Moreover, at rural and motorway conditions, it is expected that urea is injected more time than during urban conditions; this could lead to higher SPN emissions as previously discussed. One probable explanation for the higher urban emissions is that the emissions are still relatively high due to the cold start (e.g., CNG N1 #1, CNG N3 #2, LNG N3 #1, DPF N2 #1, DPF N3 #1, DPF N3 #2). Another one is that the emissions are very low and the higher distances at the rural and motorway phases result in lower p/km (DPF N2 #4, DPF N3 #7).
4.5. Correlation of Cycles
For some vehicles it was possible to compare each phase (cold start, urban, rural, motorway) of the lab WHVCs to the lab and on-road ISC cycles. The correlation between different phases is presented in Figure 7. Additionally some tests from the literature were plotted [465,456]. One case was a Euro V truck [45] and the other was a 14.6 L truck retrofitted with a Continuously Regenerating Trap (CRT) that was tested with the Urban Dynamometer Driving Schedule (USSD) lab cycle and some on-road trips [46].
In general, there is an acceptable agreement between the different phases of different cycles (e.g., rural WHVC vs. rural ISC), but not always. For some cases the cold start emissions of the ISC cycles (points in grey background in Figure 7) are lower than the WHVC cold start emissions. This could be partly due to the smoother driving on the road. However, probably the DPF load state plays the most important role and determines the emission levels.
4.6. Regeneration
As soot accumulates in the DPF, there is a need for periodic regeneration (oxidation of the soot) in order to avoid clogging of the DPF or uncontrolled oxidation of the soot, which can potentially damage the DPF. In this case the increase of the temperature is initiated by the vehicle’s engine management system (e.g., post injection of fuel) and is called active regeneration. Under some operating conditions of the vehicle or engine and the assistance of NO2, the exhaust gas temperature is high enough to oxidize the soot (passive regeneration) [79]. Systems that do not need periodic regeneration are called continuously regenerating systems. Nevertheless, vehicles with continuously regenerating systems can have additionally a periodic regeneration trigger. Heavy-duty regulations require taking into account the emissions during regeneration for periodically regenerating systems in the certification value.
To estimate the emissions during active regenerations under real conditions two cases were examined: Regeneration by dashboard activation with the vehicles parked and active regeneration during an on-road trip. Figure 8 presents these two regeneration cases. During the active regeneration of 3 parked vehicles (Figure 8 left panel) approximately 1.6 × 10¹³–5.1 × 10¹³ particles were emitted. The emissions remained high even after the regeneration as the DPF was empty. A similar study [57] that examined the active regeneration emissions of total particles (including volatiles) of two parked trucks found 4 × 10¹⁶ to 2 × 10¹⁷ particles. They mentioned though that the majority was nucleation mode particles, which were 2–4 orders of magnitude higher than the accumulation mode particles (which are close to the SPN emissions).
During the on-road active regeneration (time 6700 s until 7400, Figure 8 right panel) approximately 1.1 × 10¹³ more particles were emitted compared to the non-regenerating trip. Note also that the emissions after the regeneration remained high. The motorway emissions of the two trips were 2.9 × 10¹¹ p/km and 3.8 × 10¹⁰ p/km, respectively.
It is difficult to quantify the contribution of regeneration on SPN emissions. A very detailed study with Japanese 2009 heavy-duty trucks (similar to Euro VI) showed that the regenerating cycle contributed 43% (Truck with SCR) to 81% (truck without SCR) to the final weighted certification value [74]. These percentages increased to 88–99% when the emissions of the two cycles after regeneration were included. Thus, the rest of the tests (approximately 15) played no role and their exact value (typically <1 × 10¹¹ p/km) was of minor importance. However, all these tests were conducted with hot engine start.
In this study, two of the vehicles (DPF N3 #4a and #5) were tested for more than one month in the laboratory and all SPN emissions were recorded (e.g., during warm-up, testing and active regeneration). The total SPN emissions divided by the total distance travelled for DPF N3#4a were 3.1 × 10¹¹ p/km (or 2.6 × 10¹¹ p/kWh) and for DPF N3 #5 were 6.6 × 10¹¹ p/km (or 5.3 × 10¹¹ p/kWh). Another vehicle that was tested for more than 1300 km, did not actively regenerate and the emissions were slightly lower than 1 × 10¹¹ p/km. This means that the SPN emissions including the regeneration events remain at acceptable levels (i.e., close to the SPN Euro VI limit) and quite close to the values presented in Figure 2 (including the cold start).
4.7. Sub-23 nm Solid Particles
During the PMP investigation from 2008 to 2010 of the SPN methodology (>23 nm) for heavy-duty engines, there was some evidence that solid particles <23 nm were present; but not at levels that would justify any modification of the light-duty methodology [80]. Later review studies focused on light-duty vehicles and motorcycles [53,66,67], and only a few studies discussed about heavy-duty vehicles [81,82,83]. Some studies even showed that the measurements below 23 nm are prone to artifacts [53,67,82].
Figure 9 presents the sub-23 nm fraction of various heavy-duty vehicles in function of the SPN >23 nm emissions of the vehicles for various test cycles. Many of the measurements presented here were conducted in parallel with systems less prone to artifacts (catalytic strippers [53,67,82]), thus, the values presented should be reliable. The CNG vehicles have a high percentage (>50%) of sub-23 nm particles and one vehicle had even higher percentage at cold start (CNG N3 #1). The specific one though had <3000 km at the odometer and the contribution from the lubricant could be higher than the other vehicles [73].
Regarding the diesel vehicles equipped with DPF, for the same concentration range (>1 × 10¹² p/km) the sub-23 nm fraction is very low (<10%). This is expected because DPFs have high filtration efficiency for all sizes [84]. However, at concentration levels <1 × 10¹¹ p/km the sub-23 nm fraction reaches and sometimes exceeds 200%. These particles are probably urea decomposition particles, as discussed previously [54,55]. Solid soot cores below 20 nm have also been reported [83].
From Figure 9 is clear that the solid sub-23 nm fractions can be significant; however, the sub-23 nm absolute emission levels in most cases remain low. For example, DPF vehicles are still below the SPN limit even when including the sub-23 nm fraction (in Figure 9 all DPF points are below the curved dotted line). Thus, for regulatory purposes the current methodology still captures high emitters for most of the cases (i.e., a vehicle that passes with the 23 nm system would also pass with the 10 nm system and vice versa). A critical situation would be to have many vehicles in the area between the two dashed lines in Figure 9.
4.8. Total Particles
Although the purpose of the paper was to discuss solid particles, it should be mentioned that volatile (nucleation mode) particles can be orders of magnitude higher in concentration [47] and they are often measured in the exhaust plume of vehicles and in roadside environments [85]. Typical PN emission factors of heavy-duty diesel vehicles range from 1 × 10¹⁴ to 6 × 10¹⁵ p/km (see review [86]). Since that review, other studies have confirmed these levels [87], while for CNG or DPF equipped vehicles the levels were found similar [88] or lower [89,90,91] (around 2 × 10¹¹ to 2 × 10¹³ p/km).
The quantification of total PN concentration is difficult as their formation and concentration depends on many parameters, such as the after-treatment devices (e.g., [92]), the pre-conditioning and history of the vehicle (e.g., [93]), the fuel and the lubricant used (e.g., [94]), the ambient conditions (e.g., [95]), and the amount of soot present, since this promotes the competing process of condensation and adsorption instead of nucleation [96]. The regulated method uses constant volume sampling which means low dilution (around 6:1) at high exhaust flow rates and high dilution at low exhaust flow rates (>30:1). In the atmosphere the dilution process is the opposite: for example, in one chasing study 14 m from a light-duty vehicle, the dilution varied from 1800:1 at 50 km/h to 7000:1 at 120 km/h [97]. In addition to the concerns regarding the representativeness of the regulated methodology to quantify total PN emissions, the different designs and operational parameters among the test facilities increase the variability of their results. The reason is that, even when using the conditions allowed by the regulation, concentrations that differ orders of magnitude can be obtained [98]. Finally, the transfer line from the vehicle to the dilution tunnel can be a source of artifacts due to release of stored materials from previous tests and/or vehicles [99].
Dedicated designs of dilution systems to measure directly at the tailpipe [100] can estimate the formation “potential” of the nucleation mode, i.e., they can reproduce the trends, including those caused by differences in vehicle speed and engine load, engine and after-treatment technology, as well as fuel and lubricant composition [100,101]. However, a review study showed that the number concentration of the nucleation mode in the laboratory was generally lower by a factor of 2–10 from the atmosphere [101]. One explanation for the lower concentration in the laboratory was the choice of dilution parameters (dilution ratio 12, dilution temperature 32 °C, relative humidity <5%). The agreement was better when the laboratory sampling conditions matched those encountered on-road [95]. When the sampling parameters (e.g., dilution ratio or dilution temperature) are not appropriate, the measured particle number emissions might not be representative of the actual emissions on the road [102].
Figure 10 shows an example of solid and total particles, both above 10 nm with vehicle DPF N3 #4a. The total PN concentration was measured with an Engine Exhaust Particle Sizer (EEPS, TSI model 3090, Shoreview, MN, USA). During the cold start the instruments agree within 15%, however at the rest urban part the total particles are >2 times higher in concentration, but as the solid particle concentration increases the difference of the two systems decreases to 40% (motorway phase). At the specific example the cold start emissions were around 6 × 10¹² p/km, while at the rest of the cycle the emissions were around 8 × 10¹⁰ p/km. This test, which was done at −7 °C, didn’t increase the exhaust gas temperature at high levels to induce a strong nucleation mode.
Figure 11 shows SPN and total PN emissions during steady state points with different engine loads and consequently exhaust gas temperatures. At the beginning of the test, the difference between total and solid PN emissions is relatively small (see first part of Figure 11). However, when the exhaust gas temperature increases, a high concentration of nucleation mode particles is measured (see last part of Figure 11). This is attributed to the formation of sulfuric acid particles due to the high conversion of SO2 to SO3 at the catalyst of the vehicle (see [82,92,93,97,103]). Note that the SPN concentrations remained at relatively low levels. The SPN emissions were <1011 p/km, while total PN exceeded 1015 p/km.
4.9. Strengths and Limitations
This study is one of the first to investigate and summarize solid particle emissions from Euro VI heavy-duty vehicles, quantify their sub-23 nm fraction, discuss the effect and contribution of cold start, low ambient temperature, and regeneration events. The vehicles tested were Euro VI compliant and thus should be representative of near future emissions. Existing emission factors could be updated based on the findings of this study, especially for natural gas vehicles and cold start contribution. As there is no in-service conformity (ISC) requirement for particle emissions yet, improvements might be seen in the future, especially for gas engines, when they will have to comply with on-road limits. Another drawback of the study is that the results are based on European vehicles only and in some cases only one repetition was available. Although the fact that the tests were conducted in many locations by different companies enhances the validity and robustness of the findings; however, it does not allow a strict comparison between the different vehicles, as in many cases the protocols were different. Finally, this study only touched total particle emissions which are important for air quality monitoring purposes. Nevertheless, this study is a step in production of solid particle emission factors of modern Euro VI vehicles and might help emission inventories and air quality modeling for the estimation of contribution of road traffic to air pollution.
5. Conclusions
European regulation requires the measurement of Solid Particle Number (SPN) emissions with diameter >23 nm for heavy-duty engines. Additionally, the heavy-duty vehicles have to be checked for in-service conformity (ISC) with Portable Emission Measurement Systems (PEMS). This study presented the SPN emissions of 24 diesel, CNG or LNG vehicles (8 of them from the literature) on the road and in the laboratory driving realistic ISC cycles.
The SPN emissions ranged from 8 × 10⁹ to 7 × 10¹¹ p/km for the diesel DPF equipped vehicles and 3.3 × 10¹¹ to 4.5 × 10¹² p/km for the CNG and LNG vehicles. The majority of the SPN were emitted during the cold start for most of the diesel vehicles. The ambient temperature had a significant effect only during cold start, but the effect was dependent on the DPF fill state.
Active regeneration events (vehicles parked or during driving) resulted in increased emissions. The contribution in SPN was 1.1 × 10¹³–5.1 × 10¹³ particles. Based on these vehicles, the weighted emissions including regeneration events were close or below the SPN limit.
The sub-23 nm fraction was significant: >50% for CNG engines (emission levels >1 × 10¹² p/km) and up to 200% for diesel engines for emission levels <1 × 10¹¹ p/km. Although the regulated SPN methodology can still distinguish low or high emitters regardless of the sub-23 nm fraction, monitoring this fraction is recommended in order to avoid situations that the methodology is not efficient.
Acknowledgments
The author would like to acknowledge the European Automobile Manufacturers’ Association (ACEA) for providing some of the vehicles and/or results. The author is thankful to the project leaders Georgios Fontaras, Theodoros Grigoratos, and Adolfo Perujo for recruiting some of the vehicles and organizing the tests. Special acknowledgments to the laboratory staff Mauro Cadario, Andrea Bonamin, and Alessandro Zappia for executing the tests.
Conflicts of Interest
The author declares no conflict of interest.
Disclaimer
The opinions expressed in this manuscript are those of the author and should in no way be considered to represent an official opinion of the European Commission.
Abbreviations
| ACEA | European Automobile Manufacturers Association |
| APC | AVL Particle Counter |
| CNG | Compressed Natural Gas |
| COPERT | Computer Programme to calculate emissions from road transport |
| CPC | Condensation Particle Counter |
| CRT | Continuously Regenerating Trap |
| CVS | Constant Volume Sampling |
| DOC | Diesel Oxidation Catalyst |
| DPF | Diesel Particulate Filter |
| EEPS | Engine Exhaust Particle Sizer |
| EGR | Exhaust Gas Recirculation |
| EU | European Union |
| GDI | Gasoline Direct Injection |
| ISC | In-Service Conformity |
| HBEFA | Handbook Emission Factors for Road Transport |
| JRC | Joint Research Centre |
| LNG | Liquefied Natural Gas |
| MOVES | Motor Vehicle Emission Simulator |
| NPET | Nanoparticle Emission Tester |
| NTE | Not-To-Exceed |
| PCRF | Particle Concentration Reduction Factor |
| PEMS | Portable Emissions Measurement System |
| PFI | Port Fuel Injection |
| PM | Particulate Matter |
| PMP | Particle Measurement Programme |
| PN | Particle Number |
| RDE | Real Driving Emissions |
| SCR | Selective Catalytic Reduction |
| SPN | Solid Particle Number |
| STA | Swedish Transport Agency |
| TNO | Netherlands Organization for Applied Scientific Research |
| TWC | Three-Way Catalyst |
| USA | United States of America |
| USSD | Urban Dynamometer Driving Schedule |
| VELA | Vehicle Emissions Laboratory |
| VPR | Volatile Particle Remover |
| WHTC | Worldwide Harmonized Transient Cycle |
| WHVC | Worldwide Harmonized Test Cycle |
References
- Health Effects Institute. State of global air. In Special Report; HEI: Boston, MA, USA, 2017. [Google Scholar]
- World Health Organization. Review of Evidence on Health Aspects of Air Pollution—REVIHAAP Project; WHO Regional Office for Europe: Copenhagen, Denmark, 2013. [Google Scholar]
- Li, N.; Georas, S.; Alexis, N.; Fritz, P.; Xia, T.; Williams, M.; Horner, E.; Nel, A. A work group report on ultrafine particles (American Academy of Allergy, Asthma & Immunology): Why ambient ultrafine and engineered nanoparticles should receive special attention for possible adverse health outcomes in human subjects. J. Allergy Clin. Immunol. 2016, 138, 386–396. [Google Scholar] [PubMed]
- Limbach, L.; Wick, P.; Manser, P.; Grass, R.; Bruinink, A.; Stark, W. Exposure of engineered nanoparticles to human lung epithelial cells: Influence of chemical composition and catalytic activity on oxidative stress. Environ. Sci. Technol. 2007, 41, 4158–4163. [Google Scholar] [CrossRef] [PubMed]
- Kreyling, W.; Semmler-Behnke, M.; Moller, W. Ultrafine particle lung interactions: does size matter? J. Aerosol. Med. 2006, 19, 74–83. [Google Scholar] [CrossRef] [PubMed]
- Peters, A.; Veronesi, B.; Calderón-Garcidueñas, L.; Gehr, P.; Chen, L.; Geiser, M.; Reed, W.; Rothen-Rutishauser, B.; Schürch, S.; Schulz, H. Translocation and potential neurological effects of fine and ultrafine particles a critical update. Part Fibre Toxicol. 2006, 3, 13. [Google Scholar] [CrossRef] [PubMed] [Green Version]
- Bakand, S.; Hayes, A.; Dechsakulthorn, F. Nanoparticles: A review of particle toxicology following inhalation exposure. Inhal. Toxicol. 2012, 24, 125–135. [Google Scholar] [CrossRef] [PubMed]
- Morakinyo, O.; Mokgobu, M.; Mukhola, M.; Hunter, R. Health outcomes of exposure to biological and chemical components of inhalable and respirable particulate matter. Int. J. Environ. Res. Public Health 2016, 13, 592. [Google Scholar] [CrossRef] [PubMed]
- Li, Y.; Lane, K.; Corlin, L.; Patton, A.; Durant, J.; Thanikachalam, M.; Woodin, M.; Wang, M.; Brugge, D. Association of long-term near-highway exposure to ultrafine particles with cardiovascular diseases, diabetes and hypertension. Int. J. Environ. Res. Public Health 2017, 14, 461. [Google Scholar] [CrossRef] [PubMed]
- Ntziachristos, L.; Polidori, A.; Phuleria, H.; Geller, M.; Sioutas, K. Application of a diffusion charger for the measurement of particle surface concentration in different environments. Aerosol Sci. Technol. 2007, 41, 571–580. [Google Scholar] [CrossRef]
- Giechaskiel, B.; Alföldy, B.; Drossinos, Y. A metric for health effect studies of diesel aerosol particles. J. Aerosol Sci. 2009, 40, 639–651. [Google Scholar] [CrossRef]
- European Environmental Agency. Air Quality in Europe 2017; EEA: Copenhagen, Denmark, 2017. [Google Scholar]
- Karagulian, F.; Belis, C.; Dora, C.; Pruss-Ustun, A.; Bonjour, S.; Adair-Rohani, H.; Adair-Rohani, H.; Amann, M. Contributions to cities’ ambient particulate matter (PM): A systematic review of local source contributions at global level. Atmos. Environ. 2015, 120, 475–483. [Google Scholar] [CrossRef]
- Fang, X.; Li, R.; Xu, Q.; Bottai, M.; Fang, F.; Cao, Y. A two-stage method to estimate the contribution of road traffic to PM2.5 concentrations in Beijing, China. Int. J. Environ. Res. Public Health 2016, 13, 124. [Google Scholar] [CrossRef] [PubMed]
- Chaloulakou, A.; Kassomenos, P.; Spyrellis, N.; Demokritou, P.; Koutrakis, P. Measurements of PM10 and PM2.5 particle concentrations in Athens, Greece. Atmos. Environ. 2005, 37, 649–660. [Google Scholar] [CrossRef]
- Wagner, W.; Rutherford, D. Survey of best practices in emission control of in-use heavy-duty diesel vehicles. In International Council Clean Transportation (ICCT) Report; ICCT: Washington, DC, USA, 2013. [Google Scholar]
- Kheirbek, I.; Haney, J.; Douglas, S.; Ito, K.; Matte, T. The contribution of motor vehicle emissions to ambient fine particulate matter public health impacts in New York City: A health burden assessment. Environ. Health 2016, 15. [Google Scholar] [CrossRef] [PubMed]
- Segersson, D.; Eneroth, K.; Gidhagen, L.; Johansson, C.; Omstedt, G.; Nylén, A.; Forsberg, B. Health impact of PM10, PM2.5 and black carbon exposure due to different source sectors in Stockholm, Gothenburg and Umea, Sweden. Int. J. Environ. Res. Public Health 2017, 14, 742. [Google Scholar] [CrossRef]
- Kumar, P.; Morawska, L.; Birmili, W.; Paasonen, P.; Hu, M.; Kulmala, M.; Harrison, R.; Norford, L.; Britter, R. Ultrafine particles in cities. Environ. Int. 2014, 66, 1–10. [Google Scholar] [CrossRef] [PubMed] [Green Version]
- Morawska, L.; Ristovski, Z.; Jayaratne, R.; Keogh, D.; Ling, X. Ambient nano and ultrafine particles from motor vehicle emissions: Characteristics, ambient processing and implications on human exposure. Atmos. Environ. 2008, 42, 8113–8138. [Google Scholar] [CrossRef] [Green Version]
- European Commission. A Roadmap for Moving to a Competitive Low Carbon Economy in 2050; European Commission: Brussels, Belgium, 2011. [Google Scholar]
- European Commission. Roadmap to a Single European Transport Area—Towards a Competitive and Resource Efficient Transport System. Transport White Paper; European Commission: Brussels, Belgium, 2011. [Google Scholar]
- Facanha, C.; Blumberg, K.; Miller, J. Global Transportation Energy and Climate Roadmap; ICCT: Washington, DC, USA, 2012. [Google Scholar]
- Javid, R.; Nejat, A.; Hayhoe, K. Selection of CO2 mitigation strategies for road transportation in the United States using a multi-criteria approach. Renew. Sustain. Energy Rev. 2014, 38, 960–972. [Google Scholar] [CrossRef]
- Gambhir, A.; Tse, L.; Tong, D.; Martinez-Botas, R. Reducing China’s road transport sector CO2 emissions to 2050: Technologies, costs and decomposition analysis. Appl. Energy 2015, 157, 905–917. [Google Scholar] [CrossRef]
- EMEP/EEA. Air Pollutant Emission Inventory Guidebook 2016; EEA Report No. 21/2016; EEA: Copenhagen, Denmark, 2016. [Google Scholar]
- Gkatzoflias, D.; Kouridis, C.; Ntziachristos, L.; Samaras, Z. COPERT4: Computer Programme to Calculate Emissions from Road Transport, User Manual; European Environment Agency: Maastricht, The Netherlands, 2012. [Google Scholar]
- Hausberger, S.; Rexeis, M.; Zallinger, M.; Luz, R. Emission Factors from the Model PHEM for the HBEFA Version 3; Report Nr. I-20/2009 Haus-Em 33/08/679 from 07.12.2009; Graz University of Technology: Graz, Austria, 2009. [Google Scholar]
- U.S. Environmental Protection Agency. Motor Vehicle Emission Simulator (MOVES): User Guide Version; EPA-420-B-15-05; EPA: Washington, DC, USA, 2015.
- Takeshita, T. Global scenarios of air pollutant emissions from road transport through to 2050. Int. J. Environ. Res. Public Health 2011, 8, 3032–3062. [Google Scholar] [CrossRef] [PubMed]
- Smit, R.; Ntziachristos, L.; Boulter, P. Validation of road vehicle and traffic emission models—A review and meta-analysis. Atmos. Environ. 2010, 44, 2943–2953. [Google Scholar] [CrossRef]
- Franco, V.; Kousoulidou, M.; Muntean, M.; Ntziachristos, L.; Hausberger, S.; Dilara, P. Road vehicle emission factors development: A review. Atmos. Environ. 2013, 70, 84–97. [Google Scholar] [CrossRef]
- Rexeis, M.; Hausberger, S.; Kühlwein, J.; Luz, R.; Ligterink, N. Update of Emission Factors for EURO 5 and EURO 6 Vehicles for the HBEFA Version 3.2; Report No. I-31/2013/Rex EM-I 2011/20/679 from 06.12.2013; Graz University of Technology: Graz, Austria, 2013. [Google Scholar]
- Vouitsis, I.; Ntziachristos, L.; Samaras, C.; Samaras, Z. Particulate mass and number emission factors for road vehicles based on literature data and relevant gap filling methods. Atmos. Environ. 2017, 168, 75–89. [Google Scholar] [CrossRef]
- Giechaskiel, B.; Mamakos, A.; Andersson, J.; Dilara, P.; Martini, G.; Schindler, W.; Bergmann, A. Measurement of automotive non-volatile particle number emissions within the European legislative framework: A review. Aerosol. Sci. Technol. 2012, 46, 719–749. [Google Scholar] [CrossRef]
- European Commission. Commission Regulation (EC) No 692/2008 of 18 July 2008 “implementing and amending Regulation (EC) No. 715/2007 of the European Parliament and of the Council on type approval of motor vehicles with respect to emissions from light passenger and commercial vehicles (Euro 5 and Euro 6) and on access to vehicle repair and maintenance information”. Off. J. Eur. Union 2008, L199, 1–136. [Google Scholar]
- European Commission. Commission Regulation (EU) No 459/2012 of 29 May 2012 “amending Regulation (EC) No 715/2007 of the European Parliament and of the Council and Commission Regulation (EC) No 692/2008 as regards emissions from light passenger and commercial vehicles (Euro 6)”. Off. J. Eur. Union 2012, L142, 16–24. [Google Scholar]
- European Commission. Commission Regulation (EU) 2017/1151 of 1 June 2017 supplementing Regulation (EC) No 715/2007 of the European Parliament and of the Council on type-approval of motor vehicles with respect to emissions from light passenger and commercial vehicles (Euro 5 and Euro 6) and on access to vehicle repair and maintenance information, amending Directive 2007/46/EC of the European Parliament and of the Council, Commission Regulation (EC) No 692/2008 and Commission Regulation (EU) No 1230/2012 and repealing Commission Regulation (EC) No 692/2008. Off. J. Eur. Union 2017, L175, 1–732. [Google Scholar]
- European Commission. Commission Regulation (EU) No 582/2011 of 25 May 2011 “implementing and amending Regulation (EC) No 595/2009 of the European Parliament and of the Council with respect to emissions from heavy-duty vehicles (Euro VI) and amending Annexes I and III to Directive 2007/46/EC of the European Parliament and of the Council”. Off. J. Eur. Union 2011, L167, 1–168. [Google Scholar]
- European Commission. Commission Regulation (EU) No 133/2014 of 31 January 2014 amending, for the purposes of adapting to technical progress as regards emission limits, Directive 2007/46/EC of the European Parliament and of the Council, Regulation (EC) No 595/2009 of the European Parliament and of the Council and Commission Regulation (EU) No 582/2011. Off. J. Eur. Union 2014, L47, 1–57. [Google Scholar]
- European Commission. Regulation (EU) 64/2012 of 23 January 2012 amending Regulation (EU) No 582/2011 implementing and amending Regulation (EC) No 595/2009 of the European Parliament and of the Council with respect to emissions from heavy duty vehicles (Euro VI). Off. J. Eur. Union 2012, L28, 1–23. [Google Scholar]
- United Nations. Economic Commissions for Europe, Regulation No. 49, Revision 6, 4 March 2013, Uniform Provisions Concerning the Measures to Be Taken against the Emission of Gaseous and Particulate Pollutants from Compression-Ignition Engines for Use in Vehicles, and the Emission of Gaseous Pollutants from Positive-Ignition Engines Fueled with Natural Gas or Liquefied Gas for Use in Vehicles; United Nations: Geneva, Switzerland, 2013. [Google Scholar]
- European Commission. Commission Regulation. (EU) 2016/1718 of 20 September 2016 amending Regulation (EU) No 582/2011 with respect to emissions from heavy-duty vehicles as regards the provisions on testing by means of portable emission measurement systems (PEMS) and the procedure for the testing of the durability of replacement pollution control devices. Off. J. Eur. Union 2016, L259, 1–41. [Google Scholar]
- Mamakos, A.; Bonnel, P.; Perujo, A.; Carriero, M. Assessment of portable emission measurement systems (PEMS) for heavy-duty diesel engines with respect to particulate matter. J. Aerosol Sci. 2013, 57, 54–70. [Google Scholar] [CrossRef]
- Giechaskiel, B.; Riccobono, F.; Vlachos, T.; Mendoza-Villafuerte, P.; Suarez-Bertoa, R.; Fontaras, G.; Bonnel, P.; Weiss, M. Vehicle emission factors of solid nanoparticles in the laboratory and on the road using portable emission measurement systems (PEMS). Front. Environ. Sci. 2015, 3. [Google Scholar] [CrossRef]
- Zheng, Z.; Durbin, T.; Xue, J.; Johnson, K.; Li, Y.; Hu, S.; Huai, T.; Ayala, A.; Kittelson, D.; Jung, H. Comparison of particle mass and solid particle number (SPN) emissions from a heavy-duty diesel vehicle under on-road driving conditions and a standard testing cycle. Environ. Sci. Technol. 2014, 48, 1779–1786. [Google Scholar] [CrossRef] [PubMed]
- Wang, T.; Quiros, D.; Thiruvengadam, A.; Pradhan, S.; Hu, S.; Huai, T.; Lee, E.; Zhu, Y. Total particle number emissions from modern diesel, natural gas, and hybrid heavy-duty vehicles during on-road operation. Environ. Sci. Technol. 2017, 51, 6990–6998. [Google Scholar] [CrossRef] [PubMed]
- Mathis, U.; Mohr, M.; Forss, A. Comprehensive particle characterization of modern gasoline and diesel passenger cars at low ambient temperatures. Atmos. Environ. 2005, 39, 107–117. [Google Scholar] [CrossRef]
- Ristimäki, J.; Keskinen, J.; Virtanen, A.; Maricq, M.; Aakko, P. Cold temperature PM emissions measurement: Method evaluation and application to light duty vehicles. Environ. Sci. Technol. 2005, 39, 9424–9430. [Google Scholar] [CrossRef] [PubMed]
- Book, E.; Snow, R.; Long, T.; Fang, T.; Baldauf, R. Temperature effects on particulate emissions from DPF-equipped diesel trucks operating on conventional and biodiesel fuels. J. Air Waste Manag. Assoc. 2015, 65, 751–758. [Google Scholar] [CrossRef] [PubMed]
- Dardiotis, C.; Martini, G.; Marotta, A.; Manfredi, U. Low-temperature cold-start gaseous emissions of late technology passenger cars. Appl. Energy 2013, 111, 468–478. [Google Scholar] [CrossRef]
- Mendoza-Villafuerte, P.; Suarez-Bertoa, R.; Giechaskiel, B.; Riccobono, F.; Bulgheroni, C.; Astorga, C.; Perujo, A. NOx, NH3, N2O and PN real driving emissions from a Euro VI heavy-duty vehicle. Impact of regulatory on-road test conditions on emissions. Sci. Total Environ. 2017, 609, 546–555. [Google Scholar] [CrossRef] [PubMed]
- Giechaskiel, B.; Vanhanen, J.; Väkevä, M.; Martini, G. Investigation of vehicle exhaust sub-23 nm particle emissions. Aerosol. Sci. Technol. 2017, 51, 626–641. [Google Scholar] [CrossRef]
- Robinson, M.; Backhaus, J.; Foley, R.; Liu, G. The effect of diesel exhaust fluid dosing on tailpipe particle number emissions. SAE Tech. Pap. 2016. [Google Scholar] [CrossRef]
- Amanatidis, S.; Ntziachristos, L.; Giechaskiel, B.; Bergmann, A.; Samaras, Z. Impact of selective catalytic reduction on exhaust particle formation over excess ammonia events. Environ. Sci. Technol. 2014, 48, 11527–11534. [Google Scholar] [CrossRef] [PubMed]
- Lehtoranta, K.; Murtonen, T.; Vesala, H.; Alanen, J.; Simonen, P.; Rönkkö, T.; Timonen, H.; Saarikoski, S.; Maunula, T.; Kallinen, K.; et al. Natural gas engine emission reduction by catalysts. Emiss. Control Sci. Technol. 2017, 3, 142–152. [Google Scholar] [CrossRef]
- Yoon, S.; Quiros, D.; Dwyer, H.; Collins, J.; Burnitzki, M.; Chernich, D.; Herner, J. Characteristics of particle number and mass emissions during heavy-duty diesel truck parked active DPF regeneration in an ambient air dilution tunnel. Atmos. Environ. 2015, 122, 58–64. [Google Scholar] [CrossRef]
- Vermeulen, R.; Verbeek, R.; van Goethem, S.; Smokers, R. Emissions Testing of Two Euro VI LNG Heavy-Duty Vehicles in The Netherlands: Tank-to-Wheel Emissions; TNO Report 2017 R11336; TNO: The Hague, The Netherlands, 2017. [Google Scholar]
- AVL. Swedish in-Service Testing Programme on Emissions from Heavy-Duty Vehicles 2014; AVL Report #OMT2006; AVL: Graz, Austria, 2014. [Google Scholar]
- Giechaskiel, B.; Riccobono, F.; Mendoza-Villafuerte, P.; Grigoratos, T. Particle Number (PN) Portable Emissions Measurement Systems (PEMS): Heavy Duty Vehicles Evaluation Phase at the Joint Research Centre (JRC); JRC Report 2016, EUR 28256 EN; Publication Office for the European Union: Luxembourg, 2016. [Google Scholar]
- Zacharof, N.; Fontaras, G.; Grigoratos, T.; Ciuffo, B.; Savvidis, D.; Delgado, O.; Rodriguez, F. Estimating the CO2 emissions reduction potential of various technologies in European trucks using VECTO simulator. SAE Tech. Pap. 2017. [Google Scholar] [CrossRef]
- Giechaskiel, B.; Cresnoverh, M.; Jörgl, H.; Bergmann, A. Calibration and accuracy of a particle number measurement system. Meas. Sci. Technol. 2010, 21. [Google Scholar] [CrossRef]
- Khan, Y.; Shimpi, S.; Martin, W. The repeatability and reproducibility of particle number measurements from a heavy duty diesel engine. Emiss. Control Sci. Technol. 2015, 1, 298–307. [Google Scholar] [CrossRef]
- Steven, H. Development of a Worldwide Harmonised Heavy-Duty Engine Emissions Test Cycle; Final Report. TRANS/WP29/GRPE/2001/2; United Nations: Geneva, Switzerland, 2001. [Google Scholar]
- Otsuki, Y.; Tochino, S.; Kondo, K.; Haruta, K. Portable emissions measurement system for solid particle number including nanoparticles smaller than 23 nm. SAE Tech. Pap. 2017. [Google Scholar] [CrossRef]
- Giechaskiel, B.; Manfredi, U.; Martini, G. Engine exhaust solid sub-23 nm particles: I. literature survey. SAE Int. J. Fuels Lubr. 2014, 7, 950–964. [Google Scholar] [CrossRef]
- Giechaskiel, B.; Zardini, A.; Martini, G. Particle emission measurements from L-category vehicles. SAE Int. J. Eng. 2015, 8, 2322–2337. [Google Scholar] [CrossRef]
- Ntziachristos, L.; Galassi, C. Emission Factors for New and Upcoming Technologies in Road Transport; EU Report EUR 26952 EN; EUR: Ispra, Italy, 2014. [Google Scholar]
- Liu, Z.; Ge, Y.; Johnson, K.; Shah, A.; Tan, J.; Wang, C.; Yu, L. Real-world operation conditions and on-road emissions of Beijing diesel buses measured by using portable emission measurement system and electric low-pressure impactor. Sci. Total Environ. 2011, 409, 1476–1480. [Google Scholar] [CrossRef] [PubMed]
- Herner, J.; Hu, S.; Robertson, W.; Huai, T.; Collins, J.; Dwyer, H.; Ayala, A. Effect of advanced aftertreatment for PM and NOx control on heavy-duty diesel truck emissions. Environ. Sci. Technol. 2009, 43, 5928–5933. [Google Scholar] [CrossRef] [PubMed]
- Czerwinski, J.; Zimmerli, Y.; Mayer, A.; Heeb, N.; Lemaire, J.; D’Urbano, G.; Bunge, R. Testing of Combined DPF-SCR systems for HD-retrofitting-VERTdePN. SAE Tech. Pap. 2009. [Google Scholar] [CrossRef]
- Guo, J.; Ge, Y.; Hao, L.; Tan, J.; Li, J.; Feng, X. On-road measurement of regulated pollutants from diesel and CNG buses with urea selective catalytic reduction systems. Atmos. Environ. 2014, 99, 1–9. [Google Scholar] [CrossRef]
- Thiruvengadam, A.; Besch, M.; Thiruvengadam, P.; Pradhan, S.; Carder, D.; Kappanna, H.; Gautam, M. Emission rates of regulated pollutants from current technology heavy-duty diesel and natural gas goods, movement vehicles. Environ. Sci. Technol. 2015, 49, 5236–5244. [Google Scholar] [CrossRef] [PubMed]
- Bielaczyc, P.; Szczotka, A.; Woodburn, J. An overview of cold start emissions from direct injection spark-ignition and compression ignition engines of light duty vehicles at low ambient temperatures. Combust. Eng. 2013, 154, 96–103. [Google Scholar]
- Mamakos, A.; Martini, G.; Manfredi, U. Assessment of the legislated particle number measurement procedure for a Euro 5 and a Euro 6 compliant diesel passenger cars under regulated and unregulated conditions. J. Aerosol Sci. 2013, 55, 31–47. [Google Scholar] [CrossRef]
- Yamada, H. PN emissions from heavy-duty diesel engine with periodic regenerating DPF. SAE Int. J. Eng. 2013, 6, 1178–1189. [Google Scholar] [CrossRef]
- Jayaratne, E.; Meyer, N.; Ristovski, Z.; Morawska, L. Volatile properties of particles emitted by compressed natural gas and diesel buses during steady-state and transient driving modes. Environ. Sci. Technol. 2012, 46, 196–203. [Google Scholar] [CrossRef] [PubMed]
- Thiruvengadam, A.; Besch, M.; Yoon, S.; Collins, J.; Kappanna, H.; Carder, D.; Ayala, A.; Herner, J.; Gautam, M. Characterization of particulate matter emissions from a current technology natural gas engine. Environ. Sci. Technol. 2014, 48, 8235–8242. [Google Scholar] [CrossRef] [PubMed]
- Shrivastava, M.; Nguyen, A.; Zheng, Z.; Wu, H.; Jung, H. Kinetics of soot oxidation by NO2. Environ. Sci. Technol. 2010, 44, 4796–4801. [Google Scholar] [CrossRef] [PubMed]
- Andersson, J.; Mamakos, T.; Giechaskiel, B.; Carriero, M.; Martini, G. Particle Measurement Programme (PMP) Heavy-Duty Inter-Laboratory Correlation Exercise (ILCE HD) Final Report; JRC Report 2010, EUR 24561 EN; Publication office for the European Union: Luxembourg, 2010. [Google Scholar]
- Johnson, K.; Durbin, T.; Jung, H.; Chaudhary, A.; Cocker, D.; Herner, J.; Robertson, W.; Huai, T.; Ayala, A.; Kittelson, D. Evaluation of the European PMP methodologies during on-road and chassis dynamometer testing for DPF equipped heavy-duty diesel vehicles. Aerosol Sci. Technol. 2009, 43, 962–969. [Google Scholar] [CrossRef]
- Zheng, Z.; Johnson, K.; Liu, Z.; Durbin, T.; Hu, S.; Huai, T.; Kittelson, D.; Jung, H. Investigation of solid particle number measurement: Existence and nature of sub-23 nm particles under PMP methodology. J. Aerosol Sci. 2011, 42, 883–897. [Google Scholar] [CrossRef]
- Rönkkö, T.; Virtanen, A.; Kannosto, J.; Keskinen, J.; Lappi, M.; Pirjola, L. Nucleation mode particles with a non-volatile core in the exhaust of a heavy-duty diesel vehicle. Environ. Sci. Technol. 2007, 41, 6384–6389. [Google Scholar] [CrossRef] [PubMed]
- Swanson, J.; Watts, W.; Kittelson, D.; Newman, R.; Ziebarth, R. Filtration efficiency and pressure drop of miniature diesel particulate filters. Aerosol. Sci. Technol. 2013, 47, 452–461. [Google Scholar] [CrossRef]
- Pant, P.; Harrison, R. Estimation of the contribution of road traffic emissions to particulate matter concentrations from field measurements: A review. Atmos. Environ. 2013, 77, 78–97. [Google Scholar] [CrossRef]
- Hallquist, Å.; Jerksjö, M.; Fallgren, H.; Westerlund, J.; Sjödin, Å. Particle and gaseous emissions from individual diesel and CNG buses. Atmos. Chem. Phys. 2013, 13, 5337–5350. [Google Scholar] [CrossRef]
- Hajbabaei, M.; Karavalakis, G.; Johnson, K.; Lee, L.; Durbin, T. Impact of natural gas fuel composition on criteria, toxic, and particle emissions from transit buses equipped with lean burn and stoichiometric engines. Energy 2013, 62, 425–434. [Google Scholar] [CrossRef]
- Biswas, S.; Hu, S.; Verma, V.; Herner, J.; Robertson, W.; Ayala, A.; Sioutas, C. Physical properties of particulate matter (PM) from late model heavy duty diesel vehicles operating with advanced emission control technologies. Atmos. Environ. 2008, 42, 5622–5634. [Google Scholar] [CrossRef]
- Saari, S.; Karjalainen, P.; Ntziachristos, L.; Pirjola, L.; Matilainen, P.; Keskinen, J.; Rönkkö, T. Exhaust particle and NOx emission performance of an SCR heavy duty truck operating in real-world conditions. Atmos. Environ. 2016, 126, 136–144. [Google Scholar] [CrossRef]
- Karavalakis, G.; Hajbabaei, M.; Durbin, T.; Johnson, K.; Zheng, Z.; Miller, W. The effect of natural gas composition on the regulated emissions, gaseous toxic pollutants, and ultrafine particle number emissions from a refuse hauler vehicle. Energy 2013, 50, 280–291. [Google Scholar] [CrossRef]
- Karavalakis, G.; Hajbabaei, M.; Jiang, Y.; Yang, J.; Johnson, K.; Cocker, D.; Durbin, T. Regulated, greenhouse gas, and particulate emissions from lean-burn and stoichiometric natural gas heavy-duty vehicles on different fuel compositions. Fuel 2016, 175, 146–156. [Google Scholar] [CrossRef]
- Herner, J.; Hu, S.; Robertson, W.; Huai, T.; Chang, M.; Rieger, P.; Ayala, A. Effect of advanced aftertreatment for PM and NOx reduction on heavy-duty diesel engine ultrafine particle emissions. Environ. Sci. Technol. 2011, 45, 2413–2419. [Google Scholar] [CrossRef] [PubMed]
- Giechaskiel, B.; Ntziachristos, L.; Samaras, Z.; Casati, R.; Volker, S.; Rainer, V. Effect of speed and speed transition on the formation of nucleation mode particles from a light-duty diesel vehicle. SAE Tech. Pap. 2007. [Google Scholar] [CrossRef]
- Kittelson, D.; Watts, W.; Johnson, J.; Thorne, C.; Higham, C.; Payne, M.; Goodier, S.; Warrens, C.; Preston, H.; Zink, U.; et al. Effect of fuel and lube oil sulfur on the performance of a diesel exhaust gas continuously regenerating trap. Environ. Sci. Technol. 2008, 42, 9276–9282. [Google Scholar] [CrossRef] [PubMed]
- Rönkkö, T.; Virtanen, A.; Vaaraslahti, K.; Keskinen, J.; Pirjola, L.; Lappi, M. Effect of dilution conditions and driving parameters on nucleation mode particles in diesel exhaust: Laboratory and on-road study. Atmos. Environ. 2006, 40, 2893–2901. [Google Scholar] [CrossRef]
- Kim, D.; Gautam, M.; Gera, D. Parametric studies on the formation of diesel particulate matter via nucleation and coagulation modes. J. Aerosol Sci. 2002, 33, 1609–1621. [Google Scholar] [CrossRef]
- Giechaskiel, B.; Ntziachristos, L.; Samaras, Z.; Scheer, V.; Casati, R.; Vogt, R. Formation potential of vehicle exhaust nucleation mode particles on-road and in the laboratory. Atmos. Environ. 2005, 39, 3191–3198. [Google Scholar] [CrossRef]
- Khalek, I.; Kittelson, D.; Brear, F. The influence of dilution conditions on diesel exhaust particle size distribution measurements. SAE Tech. Pap. 1999. [Google Scholar] [CrossRef]
- Maricq, M.; Podsiadlik, D.; Chase, R. Examination of the size-resolved and transient nature of motor vehicle particle emissions. Environ. Sci. Technol. 1999, 33, 1618–1626. [Google Scholar] [CrossRef]
- Ntziachristos, L.; Samaras, Z. The potential of a partial-flow constant dilution ratio sampling system as a candidate for vehicle exhaust aerosol measurements. J. Air Waste Manag. Assoc. 2010, 60, 1223–1236. [Google Scholar] [CrossRef] [PubMed]
- Keskinen, J.; Rönkkö, T. Can real-world diesel exhaust particle size distribution be reproduced in the laboratory? A critical review. J. Air Waste Manag. Assoc. 2010, 60, 1245–1255. [Google Scholar] [CrossRef] [PubMed]
- Vogt, R.; Scheer, V.; Casati, R.; Bender, T. On-road measurement of particle emission in the exhaust plume of a diesel passenger car. Environ. Sci. Technol. 2003, 37, 4070–4076. [Google Scholar] [CrossRef] [PubMed]
- Swanson, J.; Kittelson, D.; Watts, W.; Gladis, D.; Twigg, M. Influence of storage and release on particle emissions from new and used CRTs. Atmos. Environ. 2009, 43, 3998–4004. [Google Scholar] [CrossRef]
Figure 1.
Test cycles: WHVC (World Harmonized Vehicle Cycle) and an example of an ISC (In-Service Conformity) cycle (plotted in the same figure for illustrative purposes). Note that parts of the rural and motorway phases have been cut for better visualization.
Figure 1.
Test cycles: WHVC (World Harmonized Vehicle Cycle) and an example of an ISC (In-Service Conformity) cycle (plotted in the same figure for illustrative purposes). Note that parts of the rural and motorway phases have been cut for better visualization.

Figure 2.
Weighted SPN emissions of test fleet (14% cold start, 86% mean of urban, rural, motorway). The small letters “a” and “b” indicate testing of the same vehicle after approximately 3–6 months.
Figure 2.
Weighted SPN emissions of test fleet (14% cold start, 86% mean of urban, rural, motorway). The small letters “a” and “b” indicate testing of the same vehicle after approximately 3–6 months.
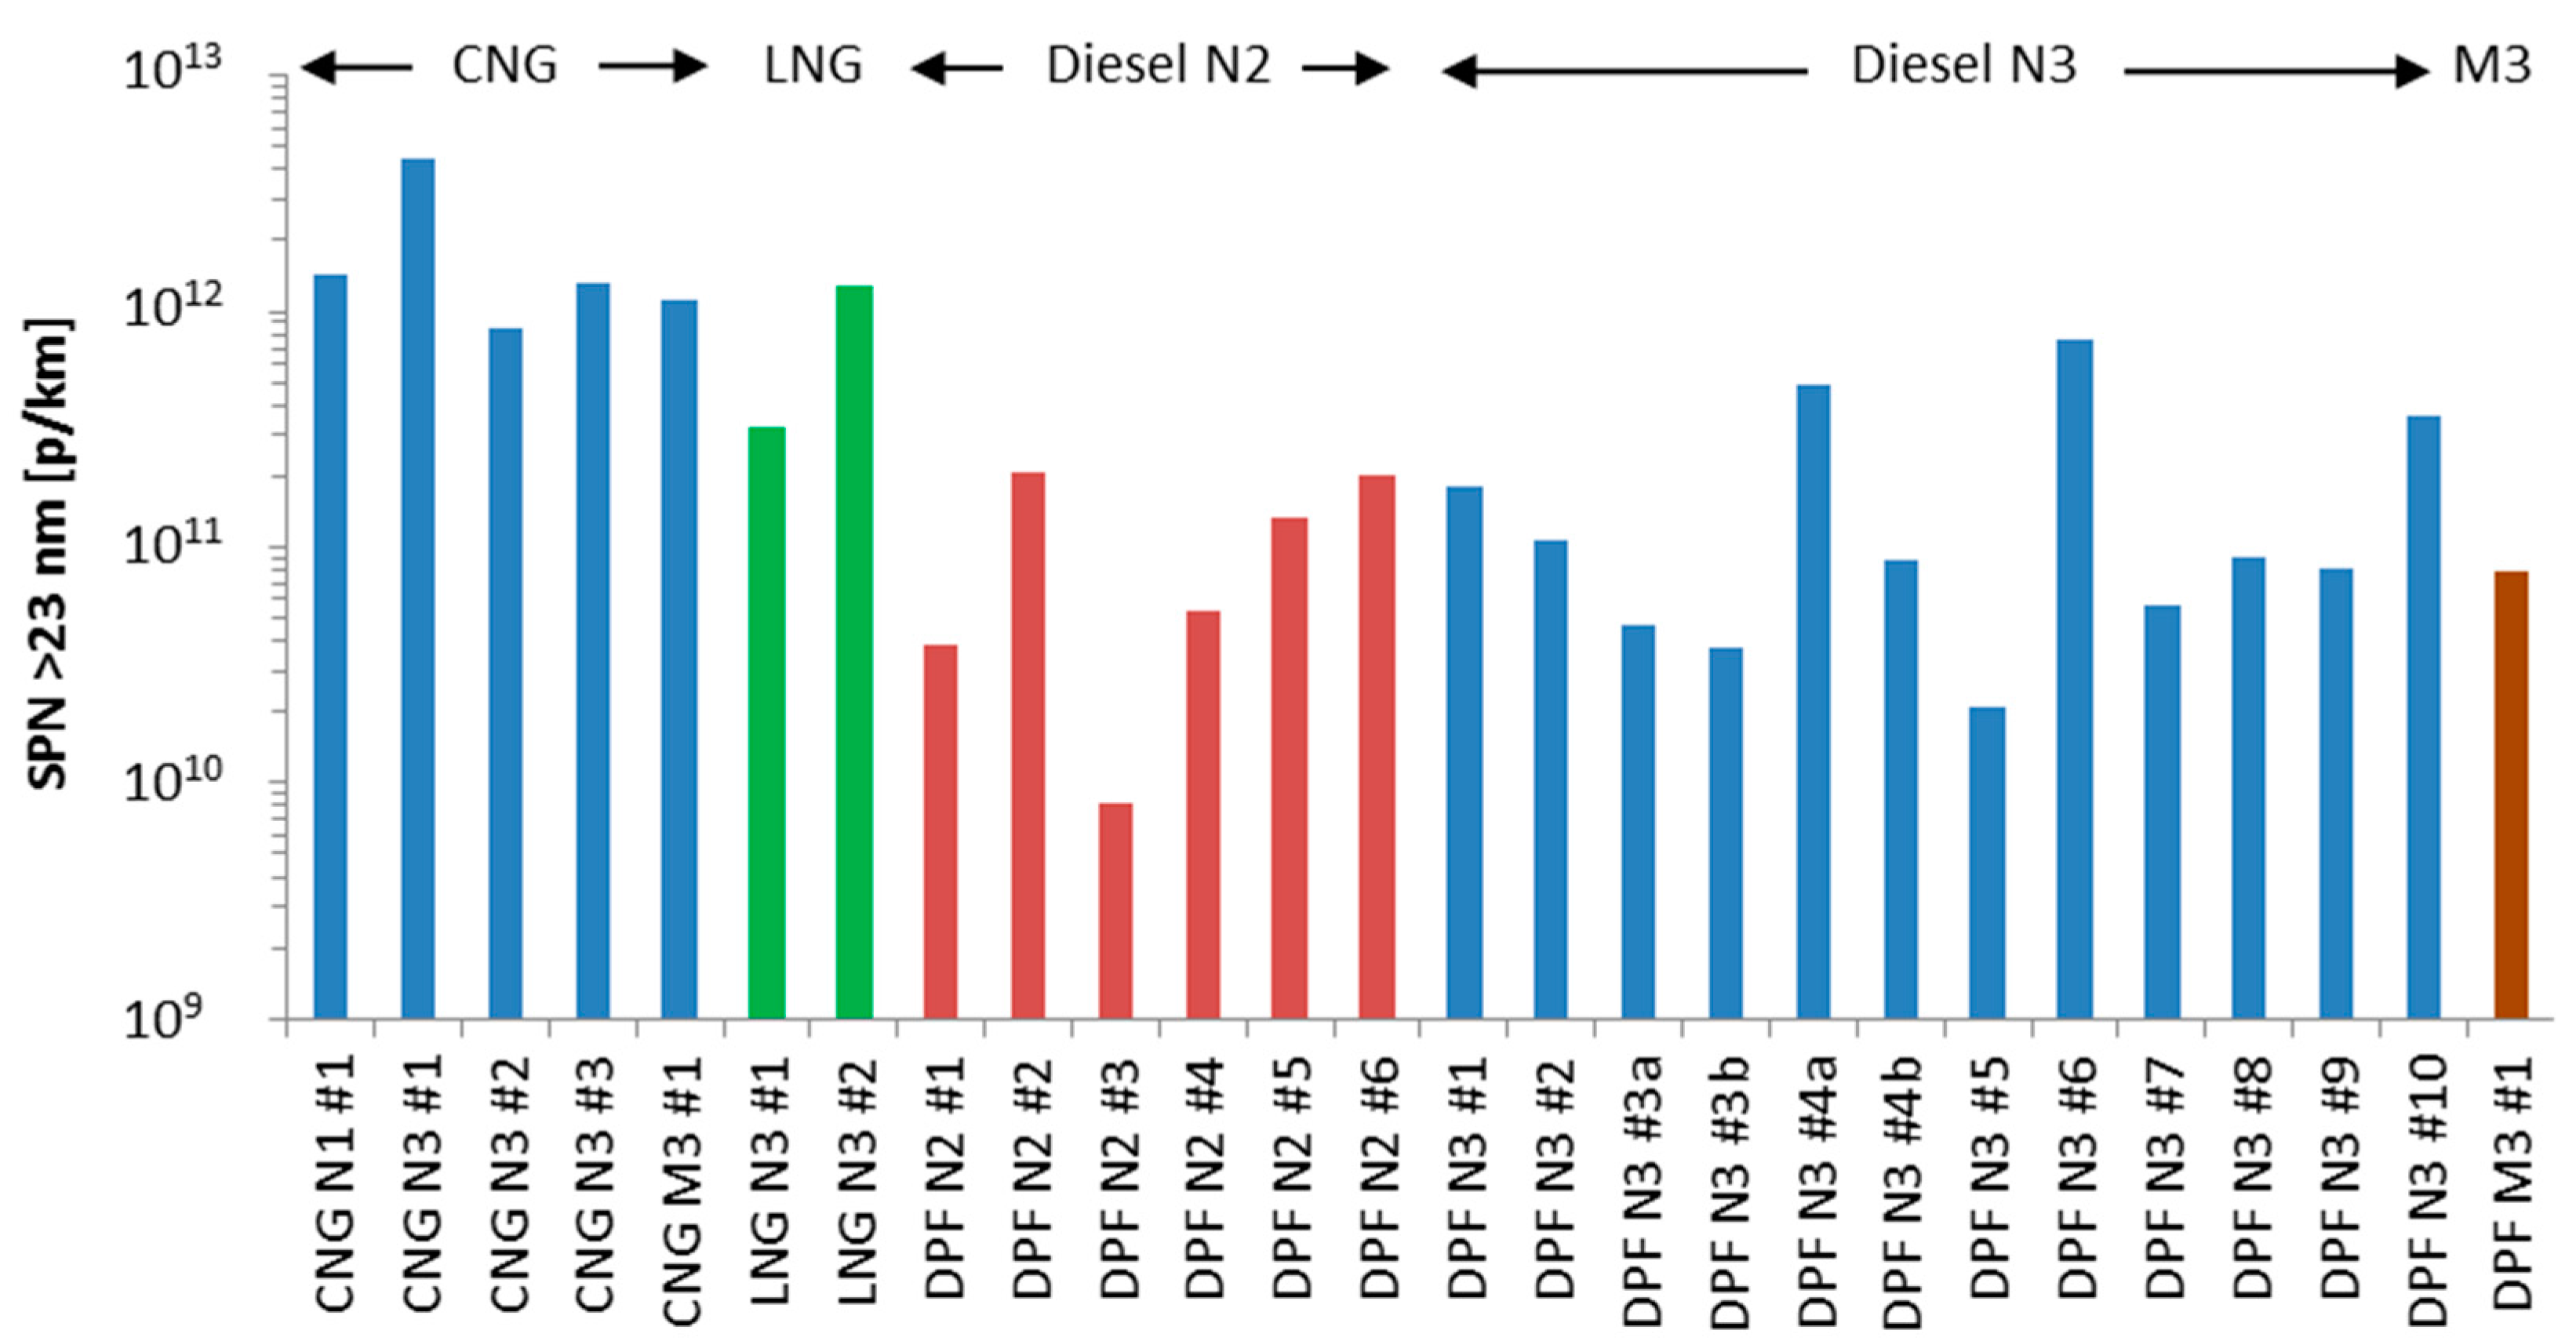
Figure 3.
Urban cold start, urban hot, rural and motorway SPN emissions. Upper panel for CNG, LNG and diesel N2 vehicles. Lower panel for diesel N3 and M3 vehicles. Asterisk * indicates that the two columns refer to the complete WHVC (cold or hot). Error bars show the maximum value when 2 or more repetitions were available. The small letters “a” and “b” indicate testing of the same vehicle after approximately 3–6 months.
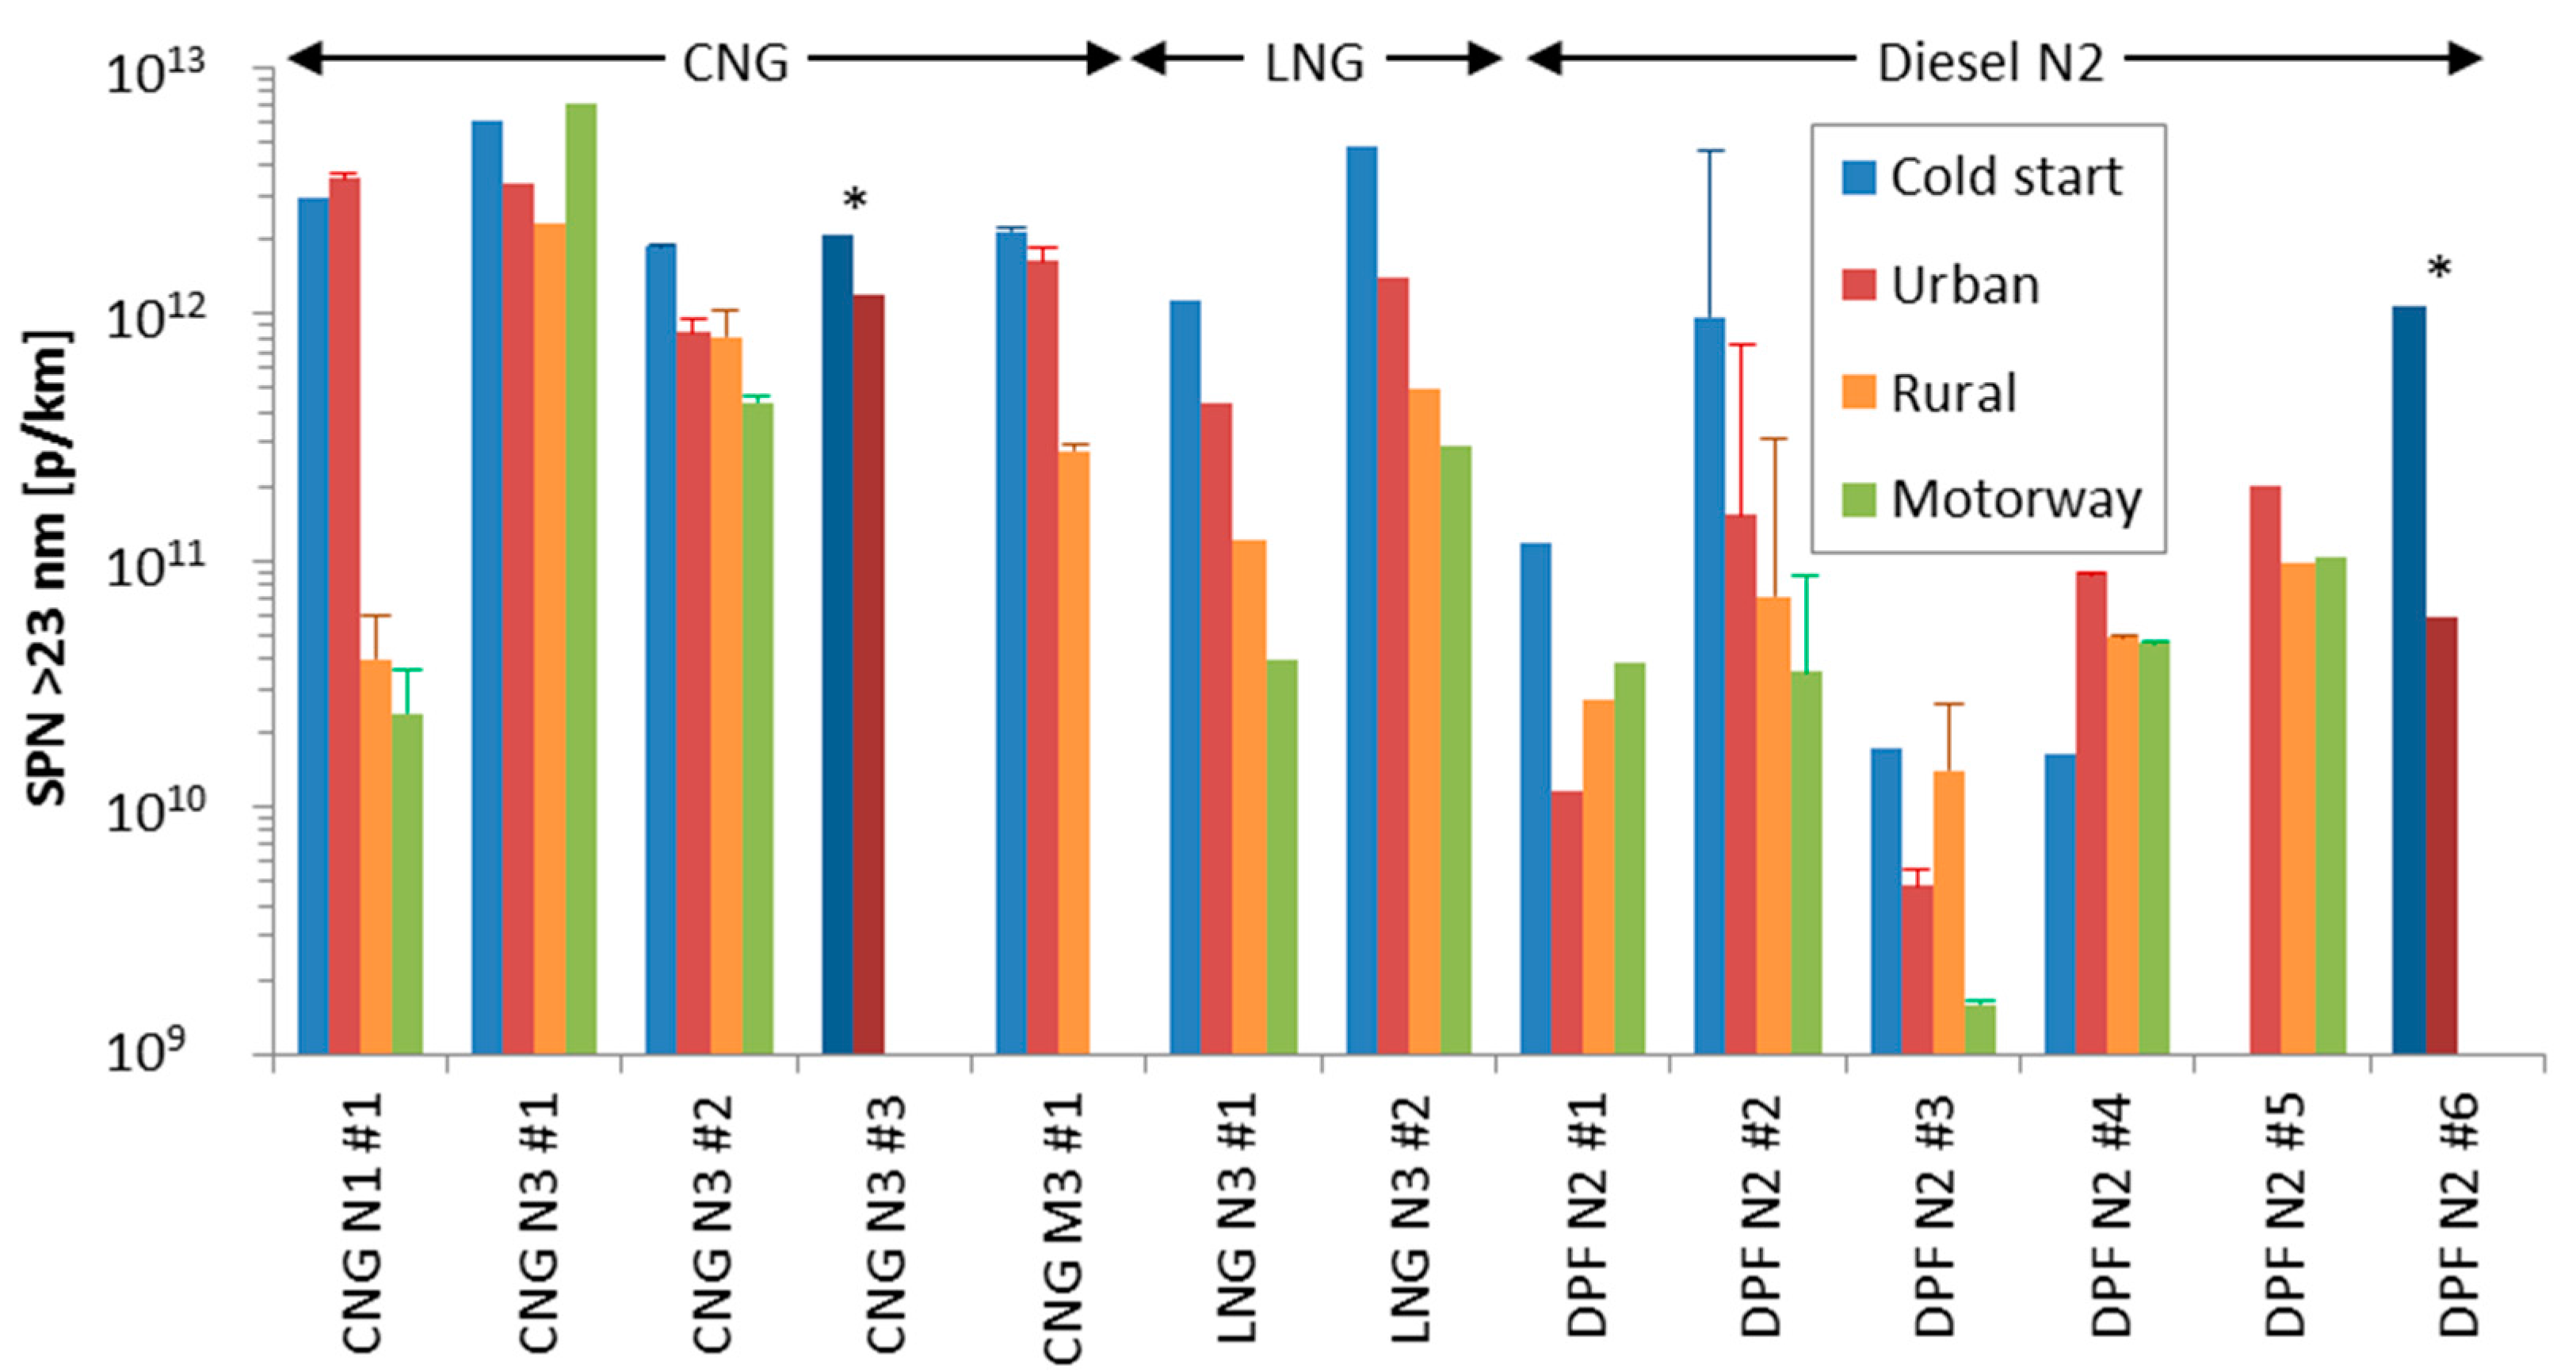

Figure 4.
Overview of emission levels of different current vehicle categories, based on this study for the heavy-duty vehicles and the literature for the rest [53,66,67]. Dashed arrows on the left of the bars show reported range of an older SPN review [35]. Arrows on right shows suggested emission factors based on [68]. Error bars show one standard deviation (only positive side) for the number of vehicles shown in each bar. Horizontal lines give the European regulated SPN limits for SPN >23 nm. Note that for the GDIs of this figure the limit was 6 × 10¹² p/km (dotted line). The dashed line shows a limit of 6 × 10¹¹ p/km. However, the SPN limit applies only to heavy-duty engines (not vehicles) and is expressed in p/kWh. All tests at temperatures around 23 °C.
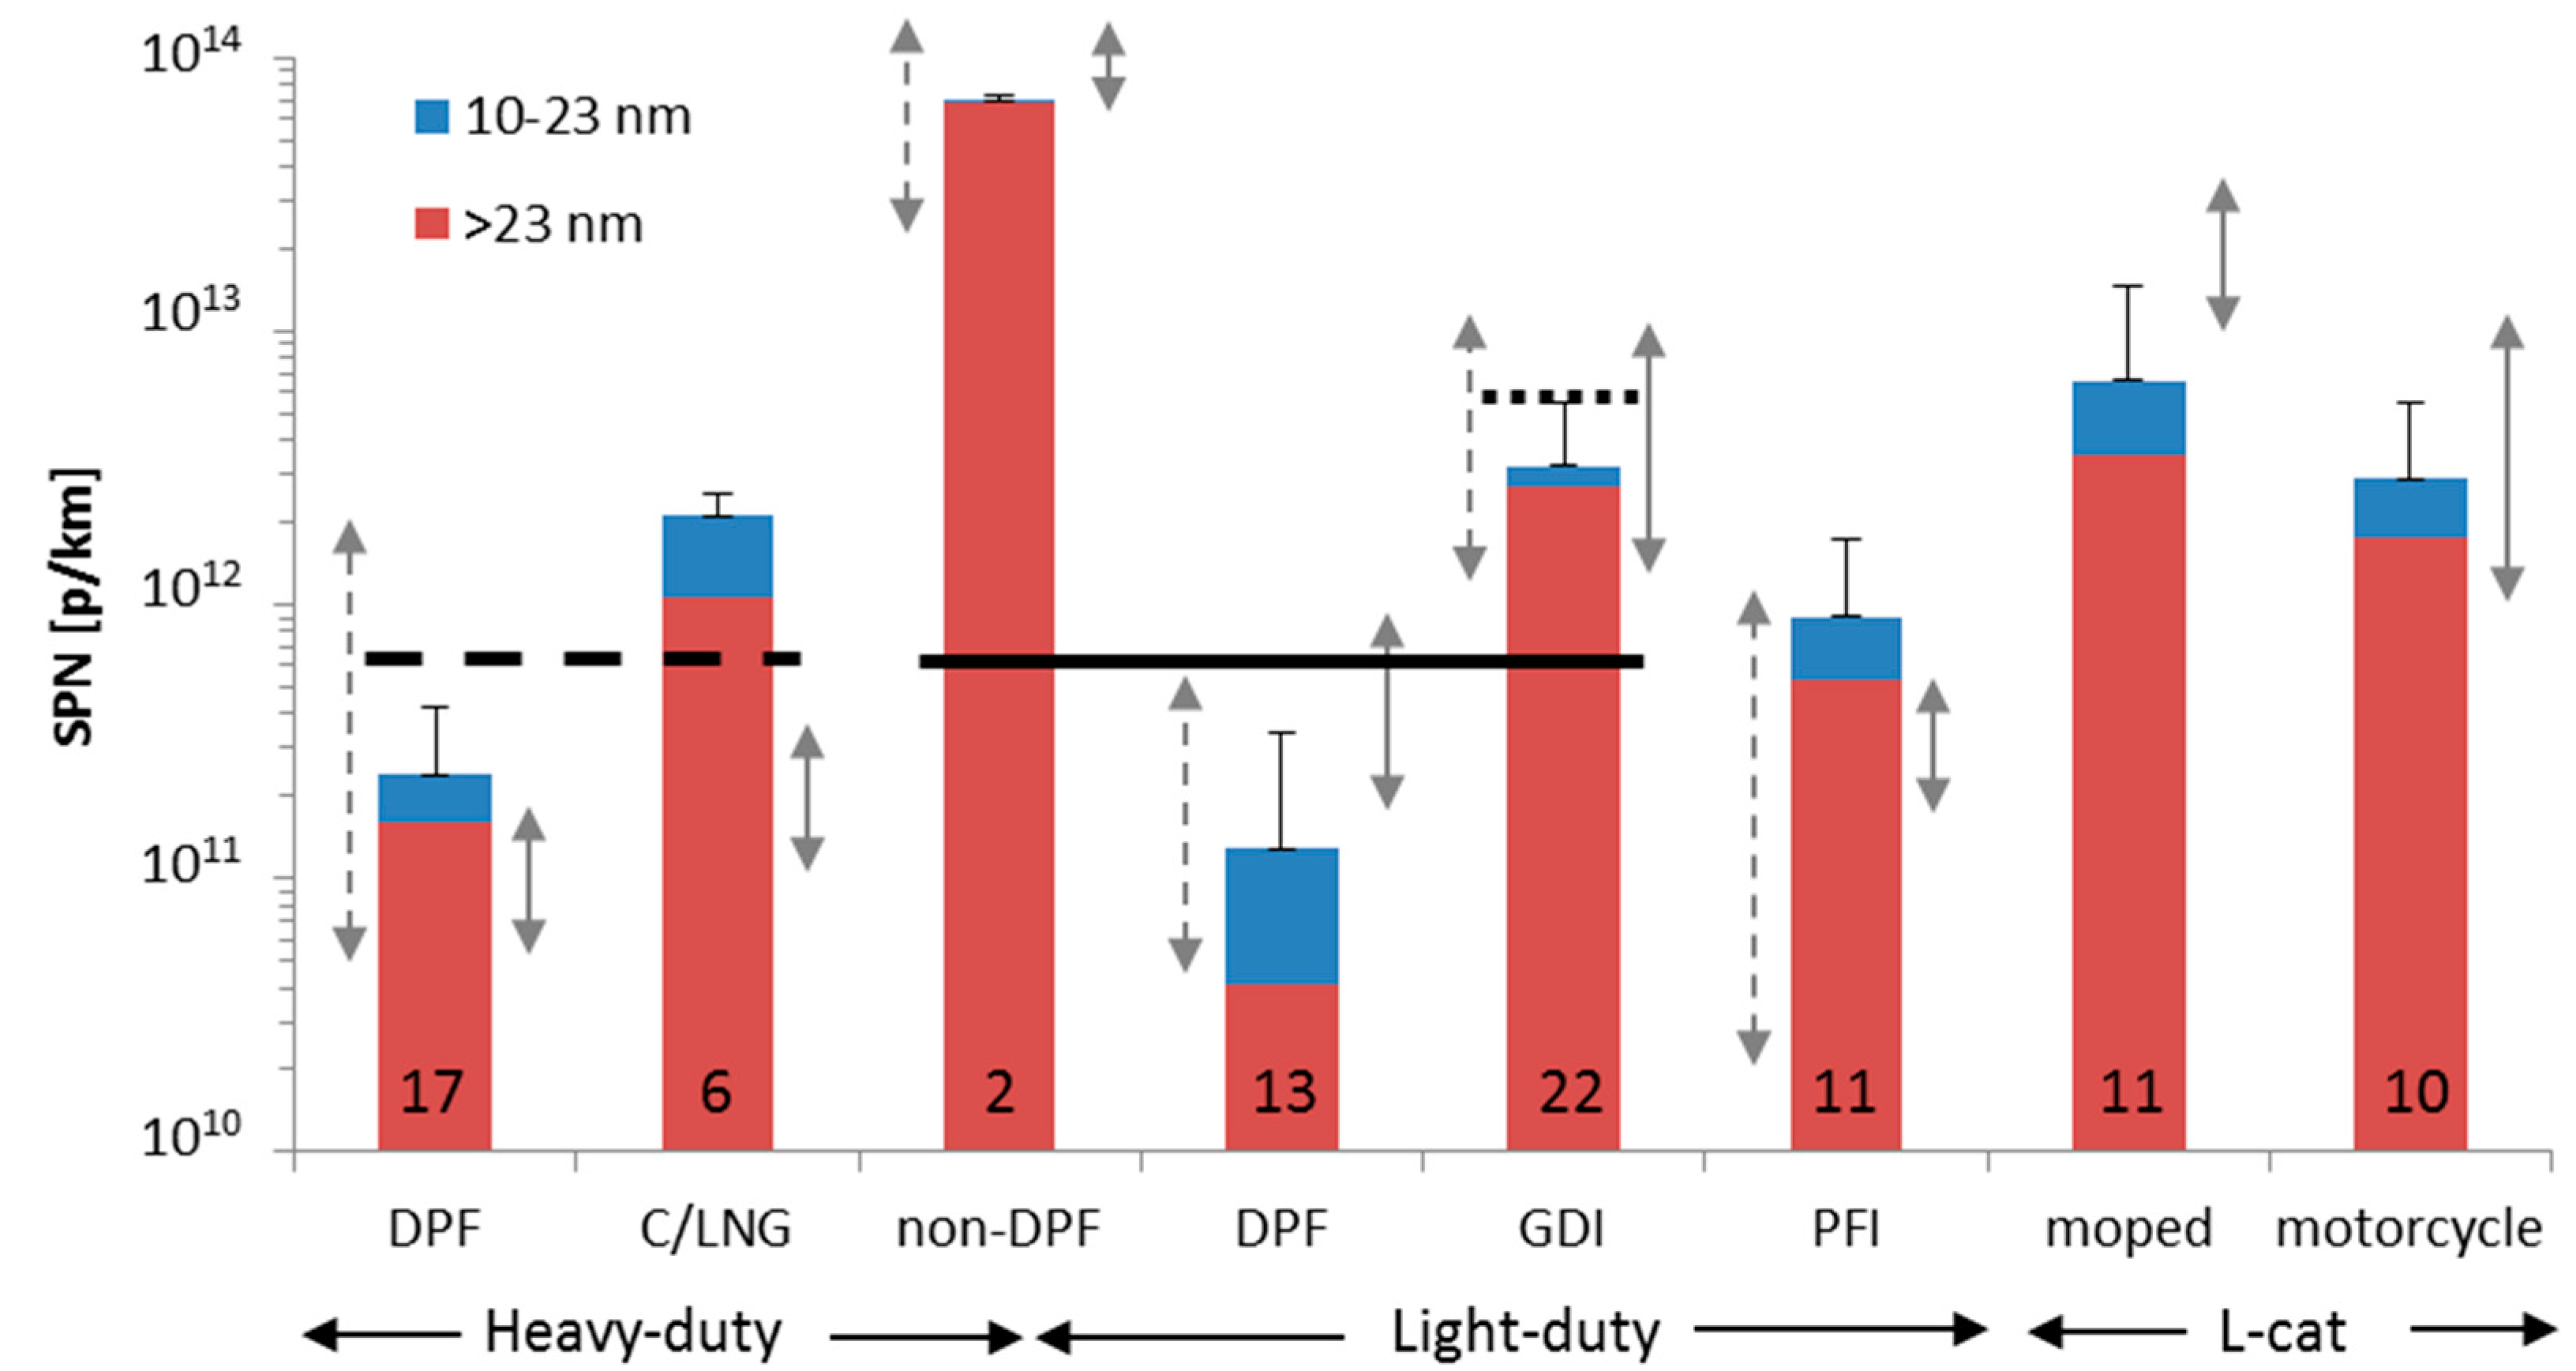
Figure 5.
Lower panel: NOx emissions during two WHVCs (first one with cold engine start). Upper panel: SPN emissions of the two WHVCs. Vehicle DPF N2 #3.
Figure 5.
Lower panel: NOx emissions during two WHVCs (first one with cold engine start). Upper panel: SPN emissions of the two WHVCs. Vehicle DPF N2 #3.
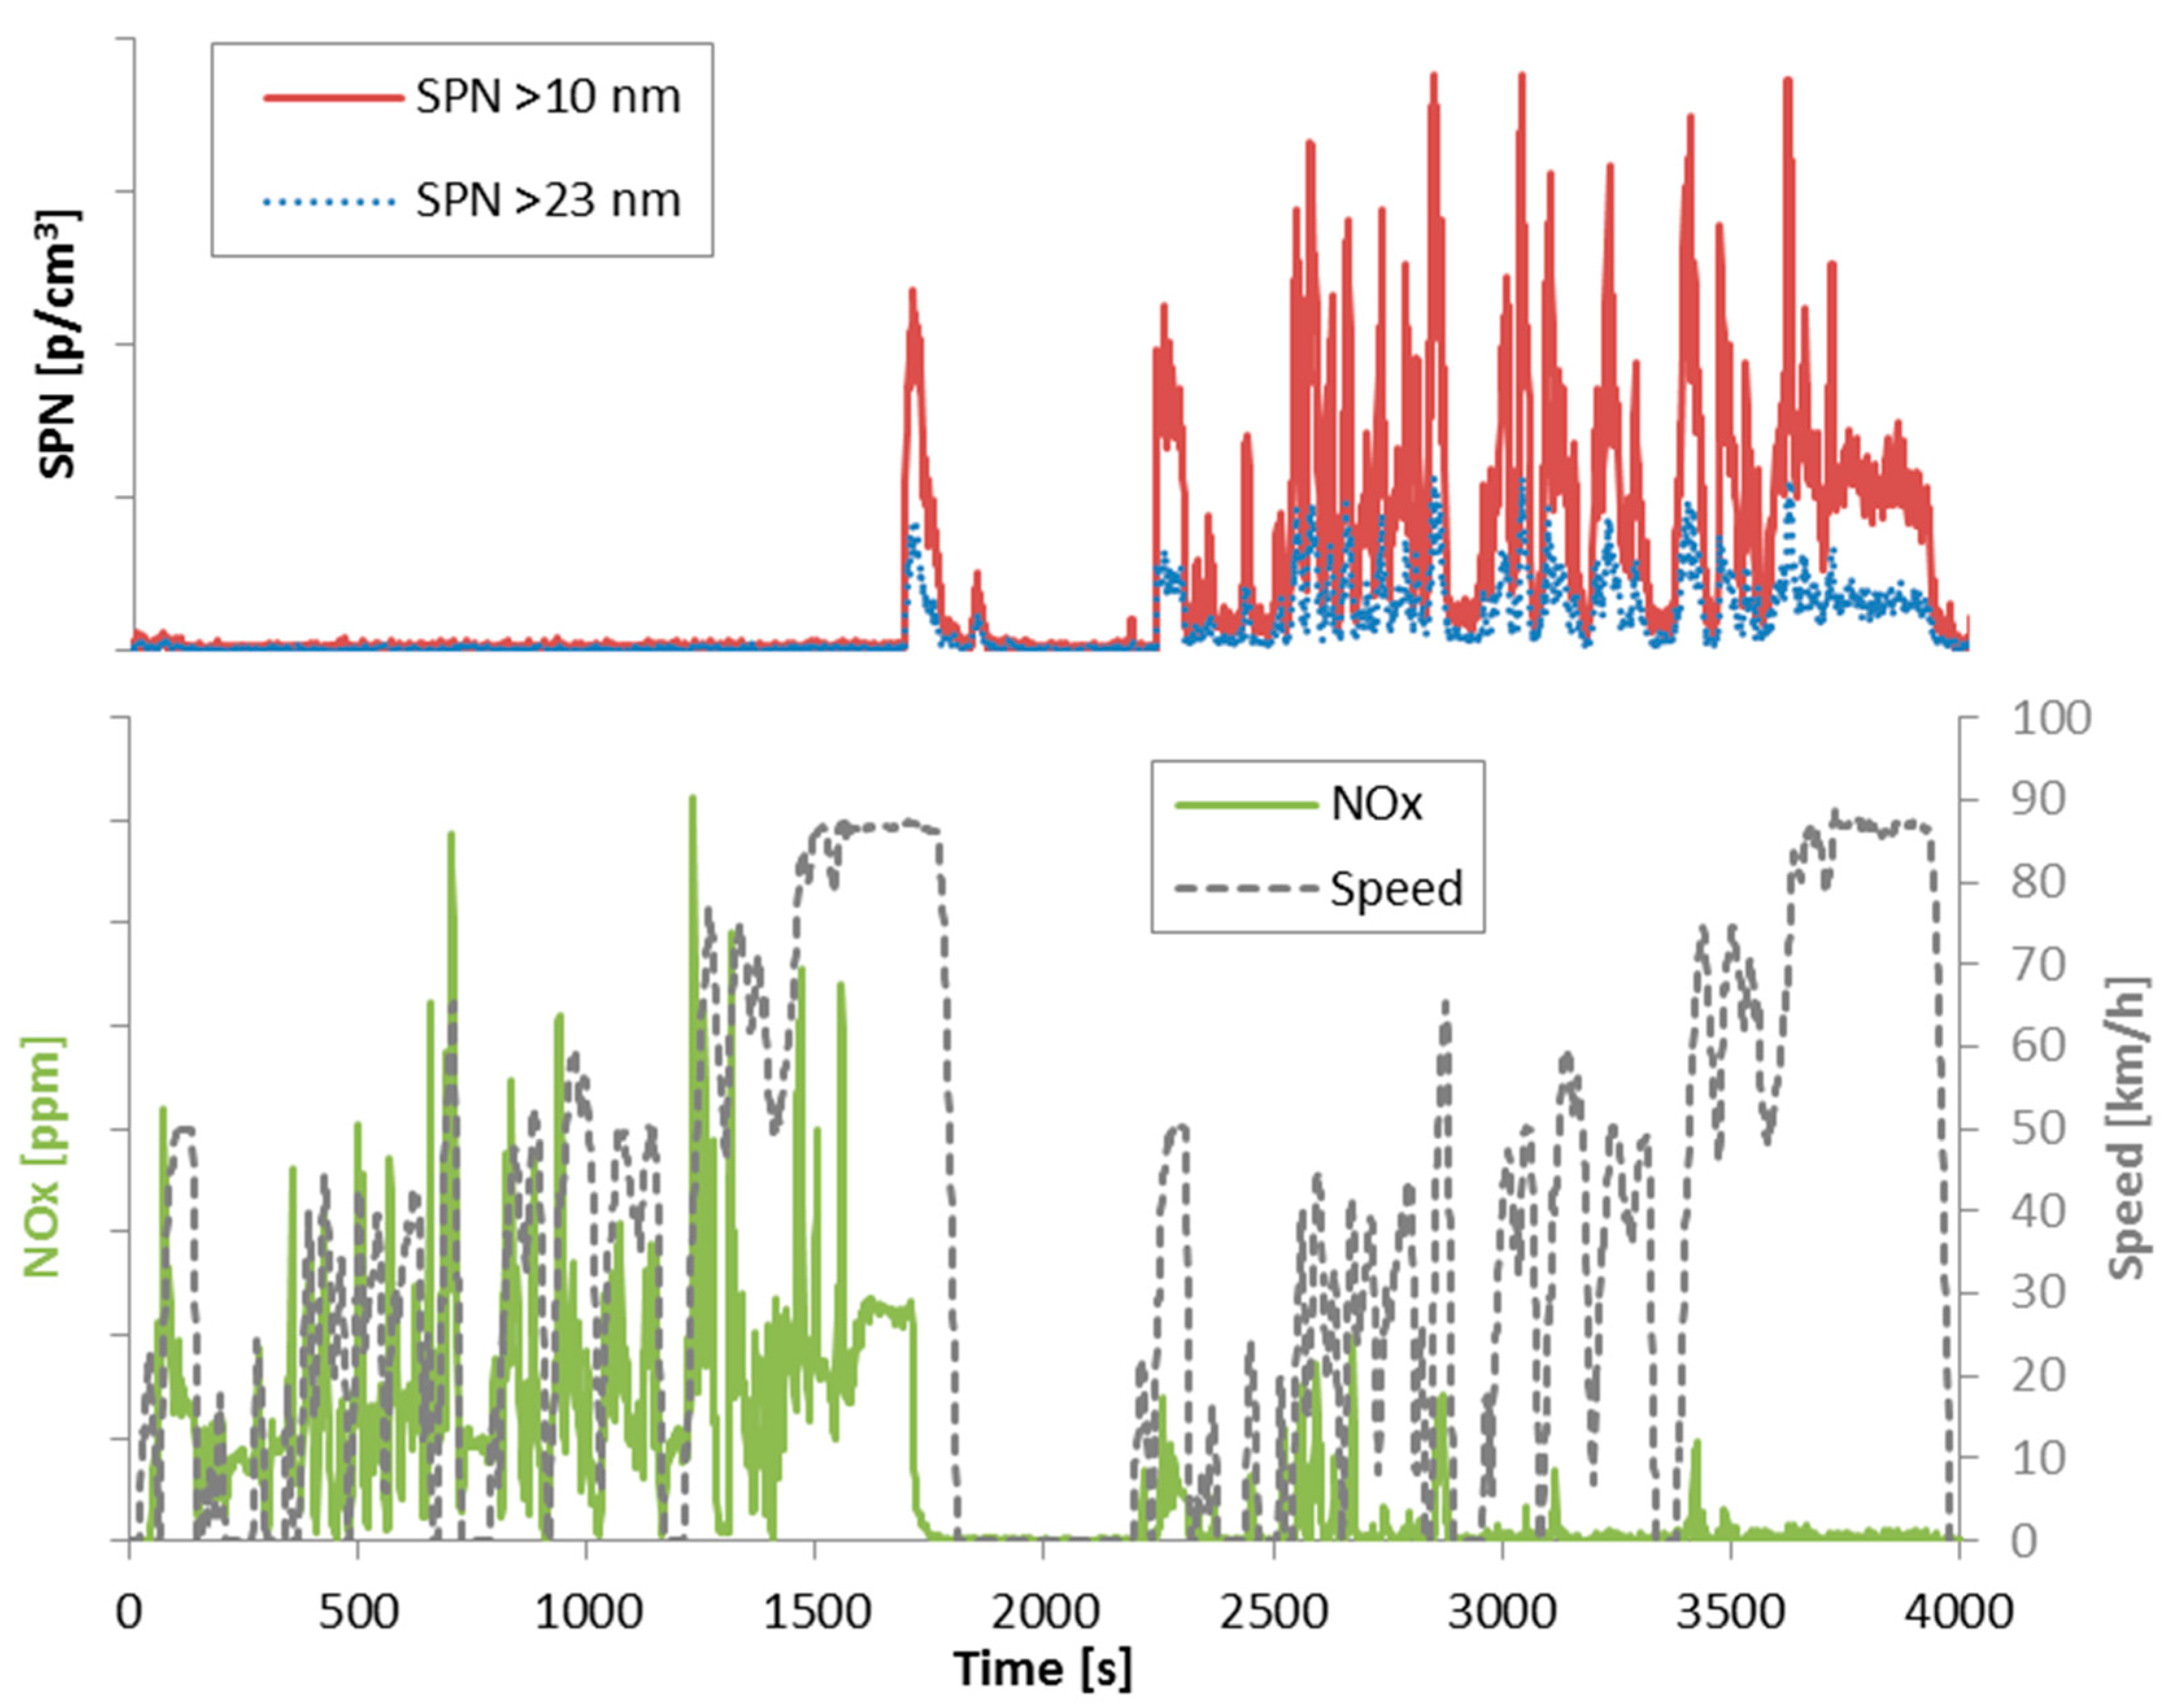
Figure 6.
Urban phase with cold (solid symbols) or hot (open symbols) engine start at different ambient temperatures for different vehicles. Temperatures have been shifted ±1 °C for better visualization.
Figure 6.
Urban phase with cold (solid symbols) or hot (open symbols) engine start at different ambient temperatures for different vehicles. Temperatures have been shifted ±1 °C for better visualization.

Figure 7.
Correlation of different phases of WHVC and ISC cycles (cold start, urban, rural, motorway) in the laboratory and on the road. Symbols with grey background refer to urban cold start emissions.
Figure 7.
Correlation of different phases of WHVC and ISC cycles (cold start, urban, rural, motorway) in the laboratory and on the road. Symbols with grey background refer to urban cold start emissions.

Figure 8.
Examples of regeneration events. Left: Dashboard activated regeneration for three parked vehicles (time axis shifted for better visualization). Each color line refers to a different vehicle. Right: Two similar trips of vehicle DPF N3 #3b; one with regeneration, the other without.
Figure 8.
Examples of regeneration events. Left: Dashboard activated regeneration for three parked vehicles (time axis shifted for better visualization). Each color line refers to a different vehicle. Right: Two similar trips of vehicle DPF N3 #3b; one with regeneration, the other without.

Figure 9.
Sub-23 nm fraction (corrected for particle losses) in function of the SPN >23 nm emissions. Vertical dashed line indicates a limit of 6 × 10¹¹ p/km for particles >23 nm in diameter (note that it is only an indication as the limit applies only to engines and is expressed in p/kWh). The other line indicates the same limit for particles >10 nm in diameter.

Figure 10.
SPN and PN (>10 nm) emissions from the dilution tunnel (CVS) during an ISC cycle at −7 °C. Vehicle DPF N3 #4b.
Figure 10.
SPN and PN (>10 nm) emissions from the dilution tunnel (CVS) during an ISC cycle at −7 °C. Vehicle DPF N3 #4b.

Figure 11.
SPN and total PN emissions during a test with different engine loads and speeds to induce nucleation mode particles. Vehicle DPF N3 #4b.
Figure 11.
SPN and total PN emissions during a test with different engine loads and speeds to induce nucleation mode particles. Vehicle DPF N3 #4b.
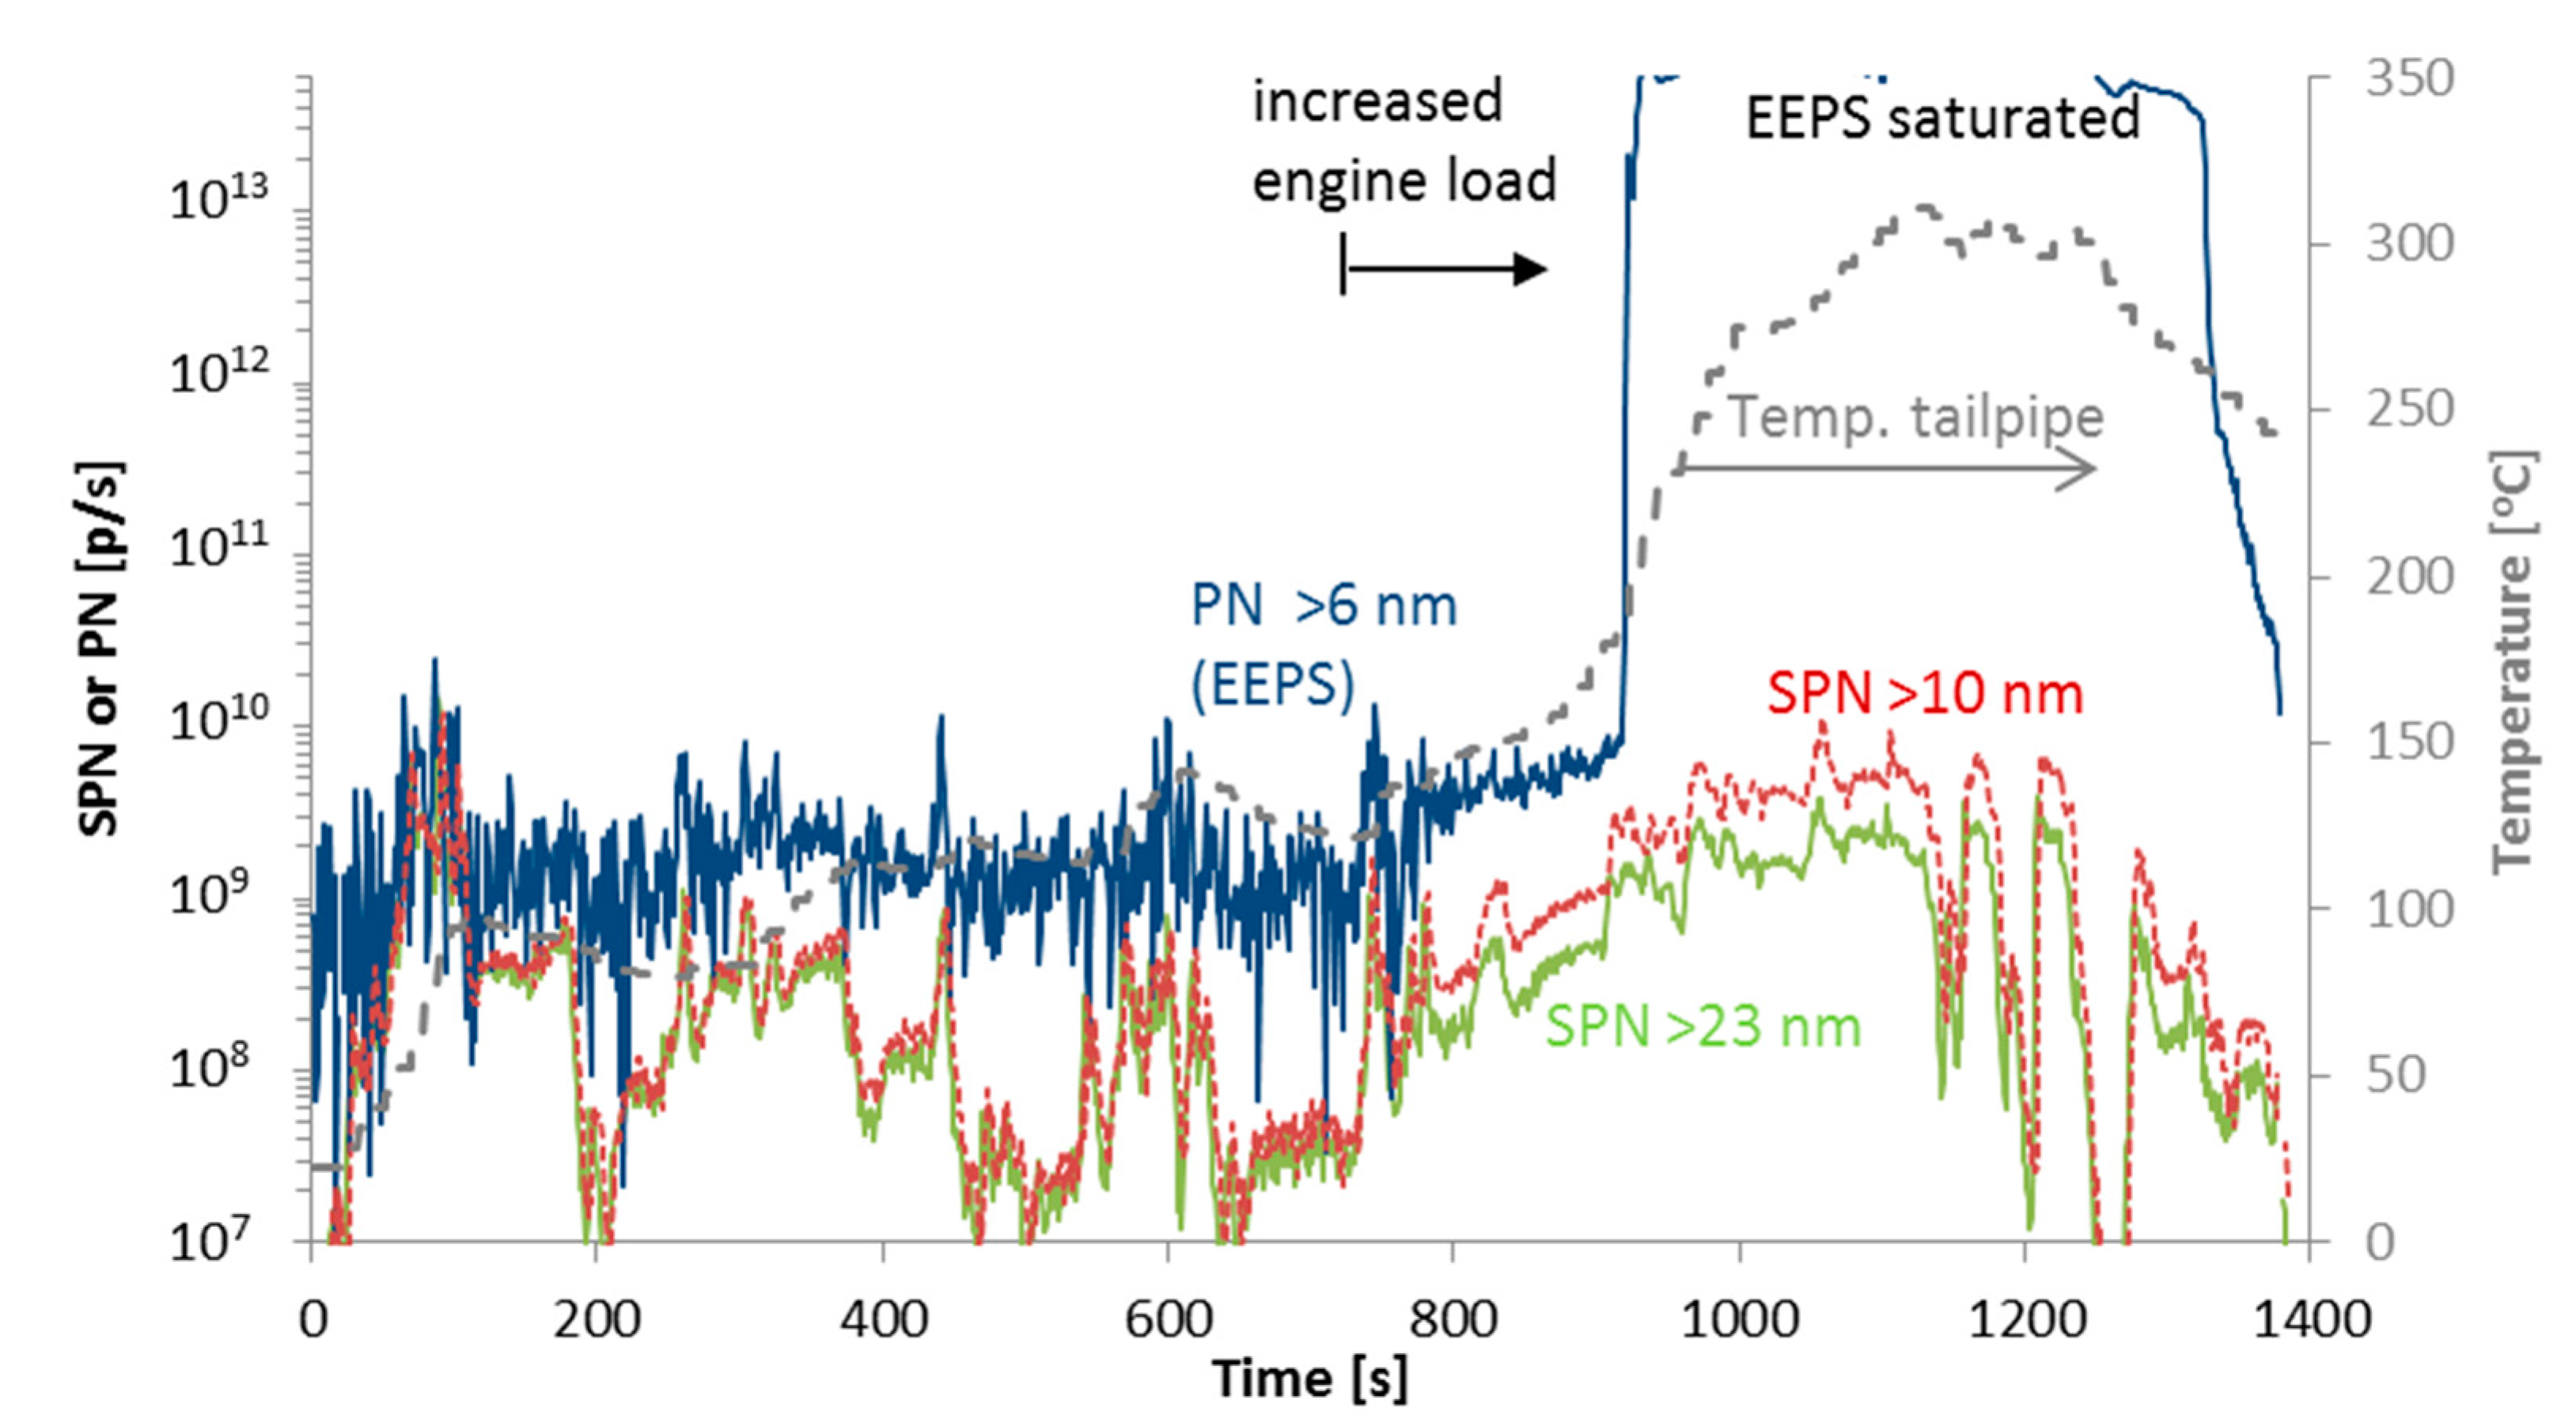

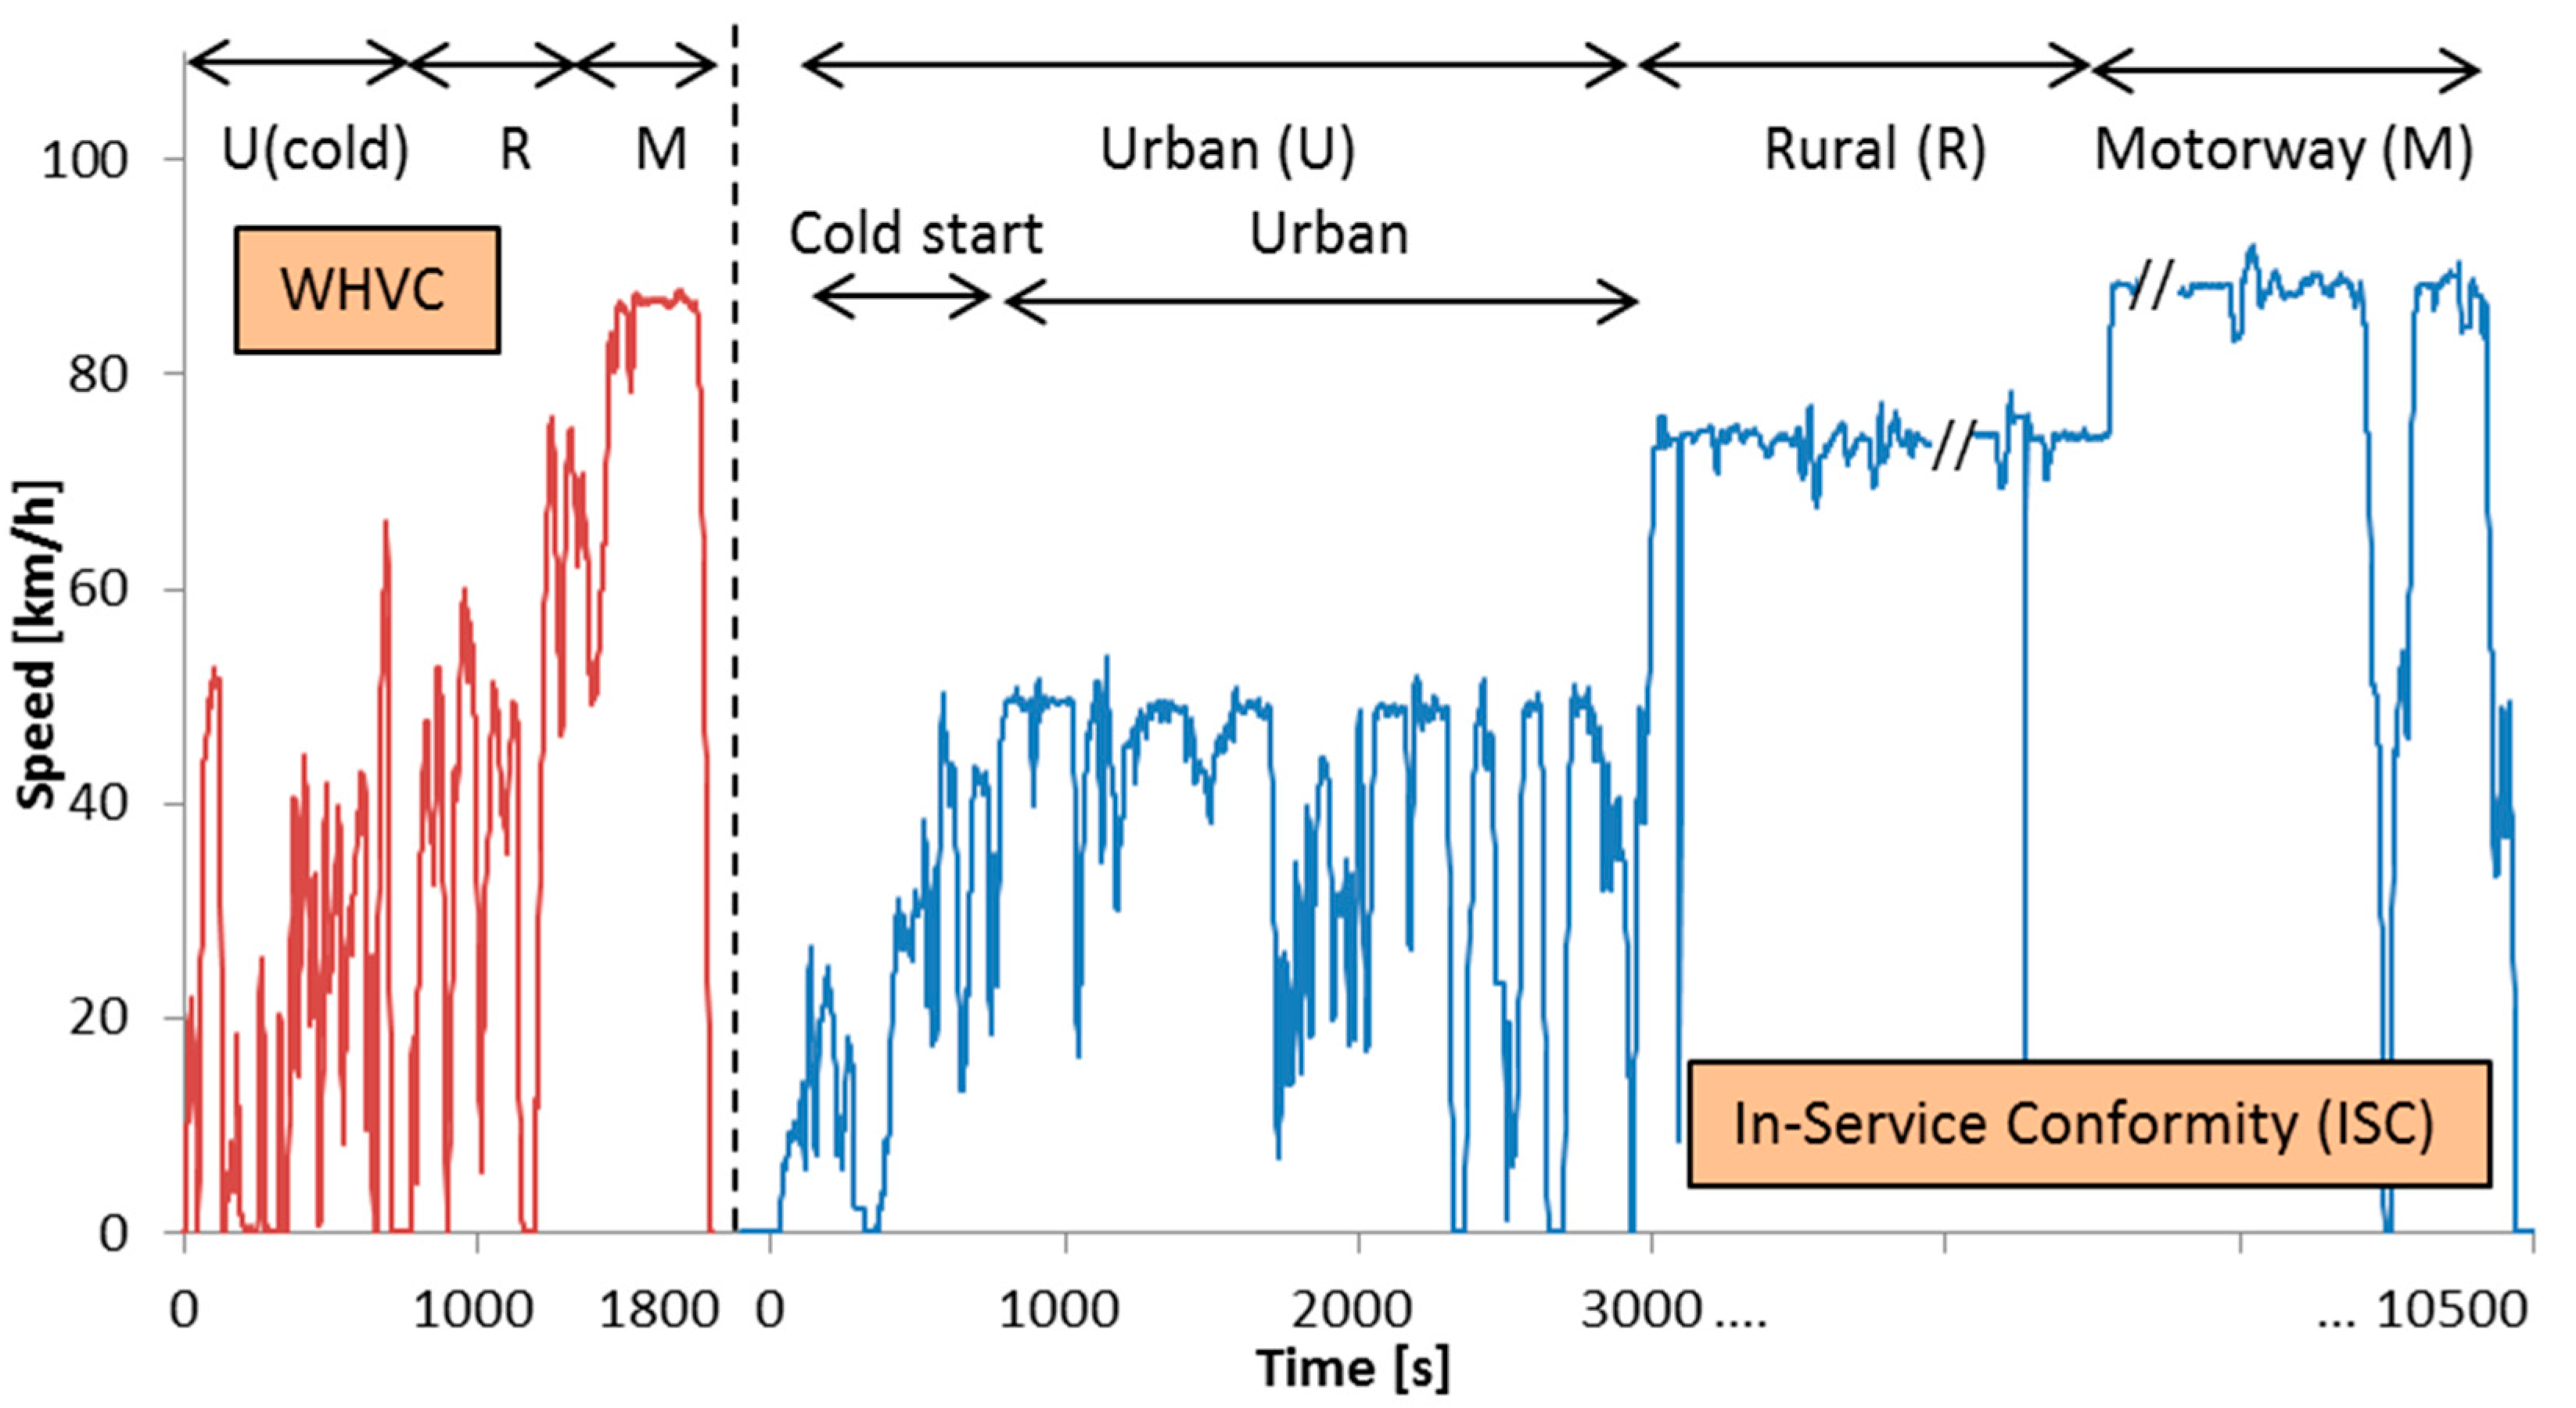
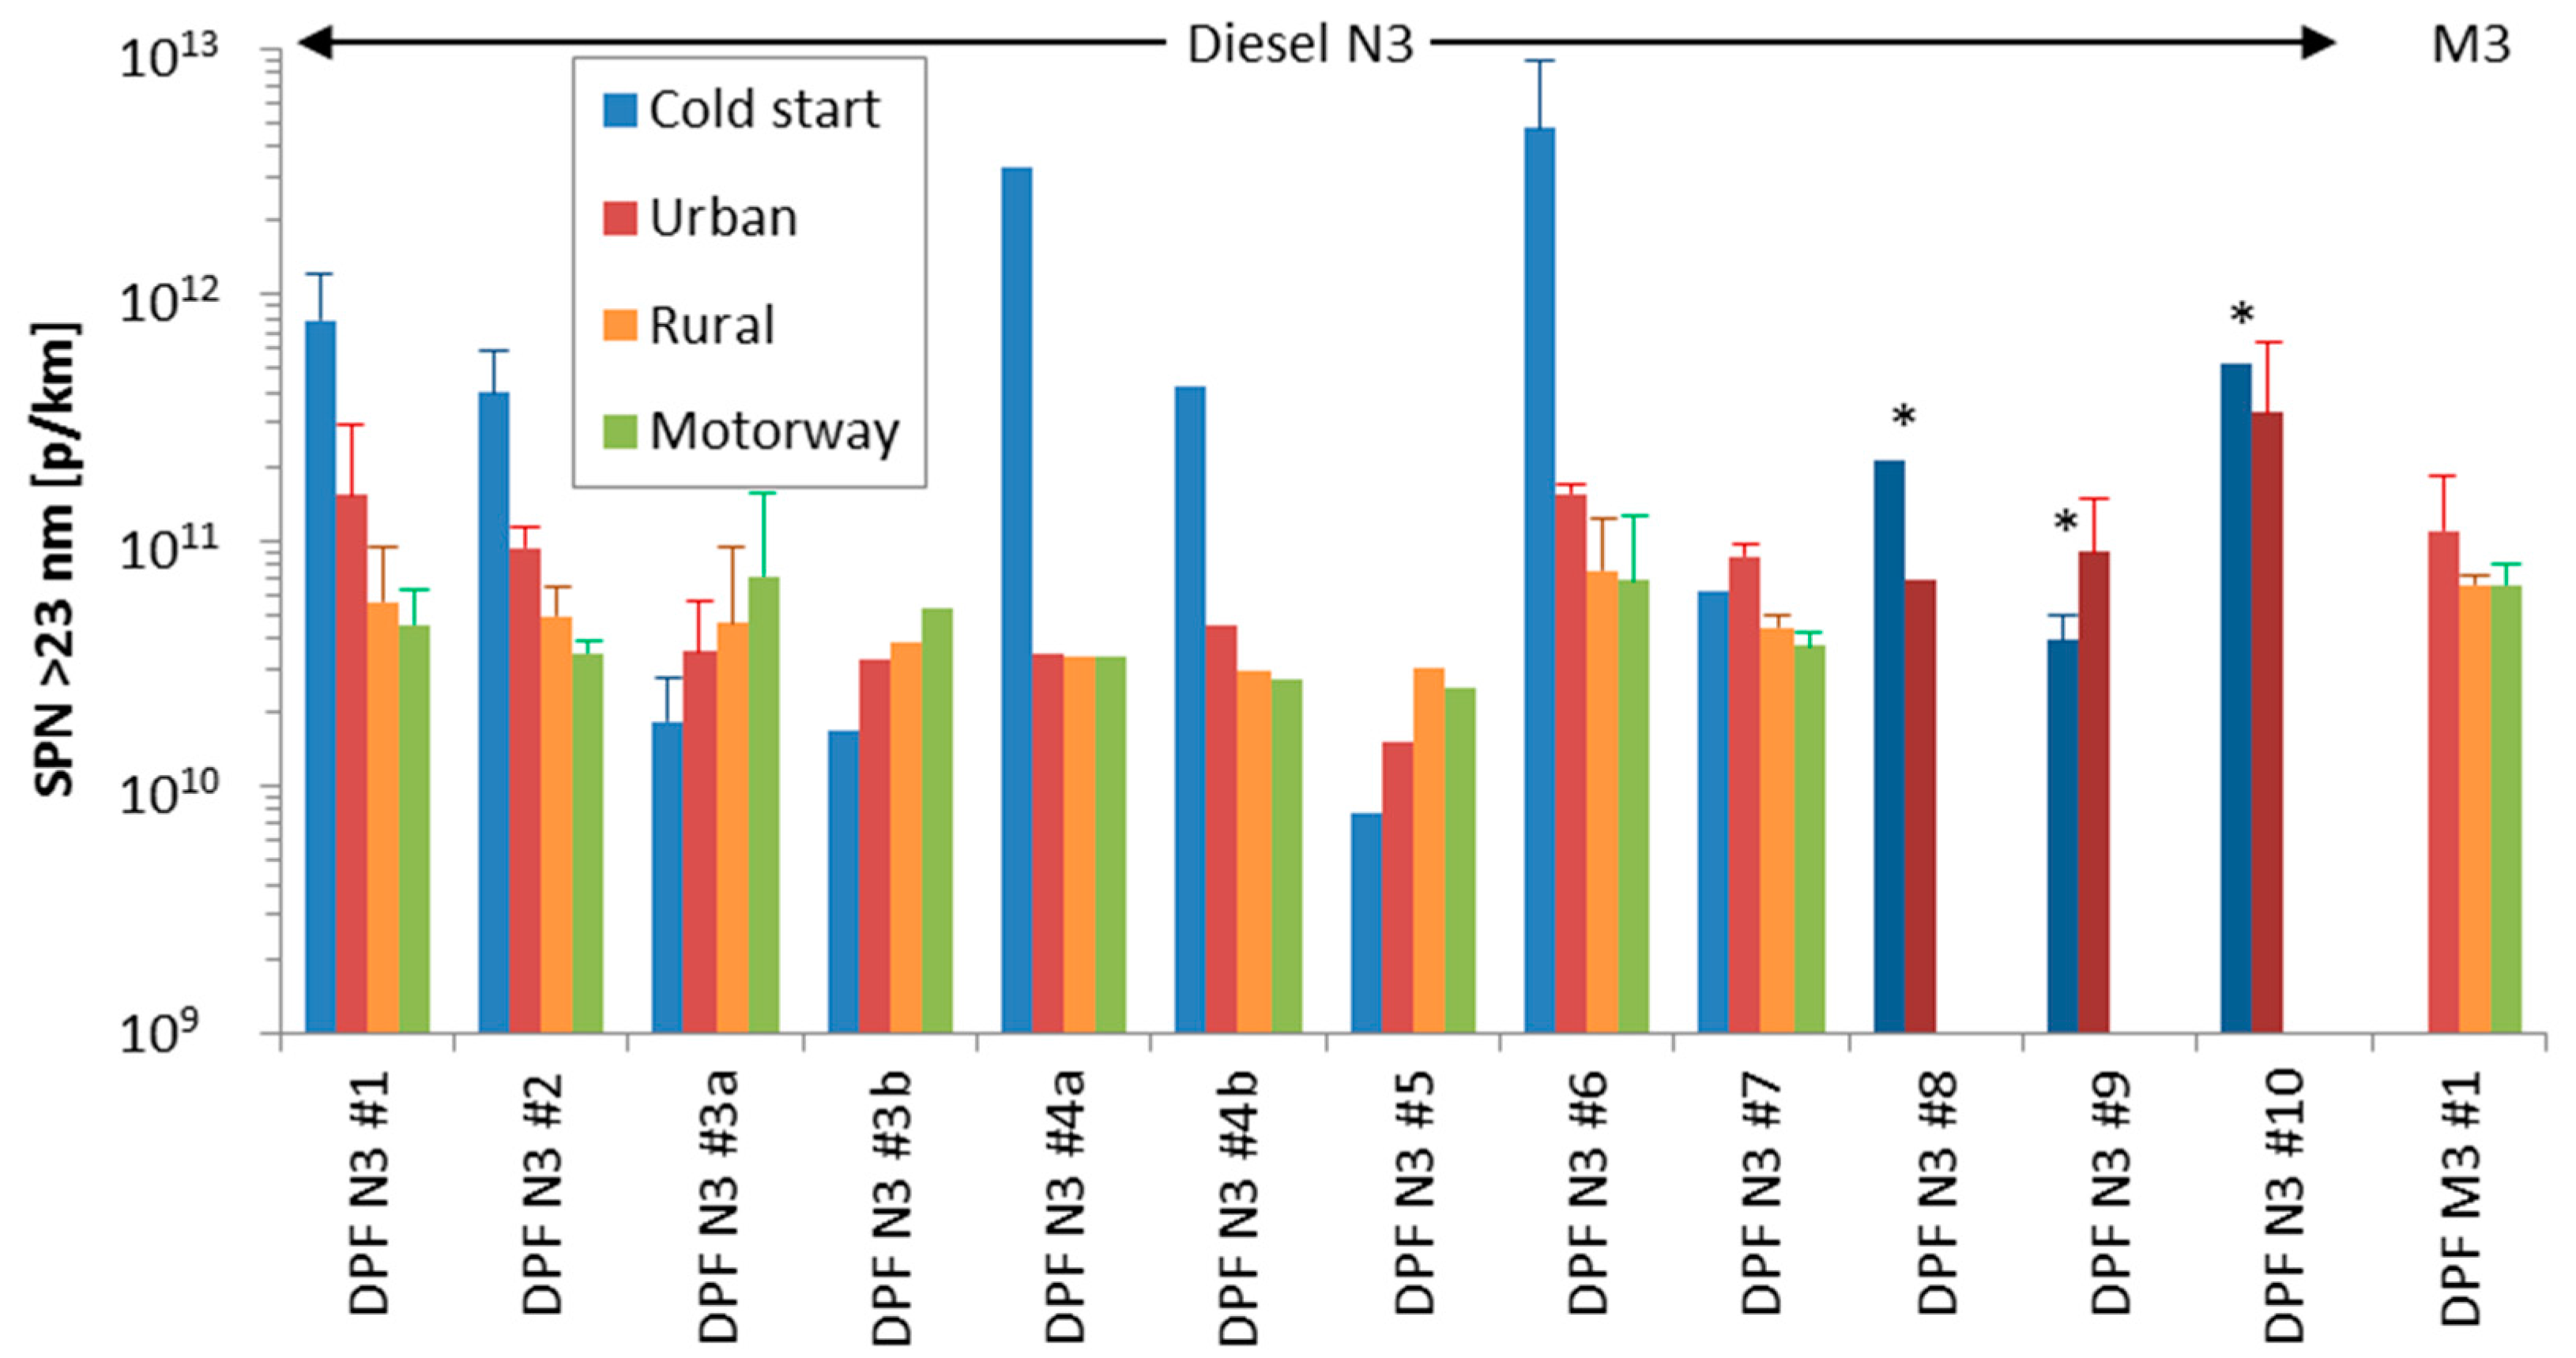
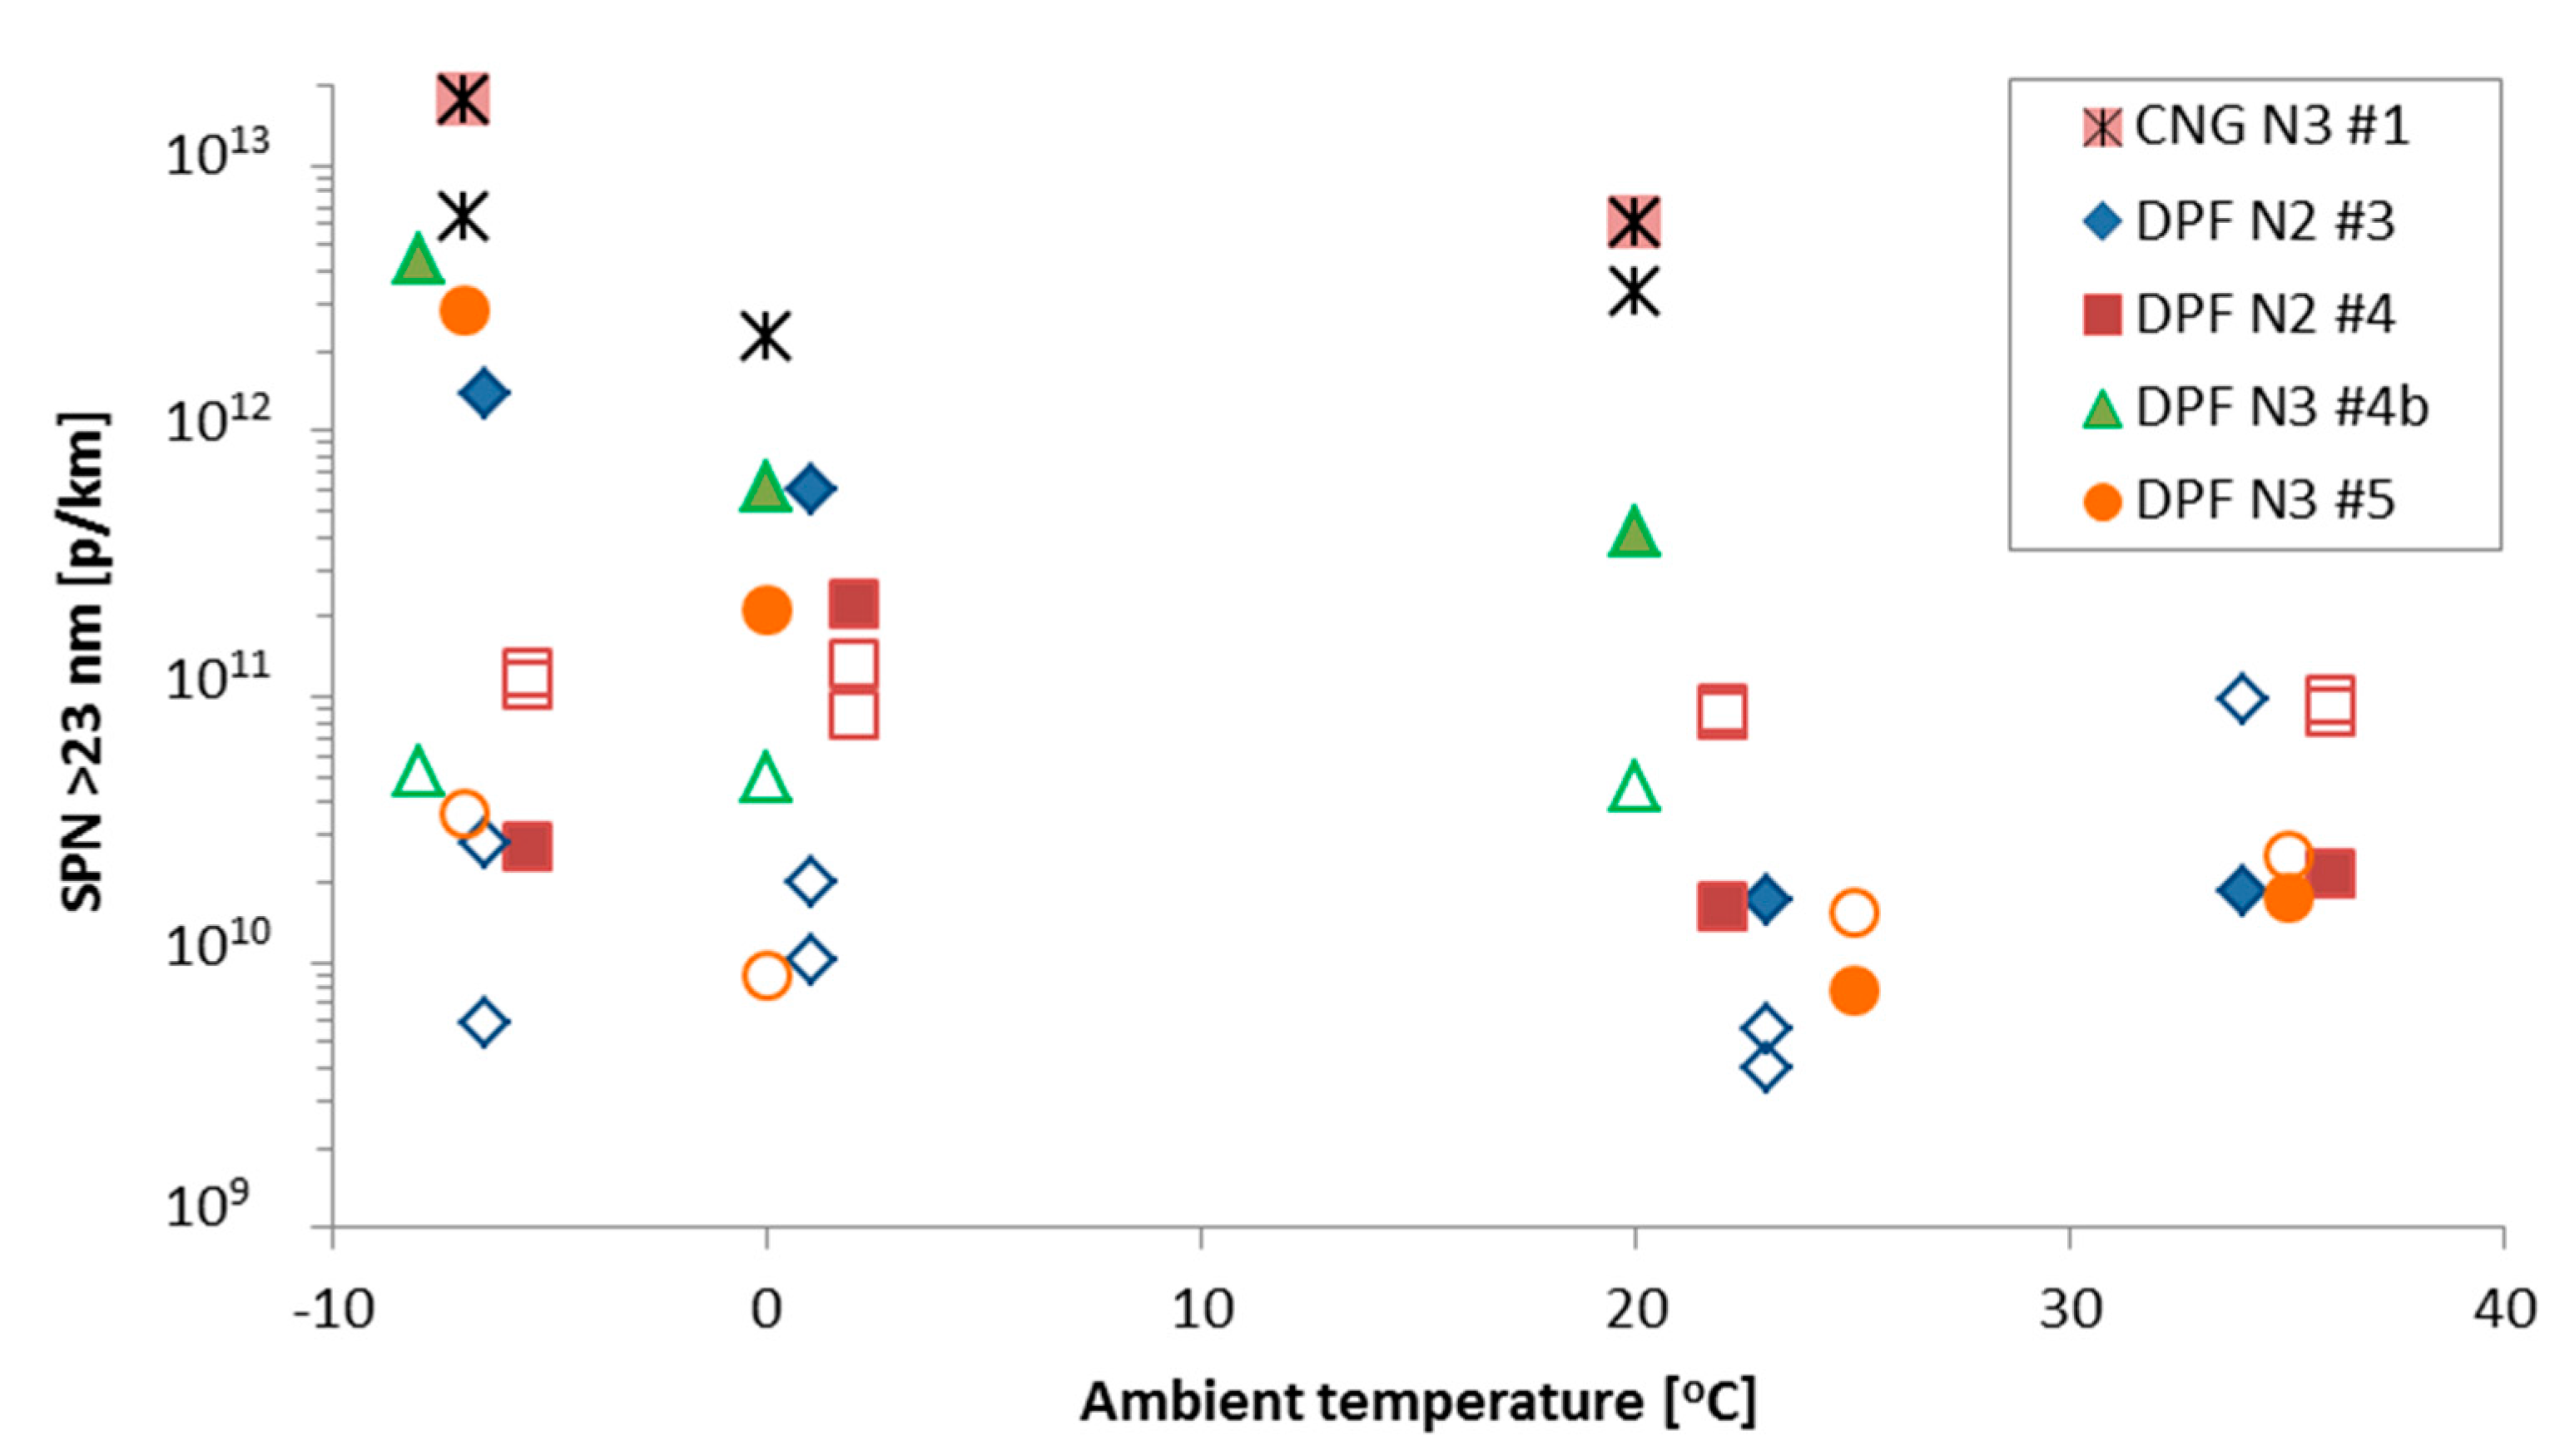
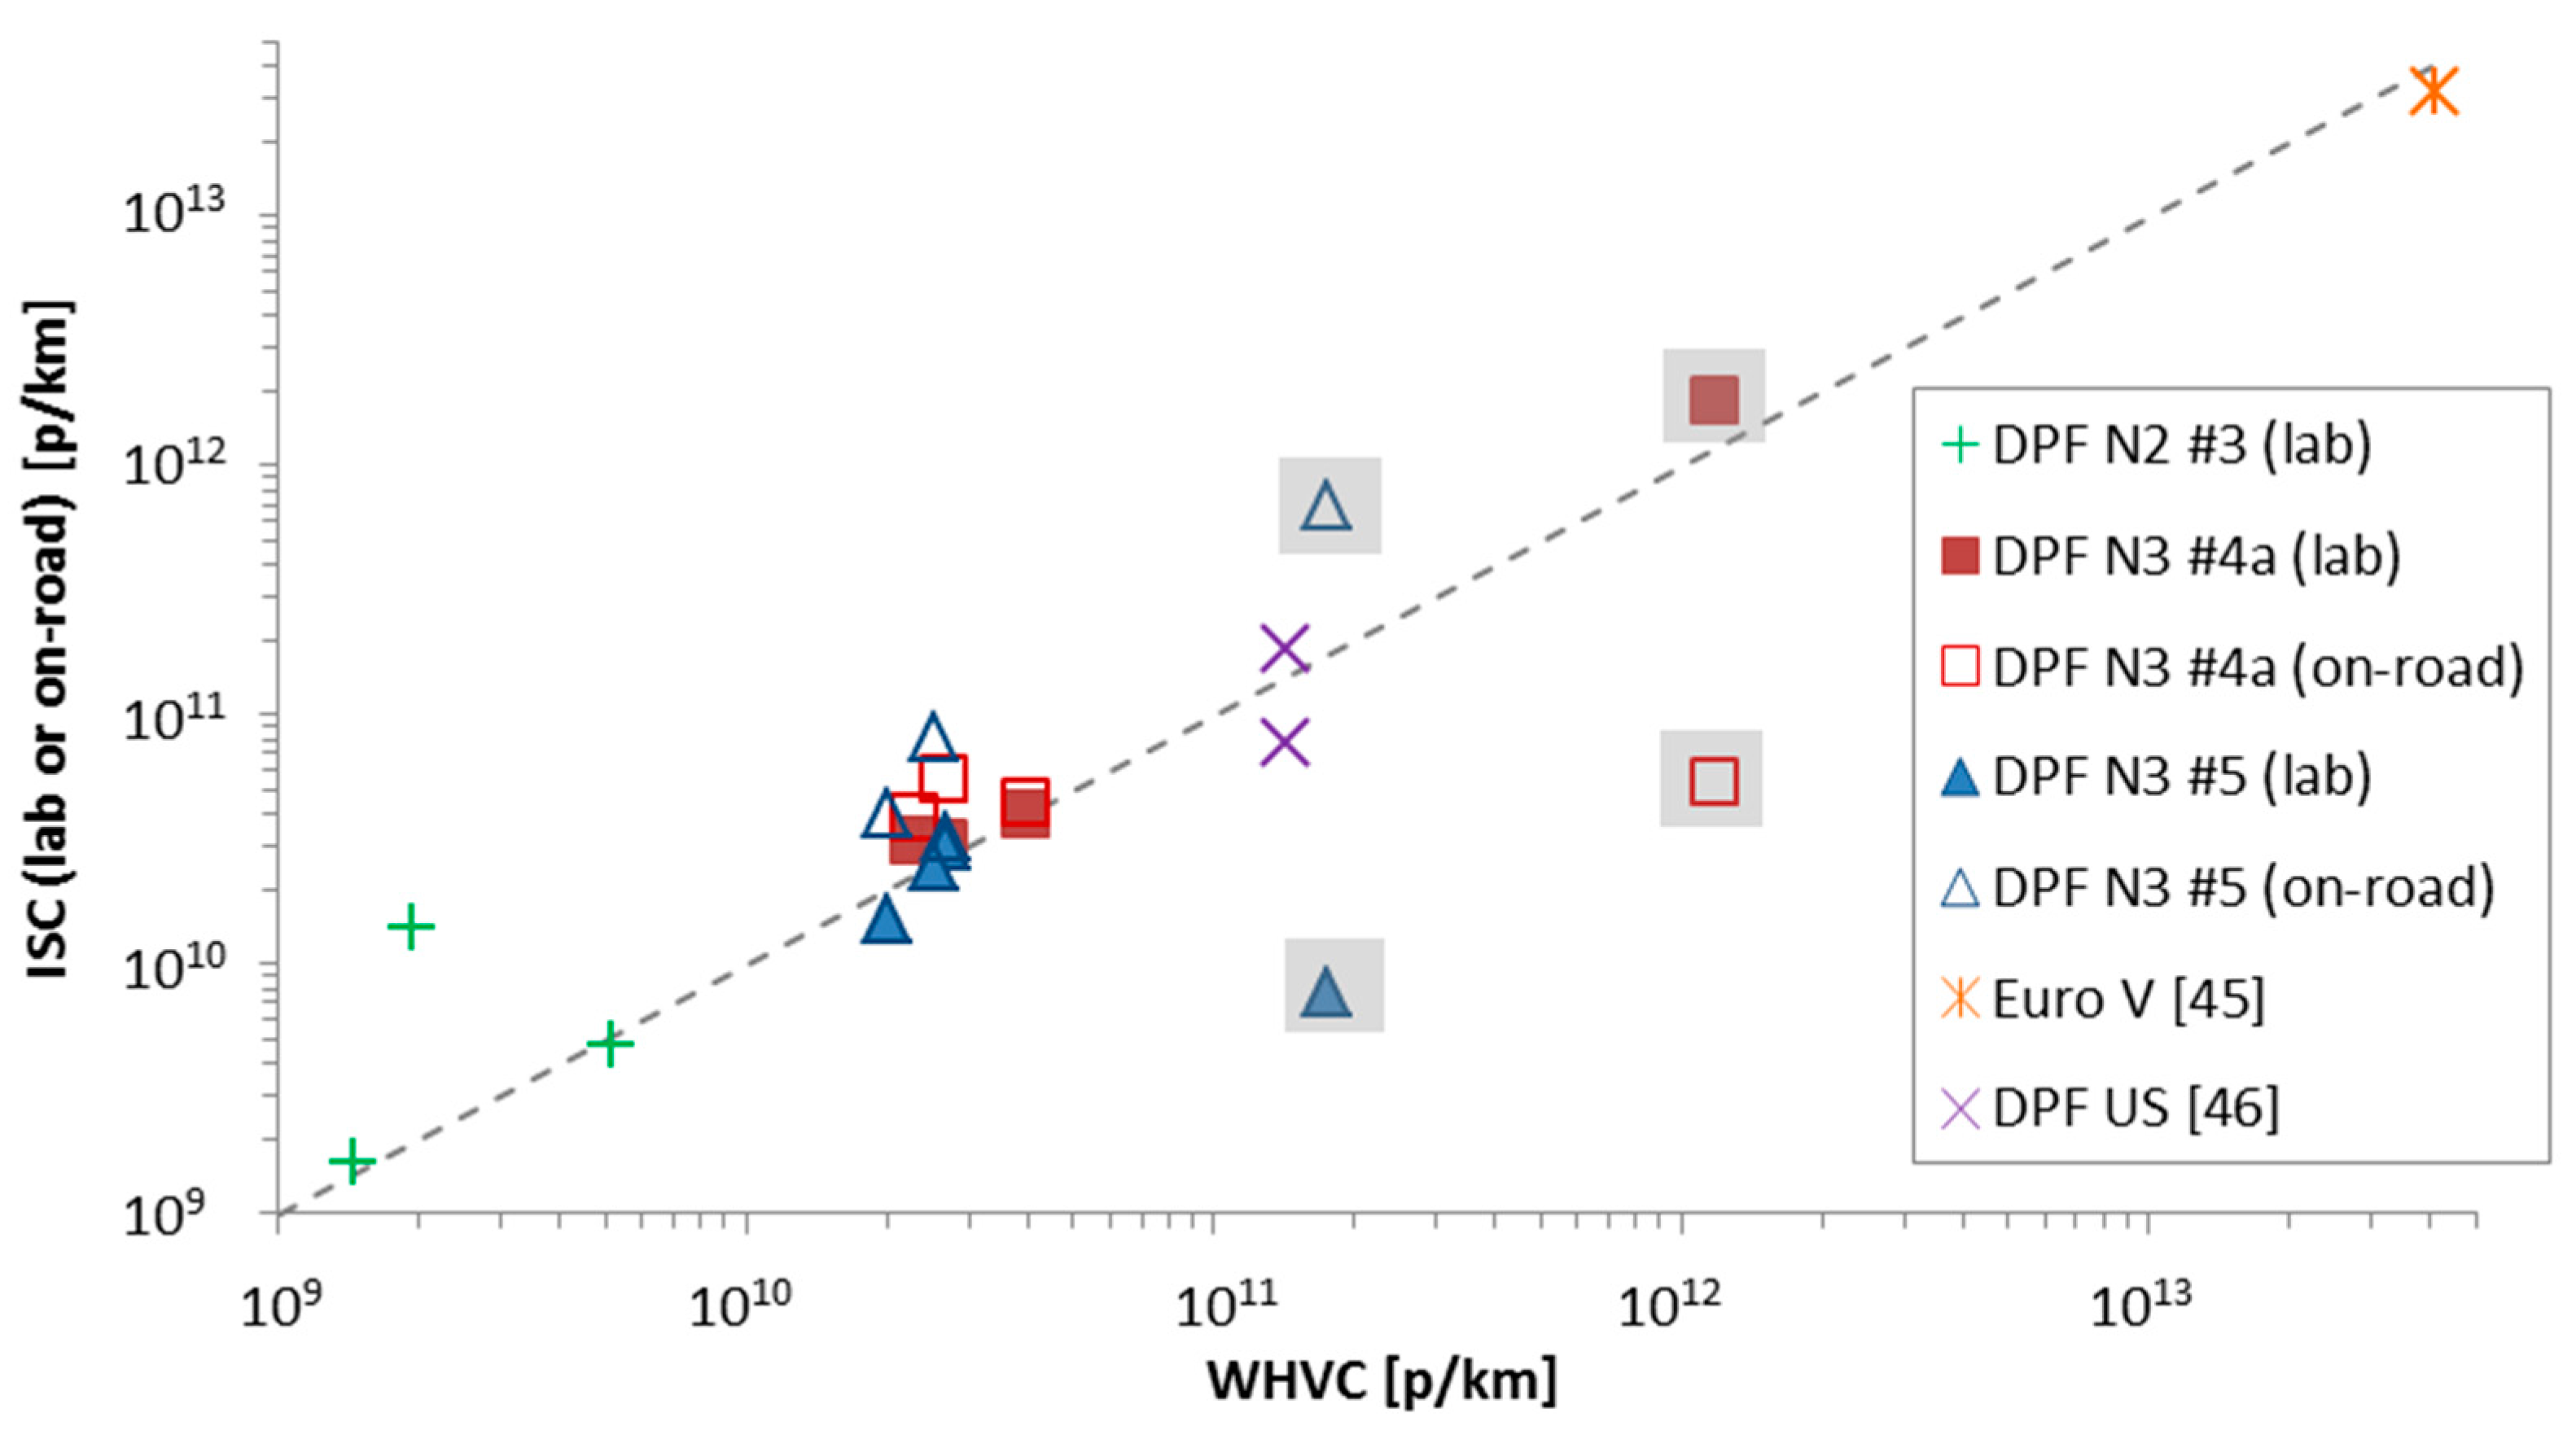
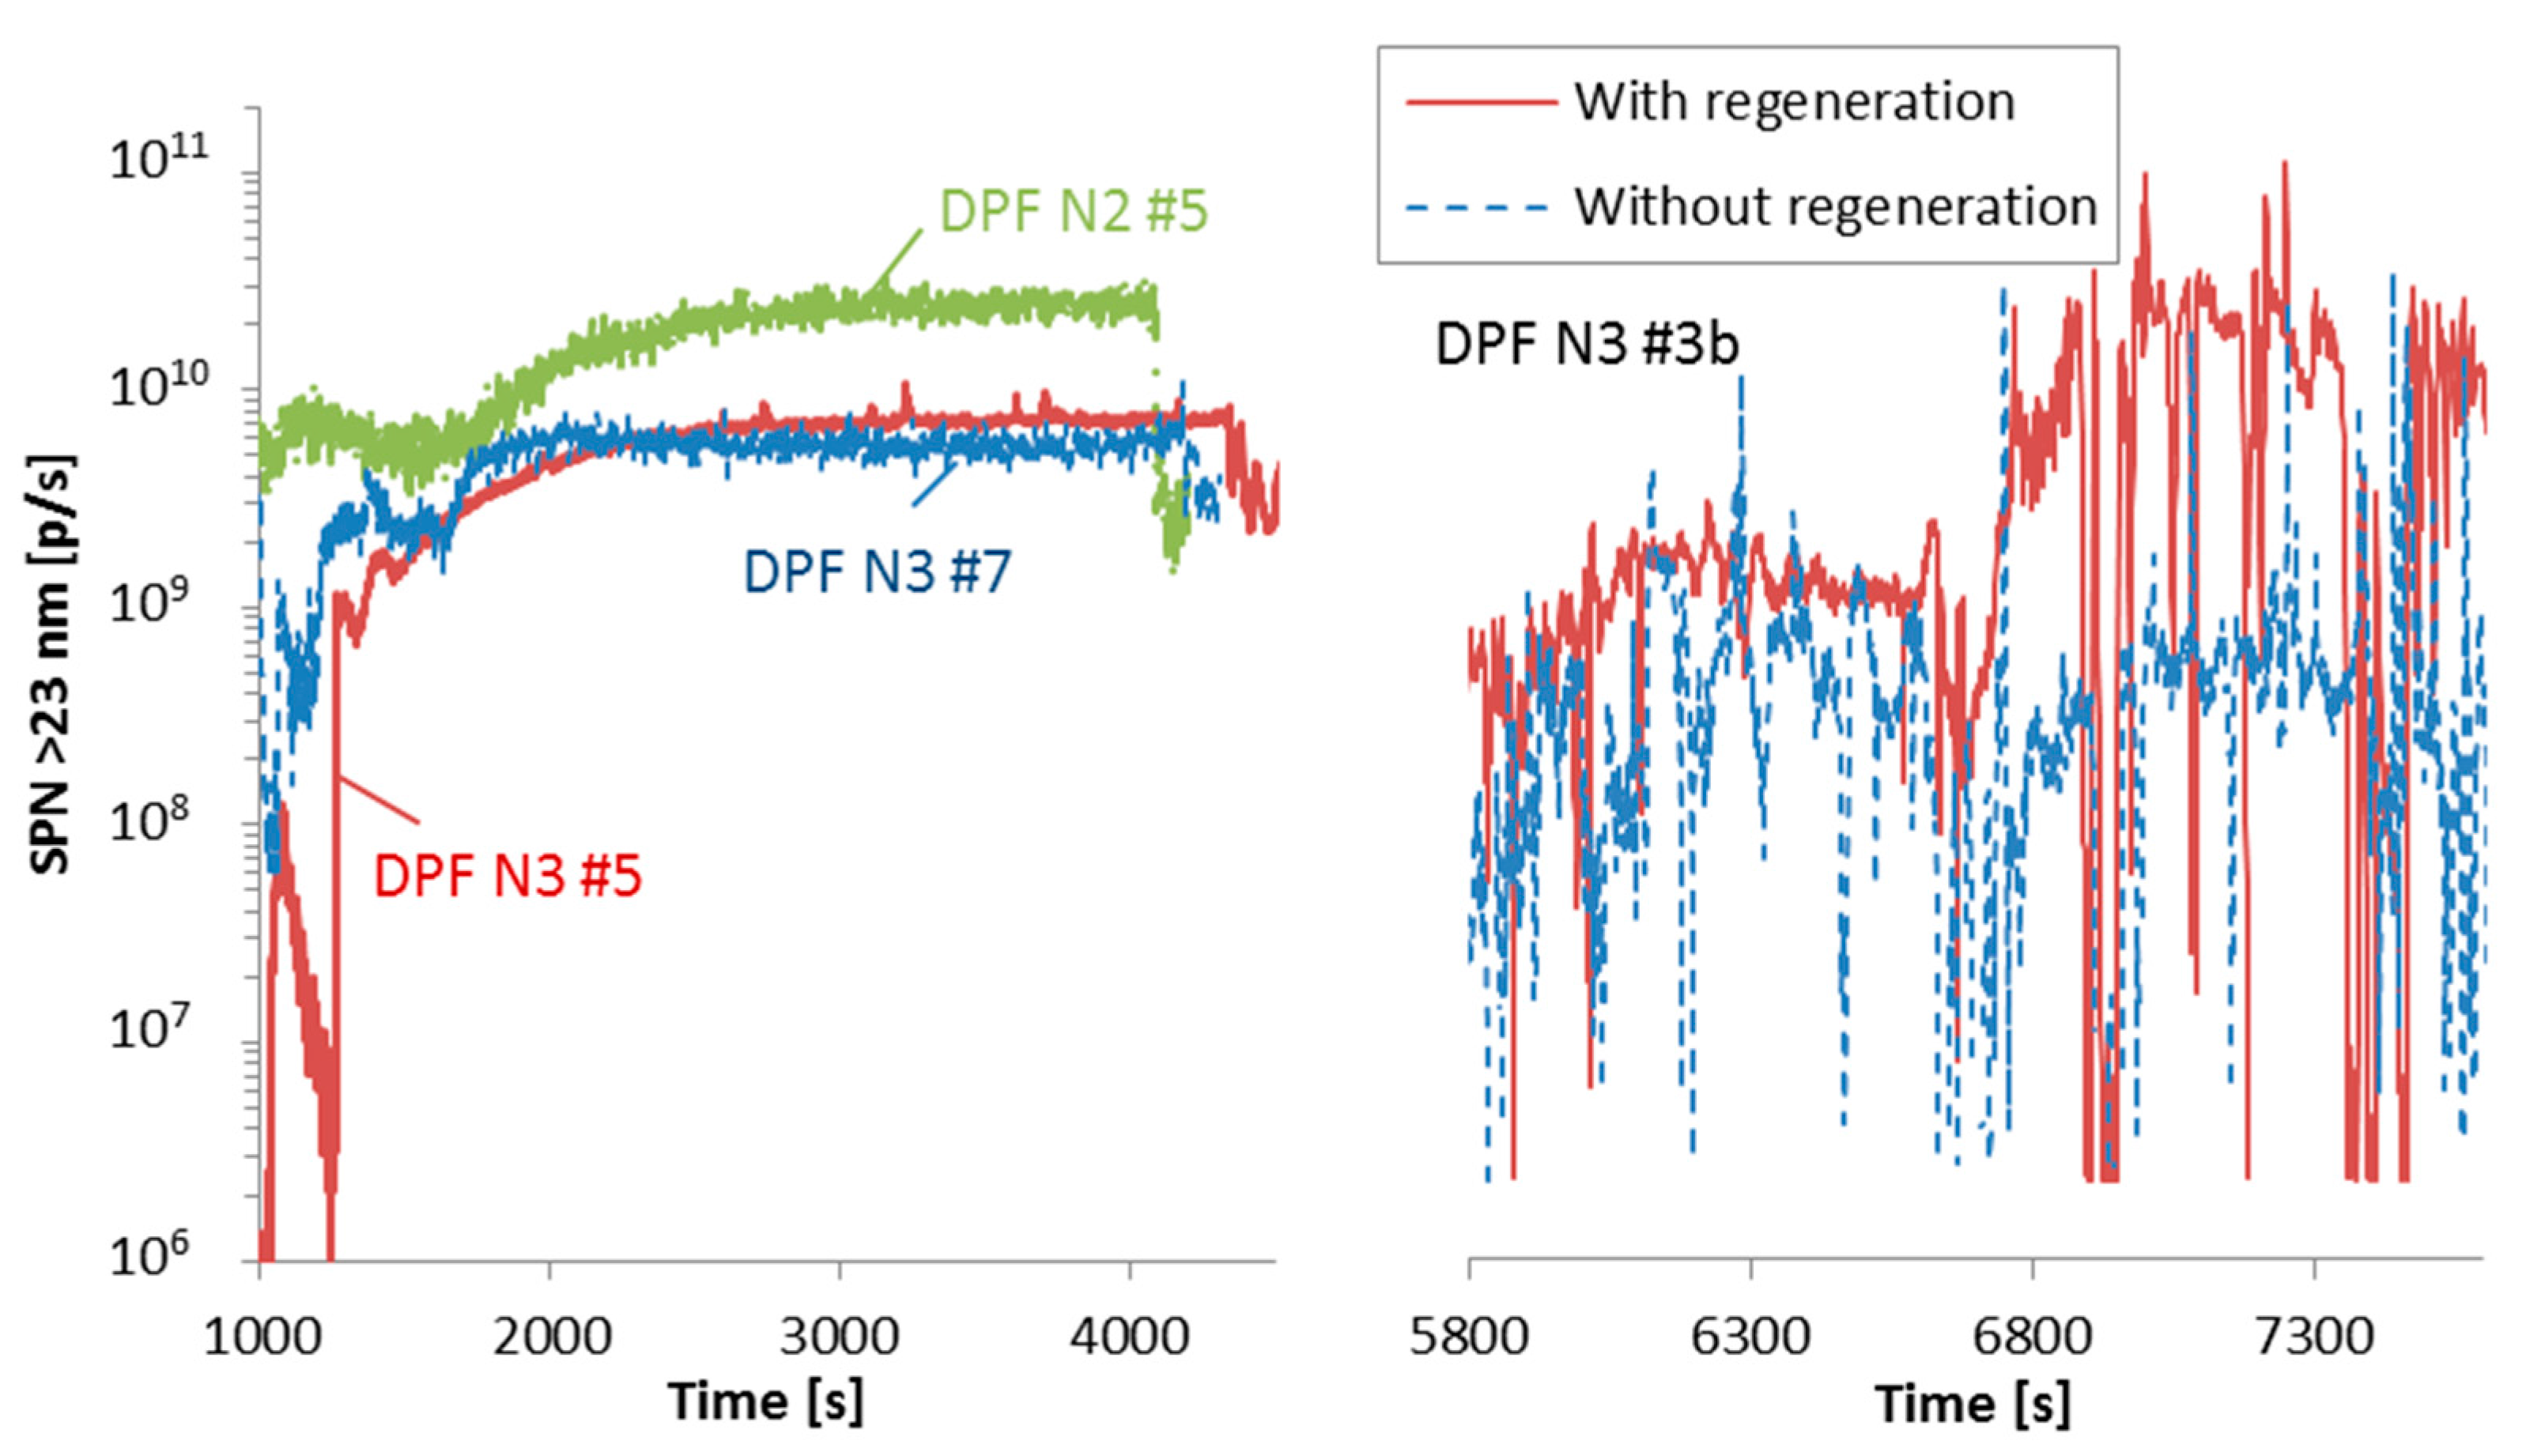
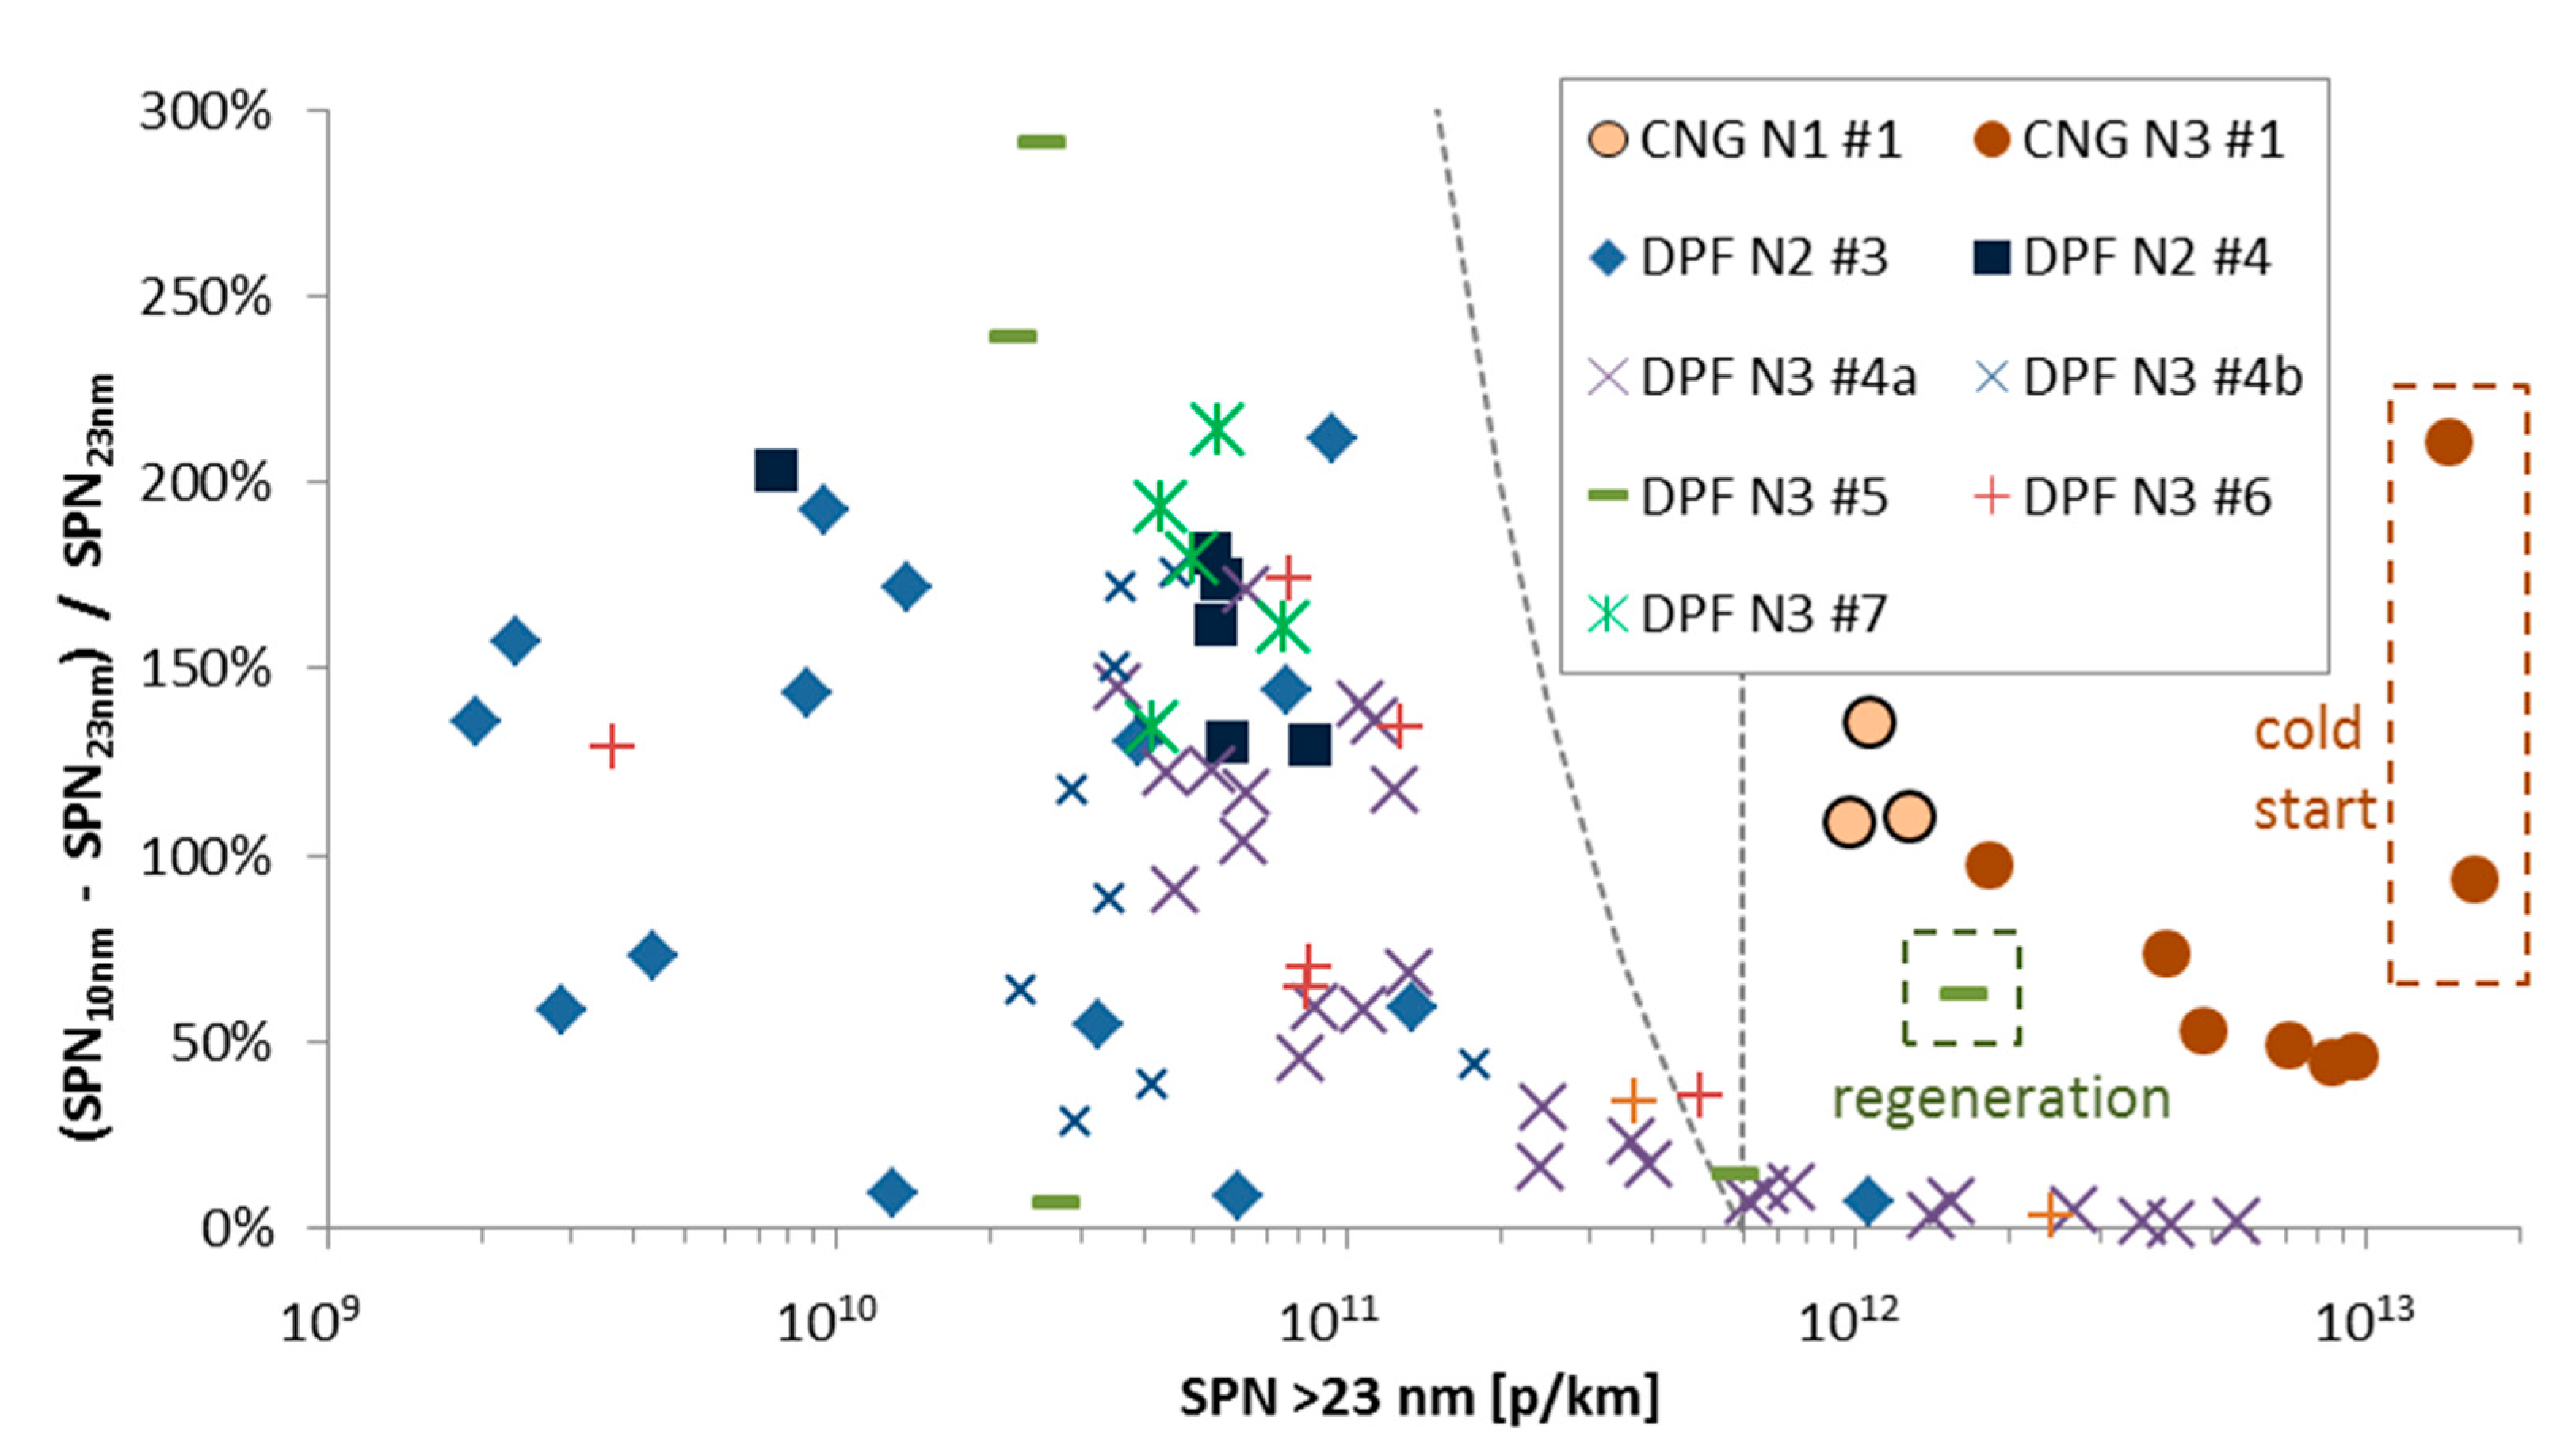
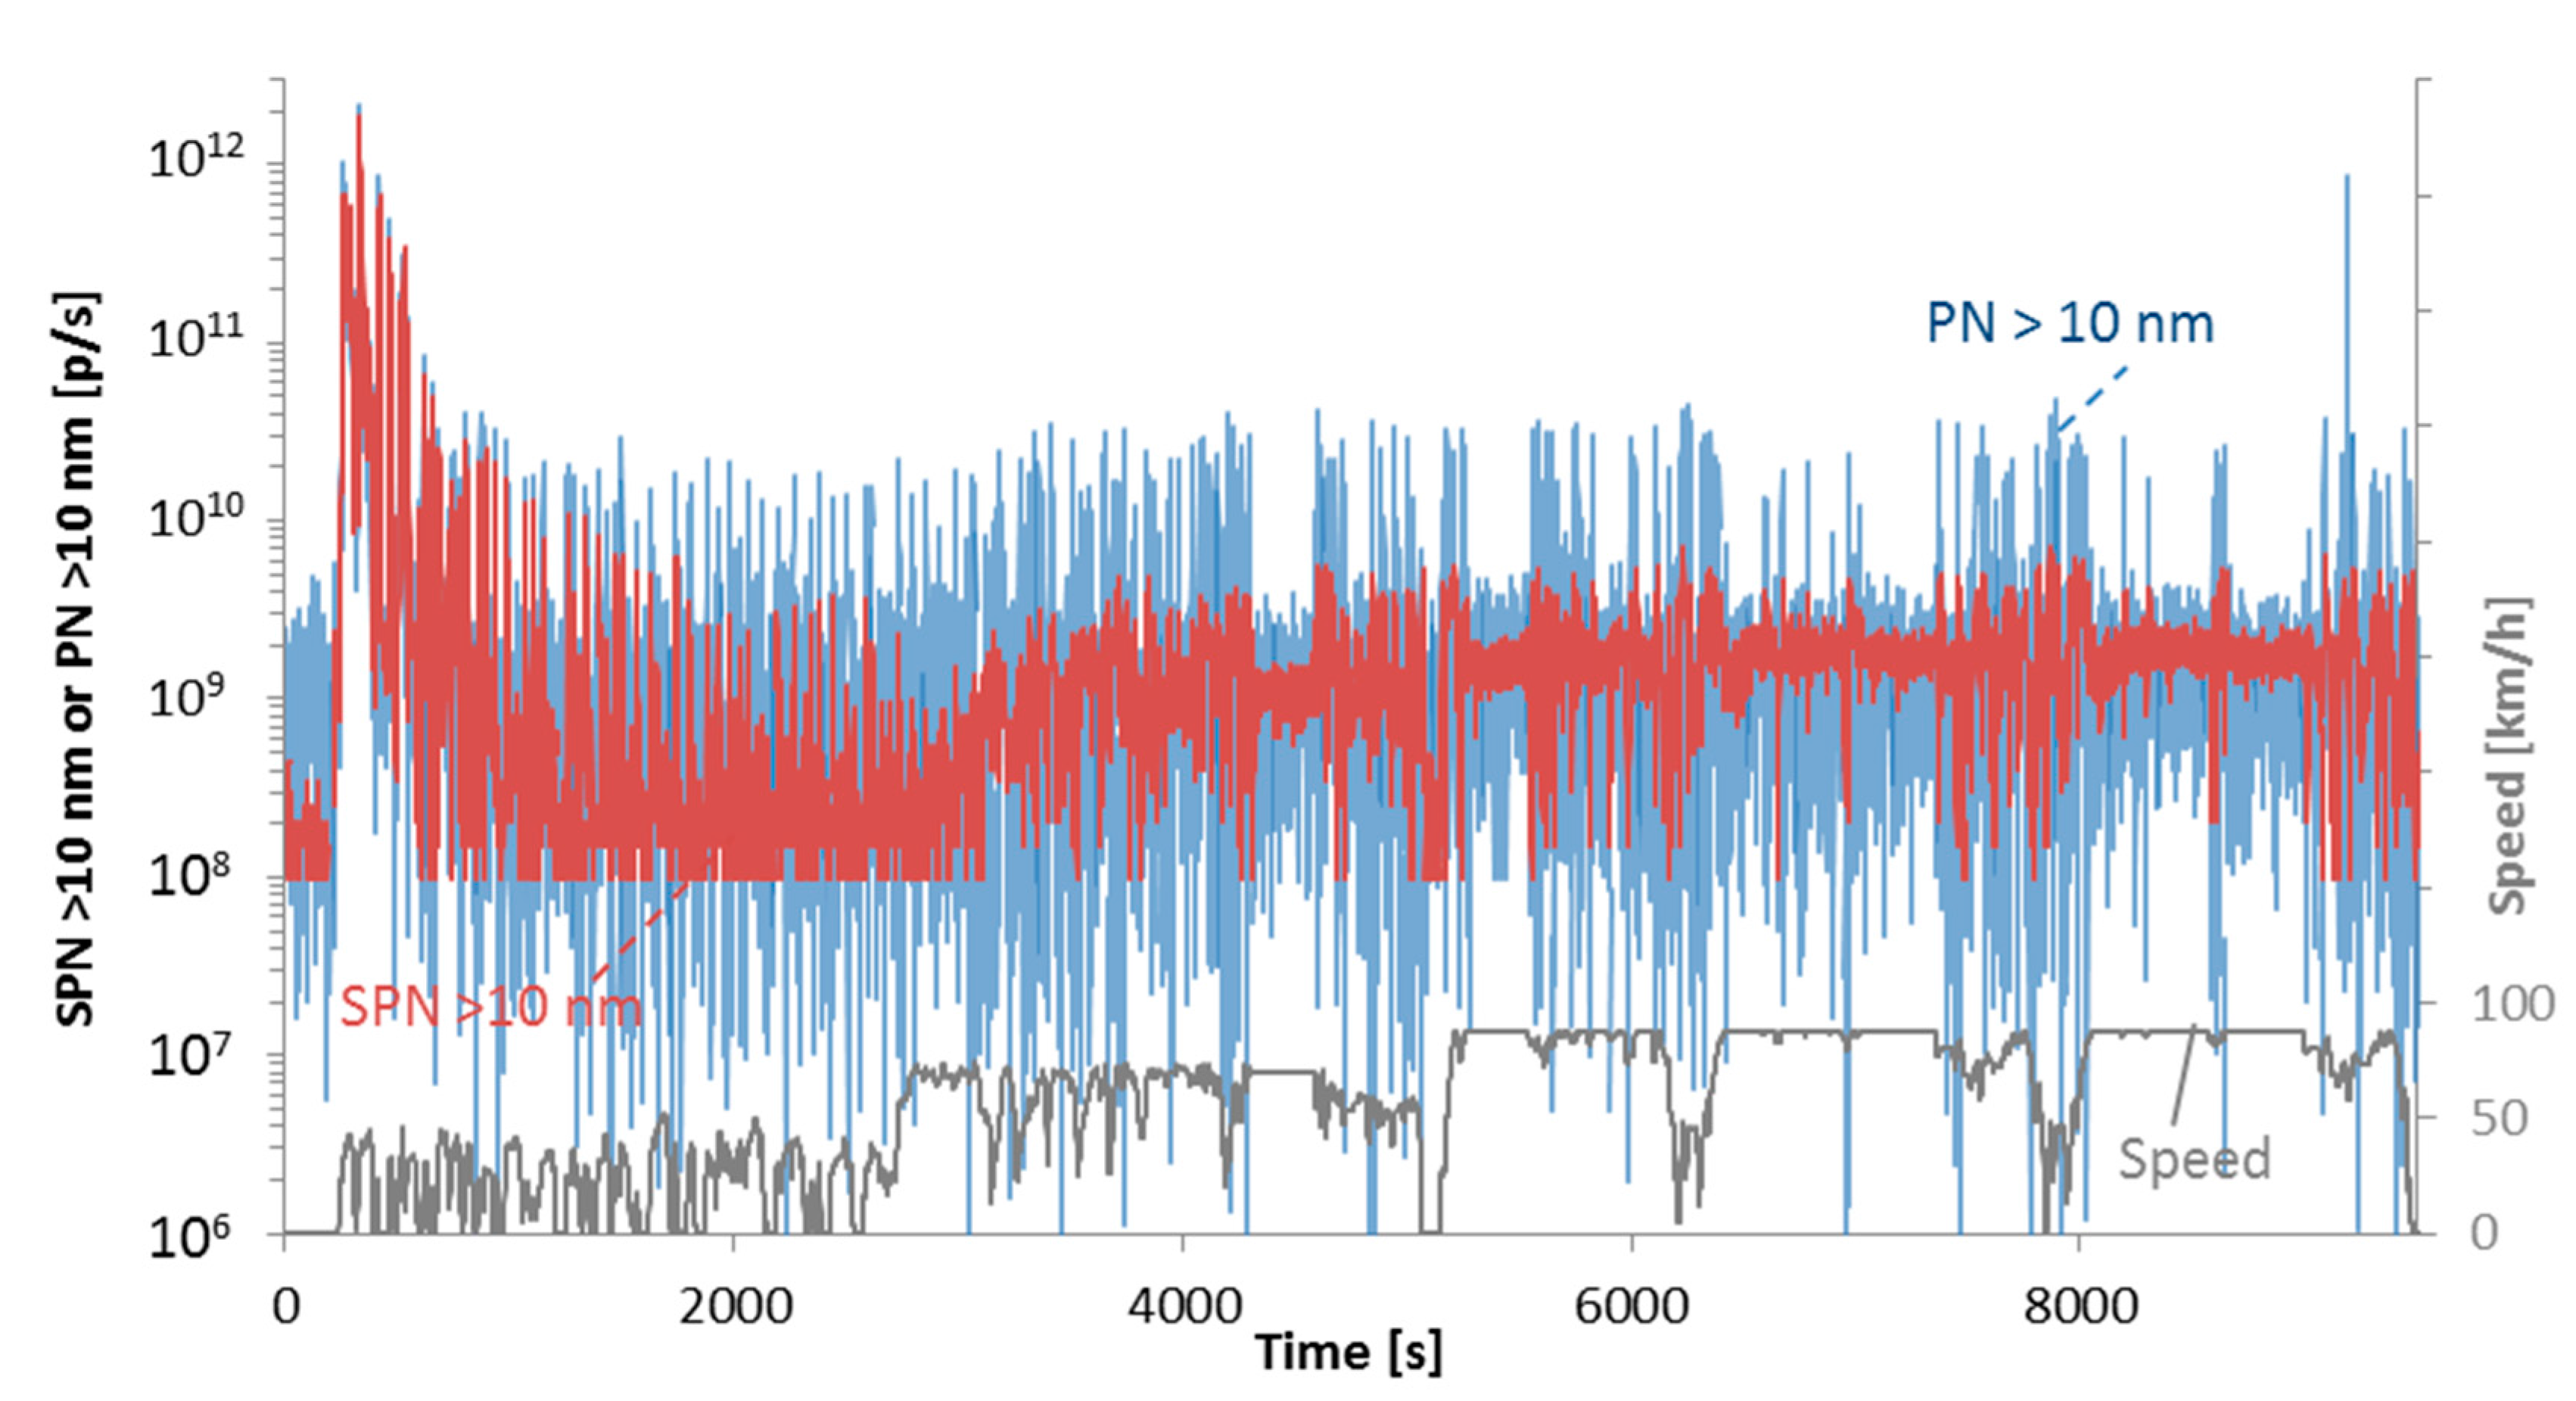
Table 1.
Details of test fleet.
| Nomenclature | Fuel | Category | Description | Engine Size 1 (L) | Power 1 (kW) |
|---|---|---|---|---|---|
| CNG N1 #1 | CNG | N1 | Rigid truck | 3 | 100 |
| CNG N3 #1 | CNG | N3 | Refuse collection | 9 | 185 |
| CNG N3 #2 | CNG | N3 | Rigid truck | 8 | 220 |
| CNG N3 #3 | CNG | N3 | Refuse collection | 9 | 250 |
| CNG M3 #1 | CNG | M3 | City bus | 13 | 230 |
| LNG N3 #1 | LNG | N3 | Tractor semi trailer | 9 | 300 |
| LNG N3 #2 | LNG | N3 | Tractor semi trailer | 9 | 250 |
| DPF N2 #1 | Diesel | N2 | Rigid truck | 8 | 200 |
| DPF N2 #2 | Diesel | N2 | Rigid truck | 5 | 180 |
| DPF N2 #3 | Diesel | N2 | Rigid truck | 5 | 180 |
| DPF N2 #4 | Diesel | N2 | Rigid truck | 5 | 155 |
| DPF N2 #5 | Diesel | N2 | Rigid truck | 5 | 180 |
| DPF N2 #6 | Diesel | N2 | Rigid truck | 8 | 180 |
| DPF N3 #1 | Diesel | N3 | Tractor semi trailer | 13 | 340 |
| DPF N3 #2 | Diesel | N3 | Tractor semi trailer | 13 | 340 |
| DPF N3 #3 | Diesel | N3 | Tractor semi trailer | 13 | 320 |
| DPF N3 #4 | Diesel | N3 | Tractor semi trailer | 13 | 340 |
| DPF N3 #5 | Diesel | N3 | Tractor semi trailer | 13 | 340 |
| DPF N3 #6 | Diesel | N3 | Tractor semi trailer | 13 | 340 |
| DPF N3 #7 | Diesel | N3 | Rigid truck | 8 | 240 |
| DPF N3 #8 | Diesel | N3 | Rigid truck | 11 | 270 |
| DPF N3 #9 | Diesel | N3 | Rigid truck | 8 | 180 |
| DPF N3 #10 | Diesel | N3 | Crane | 11 | 240 |
| DPF M3 #1 | Diesel | M3 | Bus | 11 | 330 |
1 Values are approximate in order not to disclose the vehicle model. CNG: Compressed Natural Gas; LNG: Liquefied Natural Gas; DPF: Diesel Particulate Filter.
Table 2.
Test details. More information in the main text.
| Nomenclature | Tested by | Cycle | Place | Tamb (°C) | Test Weight 1 (t) | Add. Testing |
|---|---|---|---|---|---|---|
| CNG N1 #1 | ACEA | ISC | On-road | 24 | 2.5 | <23 nm |
| CNG N3 #1 | JRC | ISC | Lab | 22 | 20 | <23 nm, T |
| CNG N3 #2 | ACEA | ISC | On-road | 29 | 27 | |
| CNG N3 #3 | STA [59] | WHVC | Lab | 23 | 20 | |
| CNG M3 #1 | ACEA | ISC | On-road | 21 | 20 | |
| LNG N3 #1 | TNO [58] | ISC | On-road | 0 | 31 | |
| LNG N3 #2 | TNO [58] | ISC | On-road | 3 | 31 | |
| DPF N2 #1 | ACEA | ISC | On-road | 25 | 12 | |
| DPF N2 #2 | ACEA | ISC | On-road | 24 | 9 | |
| DPF N2 #3 | JRC | ISC | Lab | 23 | 9 | <23 nm, T, C |
| DPF N2 #4 | JRC | ISC | Lab | 22 | 9 | <23 nm, T |
| DPF N2 #5 | JRC | ISC | Lab | 20 | 12 | Reg. |
| DPF N2 #6 | STA [59] | WHVC | Lab | 23 | 10 | |
| DPF N3 #1 | ACEA | ISC | On-road | 20 | 26 | |
| DPF N3 #2 | ACEA | ISC | On-road | 28 | 22 | |
| DPF N3 #3a,b | JRC [45,52] | ISC | On-road | 15 | 27 | Reg. |
| DPF N3 #4a,b | JRC | ISC | Lab | 20 | 27 | <23 nm, T, C |
| DPF N3 #5 | JRC | ISC | Lab | 20 | 27 | <23 nm, T, C, Reg. |
| DPF N3 #6 | JRC | WHVC | Lab | 21 | 27 | <23 nm |
| DPF N3 #7 | JRC | WHVC | Lab | 23 | 16 | <23 nm |
| DPF N3 #8 | STA [59] | WHVC | Lab | 23 | 18 | |
| DPF N3 #9 | STA [59] | WHVC | Lab | 23 | 15 | |
| DPF N3 #10 | STA [59] | WHVC | Lab | 23 | 21 | |
| DPF M3 #1 | ACEA | ISC | Lab | 24 | 18 |
1 Payload approximately 50–60% in all cases. Additional testing: T = Low ambient temperature tests, C = Cycles comparisons, Reg. = Regeneration, <23 nm = Sub-23 nm investigation. ACEA: European Automobile Manufacturers’ Association; ISC: in-service conformity; JRC: European Commission’s Joint Research Centre; STA: Swedish Transport Agency; TNO: The Netherlands Organization for Applied Scientific Research; WHVC: Worldwide Harmonized Vehicle Cycle.
© 2018 by the author. Licensee MDPI, Basel, Switzerland. This article is an open access article distributed under the terms and conditions of the Creative Commons Attribution (CC BY) license (http://creativecommons.org/licenses/by/4.0/).
Share and Cite
MDPI and ACS Style
Giechaskiel, B. Solid Particle Number Emission Factors of Euro VI Heavy-Duty Vehicles on the Road and in the Laboratory. Int. J. Environ. Res. Public Health 2018, 15, 304. https://doi.org/10.3390/ijerph15020304
AMA Style
Giechaskiel B. Solid Particle Number Emission Factors of Euro VI Heavy-Duty Vehicles on the Road and in the Laboratory. International Journal of Environmental Research and Public Health. 2018; 15(2):304. https://doi.org/10.3390/ijerph15020304
Chicago/Turabian StyleGiechaskiel, Barouch. 2018. "Solid Particle Number Emission Factors of Euro VI Heavy-Duty Vehicles on the Road and in the Laboratory" International Journal of Environmental Research and Public Health 15, no. 2: 304. https://doi.org/10.3390/ijerph15020304
Note that from the first issue of 2016, this journal uses article numbers instead of page numbers. See further details here.