Acute Effects of Ambient PM2.5 on All-Cause and Cause-Specific Emergency Ambulance Dispatches in Japan

 , , and
Abstract
:
1. Introduction
2. Materials and Methods
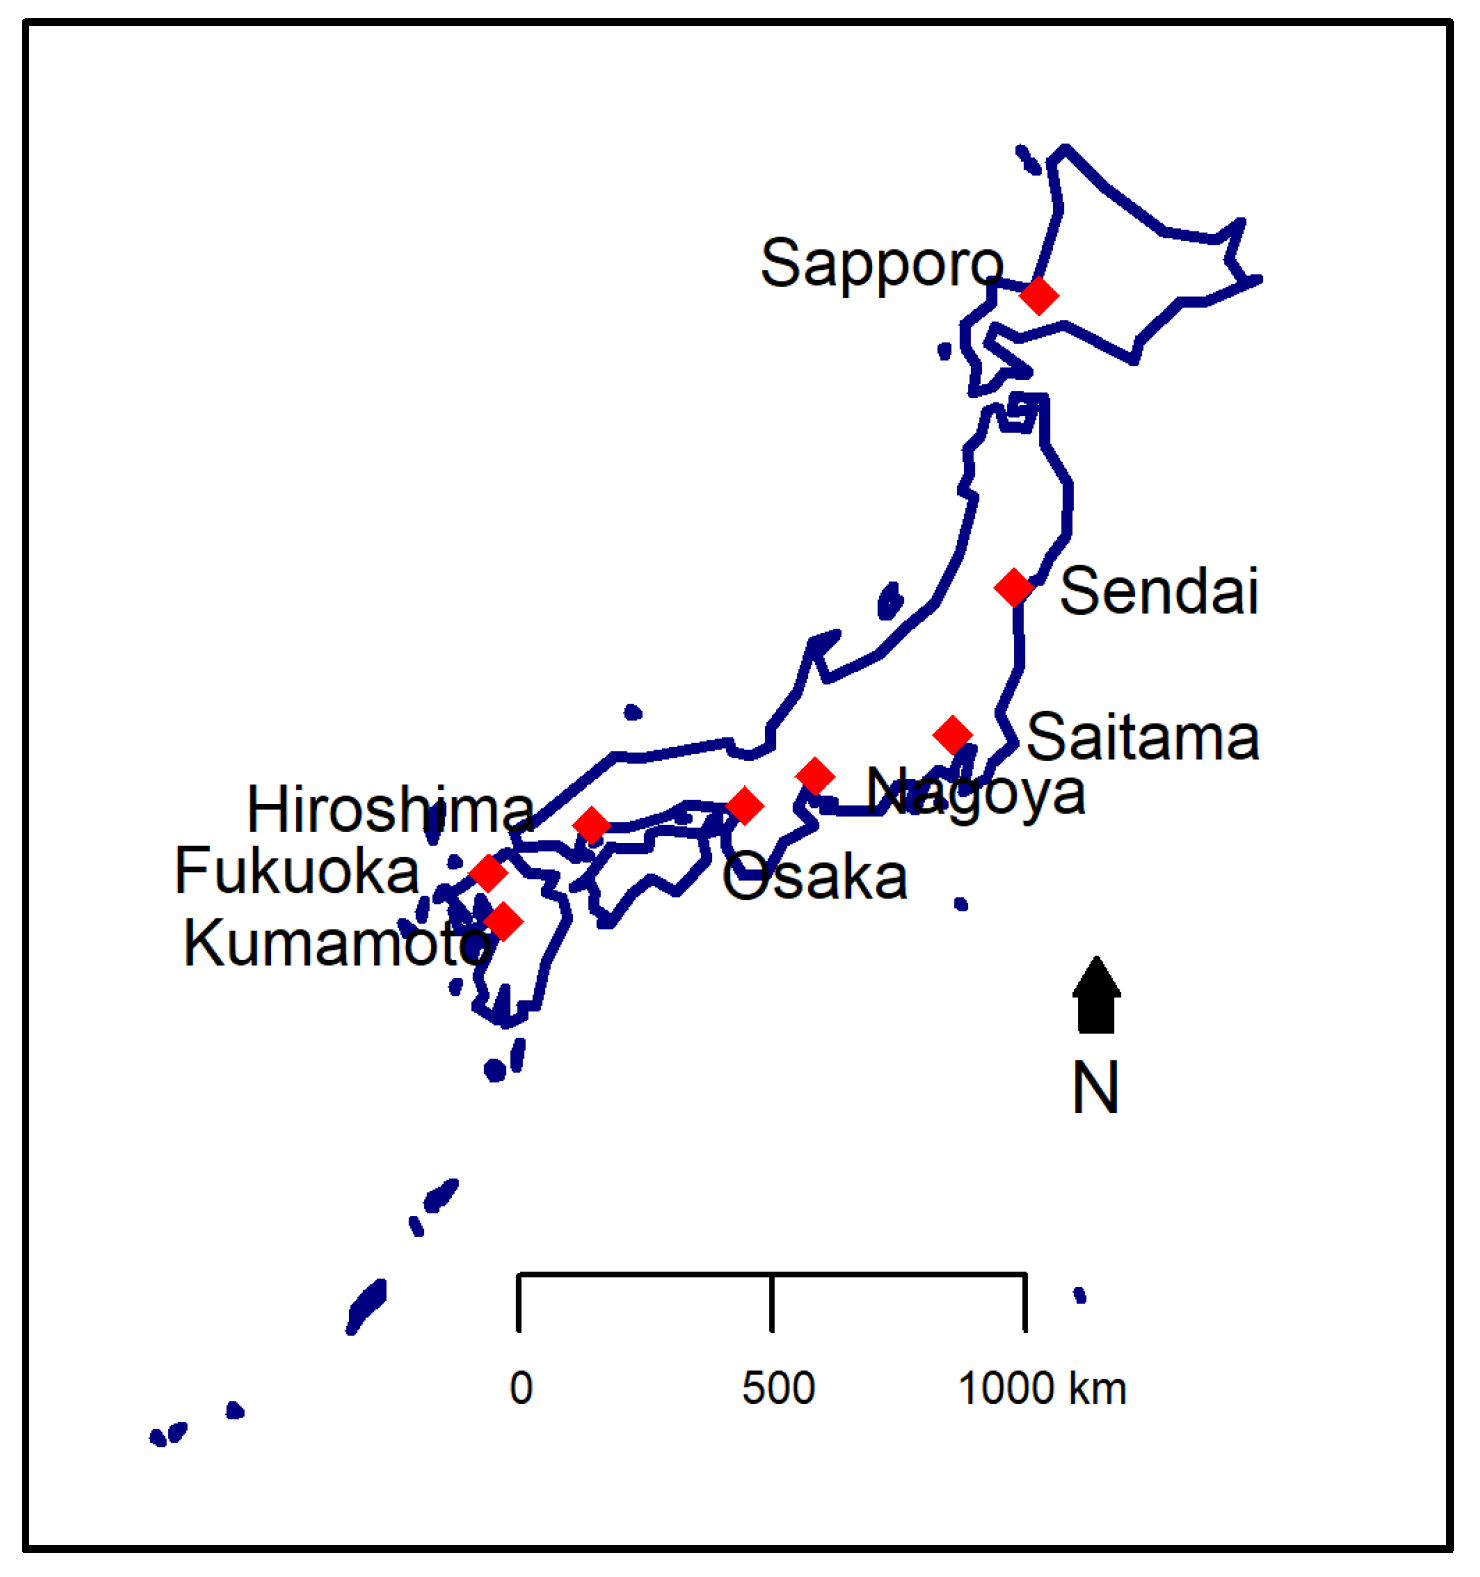
2.1. Study Area
2.2. Health Data: Daily EAD
2.3. Environmental Data
2.4. Statistical Analyses
3. Results
4. Discussion
5. Conclusions
Supplementary Materials
Acknowledgments
Author Contributions
Conflicts of Interest
References
- Bell, M.L.; Ebisu, K.; Peng, R.D.; Walker, J.; Samet, J.M.; Zeger, S.L.; Dominici, F. Seasonal and Regional Short-term Effects of Fine Particles on Hospital Admissions in 202 US Counties, 1999–2005. Am. J. Epidemiol. 2008, 168, 1301–1310. [Google Scholar] [CrossRef] [PubMed]
- Dominici, F.; Peng, R.D.; Bell, M.L.; Pham, L.; McDermott, A.; Zeger, S.L.; Samet, J.M. Fine particulate air pollution and hospital admission for cardiovascular and respiratory diseases. JAMA 2006, 295, 1127–1134. [Google Scholar] [CrossRef] [PubMed]
- Stafoggia, M.; Samoli, E.; Alessandrini, E.; Cadum, E.; Ostro, B.; Berti, G.; Faustini, A.; Jacquemin, B.; Linares, C.; Pascal, M.; et al. Short-term associations between fine and coarse particulate matter and hospitalizations in southern Europe: Results from the MED-PARTICLES project. Environ. Health Perspect. 2013, 121, 1026–1033. [Google Scholar] [CrossRef] [PubMed]
- Zanobetti, A.; Dominici, F.; Wang, Y.; Schwartz, J.D. A national case-crossover analysis of the short-term effect of PM2.5 on hospitalizations and mortality in subjects with diabetes and neurological disorders. Environ. Health 2014, 13, 38. [Google Scholar] [CrossRef] [PubMed]
- Bravo, M.A.; Ebisu, K.; Dominici, F.; Wang, Y.; Peng, R.D.; Bell, M.L. Airborne Fine Particles and Risk of Hospital Admissions for Understudied Populations: Effects by Urbanicity and Short-Term Cumulative Exposures. Environ. Health Perspect. 2017, 125, 594–601. [Google Scholar] [CrossRef] [PubMed]
- Metzger, K.B.; Tolbert, P.E.; Klein, M.; Peel, J.L.; Flanders, W.D.; Todd, K.; Mulholland, J.A.; Ryan, P.B.; Frumkin, H. Ambient air pollution and cardiovascular emergency department visits. Epidemiology 2004, 15, 46–56. [Google Scholar] [CrossRef] [PubMed]
- Atkinson, R.; Kang, S.; Anderson, H.; Mills, I.; Walton, H. Epidemiological time series studies of PM2.5 and daily mortality and hospital admissions: A systematic review and meta-analysis. Thorax 2014, 69, 660–665. [Google Scholar] [CrossRef] [PubMed]
- Wong, C.-M.; Vichit-Vadakan, N.; Kan, H.; Qian, Z.; Teams, P.P. Public health and air pollution in Asia (PAPA): A multicity study of short-term effects of air pollution on mortality. Environ. Health Perspect. 2008, 116, 1195–1202. [Google Scholar] [CrossRef] [PubMed] [Green Version]
- Sajani, S.Z.; Alessandrini, E.; Marchesi, S.; Lauriola, P. Are day-to-day variations of airborne particles associated with emergency ambulance dispatches? Int. J. Occup. Environ. Health 2014, 20, 71–76. [Google Scholar] [CrossRef] [PubMed]
- Michikawa, T.; Ueda, K.; Takeuchi, A.; Kinoshita, M.; Hayashi, H.; Ichinose, T.; Nitta, H. Impact of short-term exposure to fine particulate matter on emergency ambulance dispatches in Japan. J. Epidemiol. Community Health 2015, 69, 86–91. [Google Scholar] [CrossRef] [PubMed]
- Tasmin, S.; Ueda, K.; Stickley, A.; Yasumoto, S.; Phung, V.L.H.; Oishi, M.; Yasukouchi, S.; Uehara, Y.; Michikawa, T.; Nitta, H. Short-term exposure to ambient particulate matter and emergency ambulance dispatch for acute illness in Japan. Sci. Total Environ. 2016, 566–567, 528–535. [Google Scholar] [CrossRef] [PubMed]
- Ichiki, T.; Onozuka, D.; Kamouchi, M.; Hagihara, A. An association between fine particulate matter (PM2.5) levels and emergency ambulance dispatches for cardiovascular diseases in Japan. Int. Arch. Occup. Environ. Health 2016, 89, 1329–1335. [Google Scholar] [CrossRef] [PubMed]
- Liu, R.; Zeng, J.; Jiang, X.; Chen, J.; Gao, X.; Zhang, L.; Li, T. The relationship between airborne fine particulate matter and emergency ambulance dispatches in a southwestern city in Chengdu, China. Environ. Pollut. 2017, 229, 661–667. [Google Scholar] [CrossRef] [PubMed]
- Salimi, F.; Henderson, S.B.; Morgan, G.G.; Jalaludin, B.; Johnston, F.H. Ambient particulate matter, landscape fire smoke, and emergency ambulance dispatches in Sydney, Australia. Environ. Int. 2017, 99, 208–212. [Google Scholar] [CrossRef] [PubMed]
- Brook, R.D.; Rajagopalan, S.; Pope, C.A., III; Brook, J.R.; Bhatnagar, A.; Diez-Roux, A.V.; Holguin, F.; Hong, Y.; Luepker, R.V.; Mittleman, M.A.; et al. Particulate Matter Air Pollution and Cardiovascular Disease. An Update to the Scientific Statement from the American Heart Association. Circulation 2010, 121, 2331–2378. [Google Scholar] [CrossRef] [PubMed]
- Lee, H.; Myung, W.; Kim, D.K.; Kim, S.E.; Kim, C.T.; Kim, H. Short-term air pollution exposure aggravates Parkinson’s disease in a population-based cohort. Sci. Rep. 2017, 7, 44741. [Google Scholar] [CrossRef] [PubMed]
- Szyszkowicz, M. Ambient air pollution and daily emergency department visits for headache in Ottawa, Canada. Headache 2008, 48, 1076–1081. [Google Scholar] [CrossRef] [PubMed]
- Kioumourtzoglou, M.; Schwartz, J.D.; Weisskopf, M.G.; Melly, S.J.; Wang, Y.; Dominici, F.; Zanobetti, A. Long-term PM2.5 exposure and neurological hospital admissions in the northeastern United States. Environ. Health Perspect. 2016, 124, 23–29. [Google Scholar] [CrossRef] [PubMed]
- Chen, H.; Kwong, J.C.; Copes, R.; Hystad, P.; van Donkelaar, A.; Tu, K.; Brook, J.R.; Goldberg, M.S.; Martin, R.V.; Murray, B.J.; et al. Exposure to ambient air pollution and the incidence of dementia: A population-based cohort study. Environ. Int. 2017, 108, 271–277. [Google Scholar] [CrossRef] [PubMed]
- Chen, J.-C.; Wang, X.; Wellenius, G.A.; Serre, M.L.; Driscoll, I.; Casanova, R.; McArdle, J.J.; Manson, J.E.; Chui, H.C.; Espeland, M.A. Ambient Air Pollution and Neurotoxicity on Brain Structure: Evidence from Women’s Health Initiative Memory Study. Ann. Neurol. 2015, 78, 466–476. [Google Scholar] [CrossRef] [PubMed]
- Murray, C.J.L.; Lopez, A.D. Summary. The Global Burden of Disease: A Comprehensive Assessment of Mortality and Disability from Diseases, Injuries and Risk Factors in 1990 and Projected to 2020; Harvard School of Public Health on Behalf of the World Health Organization and the World Bank: Cambridge, MA, USA, 1996; ISBN 0-9655466-0-8. [Google Scholar]
- Block, M.L.; Calderón-Garcidueñas, L. Air pollution: Mechanisms of neuroinflammation and CNS disease. Trends Neurosci. 2009, 32, 506–516. [Google Scholar] [CrossRef] [PubMed]
- Tanigawa, K.; Tanaka, K. Emergency medical service systems in Japan: Past, present, and future. Resuscitation 2006, 69, 365–370. [Google Scholar] [CrossRef] [PubMed]
- Ng, C.F.S.; Ueda, K.; Takeuchi, A.; Nitta, H.; Konishi, S.; Bagrowicz, R.; Watanabe, C.; Takami, A. Sociogeographic variation in the effects of heat and cold on daily mortality in Japan. J. Epidemiol. 2014, 24, 15–24. [Google Scholar] [CrossRef] [PubMed]
- Dominici, F.; Samet, J.M.; Zeger, S.L. Combining evidence on air pollution and daily mortality from the 20 largest US cities: A hierarchical modelling strategy. J. R. Stat. Soc. Ser. A Stat. Soc. 2000, 163, 263–302. [Google Scholar] [CrossRef]
- Chen, R.; Chu, C.; Tan, J.; Cao, J.; Song, W.; Xu, X.; Jiang, C.; Ma, W.; Yang, C.; Chen, B.; et al. Ambient air pollution and hospital admission in Shanghai, China. J. Hazard. Mater. 2010, 181, 234–240. [Google Scholar] [CrossRef] [PubMed]
- Higgins, J.P.T.; Thompson, S.G. Quantifying heterogeneity in a meta-analysis. Stat. Med. 2002, 21, 1539–1558. [Google Scholar] [CrossRef] [PubMed]
- R Core Team. R: A Language and Environment for Statistical Computing; The R Foundation for Statistical Computing: Vienna, Austria, 2014. [Google Scholar]
- Viechtbauer, W. Conducting Meta-Analyses in R with the metafor Package. J. Stat. Softw. 2010, 36. [Google Scholar] [CrossRef]
- Wellenius, G.A.; Burger, M.R.; Coull, B.A.; Schwartz, J.; Suh, H.H.; Koutrakis, P.; Schlaug, G.; Gold, D.R.; Mittleman, M.A. Ambient air pollution and the risk of acute ischemic stroke. Arch. Intern. Med. 2012, 172, 229–234. [Google Scholar] [CrossRef] [PubMed]
- Zanobetti, A.; Franklin, M.; Koutrakis, P.; Schwartz, J. Fine particulate air pollution and its components in association with cause-specific emergency admissions. Environ. Health 2009, 8, 58. [Google Scholar] [CrossRef] [PubMed]
- Li, R.; Jiang, N.; Liu, Q.; Huang, J.; Guo, X.; Liu, F. Impact of Air Pollutants on Outpatient Visits for Acute Respiratory Outcomes. Int. J. Environ. Res. Public Health 2017, 14, 47. [Google Scholar] [CrossRef] [PubMed]
- Donaldson, K.; Beswick, P.H.; Gilmour, P.S. Free radical activity associated with the surface of particles: A unifying factor in determining biological activity? Toxicol. Lett. 1996, 88, 293–298. [Google Scholar] [CrossRef]
- Seriani, R.; de Souza, C.E.C.; Krempel, P.G.; Frias, D.P.; Matsuda, M.; Correia, A.T.; Ferreira, M.Z.J.; Alencar, A.M.; Negri, E.M.; Saldiva, P.H.N.; et al. Human bronchial epithelial cells exposed in vitro to diesel exhaust particles exhibit alterations in cell rheology and cytotoxicity associated with decrease in antioxidant defenses and imbalance in pro- and anti-apoptotic gene expression. Environ. Sci. Pollut. Res. 2016, 23, 9862–9870. [Google Scholar] [CrossRef] [PubMed]
- Brown, D.M.; Donaldson, K.; Borm, P.J.; Schins, R.P.; Dehnhardt, M.; Gilmour, P.; Jimenez, L.A.; Stone, V. Calcium and ROS-mediated activation of transcription factors and TNF-alpha cytokine gene expression in macrophages exposed to ultrafine particles. Am. J. Physiol. Lung Cell. Mol. Physiol. 2004, 286, L344–L353. [Google Scholar] [CrossRef] [PubMed]
- Lucchini, R.; Dorman, D.; Elder, A.; Veronesi, B. Neurological impacts from inhalation of pollutants and the nose-brain connection. Neurotoxicology 2012, 33, 838–841. [Google Scholar] [CrossRef] [PubMed]
- Block, M.L.; Zecca, L.; Hong, J.-S. Microglia-mediated neurotoxicity: Uncovering the molecular mechanisms. Neuroscience 2007, 8, 57–69. [Google Scholar] [CrossRef] [PubMed]
- Heneka, M.T.; Kummer, M.P.; Latz, E. Innate immune activation in neurodegenerative disease. Nat. Rev. Immunol. 2014, 14, 463–477. [Google Scholar] [CrossRef] [PubMed]
- Chen, C.; Tsai, S.; Yang, C. Association between fine particulate air pollution and daily clinic visits for migraine in a subtropical city: Taipei, Taiwan. Int. J. Environ. Res. Public Health 2015, 12, 4697–4708. [Google Scholar] [CrossRef] [PubMed]
- Ljungman, P.L.; Mittleman, M.A. Ambient air pollution and stroke. Stroke 2014, 45, 3734–3741. [Google Scholar] [CrossRef] [PubMed]
- Sade, M.Y.; Novack, V.; Ifergane, G.; Horev, A.; Kloog, I. Air pollution and ischemic stroke among young adults. Stroke 2015, 46, 3348–3353. [Google Scholar] [CrossRef] [PubMed]
- Wilkinson, P.; Milner, J.; Armstrong, B. Other cardiovascular effects of ambient air pollution [abstract]. In Proceedings of the 29th Annual Science Conference International Society of Environmental Epidemiology, Sydney, Australia, 24–28 September 2017. [Google Scholar]
- Davenport, R.J.; Dennis, M.S.; Wellwood, I.; Warlow, C.P. Complications after acute stroke. Stroke 1996, 27, 415–420. [Google Scholar] [CrossRef] [PubMed]
- Langhorne, P.; Stott, D.J.; Robertson, L.; MacDonald, J.; Jones, L.; McAlpine, C.; Dick, F.; Taylor, G.S.; Murray, G. Medical complications after stroke. A multicenter study. Stroke 2000, 31, 1223–1229. [Google Scholar] [CrossRef] [PubMed]
- Zanobetti, A.; Wand, M.P.; Schwartz, J.; Ryan, L.M. Generalized additive distributed lag models: Quantifying mortality displacement. Biostatistics 2000, 1, 279–292. [Google Scholar] [CrossRef] [PubMed]


| Characteristics | Sapporo | Sendai | Saitama | Nagoya | Osaka | Hiroshima | Fukuoka | Kumamoto |
|---|---|---|---|---|---|---|---|---|
| Study period | 1 January 2007–31 March 2010 | 1 January 2007–31 March 2010 | 1 April 2009–31 March 2011 | 1 January 2008–31 December 2011 | 1 January 2008–31 December 2011 | 1 April 2010–31 December 2011 | 1 January 2009–31 December 2011 | 1 April 2010–31 December 2011 |
| Population * | 1,913,545 | 1,045,986 | 1,222,434 | 2,263,894 | 2,665,314 | 1,173,843 | 1,463,743 | 734,474 |
| Sex | ||||||||
| Male | 53 (9) | 28 (6) | 46 (9) | NA | NA | NA | 46 (8) | 21 (5) |
| Female | 58 (9) | 27 (6) | 41 (8) | NA | NA | NA | 47 (8) | 22 (5) |
| Age | ||||||||
| Children | 8 (4) | 4 (2) | 8 (4) | 9 (5) | 21 (7) | 6 (3) | 7 (3) | 3 (2) |
| Adult | 53 (9) | 24 (5) | 37 (8) | 66 (12) | 142 (18) | 31 (7) | 43 (8) | 18 (4) |
| Elderly | 51 (8) | 27 (6) | 41 (9) | 84 (15) | 142 (19) | 38 (7) | 43 (8) | 23 (5) |
| Diagnosis type | ||||||||
| All acute illness | 111 (14) | 55 (9) | 86 (14) | 159 (22) | 305 (33) | 74 (11) | 93 (13) | 43 (8) |
| Cardiovascular | 14 (4) | 4 (2) | 4 (2) | 15 (4) | 31 (6) | 10 (3) | 9 (3) | 3 (2) |
| Respiratory | 12 (5) | 5 (2) | 5 (2) | 18 (5) | 32 (7) | 10 (3) | 12 (4) | 3 (1) |
| Cerebrovascular | 18 (6) | 5 (2) | 5 (2) | 11 (4) | 25 (5) | 12 (4) | 24 (5) | 3 (2) |
| Neuropsychology | 12 (4) | 5 (2) | 6 (3) | 14 (4) | 53 (9) | 10 (3) | 5 (2) | 3 (2) |
| Environmental Variable | Sapporo | Sendai | Saitama | Nagoya | Osaka | Hiroshima | Fukuoka | Kumamoto |
|---|---|---|---|---|---|---|---|---|
| PM2.5 (µg/m3) | 11.27 (5.71) | 12.41 (6.59) | 17.86 (11.76) | 16.00 (8.42) | 18.58 (9.90) | 20.84 (12.32) | 18.14 (10.31) | 18.73 (12.96) |
| SO2 (ppb) | 2.27 (1.57) | 0.59 (0.58) | 1.33 (0.62) | 1.83 (1.18) | 5.22 (2.97) | 1.24 (0.86) | 1.77 (1.19) | 3.41 (1.56) |
| NO2 (ppb) | 15.53 (9.78) | 13.83 (6.09) | 18.78 (7.58) | 20.83 (7.72) | 20.23 (9.09) | 13.82 (6.44) | 13.46 (7.35) | 9.77 (4.92) |
| Ox (ppb) | 27.58 (11.15) | 29.17 (11.62) | 28.47 (13.34) | 24.70 (12.86) | 29.00 (13.21) | 27.60 (12.98) | 29.45 (13.44) | 26.37 (12.15) |
| Temperature (°C) | 8.64 (9.31) | 12.19 (8.00) | 15.52 (8.62) | 16.43 (8.56) | 17.08 (8.35) | 17.69 (8.57) | 17.35 (8.05) | 18.34 (8.31) |
| Relative humidity (%) | 67.92 (10.23) | 71.48 (13.00) | 65.06 (13.84) | 63.50 (12.35) | 62.76 (10.98) | 64.53 (10.33) | 65.58 (11.96) | 69.33 (10.84) |
| Lag Structure | Cardiovascular | Respiratory | Cerebrovascular | Neuropsychology |
|---|---|---|---|---|
| Lag 0 a | 0.36 (−1.30, 2.05) | 1.88 (1.00, 2.76) * | 0.24 (−0.62, 1.11) | 1.48 (0.69, 2.28) * |
| Average lags | ||||
| Lag 0–1 | −0.10 (−0.92, 0.73) | 2.47 (1.69, 3.26) * | −1.76 (−2.80, −0.72) * | 0.59 (−1.09, 2.30) |
| Lag 0–3 | −0.19 (−1.47, 1.11) | 2.79 (1.31, 4.29) * | −1.27 (−2.22, −0.32) * | 1.03 (−1.71, 3.84) |
| Lag 0–5 | −0.20 (−1.37, 0.98) | 1.86 (0.23, 3.51) * | −1.13 (−2.23, −0.02) * | 0.06 (−2.50, 2.68) |
| Lag 0–7 | −0.60 (−1.90, 0.72) | 1.53 (−0.07, 3.16) | −1.05 (−2.29, 0.19) | −0.30 (−2.71, 2.17) |
| Lag Structure | Children (Age below 18 Years) | Adult (Age 18 to 64 Years) | Elderly (Age 65 Years and above) |
|---|---|---|---|
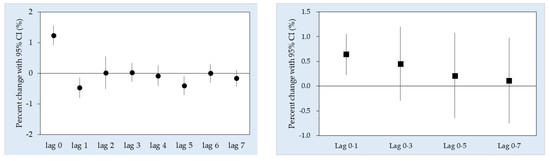
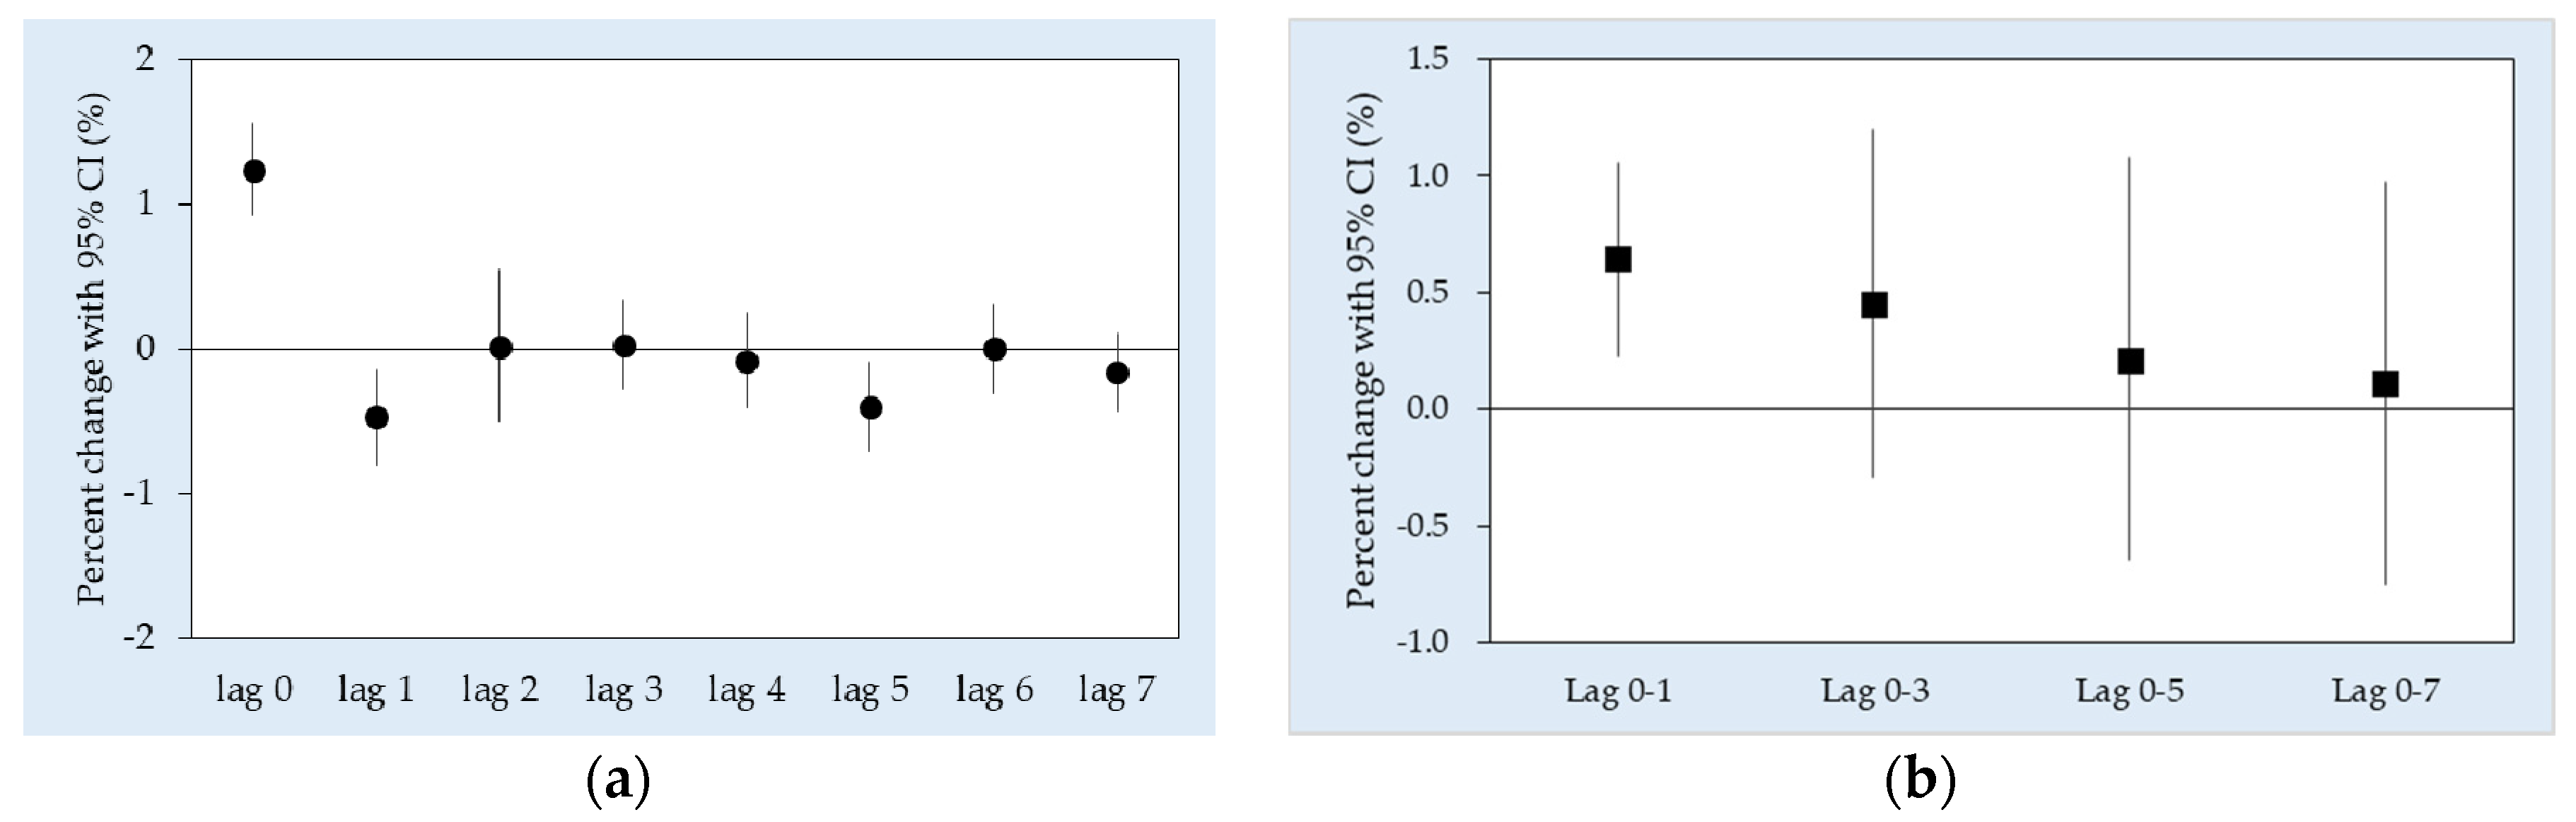
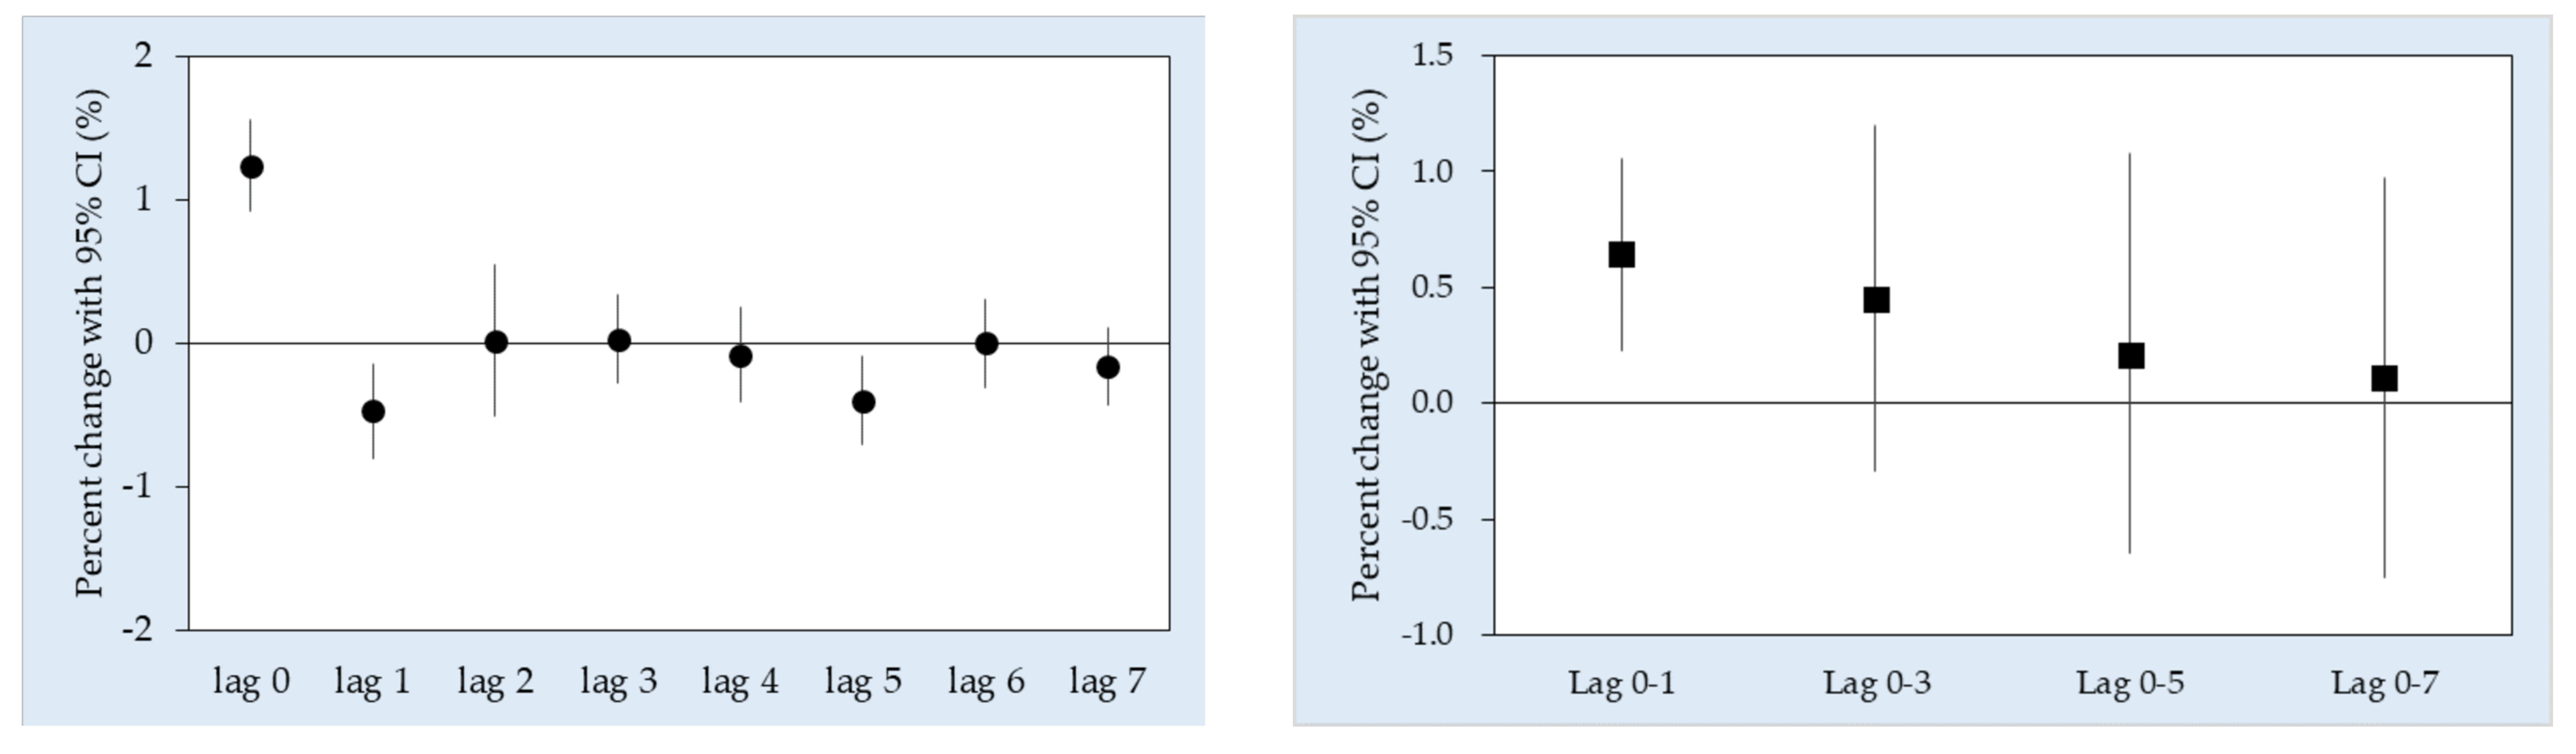
| Lag 0 a | 1.24 (0.21, 2.27) * | 1.29 (0.87, 1.71) * | 1.19 (0.75, 1.62) * |
| Average lags | |||
| Lag 0–1 | 0.89 (−0.09, 1.89) | 0.78 (0.25, 1.32) * | 0.65 (0.20, 1.11) * |
| Lag 0–3 | 1.09 (−0.14, 2.32) | 0.55 (−0.37, 1.48) | 0.61 (0.16, 1.07) * |
| Lag 0–5 | 0.45 (−0.96, 1.88) | 0.16 (−0.99, 1.33) | 0.34 (−0.36, 1.05) |
| Lag 0–7 | 0.03 (−1.53, 1.61) | 0.26 (−0.93, 1.47) | 0.05 (−0.73, 0.84) |
© 2018 by the authors. Licensee MDPI, Basel, Switzerland. This article is an open access article distributed under the terms and conditions of the Creative Commons Attribution (CC BY) license (http://creativecommons.org/licenses/by/4.0/).
Share and Cite
Phung, V.L.H.; Ueda, K.; Kasaoka, S.; Seposo, X.; Tasmin, S.; Yonemochi, S.; Phosri, A.; Honda, A.; Takano, H.; Michikawa, T.; et al. Acute Effects of Ambient PM2.5 on All-Cause and Cause-Specific Emergency Ambulance Dispatches in Japan. Int. J. Environ. Res. Public Health 2018, 15, 307. https://doi.org/10.3390/ijerph15020307
Phung VLH, Ueda K, Kasaoka S, Seposo X, Tasmin S, Yonemochi S, Phosri A, Honda A, Takano H, Michikawa T, et al. Acute Effects of Ambient PM2.5 on All-Cause and Cause-Specific Emergency Ambulance Dispatches in Japan. International Journal of Environmental Research and Public Health. 2018; 15(2):307. https://doi.org/10.3390/ijerph15020307
Chicago/Turabian StylePhung, Vera Ling Hui, Kayo Ueda, Shunji Kasaoka, Xerxes Seposo, Saira Tasmin, Shinichi Yonemochi, Arthit Phosri, Akiko Honda, Hirohisa Takano, Takehiro Michikawa, and et al. 2018. "Acute Effects of Ambient PM2.5 on All-Cause and Cause-Specific Emergency Ambulance Dispatches in Japan" International Journal of Environmental Research and Public Health 15, no. 2: 307. https://doi.org/10.3390/ijerph15020307