Social Network Analysis as a Methodological Approach to Explore Health Systems: A Case Study Exploring Support among Senior Managers/Executives in a Hospital Network


Abstract
:1. Introduction
2. Materials and Methods
2.1. Context
2.2. Participants
2.3. Measures
2.4. Data Collection and Procedure
2.5. Data Analysis
2.6. Ethical Considerations
3. Results
3.1. Participation
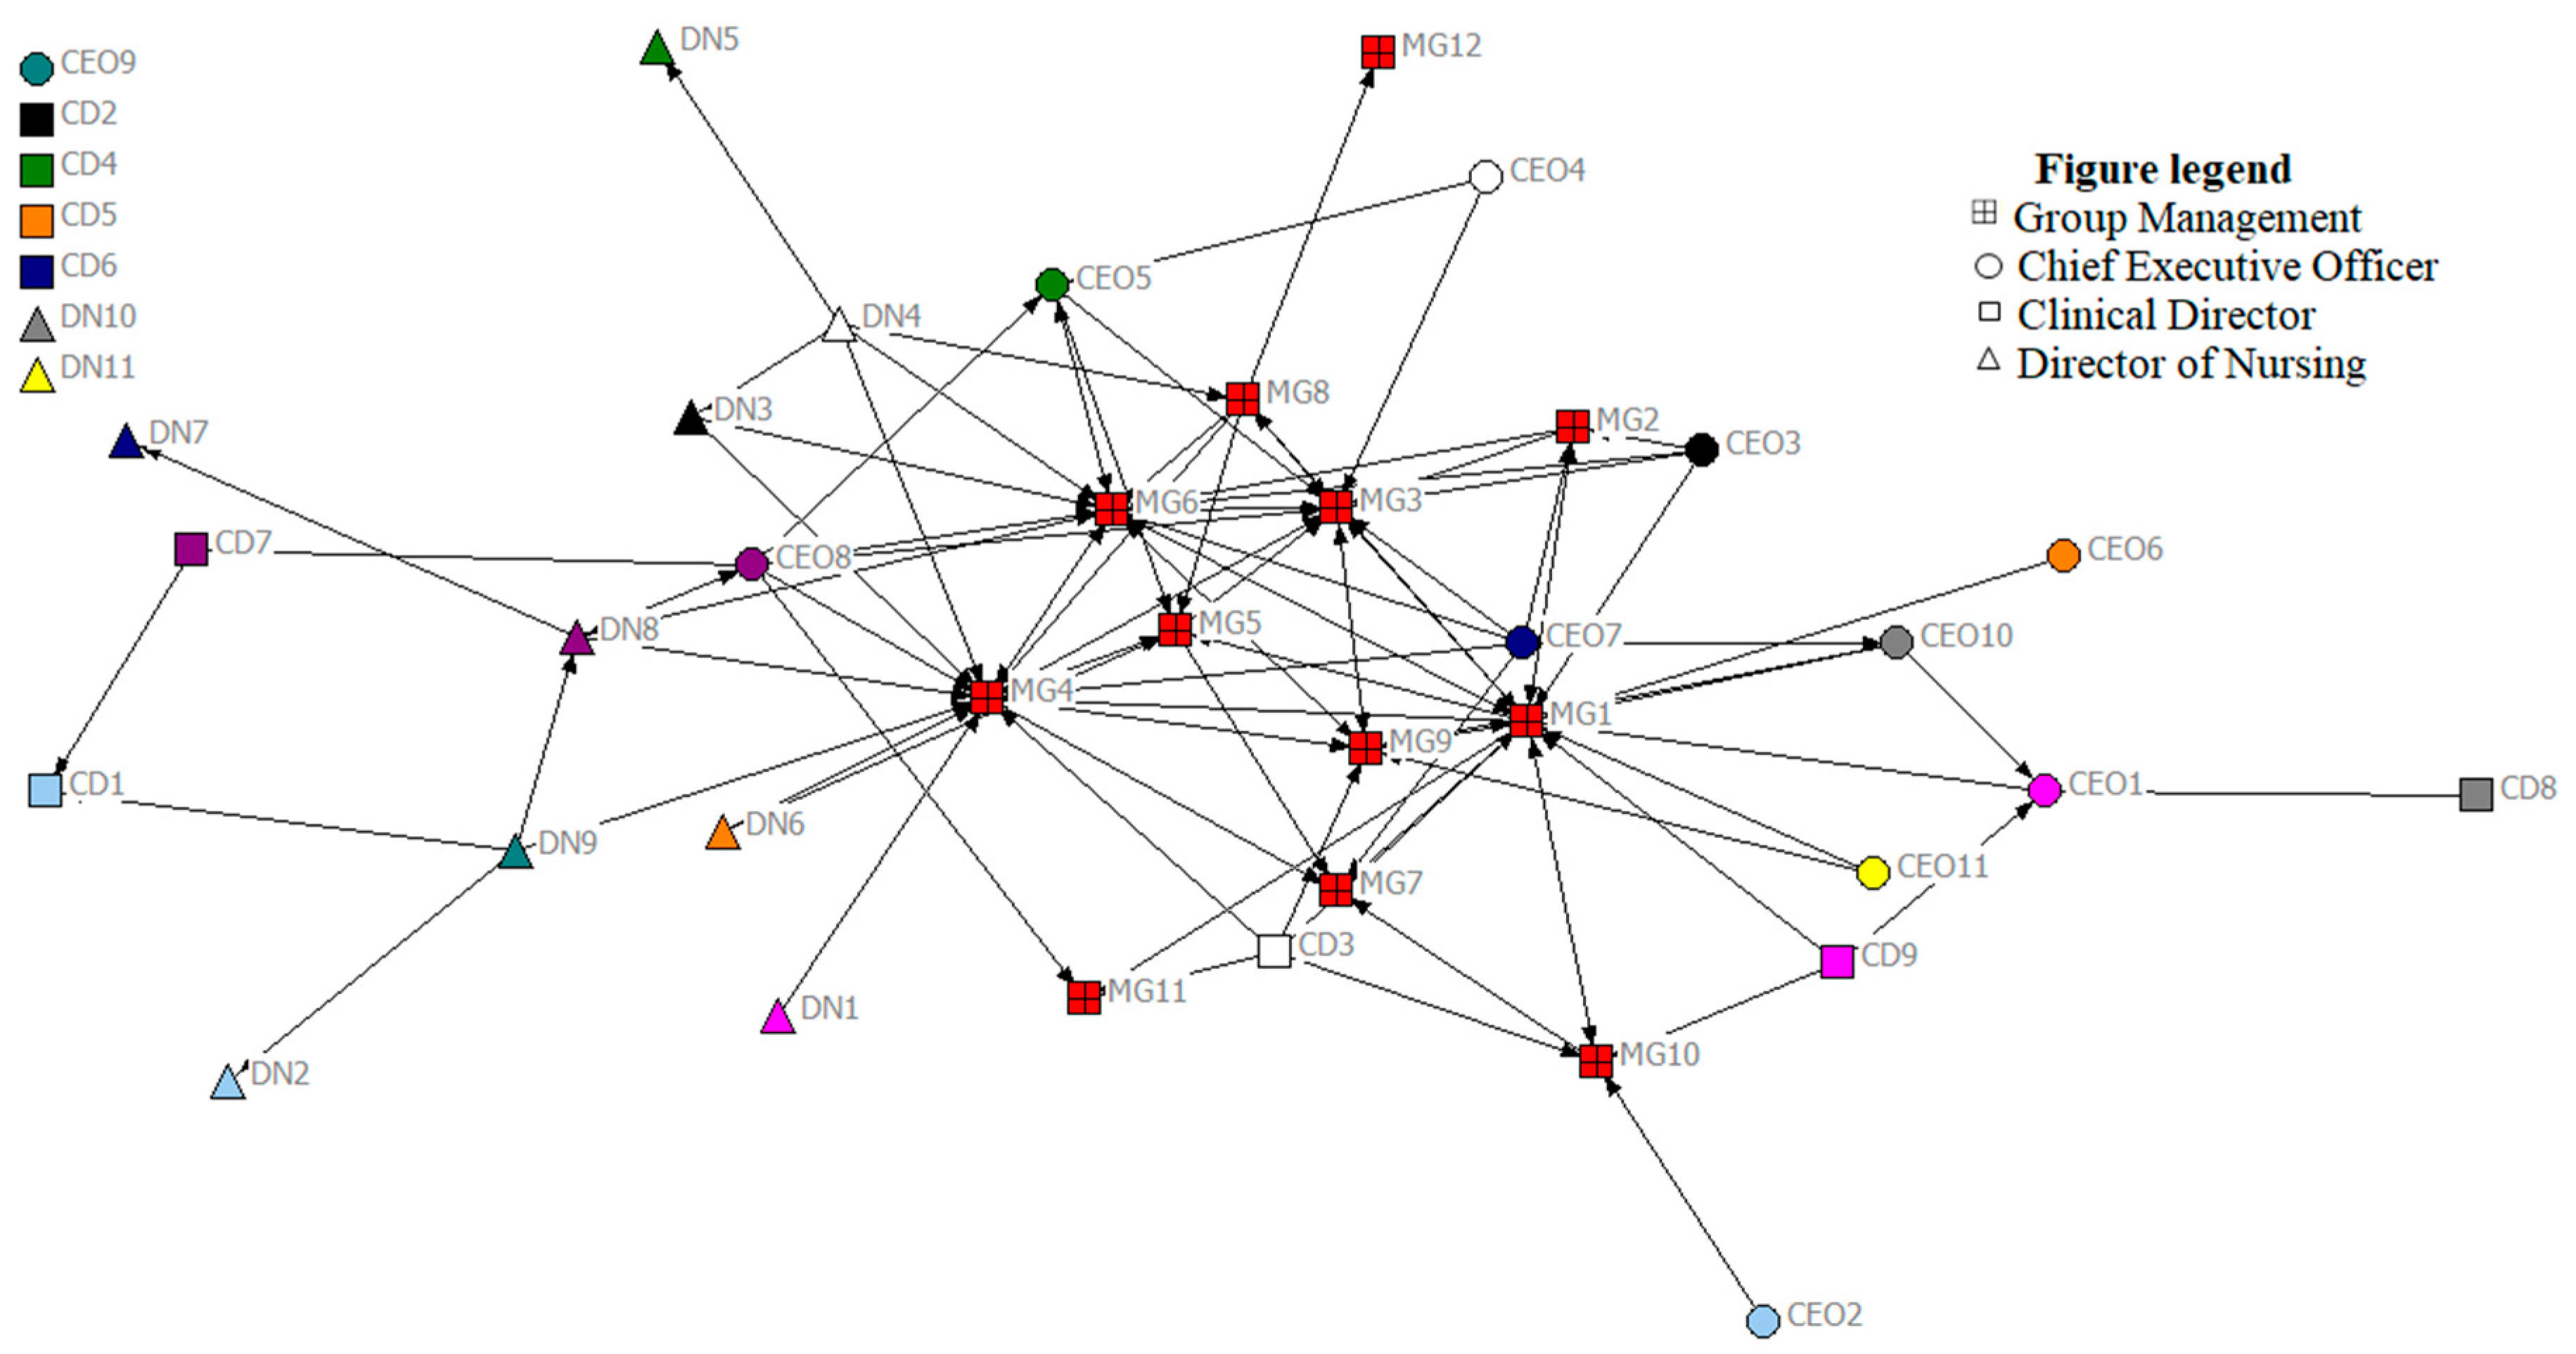
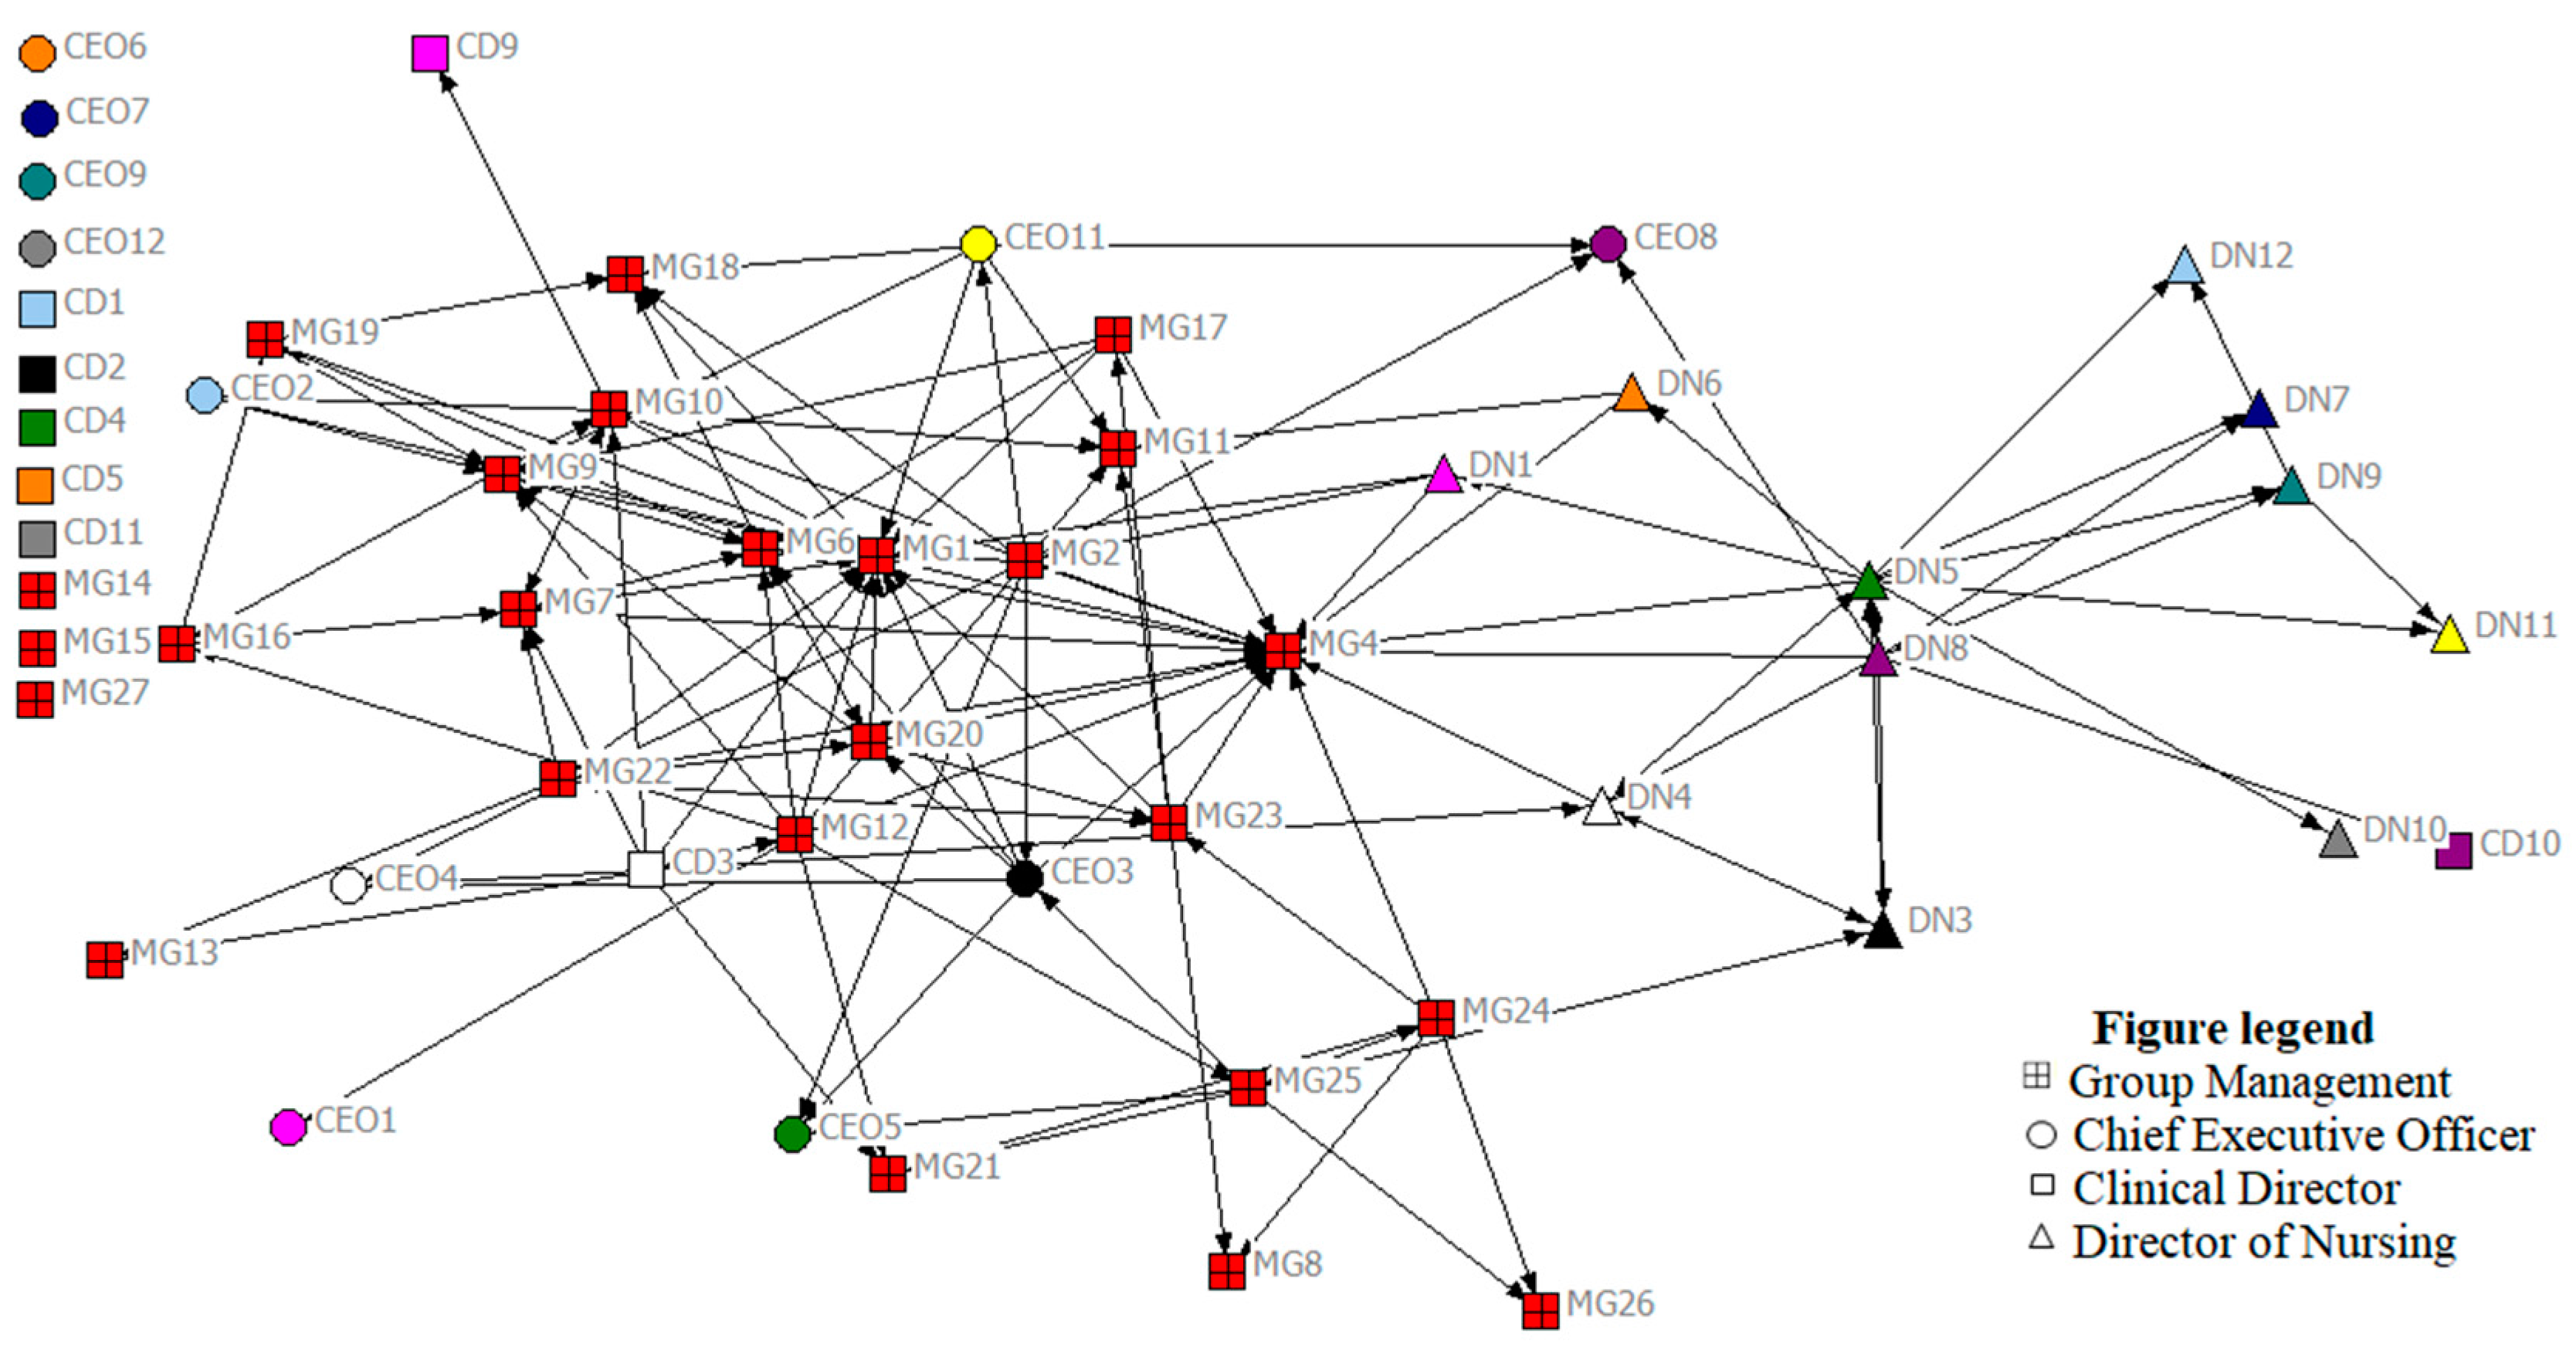
3.2. Network Maps
3.3. Network-Level Metrics
3.3.1. Density
3.3.2. Centralization
3.3.3. Network Structure: Core-Periphery
3.4. Node-Level Metrics
3.4.1. Degree
3.4.2. Betweenness and Bridging
4. Discussion
5. Conclusions
Acknowledgments
Author Contributions
Conflicts of Interest
References
- World Health Organization. World Health Report 2012: No Health Without Research; World Health Organization: Geneva, Switzerland, 2012. [Google Scholar]
- World Health Organization. The World Health Report 2000. Health Systems: Improving Performance. 2000. Available online: http://www.who.int/whr/2000/en/whr00_en.pdf (accessed on 8 December 2017).
- Blanchet, K.; James, P. How to do (or not to do)… a social network analysis in health systems research. Health Policy Plan. 2012, 27, 438–446. [Google Scholar] [CrossRef] [PubMed]
- Wasserman, S.; Faust, K. Social Network Analysis: Methods and Applications; Cambridge University Press: Cambridge, UK, 1994. [Google Scholar]
- Borgatti, S.P.; Everett, M.G.; Freeman, L.C. Ucinet for Windows: Software for Social Network Analysis, 6th ed.; Analytic Technologies: Harvard, MA, USA, 2002. [Google Scholar]
- Valente, T.W. Social Networks and Health: Models, Methods, and Applications; Oxford University Press: Oxford, UK, 2010. [Google Scholar]
- Chambers, D.; Wilson, P.; Thompson, C.; Harden, M. Social network analysis in healthcare settings: A systematic scoping review. PLoS ONE 2012, 7, e41911. [Google Scholar] [CrossRef] [PubMed]
- Marsden, P.V. Network data and measurement. Ann. Rev. Sociol. 1990, 16, 435–463. [Google Scholar] [CrossRef]
- Borgatti, S.P.; Carley, K.M.; Krackhardt, D. On the robustness of centrality measures under conditions of imperfect data. Soc. Netw. 2006, 28, 124–136. [Google Scholar] [CrossRef]
- Borgatti, S.P.; Everett, M.G.; Johnson, J.C. Analyzing Social Networks; SAGE Publications Limited: Oliver’s Yard, UK, 2013. [Google Scholar]
- Everett, M.G.; Borgatti, S.P. The centrality of groups and classes. J. Math. Sociol. 1999, 23, 181–201. [Google Scholar] [CrossRef]
- Hoppe, B.; Reinelt, C. Social network analysis and the evaluation of leadership networks. Leadersh. Q. 2010, 21, 600–619. [Google Scholar] [CrossRef]
- Freeman, L.C. Centrality in social networks conceptual clarification. Soc. Netw. 1979, 1, 215–239. [Google Scholar] [CrossRef]
- Balkundi, P.; Kilduff, M. The ties that lead: A social network approach to leadership. Leadersh. Q. 2006, 17, 419–439. [Google Scholar] [CrossRef]
- Cunningham, F.C.; Ranmuthugala, G.; Plumb, J.; Georgiou, A.; Westbrook, J.I.; Braithwaite, J. Health professional networks as a vector for improving healthcare quality and safety: A systematic review. BMJ Qual. Saf. 2012, 21, 239–249. [Google Scholar] [CrossRef] [PubMed]
- West, E.; Barron, D.N.; Dowsett, J.; Newton, J.N. Hierarchies and cliques in the social networks of health care professionals: Implications for the design of dissemination strategies. Soc. Sci. Med. 1999, 48, 633–646. [Google Scholar] [CrossRef]
- Putnam, R.D. The prosperous community. Am. Prospect. 1993, 4, 35–42. [Google Scholar]
- Carter, D.R.; Dechurch, L.A. Networks: The way forward for collectivistic leadership research. Ind. Organ. Psychol. 2012, 5, 412–415. [Google Scholar] [CrossRef]
- Brass, D.J.; Galaskiewicz, J.; Greve, H.R.; Tsai, W. Taking stock of networks and organizations: A multilevel perspective. Acad. Manag. J. 2004, 47, 795–817. [Google Scholar] [CrossRef]
- Higgins, J.R. The Establishment of Hospital Groups as a Transition to Independent Hospital Trusts. Department of Health, 2013. Available online: http://health.gov.ie/wp-content/uploads/2014/03/IndHospTrusts.pdf (accessed on 2 March 2017).
- McAuliffe, E.; De Brún, A.; Ward, M.; O’Shea, M.; Cunningham, U.; O’Donovan, R.; McGinley, S.; Fitzsimons, J.; Corrigan, S.; McDonald, N. Collective leadership and safety cultures (Co-Lead): Protocol for a mixed-methods pilot evaluation of the impact of a co-designed collective leadership intervention on team performance and safety culture in a hospital group in Ireland. BMJ Open 2017, e017569. [Google Scholar] [CrossRef] [PubMed]
- Borgatti, S.P. NetDraw Software for Network Visualization; Analytic Technologies: Lexington, KY, USA, 2002. [Google Scholar]
- Scott, J. Social Network Analysis; Sage: Newcastle upon Tyne, UK, 2017. [Google Scholar]
- Mullen, B.; Johnson, C.; Salas, E. Effects of communication network structure: Components of positional centrality. Soc. Netw. 1991, 13, 169–185. [Google Scholar] [CrossRef]
- Kilduff, M.; Tsai, W. Social Networks and Organizations; Sage: Newcastle upon Tyne, UK, 2003. [Google Scholar]
- Valente, T.W.; Chou, C.P.; Pentz, M.A. Community coalitions as a system: Effects of network change on adoption of evidence-based substance abuse prevention. Am. J. Public Health 2007, 97, 880–886. [Google Scholar] [CrossRef] [PubMed]

| Measure | Description |
|---|---|
| Centralization | Network-level measure that can assess the degree to which network links are focused on one or a few nodes in the network [6]. A centralized network is indicated when there is a high standard deviation of centrality scores, because some individuals have high centrality and some have low centrality. Conversely, a network is said to be decentralized when the standard deviation from centrality scores is low, as everyone in the network has similar centrality scores. |
| Core-Periphery | Core–periphery structures are network where there is a densely connected group of nodes and others who are more loosely connected. |
| Density | Density explores the number of ties in a network as divided by the number of potential ties. Links per node is also recommended for use alongside density to guard against the potential of misinterpretation of density score [12]. |
| Degree centrality | Degree is an often-used measure which examines the number of links to a person (in-degree) and from a person (out-degree). Valente [6] describes degree as a useful measure to identify opinion leaders in a network and/or as a measure of social integration. |
| Betweenness centrality | The frequency a person lies on the shortest path connecting everyone else in the network. This metric is valuable, as it indicates the degree to which a node occupies a strategic position in a network). Betweenness centrality is indicative of bridging, which refers to those individuals in a network who function to serve as the link diverse others. For instance, bridging may indicate access to new resources or links to external groups; having “bridgers” in a network is important in terms of linking to otherwise disconnected or distant groups and may indicate access to new resources. It is calculated using betweenness centrality [13]. |
| Network metrics | Time 1 | Time 2 | Change |
|---|---|---|---|
| Density | 0.06 | 0.05 | −00.1 |
| Distance-based cohesion | 0.12 | 0.1 | −0.02 |
| Average number of links per person | 2.28 | 2.45 | +0.17 |
| Degree centralization | 0.19 | 0.16 | −0.03 |
| Average distance | 2.14 | 2.95 | +0.81 |
| Diameter (max distance) (SD) | 5 (0.94) | 9 (1.65) | +4 |
| Node Metrics | Time 1 | Time 2 |
|---|---|---|
| Highest in-degree (person contacted most for support) | MG 4 (14) | MG1 (14) |
| MG6 (13) | MG4 (17) | |
| MG1 and MG3 (12) | MG9 (8) | |
| Greatest number of links | MG1 (22 ties) | MG1 (19 ties) |
| MG4 (19 ties) | MG4 (17 ties) | |
| MG6 (18 ties) | MG6 (15 ties) | |
| Highest in betweenness | MG1 (154) | DN5 (163) |
| MG 6 (69) | MG1 (124) | |
| MG 4 (48) | MG6 (123) |
© 2018 by the authors. Licensee MDPI, Basel, Switzerland. This article is an open access article distributed under the terms and conditions of the Creative Commons Attribution (CC BY) license (http://creativecommons.org/licenses/by/4.0/).
Share and Cite
De Brún, A.; McAuliffe, E. Social Network Analysis as a Methodological Approach to Explore Health Systems: A Case Study Exploring Support among Senior Managers/Executives in a Hospital Network. Int. J. Environ. Res. Public Health 2018, 15, 511. https://doi.org/10.3390/ijerph15030511
De Brún A, McAuliffe E. Social Network Analysis as a Methodological Approach to Explore Health Systems: A Case Study Exploring Support among Senior Managers/Executives in a Hospital Network. International Journal of Environmental Research and Public Health. 2018; 15(3):511. https://doi.org/10.3390/ijerph15030511
Chicago/Turabian StyleDe Brún, Aoife, and Eilish McAuliffe. 2018. "Social Network Analysis as a Methodological Approach to Explore Health Systems: A Case Study Exploring Support among Senior Managers/Executives in a Hospital Network" International Journal of Environmental Research and Public Health 15, no. 3: 511. https://doi.org/10.3390/ijerph15030511