An Assessment of the Impact of Urbanization on Soil Erosion in Inner Mongolia


Abstract
:
1. Introduction
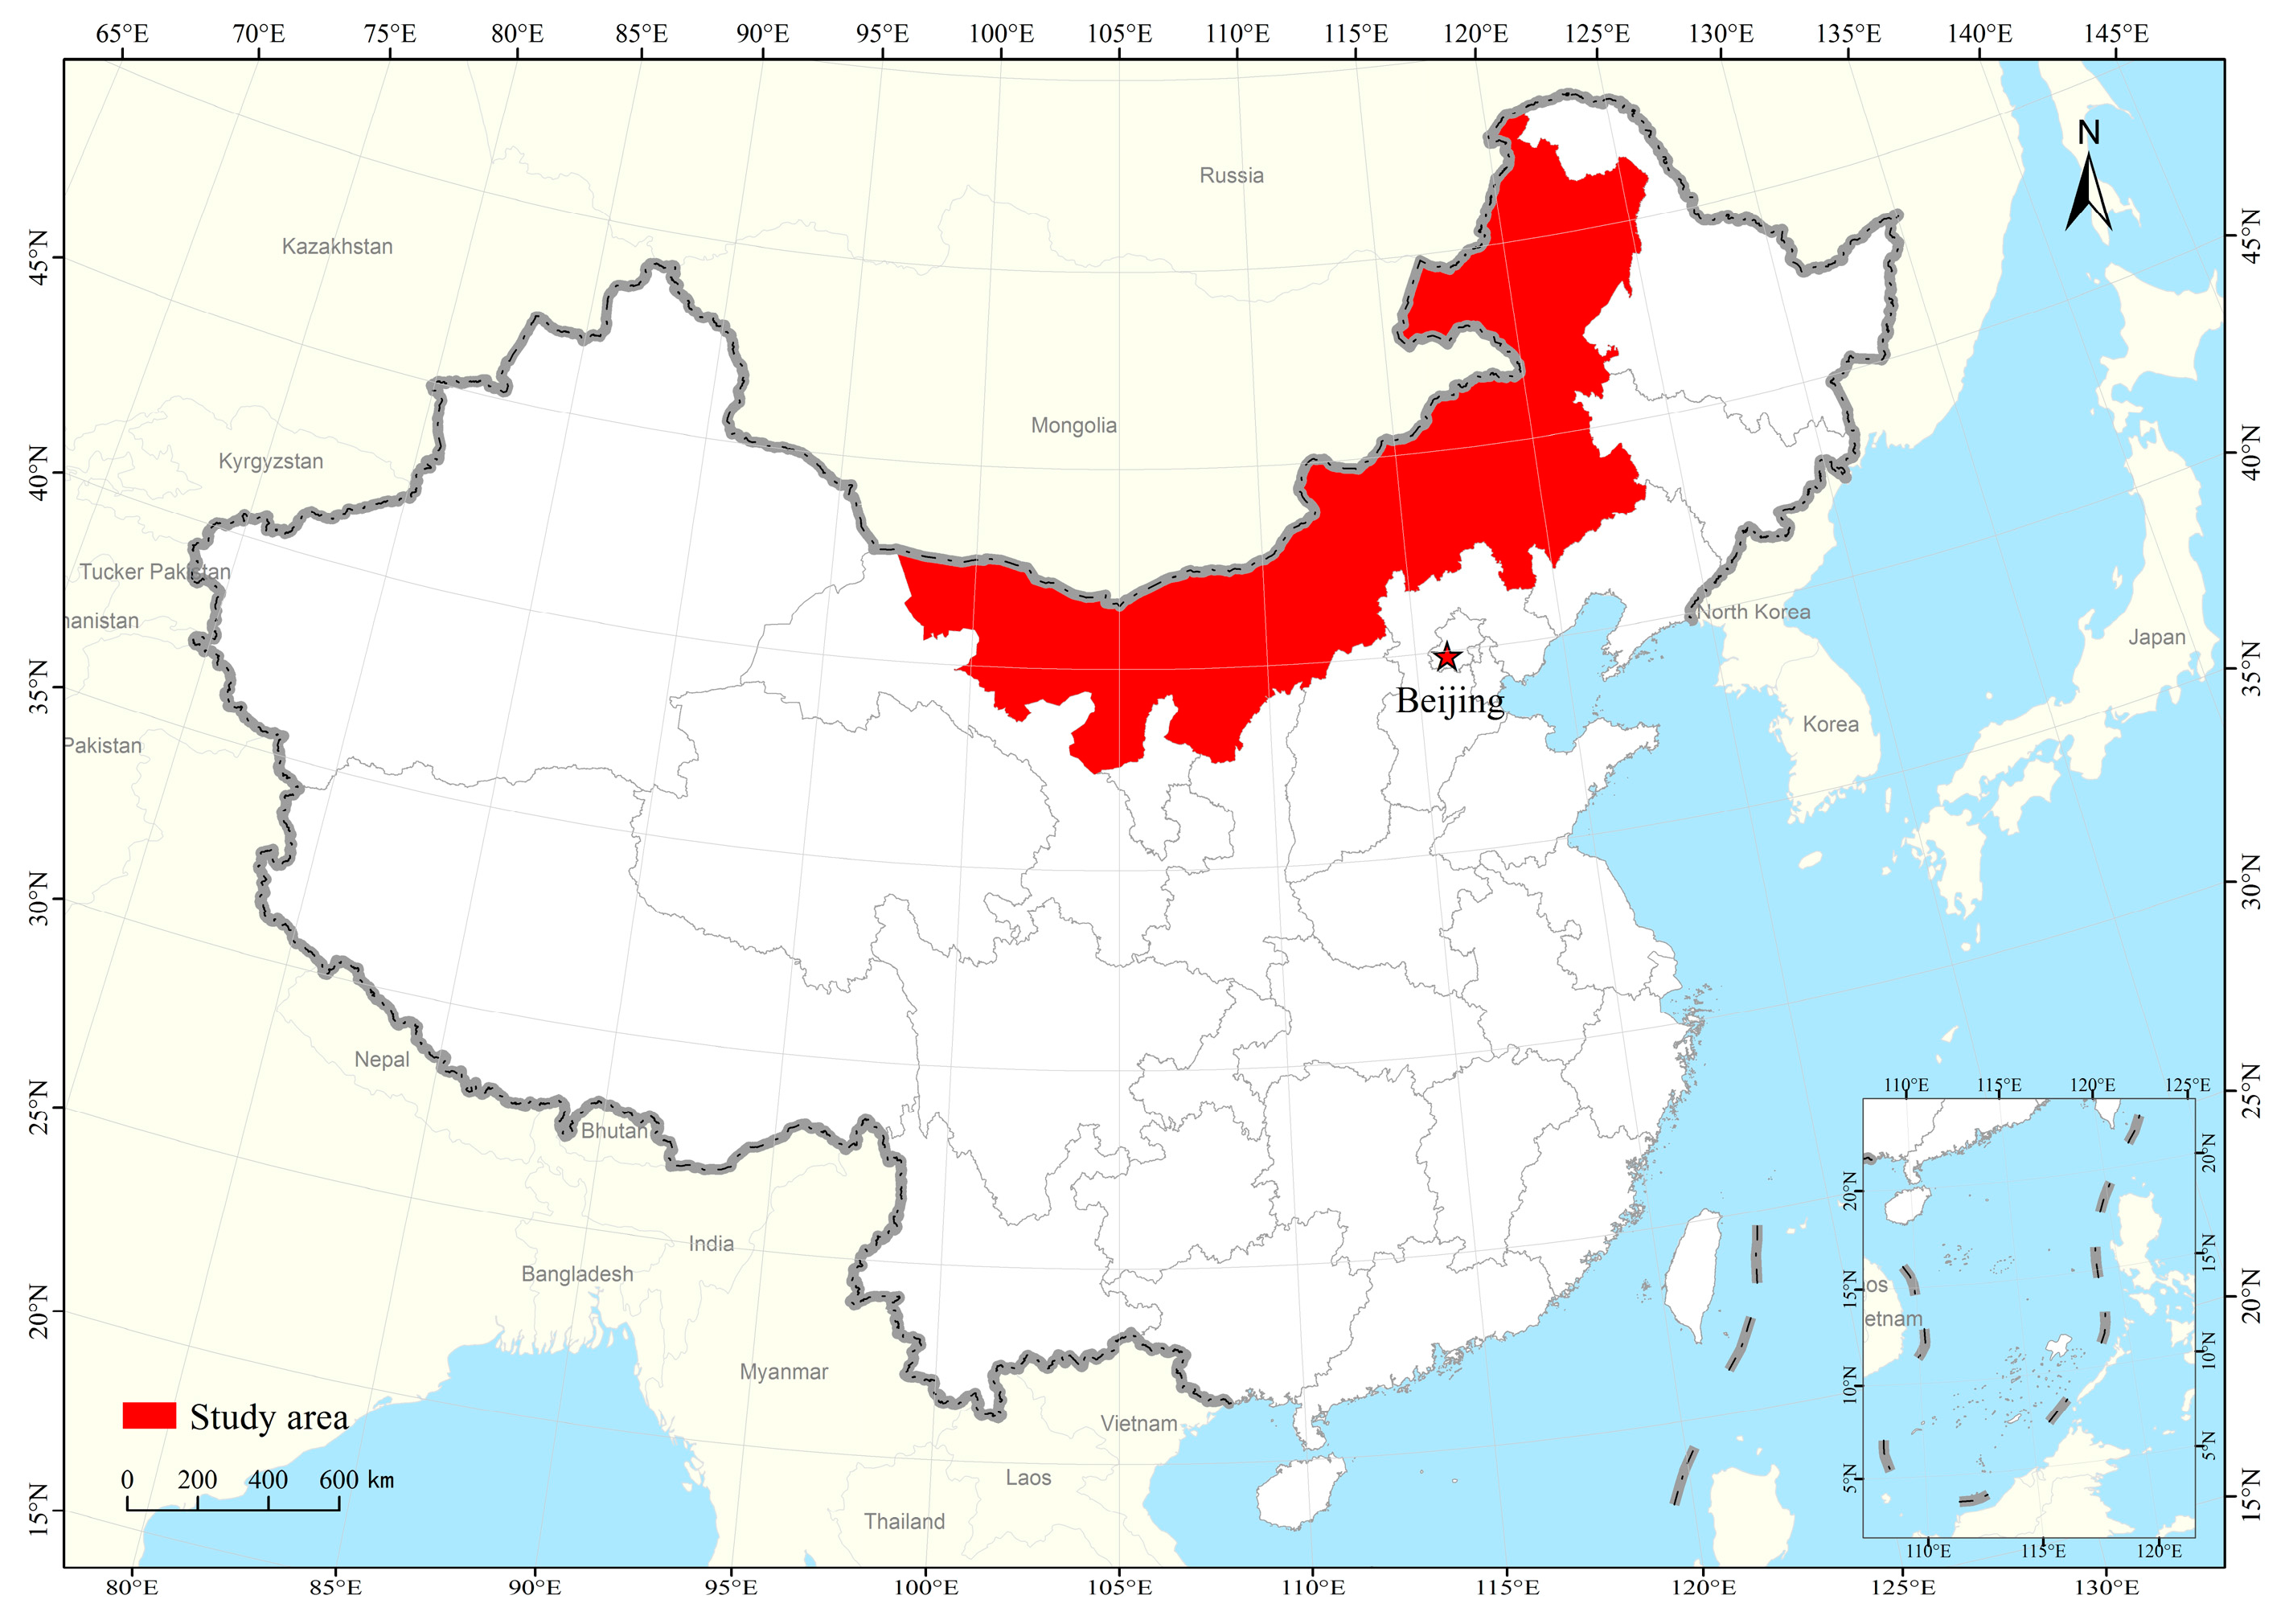
2. Study Area
3. Materials and Methods
4. Results
4.1. Urbanization
4.2. Land Use Matrix
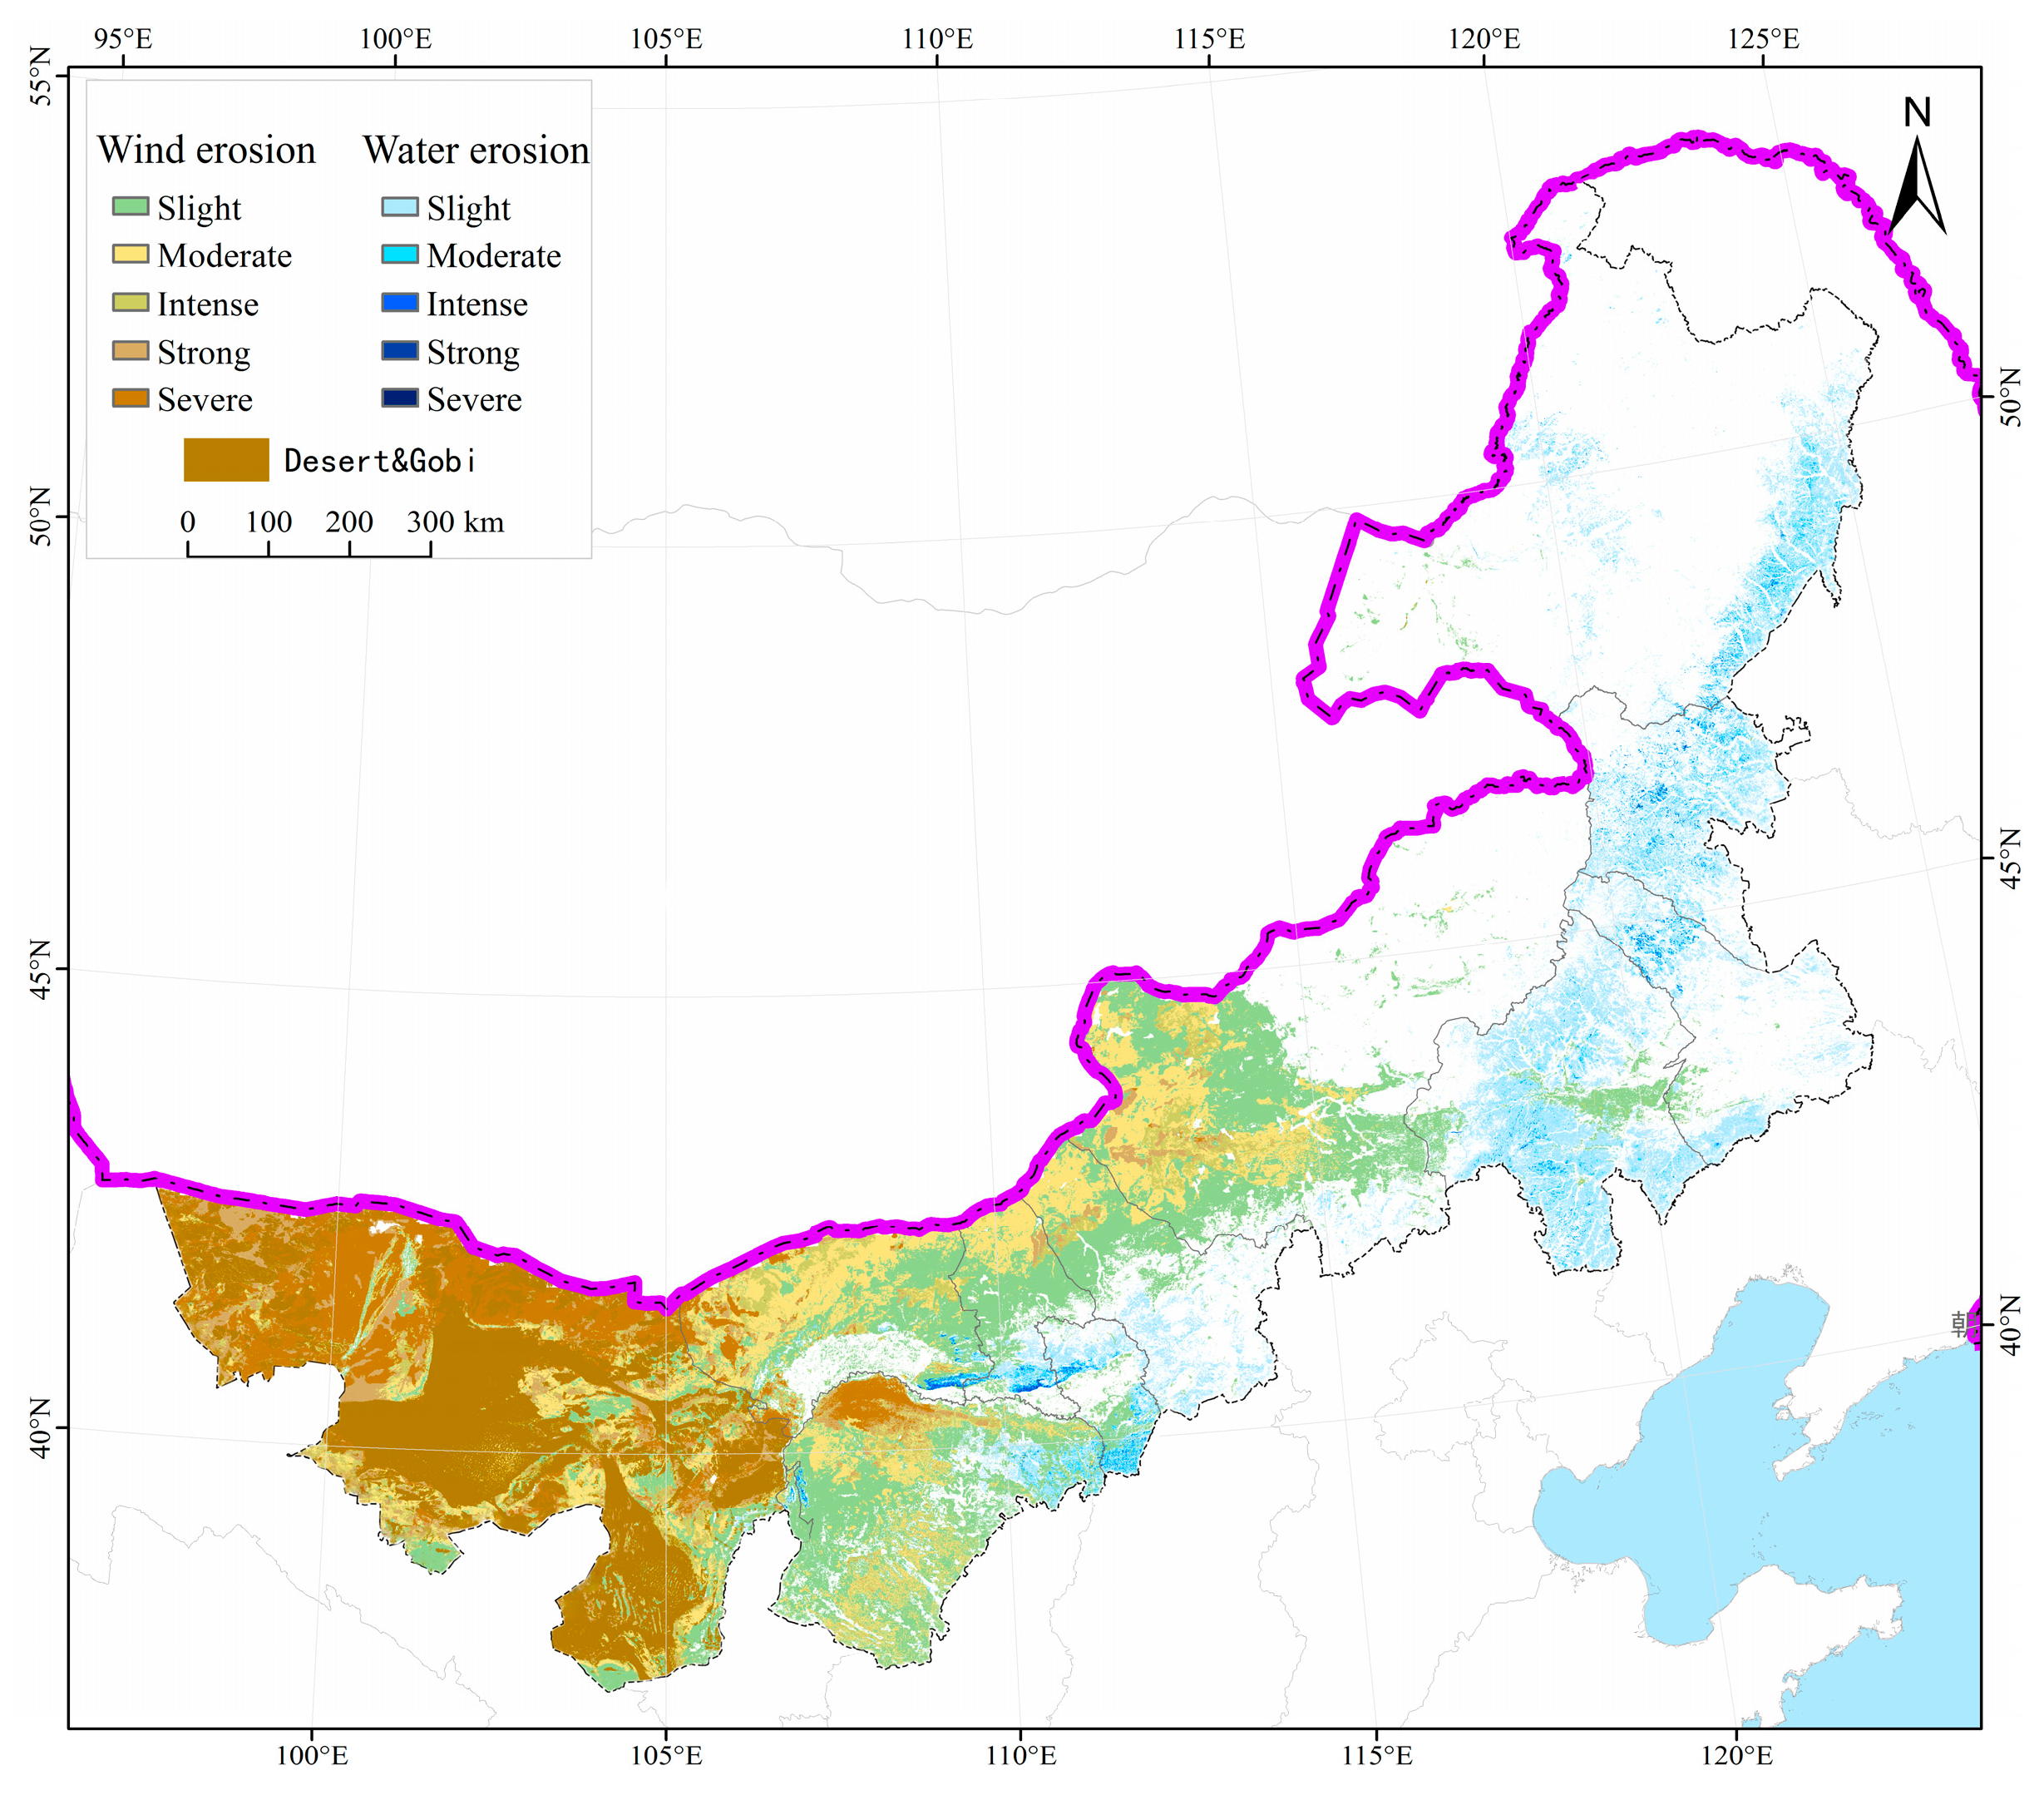
4.3. Soil Erosion
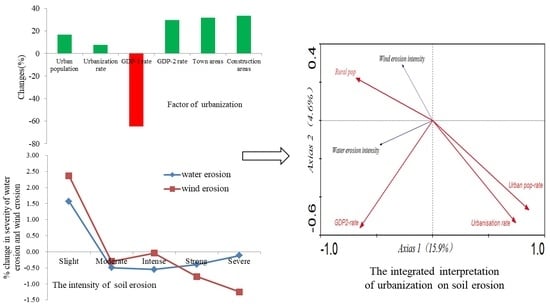
4.4. The Relationship between Urbanization and Soil Erosion
5. Discussion
6. Conclusions
Acknowledgments
Author Contributions
Conflicts of Interest
References
- Martine, G.; Marshall, A. State of world population 2007: Unleashing the potential of urban growth. In State of World Population: Unleashing the Potential of Urban Growth; UNFPA: New York, NY, USA, 2007. [Google Scholar]
- Yan, X.; Lin, Z. The change of spatial disparities of urban development in China, 1990s. Acta Geogr. Sin. 2004, 3, 437–445. [Google Scholar]
- Kirkby, R.J. Urbanization in China: Town and Country in a Developing Economy 1949–2000 ad; Routledge: Abingdon-on-Thames, UK, 2018; Volume 3. [Google Scholar]
- Shin, H.B. Urbanization in China. In International Encyclopedia of the Social and Behavioral Sciences, 2nd ed.; Elsevier: Amsterdam, The Netherlands, 2015; pp. 973–979. [Google Scholar]
- Zhao, J.; Liu, H.; Dong, R. Sustainable urban development: Policy framework for sustainable consumption and production. Int. J. Sustain. Dev. World Ecol. 2008, 15, 318–325. [Google Scholar]
- Adamec, R.E. The interaction of hunger and preying in the domestic cat (felis catus): An adaptive hierarchy? Behav. Biol. 1976, 18, 263–272. [Google Scholar] [CrossRef]
- Ghani, S.E.; Kanbur, R. Urbanization and (in) Formalization; World Bank: Washington, DC, USA, 2013. [Google Scholar]
- Hugo, G. New Forms of Urbanization: Beyond the Urban-Rural Dichotomy; Routledge: Abingdon-on-Thames, UK, 2017. [Google Scholar]
- Hammond, A.L. World Resources: 1992-93; A Guide to the Global Environment; Oxford University Press: Oxford, UK, 1992. [Google Scholar]
- Sklyarova, E.K. Comparative aspects of scientific research of the urbanization problem. Научный альманах стран Причерноморья 2016, 1, 17–21. [Google Scholar]
- Jin, D.; Gu, S.; Shen, L. Analysis on urbanization dynamics: On factors and strategic choices of urbanization in China. China Popul. Resour. Environ. 2004, 14, 59–64. [Google Scholar]
- Faulkner, S. Urbanization impacts on the structure and function of forested wetlands. Urban Ecosyst. 2004, 7, 89–106. [Google Scholar] [CrossRef]
- McDonald, R.I. Global urbanization: Can ecologists identify a sustainable way forward? Front. Ecol. Environ. 2008, 6, 99–104. [Google Scholar] [CrossRef]
- Grimm, N.B.; Foster, D.; Groffman, P.; Grove, J.M.; Hopkinson, C.S.; Nadelhoffer, K.J.; Pataki, D.E.; Peters, D.P. The changing landscape: Ecosystem responses to urbanization and pollution across climatic and societal gradients. Front. Ecol. Environ. 2008, 6, 264–272. [Google Scholar] [CrossRef]
- Deng, X.; Huang, J.; Rozelle, S.; Uchida, E. Cultivated land conversion and potential agricultural productivity in China. Land Use Policy 2006, 23, 372–384. [Google Scholar] [CrossRef]
- Gardi, C.; Panagos, P.; Van Liedekerke, M.; Bosco, C.; De Brogniez, D. Land take and food security: Assessment of land take on the agricultural production in Europe. J. Environ. Plan. Manag. 2015, 58, 898–912. [Google Scholar] [CrossRef]
- Pandey, B.; Seto, K.C. Urbanization and agricultural land loss in India: Comparing satellite estimates with census data. J. Environ. Manag. 2015, 148, 53–66. [Google Scholar] [CrossRef] [PubMed]
- Bao, C.; Fang, C. Water resources flows related to urbanization in China: Challenges and perspectives for water management and urban development. Water Resour. Manag. 2012, 26, 531–552. [Google Scholar] [CrossRef]
- Pimentel, D.; Harvey, C.; Resosudarmo, P.; Sinclair, K.; Kurz, D.; McNair, M.; Crist, S.; Shpritz, L.; Fitton, L.; Saffouri, R. Environmental and economic costs of soil erosion and conservation benefits. Science 1995, 267, 1117–1123. [Google Scholar] [CrossRef] [PubMed]
- Rao, E.; Xiao, Y.; Ouyang, Z.; Yu, X. National assessment of soil erosion and its spatial patterns in China. Ecosyst. Health Sustain. 2015, 1, 1–10. [Google Scholar] [CrossRef]
- Chen, L. Implement the Central Decision and Deployment Thoroughly, and Write a New Chapter of Soil and Water Conservation and Ecological Construction with Chinese Characteristics; Ministry of Water Resources of the People’s Republic of China: Beijing, China, 2012.
- Otani, S.; Kurosaki, Y.; Kurozawa, Y.; Shinoda, M. Dust storms from degraded drylands of Asia: Dynamics and health impacts. Land 2017, 6, 83. [Google Scholar] [CrossRef]
- Goudie, A.S. Desert dust and human health disorders. Environ. Int. 2014, 63, 101–113. [Google Scholar] [CrossRef] [PubMed]
- Copeland, N.; Sharratt, B.; Wu, J.; Foltz, R.; Dooley, J. A wood-strand material for wind erosion control: Effects on total sediment loss, PM 10 vertical flux, and PM 10 loss. J. Environ. Qual. 2009, 38, 139–148. [Google Scholar] [CrossRef] [PubMed]
- Yang, G.; Ming, Q. Pressures of urbanization on ecology and environment in Inner Mongolia. Arid Land Geogr. 2007, 30, 141–148. [Google Scholar]
- Qiao, B.; Fang, C. The dynamic coupling model of the harmonious development between urbanization and eco-environment and its application in arid area. Acta Ecol. Sin. 2005, 25, 3003–3009. [Google Scholar]
- Ye, D.; Chou, J.; Liu, J. Causes of sand-stormy weather in northern China and control measures. Acta Geogr. Sin. 2000, 55, 513–521. [Google Scholar]
- Tao, W.; Chen, G.; Qian, Z.; Yang, G.; Qu, J.; Li, D. Situation of sand-dust storms and countermeasures in north China. J. Desert Res. 2001, 21, 322–327. [Google Scholar]
- Li, L.; Guo, Q. The parsing of sandstorm source in Beijing in 2000. Res. Environ. Sci. 2001, 14, 1–3. [Google Scholar]
- Jiang, L.; Xiao, Y.; Zheng, H.; Ouyang, Z. Spatio-temporal variation of wind erosion in Inner Mongolia of China between 2001 and 2010. Chin. Geogr. Sci. 2016, 26, 155–164. [Google Scholar] [CrossRef]
- Ouyang, Z.; Zheng, H.; Xiao, Y.; Polasky, S.; Liu, J.; Xu, W.; Wang, Q.; Zhang, L.; Xiao, Y.; Rao, E.; et al. Improvements in ecosystem services from investments in natural capital. Science 2016, 352, 1455–1459. [Google Scholar] [CrossRef] [PubMed]
- Rao, E.; Xiao, Y.; Ouyang, Z.; Zheng, H. Changes in ecosystem service of soil conservation between 2000 and 2010 and its driving factors in southwestern China. Chin. Geogr. Sci. 2016, 26, 165–173. [Google Scholar] [CrossRef]
- Renard, K.G. Predicting Soil Erosion by Water: A Guide to Conservation Planning with the Revised Universal Soil Loss Equation (RUSLE); USDA: Washington, DC, USA, 1997.
- Chen, T.; Niu, R.; Li, P.; Zhang, L.; Du, B. Regional soil erosion risk mapping using RUSLE, GIS, and remote sensing: A case study in Miyun Watershed, north China. Environ. Earth Sci. 2011, 63, 533–541. [Google Scholar] [CrossRef]
- Demirci, A.; Karaburun, A. Estimation of soil erosion using RUSLE in a GIS framework: A case study in the Buyukcekmece Lake Watershed, northwest Turkey. Environ. Earth Sci. 2012, 66, 903–913. [Google Scholar] [CrossRef]
- Zobeck, T.M.; Pelt, S.V.; Stout, J.E.; Popham, T.W.; Ascough Ii, J.C.; Flanagan, D.C. Validation of the Revised Wind Erosion Equation (REWQ) for single events and discrete periods. In Soil Erosion Research for the 21th Century; American Society of Agricultural and Biological Engineers: St. Joseph County, MI, USA, 2001; pp. 471–474. [Google Scholar]
- Borrelli, P.; Lugato, E.; Montanarella, L.; Panagos, P. A new assessment of soil loss due to wind erosion in European agricultural soils using a quantitative spatially distributed modelling approach. Land Degrad. Dev. 2017, 28, 335–344. [Google Scholar] [CrossRef]
- Panagos, P.; Borrelli, P.; Poesen, J.; Ballabio, C.; Lugato, E.; Meusburger, K.; Montanarella, L.; Alewell, C. The new assessment of soil loss by water erosion in Europe. Environ. Sci. Policy 2015, 54, 438–447. [Google Scholar] [CrossRef]
- Wischmeier, W.H.; Smith, D.D. Predicting Rainfall Erosion Losses—A Guide to Conservation Planning; USDA, Science and Education Administration: Hyattsville, MD, USA, 1978.
- State Council Office of China (SCO). Training Manual of the First Nationwide Water Resources Survey: Census of Soil and Water Conservation; Water Power Press: Beijing, China, 2010. [Google Scholar]
- Zhang, K.; Shu, A.; Xu, X.; Yang, Q.; Yu, B. Soil erodibility and its estimation for agricultural soils in China. J. Arid Environ. 2008, 72, 1002–1011. [Google Scholar] [CrossRef]
- Van Remortel, R.D.; Hamilton, M.E.; Hickey, R.J. Estimating the LS factor for RUSLE through iterative slope length processing of digital elevation data within Arclnfo grid. Cartography 2001, 30, 27–35. [Google Scholar] [CrossRef]
- Chepil, W. A compact rotary sieve and the importance of dry sieving in physical soil analysis 1. Soil Sci. Soc. Am. J. 1962, 26, 4–6. [Google Scholar] [CrossRef]
- Zobeck, T. Abrasion of crusted soils: Influence of abrader flux and soil properties. Soil Sci. Soc. Am. J. 1991, 55, 1091–1097. [Google Scholar] [CrossRef]
- Bilbro, J.; Fryrear, D. Wind erosion losses as related to plant silhouette and soil cover. Agron. J. 1994, 86, 550–553. [Google Scholar] [CrossRef]
- Ministry of Water Resources of the People’s Republic of China (MWRPRC). Standards for Classification and Gradation of Soil Erosion (SL190–2007); Ministry of Water Resources of the People’s Republic of China Press: Beijing, China, 2008.
- Henderson, V. The urbanization process and economic growth: The so-what question. J. Econ. Growth 2003, 8, 47–71. [Google Scholar] [CrossRef]
- Heilig, G.K. World Urbanization Prospects: The 2011 Revision; United Nations, Department of Economic and Social Affairs (DESA), Population Division, Population Estimates and Projections Section: New York, NY, USA, 2012; p. 14. [Google Scholar]
- Li, X.; Fang, C.; Huang, J.; Mao, H. The urban land use transformations and associated effects on eco-environment in northwest China arid region: A case study in Hexi region, Gansu province. Quat. Sci. 2003, 23, 280–290. [Google Scholar]
- Standardization Administration of the People’s Republic of China. The Classification for National Economic Activities (GB/T 4754-2017). Available online: http://www.sac.gov.cn/was5/web/search?channelid=97779&templet=gjcxjg_detail.jsp&searchword=standard_code=%27gb/t%204754-2017%27 (accessed on 30 June 2017).
- Hou, Y.; Zhang, Y.; Wu, B. Eco-environmentalimpact of urbanization process in a sandy area. Bull. Soil Water Conserv. 2013, 33, 97–102. [Google Scholar]
- Chen, D. Introduction the ecological roles of urbanization in desertification area at north of Shaanxi province. Ecol. Econ. 2004, 10, 35–38. [Google Scholar]
- Liu, A.; Ci, L. A systematic analysis of theman-made influence in modern desertification process. J. Nat. Resour. 1997, 12, 211–218. [Google Scholar]
- Schiettecatte, W.; Cornelis, W.; Acosta, M.; Leal, Z.; Lauwers, N.; Almoza, Y.; Alonso, G.; Díaz, J.; Ruíz, M.; Gabriels, D. Influence of landuse on soil erosion risk in the Cuyaguateje watershed (Cuba). Catena 2008, 74, 1–12. [Google Scholar] [CrossRef]
- Montgomery, D.R. Soil erosion and agricultural sustainability. Proc. Natl. Acad. Sci. USA 2007, 104, 13268–13272. [Google Scholar] [CrossRef] [PubMed]
- Yang, D.; Kanae, S.; Oki, T.; Koike, T.; Musiake, K. Global potential soil erosion with reference to land use and climate changes. Hydrol. Process. 2003, 17, 2913–2928. [Google Scholar] [CrossRef]
- Borrelli, P.; Robinson, D.A.; Fleischer, L.R.; Lugato, E.; Ballabio, C.; Alewell, C.; Meusburger, K.; Modugno, S.; Schütt, B.; Ferro, V. An assessment of the global impact of 21st century land use change on soil erosion. Nat. Commun. 2017, 8, 2013. [Google Scholar] [CrossRef] [PubMed]
- Liu, S.; Wang, T. Climate change and local adaptation strategies in the middle Inner Mongolia, northern China. Environ. Earth Sci. 2012, 66, 1449–1458. [Google Scholar] [CrossRef]
- Chu, C.; Meng, H. Ecology migration and sustainable development of economy in Inner Mongolia Autonomous region. Res. Agric. Mod. 2006, 2, 005. [Google Scholar]
- Wang, H.; Xu, J.; Yan, M. Effect of socio-economic factors on soil erosion: A literature review. Prog. Geogr. 2011, 30, 268–274. [Google Scholar]
- Tang, K. Soil and Water Conservation in China; Science Press: Beijing, China, 2004; pp. 29–287. [Google Scholar]
- Zhang, H.; Wang, Z. The influence of Shenfu-Dongsheng coal mining on river bed siltation and sediment load of Wulanmulun River. Res. Soil Water Conserv. 1994, 4, 79–85. [Google Scholar]
- Feng, J.; Rui, L. Effects of mining construction on social-economics in Shenfu-Dongsheng coal mine area-an analysis of social-economics changes in Daliuta area. Res. Soil Water Conserv. 1994, 1, 138–143. [Google Scholar]


| Data | Resolution | Source |
|---|---|---|
| Digital elevation model (DEM) | 90 m | Computer Network Information Center (CNIC) of CAS |
| Soil map and attribute data | 1:1,000,000 | The second National Soil Survey of China |
| Ecosystem classification | 90 m, TM | Remote Sensing Applications of CAS |
| Average annual rainfall erosivity | - | Beijing Normal University |
| Precipitation | 0.05 degree | Chinese National Metrological Information Center/China Meteorological Administration (NMIC/CMA) |
| Temperature | 0.05 degree | NMIC/CMA |
| Wind speed | 0.05 degree | The Cold and Arid Regions Science Data Center (CARD)/ The China Meteorological Science Data Service Network |
| Annual solar radiation data/snow cover | - | The Cold and Arid Regions Sciences Data Center in Lanzhou (http://westdc.westgis.ac.cn) |
| Vegetation cover | 90 m | CAS |
| Socioeconomic data | Counties | Inner Mongolia Statistical Yearbook |
| Year | 2000 | 2010 | 2000–2010 | |
|---|---|---|---|---|
| Total | Total | Difference | Change (%) | |
| Total population (millions) | 23.06 | 25.00 | 1.94 | 8.40 |
| Rural population (millions) | 13.34 | 13.68 | 0.34 | 2.52 |
| Urban population (millions) | 9.72 | 11.32 | 1.60 | 16.47 |
| Urbanization rate (%) | 42.16 | 45.29 | 3.14 | 7.44 |
| GDP-1 rate (%) | 25.59 | 8.99 | −16.60 | –64.87 |
| GDP-2 rate (%) | 40.36 | 52.33 | 11.97 | 29.66 |
| Town areas (km2) | 9800 | 12,900 | 3100 | 31.71 |
| Construction areas (km2) | 9600 | 12,800 | 3200 | 33.33 |
| Transferred Area (km2) | Forest | Shrub | Grassland | Wetland | Farmland | Urban Land | Sandy | Bare Land |
|---|---|---|---|---|---|---|---|---|
| Forest | - | 3.26 | 13.37 | 12.94 | 18.42 | 39.19 | 1.00 | 0.49 |
| Shrub | 2.07 | - | 7.01 | 0.49 | 1.62 | 23.45 | 0.10 | 0.68 |
| Grassland | 789.00 | 400.95 | - | 237.98 | 679.65 | 1754.03 | 165.34 | 143.65 |
| Wetland | 44.42 | 8.44 | 565.10 | - | 568.77 | 90.49 | 220.94 | 122.28 |
| Farmland | 147.57 | 162.53 | 112.15 | 237.69 | - | 432.60 | 2.89 | 4.73 |
| Urban land | 0.55 | 6.4 | 10.00 | 1.47 | 5.56 | - | 0.04 | 1.10 |
| Sandy | 13.97 | 16.22 | 173.03 | 45.63 | 76.57 | 41.66 | - | 2.74 |
| Bare land | 21.23 | 46.02 | 174.64 | 162.98 | 49.25 | 127.49 | 0.94 | - |
| Decrease | −88.67 | −35.42 | −4170.60 | −1620.44 | −1100.16 | −25.12 | −369.82 | −582.55 |
| Increase | 1018.82 | 643.82 | 1041.92 | 686.23 | 1381.41 | 2469.73 | 390.24 | 275.17 |
| Net change | 930.15 | 608.40 | −3128.68 | −934.21 | 281.25 | 2444.61 | 20.42 | −307.38 |
| Soil Erosion | Water Erosion | Wind Erosion | Total Erosion Areas | |||||||||
|---|---|---|---|---|---|---|---|---|---|---|---|---|
| 2000 | 2010 | 2000–2010 | 2000 | 2010 | 2000–2010 | 2000 | 2010 | 2000–2010 | ||||
| Area (km2) | Area (km2) | Variation (km2) | Change (%) | Area (km2) | Area (km2) | Variation (km2) | Change (%) | Area (km2) | Area (km2) | Variation (km2) | Change (%) | |
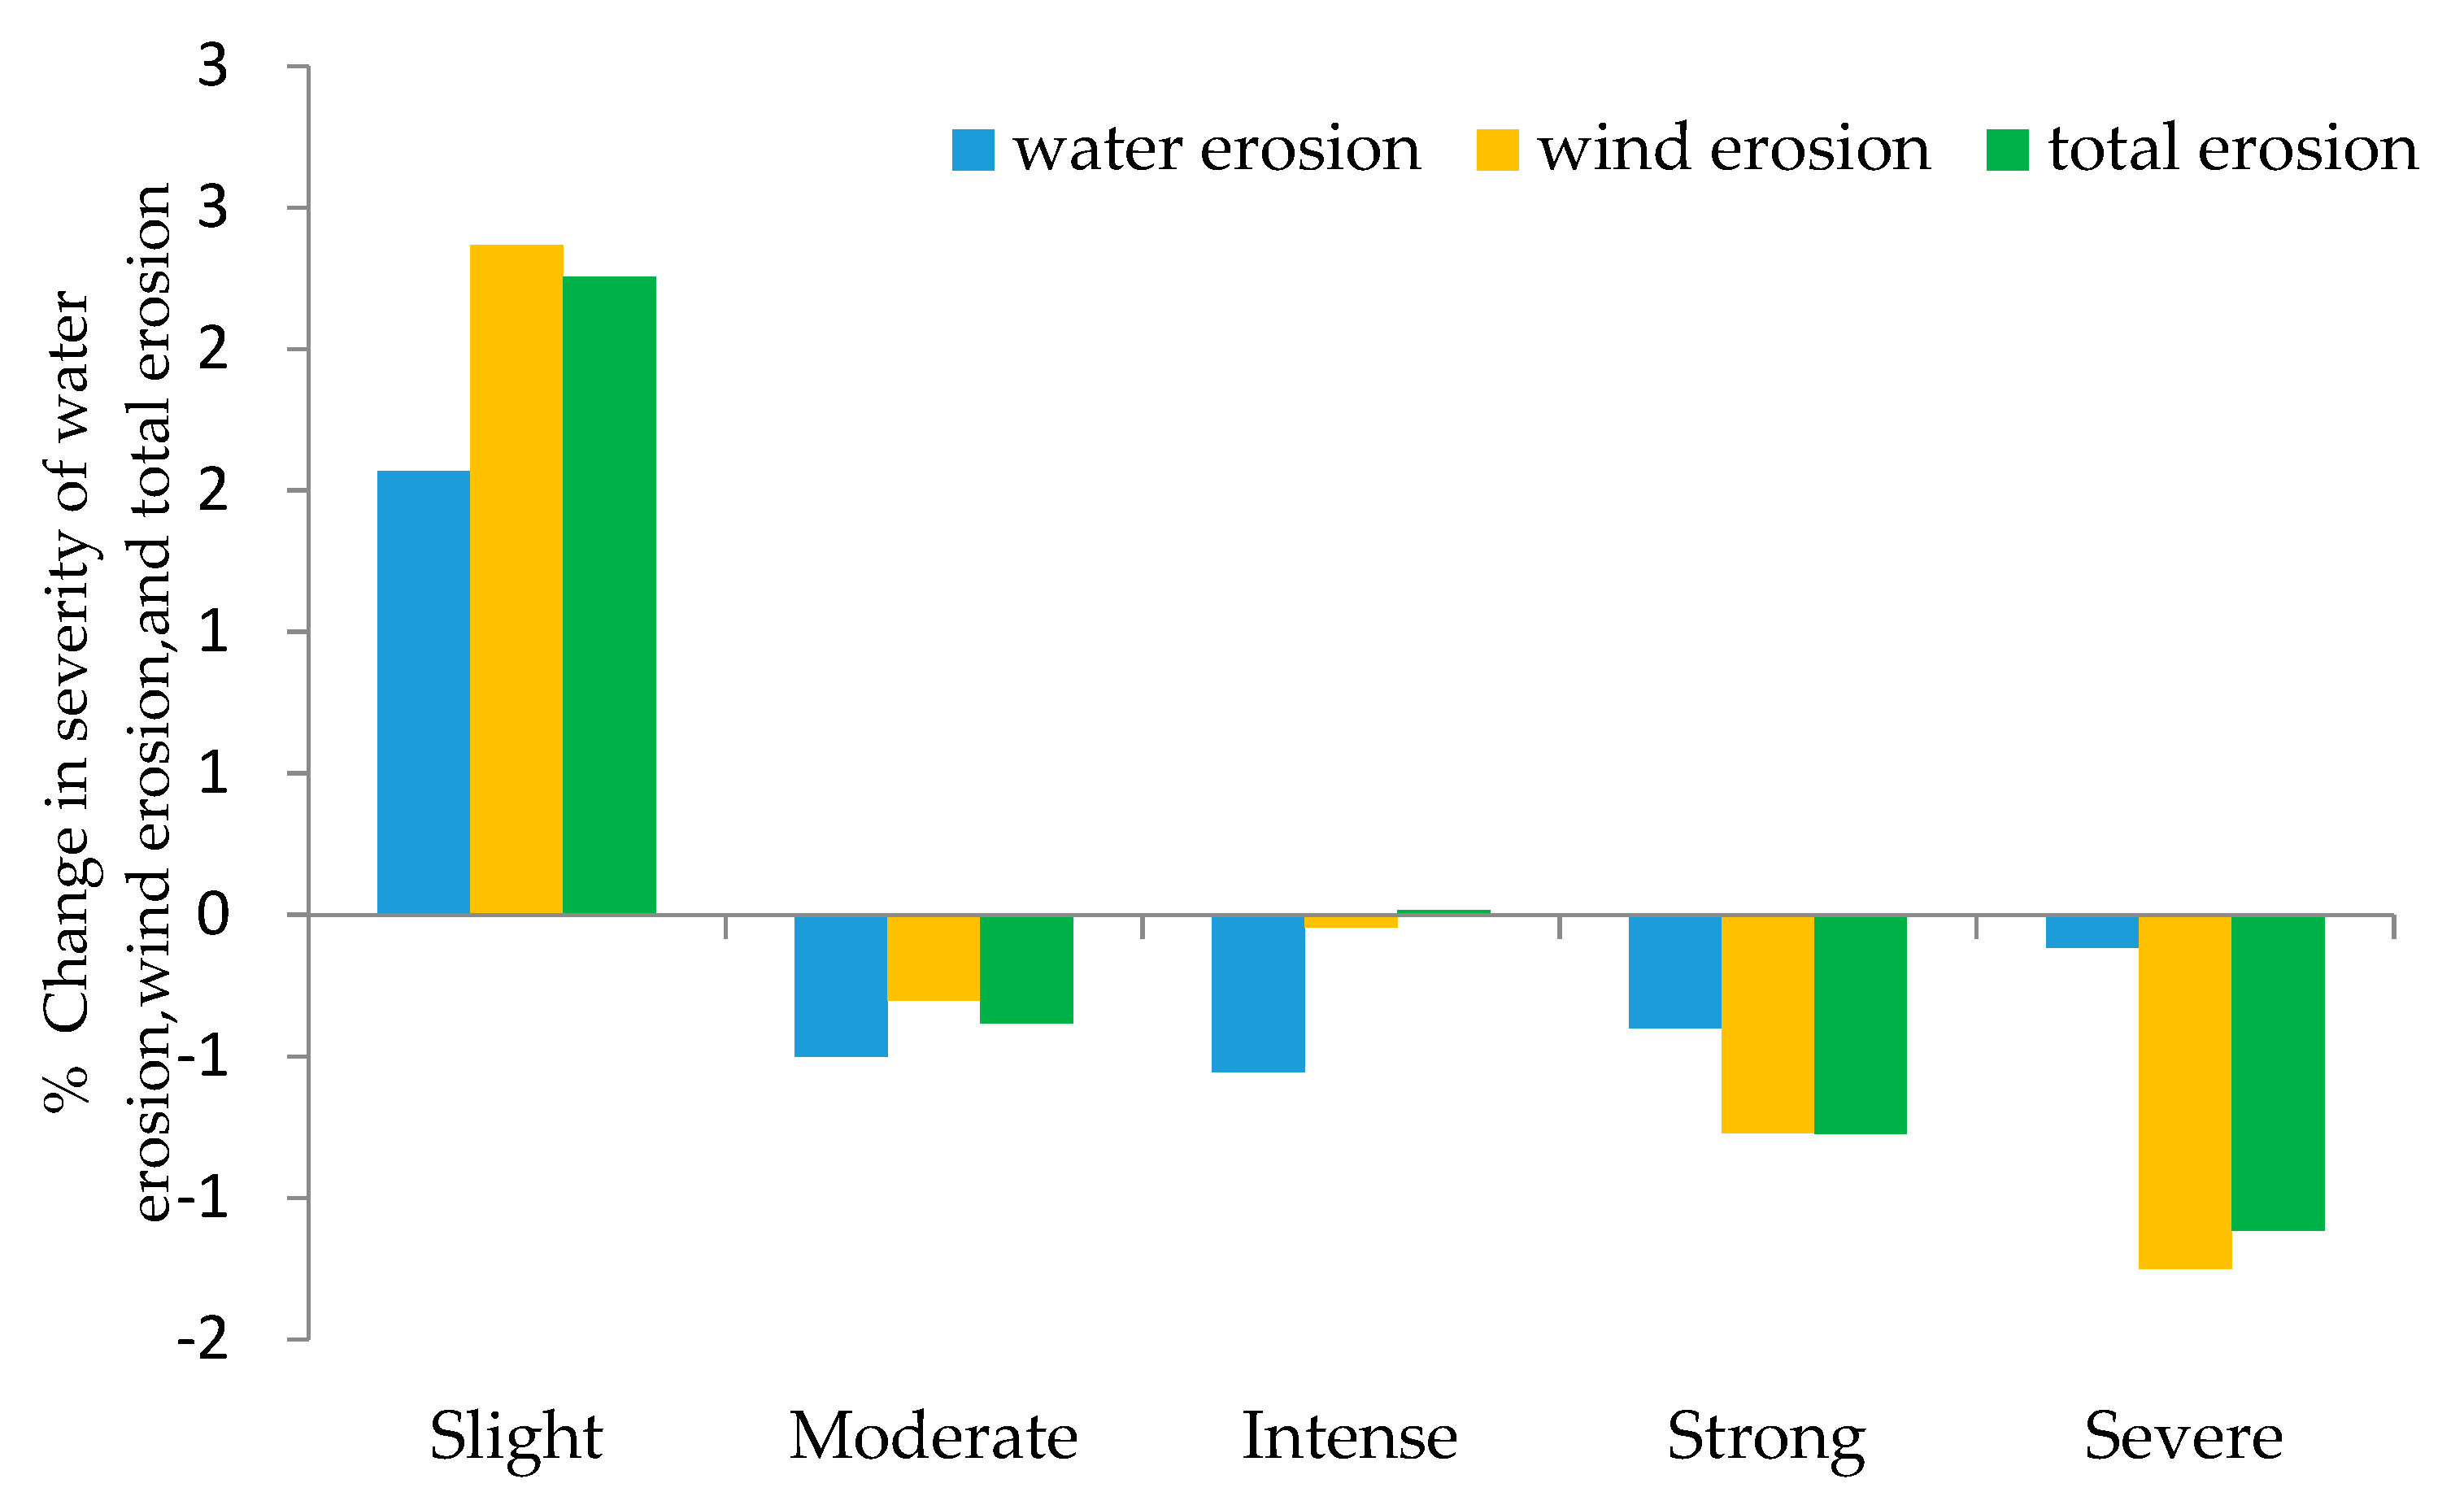
| Slight | 106,907 | 104,105 | −2802 | −2.62 | 234,010 | 238,006 | 3996 | 1.71 | 328,716 | 329,611 | 895 | 0.27 |
| Moderate | 15,312 | 14,007 | −1305 | −8.52 | 117,106 | 110,200 | −6906 | −5.90 | 122,864 | 114,929 | −7935 | −6.46 |
| Intense | 4708 | 3806 | −902 | −19.16 | 60,417 | 57,523 | −2894 | −4.79 | 63,411 | 60,755 | −2656 | −4.19 |
| Strong | 2405 | 1800 | −605 | −25.16 | 121,201 | 111,306 | −9895 | −8.16 | 110,900 | 100,869 | −10,031 | −9.05 |
| Severe | 1309 | 1106 | −203 | −15.51 | 94,110 | 82,511 | −11,599 | −12.32 | 78,926 | 67,971 | −10,955 | −13.88 |
| Sum | 130,641 | 124,824 | −5817 | −4.45 | 626,844 | 599,546 | −27,298 | −4.35 | 704,817 | 674,135 | −30,682 | −4.35 |
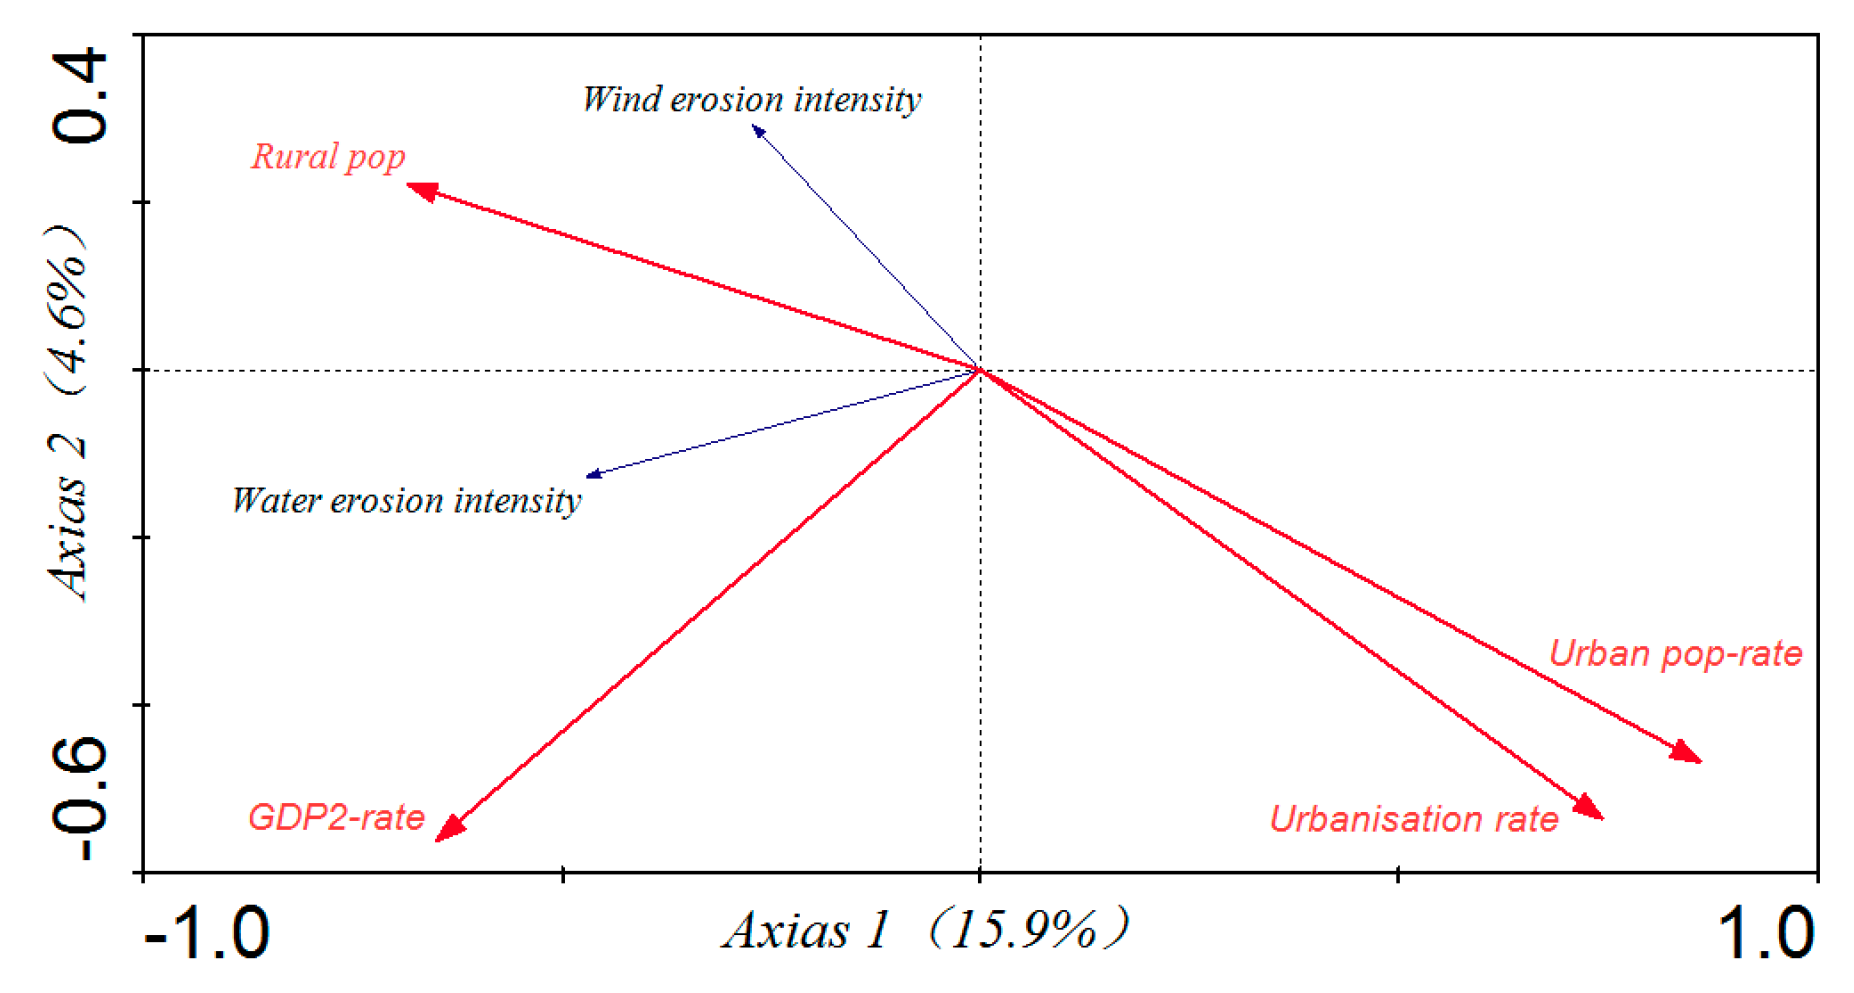
| Change of Intensity (n = 101) | Change of Impact Factor | |||
|---|---|---|---|---|
| GDP-2 Rate | Urban Population | Rural Population | Urbanization Rate | |
| Water erosion | 0.393 * | −0.308 * | 0.353 ** | −0.318 * |
| Wind erosion | 0.993 ** | −0.420 ** | 0.285 * | −0.442 ** |
© 2018 by the authors. Licensee MDPI, Basel, Switzerland. This article is an open access article distributed under the terms and conditions of the Creative Commons Attribution (CC BY) license (http://creativecommons.org/licenses/by/4.0/).
Share and Cite
Wang, L.-Y.; Xiao, Y.; Rao, E.-M.; Jiang, L.; Xiao, Y.; Ouyang, Z.-Y. An Assessment of the Impact of Urbanization on Soil Erosion in Inner Mongolia. Int. J. Environ. Res. Public Health 2018, 15, 550. https://doi.org/10.3390/ijerph15030550
Wang L-Y, Xiao Y, Rao E-M, Jiang L, Xiao Y, Ouyang Z-Y. An Assessment of the Impact of Urbanization on Soil Erosion in Inner Mongolia. International Journal of Environmental Research and Public Health. 2018; 15(3):550. https://doi.org/10.3390/ijerph15030550
Chicago/Turabian StyleWang, Li-Yan, Yi Xiao, En-Ming Rao, Ling Jiang, Yang Xiao, and Zhi-Yun Ouyang. 2018. "An Assessment of the Impact of Urbanization on Soil Erosion in Inner Mongolia" International Journal of Environmental Research and Public Health 15, no. 3: 550. https://doi.org/10.3390/ijerph15030550