Article

Characterization of Fine Particulate Matter and Associated Health Burden in Nanjing

1
Jiangsu Key Laboratory of Atmospheric Environment Monitoring and Pollution Control, Collaborative Innovation Center of Atmospheric Environment and Equipment Technology, School of Environmental Science and Engineering, Nanjing University of Information Science & Technology, Nanjing 210044, China
2
School of Atmospheric Physics, Nanjing University of Information Science & Technology, Nanjing 210044, China
*
Authors to whom correspondence should be addressed.
Int. J. Environ. Res. Public Health 2018, 15(4), 602; https://doi.org/10.3390/ijerph15040602
Submission received: 7 February 2018 / Revised: 15 March 2018 / Accepted: 15 March 2018 / Published: 27 March 2018
(This article belongs to the Special Issue Air Quality and Health)

Abstract

:
Particulate matter (PM) air pollution has become a serious environmental problem in Nanjing and poses great health risks to local residents. In this study, characteristics of particulate matter with an aerodynamic diameter less than 2.5 μm (PM2.5) over Nanjing were analyzed using hourly and daily averaged PM2.5 concentrations and meteorological parameters collected from nine national monitoring sites during the period of March 2014 to February 2017. Then, the integrated exposure-response (IER) model was applied to assess premature mortality, years of life lost (YLL) attributable to PM2.5, and mortality benefits due to PM2.5 reductions. The concentrations of PM2.5 varied among hours, seasons and years, which can be explained by differences in emission sources, secondary formations and meteorological conditions. The decreased ratio of PM2.5 to CO suggested that secondary contributions decreased while the relative contributions of vehicle exhaust increased from increased CO data. According to the values of attributable fractions (AF), stroke was the major cause of death, followed by ischemic heart disease (IHD), lung cancer (LC) and chronic obstructive pulmonary disease (COPD). The estimated total deaths in Nanjing due to PM2.5 were 12,055 and 10,771, leading to 98,802 and 87,647 years of life lost in 2014 and 2015, respectively. The elderly and males had higher health risks than youngsters and females. When the PM2.5 concentrations meet the World Health Organization (WHO) Air Quality Guidelines (AQG) of 10 μg/m3, 84% of the premature deaths would be avoided, indicating that the Nanjing government needs to adopt more stringent measure to reduce PM pollution and enhance the health benefits.

1. Introduction

Along with rapid industrialization and urbanization, China has been experiencing severe air pollution problems, especially in particulate matter (PM) pollution. The annual average concentrations of particles with an aerodynamic diameter equal to or less than 2.5 μm (PM2.5) in most Chinese cities have greatly exceeded the World Health Organization (WHO) guideline value of 10 μg/m3 [1,2,3,4,5,6,7]. The Yangtze River Delta (YRD) is one of the most developed and polluted regions in China, and it has been identified as a key area for the Air Pollution Prevention and Control Action Plan since 2013 [8]. Nanjing, located in the middle and lower reaches of the Yangtze River region, is the capital city of Jiangsu province, with an area of 6596 km2 and a population of 8.27 million by the end of 2016. Due to the well-developed industry and increasing number of vehicles [9], severe PM2.5 pollution was seen in Nanjing from historical data. Considering its high population density, adverse impacts on human health could be expected, or, in fact, observed [10,11].
PM2.5 have been proven to be the triggers for a variety of illnesses, such as bronchitis, asthma, diabetes, chronic obstructive pulmonary disease (COPD), and cardiovascular disease [12,13,14,15,16,17,18,19]. The International Agency for Research on Cancer (IARC) has classified outdoor air pollution and air pollution-derived PM as carcinogenic to humans. The integrated exposure–response (IER) function was developed for the Global Burden of Disease Study by integrating PM2.5 information and producing a more reasonable prediction of the relative risks (RRs) [20]. It has been employed in a number of recent mortality estimates attributed to PM2.5 exposure [20,21,22,23,24,25]. To date, long-term exposure to PM2.5 has been considered to induce premature mortality from COPD, stroke, ischemic heart disease (IHD), lung cancer (LC) and acute lower respiratory infection (ALRI) [21,22,23,24,26,27,28,29,30,31]. Premature mortality due to air pollution in China have been widely reported in previous studies. Lelieveld et al. [32] estimated that outdoor air pollution in China caused about 1.36 million premature deaths in 2010. Liu et al. [27] reported that 1.37 million adult premature mortalities in China were related with PM2.5 in 2013. Cohen et al. [28] estimated that PM2.5 caused 1.1 million premature deaths by a 25-year trends of the global burden of disease study over China in 2015.
To provide a better understanding of the effects of implementing the toughest ever air pollution control policy, premature mortality and years of life lost (YLL) serves two important health-related indicators to be tested. Zhang et al. [33] has estimated the improvements in air quality and the corresponding health benefits since the beginning of the Clean Air Action Plan in China. Song et al. [21] reported that the mortality benefits would be 24.0%, 44.8%, 70.8%, and 85.2% of the total current mortalities (1.5 million) when the population-weighted average (PWA) PM2.5 concentrations in China meets the World Health Organization (WHO) Air Quality Guidelines (AQG: 10 μg/m3) and three interim targets (ITs, IT-1: 35 μg/m3, IT-2: 25 μg/m3, IT-3: 15 μg/m3), respectively. Hu et al. [22] also pointed out that a 30% excess mortality reduction in China required a 50% reduction in PM2.5 throughout the country, and the necessary reduction for the Beijing–Tianjin–Hebei, Jiangsu–Zhejiang–Shanghai, and Pearl River Delta regions were 62%, 50%, and 38%, respectively. Those previous studies paint general pictures of PM2.5-induced mortality over China and large variations in different regions due to different emission sources and climate changes. However, little attention has been paid to the health burdens and benefits at the city level, e.g., Nanjing.
Therefore, the objective of this study is to investigate the characteristics of PM2.5, the related health burden and its responses to different PM2.5 reduction targets at the city level in China. Nanjing has a typical subtropical monsoon climate and four distinct seasons. In this study, we investigated the temporal variation of PM2.5 in Nanjing, as well as the influences of meteorological parameters on PM2.5. Hourly and daily averaged PM2.5 concentrations were collected from nine national monitoring sites during the period March 2014 to February 2017. Then, we calculated the cause-specific and the age-specific premature mortality and YLL attributable to PM2.5 exposure based on the IER model. Finally, we estimated the potentially avoidable premature mortality in situations in which ambient PM2.5 concentrations in Nanjing are reduced to four different standard levels (AQG and three WHO ITs).

2. Materials and Methods

2.1. Data Collection: Meteorological Conditions, PM2.5 and Other Air Pollutants

Mass concentrations of PM2.5 and other air pollutants used in this study were downloaded from the website of the Chinese Environmental Protection Bureau (http://www.cnemc.cn/). There are nine national air quality monitoring sites located in Nanjing, including Maigao Bridge (MG), Caochangmen (CC), Shanxi Road (SX), Zhonghuamen (ZH), Ruijin Road (RJ), Xuanwu Lake (XW), Pukou (PK), Olympic Stadium (OS) and Xianlin University Town (XL). PM2.5 concentrations before publication have been gone through strict quality control by Ministry of Environmental Protection of the People’s Republic of China. Hourly concentrations of PM2.5, PM10, SO2, NO2, CO and O3 for these nine sites were collected from 1 March 2014 to 28 February 2017. The daily average concentrations of air pollutants were calculated only when there were more than 16 h of valid data. In this study, we defined spring as March to May, summer as June to August, fall as September to November, and winter as December to February. The quality assurance and control of state controlled monitoring data were reported in previous studies [34,35]. Meteorological data, including air temperature (T), relative humidity (RH), wind speed (WS) and atmospheric pressure (AP), were obtained from the China Meteorological Data Sharing Service System Administration (http://data.cma.cn/site/index.html).

2.2. Estimation of Premature Mortality Attributable to PM2.5

In this study, the causes of mortality were defined by the International Classification of Diseases 10 (ICD-10) code: IHD (I20-I25); stroke (I60-I67, I69.0, I69.1, I69.2, I69.3); lung cancer (C33, C34); COPD (J40-J44). The population data in Nanjing and the baseline mortality due to a specific disease of male and female population for each 5-year age group from 2014 to 2015 were obtained from the China Public Health and Family Planning Statistical Yearbook 2015 and 2016, respectively. Because the China Public Health and Family Planning Statistical Yearbook 2017 has not yet been published, the health burden estimation for 2016 was not conducted. Afterward, the relative risk (or risk ratio, RR) of several causes of premature mortality (COPD, LC, IHD and stroke) was estimated according to the IER functions [20]:
R R ( C ) = { 1 + α ( 1 e γ ( C C 0 ) δ ) , i f   C > C 0 1 , e l s e
where C is the ambient PM2.5 concentration, and C0 is the endpoint-specific theoretical minimum-risk concentration of PM2.5. 𝛼, 𝛾, and 𝛿 are parameters that determine the shape of C–R curves. A distribution of 1000 point estimates for C0, 𝛼, 𝛾, and 𝛿 parameters provided by the IER were utilized to calculate the mean RR and its 95% confidence intervals (CIs). The attributable fractions (AF) were than calculated as:
A F = ( R R 1 ) / R R
The premature (excess) mortality (ΔMort) attributable to PM2.5 was calculated based on epidemiological cohort studies, as suggested by Anenberg et al. [29,36]:
Δ M o r t = y 0 × A F × P o p
where y0 is the baseline mortality rate (BMR) for a given population, Pop is the population within the age range of interest. The total deaths can be calculated as the sum of deaths caused by COPD, LC, IHD and stroke.

2.3. Calculation of YLL

YLL, an important part of disability adjusted life years (DALY), is a measure of disease burden considering life expectancy. Compared with the traditional measure of mortality, YLL gives more weight to deaths among younger people. We should pay more attention to the effects of PM2.5 on young people, who have a longer life expectancy than the elderly. At present, YLL is regarded as a more precise indicator to evaluate the burden of disease.
In this case, cause-specific YLL can be calculated by the DALY calculation template provided by the WHO, which calculated YLL from numbers of deaths using discounted and age-weighted life expectancies interpolated for the appropriate exact ages at death from the right-hand columns given in the standard life tables (http://www.who.int/healthinfo/global_burden_disease/tools_national/en/). The YLL template mainly contains the age group column, population column (yellow), deaths column (green), deaths per 1000 column, average ages at death column (blue), standard life expectancy column, YLL column and YLL per 1000 column. As the formula has been edited, we only need to replace the corresponding data to calculate the YLL, following the steps below: (1) Enter the population data in yellow cells below; (2) enter numbers of deaths for 5-year age groups in green cells below (or death rates in the next column and calculate numbers of deaths); (3) if necessary, modify average ages at death (blue column). The standard life expectancy was filled with the China life expectancy data provided by WHO. The total YLL was also the sum of the cause-specific YLL (COPD, LC, IHD, stroke). The YLL per 1000 people can be calculated by dividing the total YLL by the total population, then multiplying by 1000.

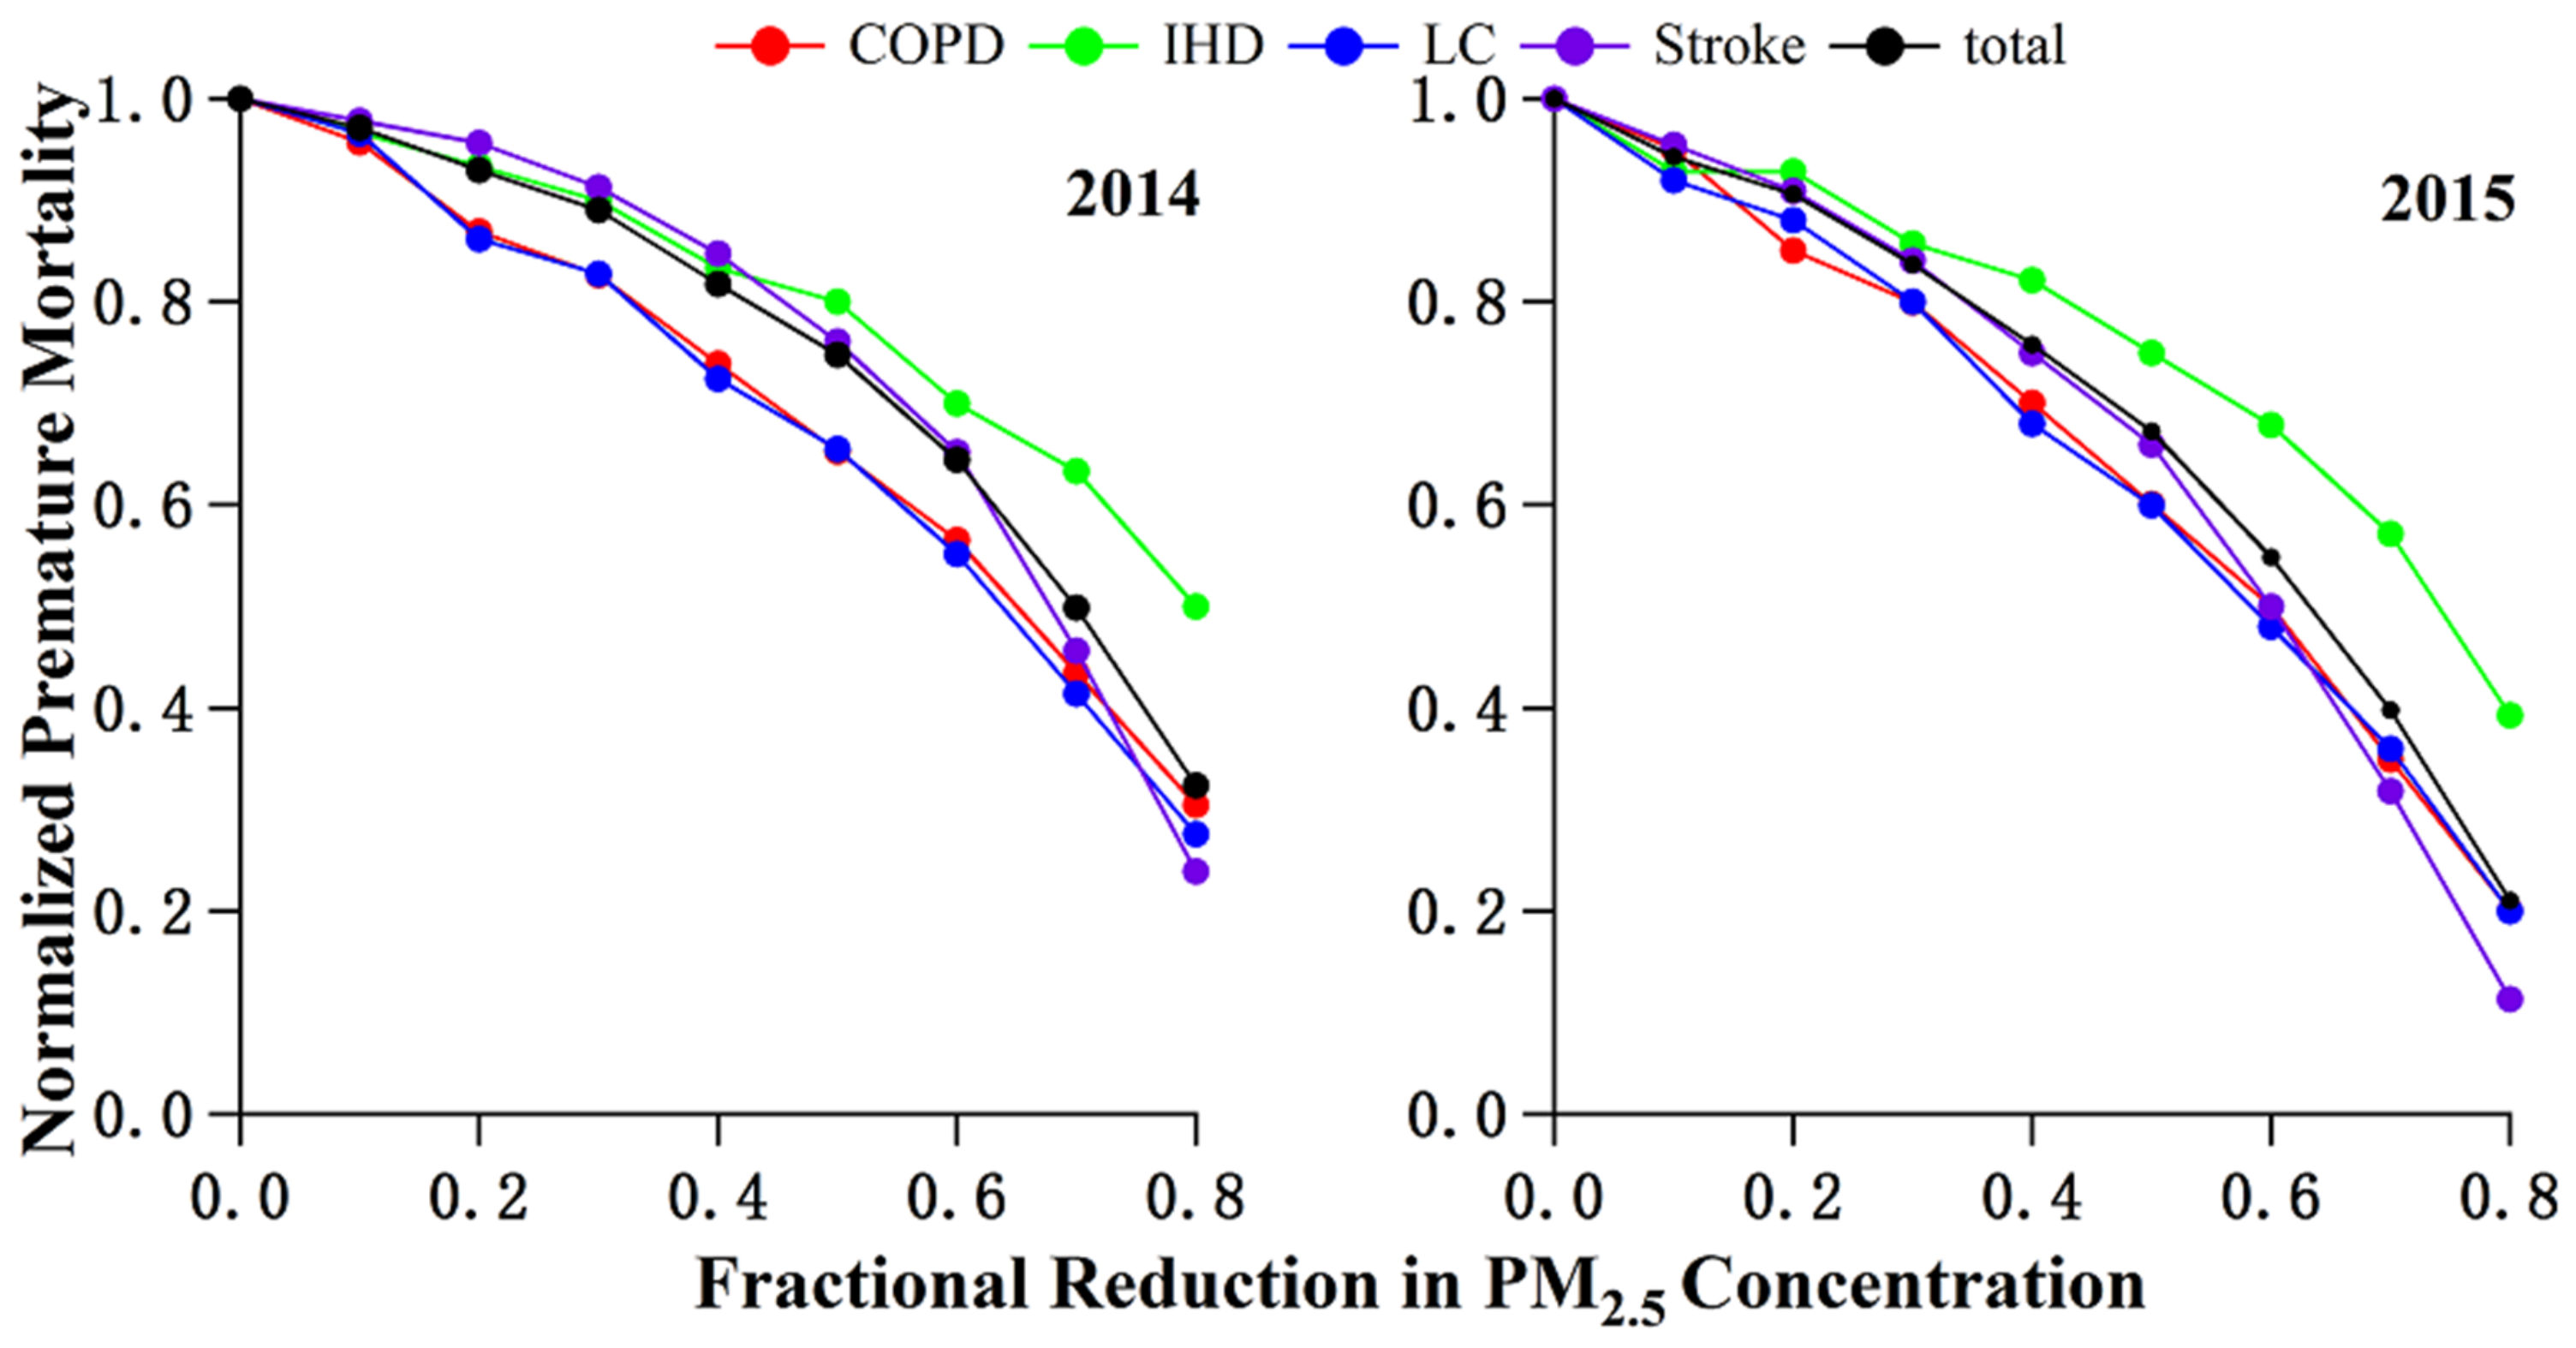
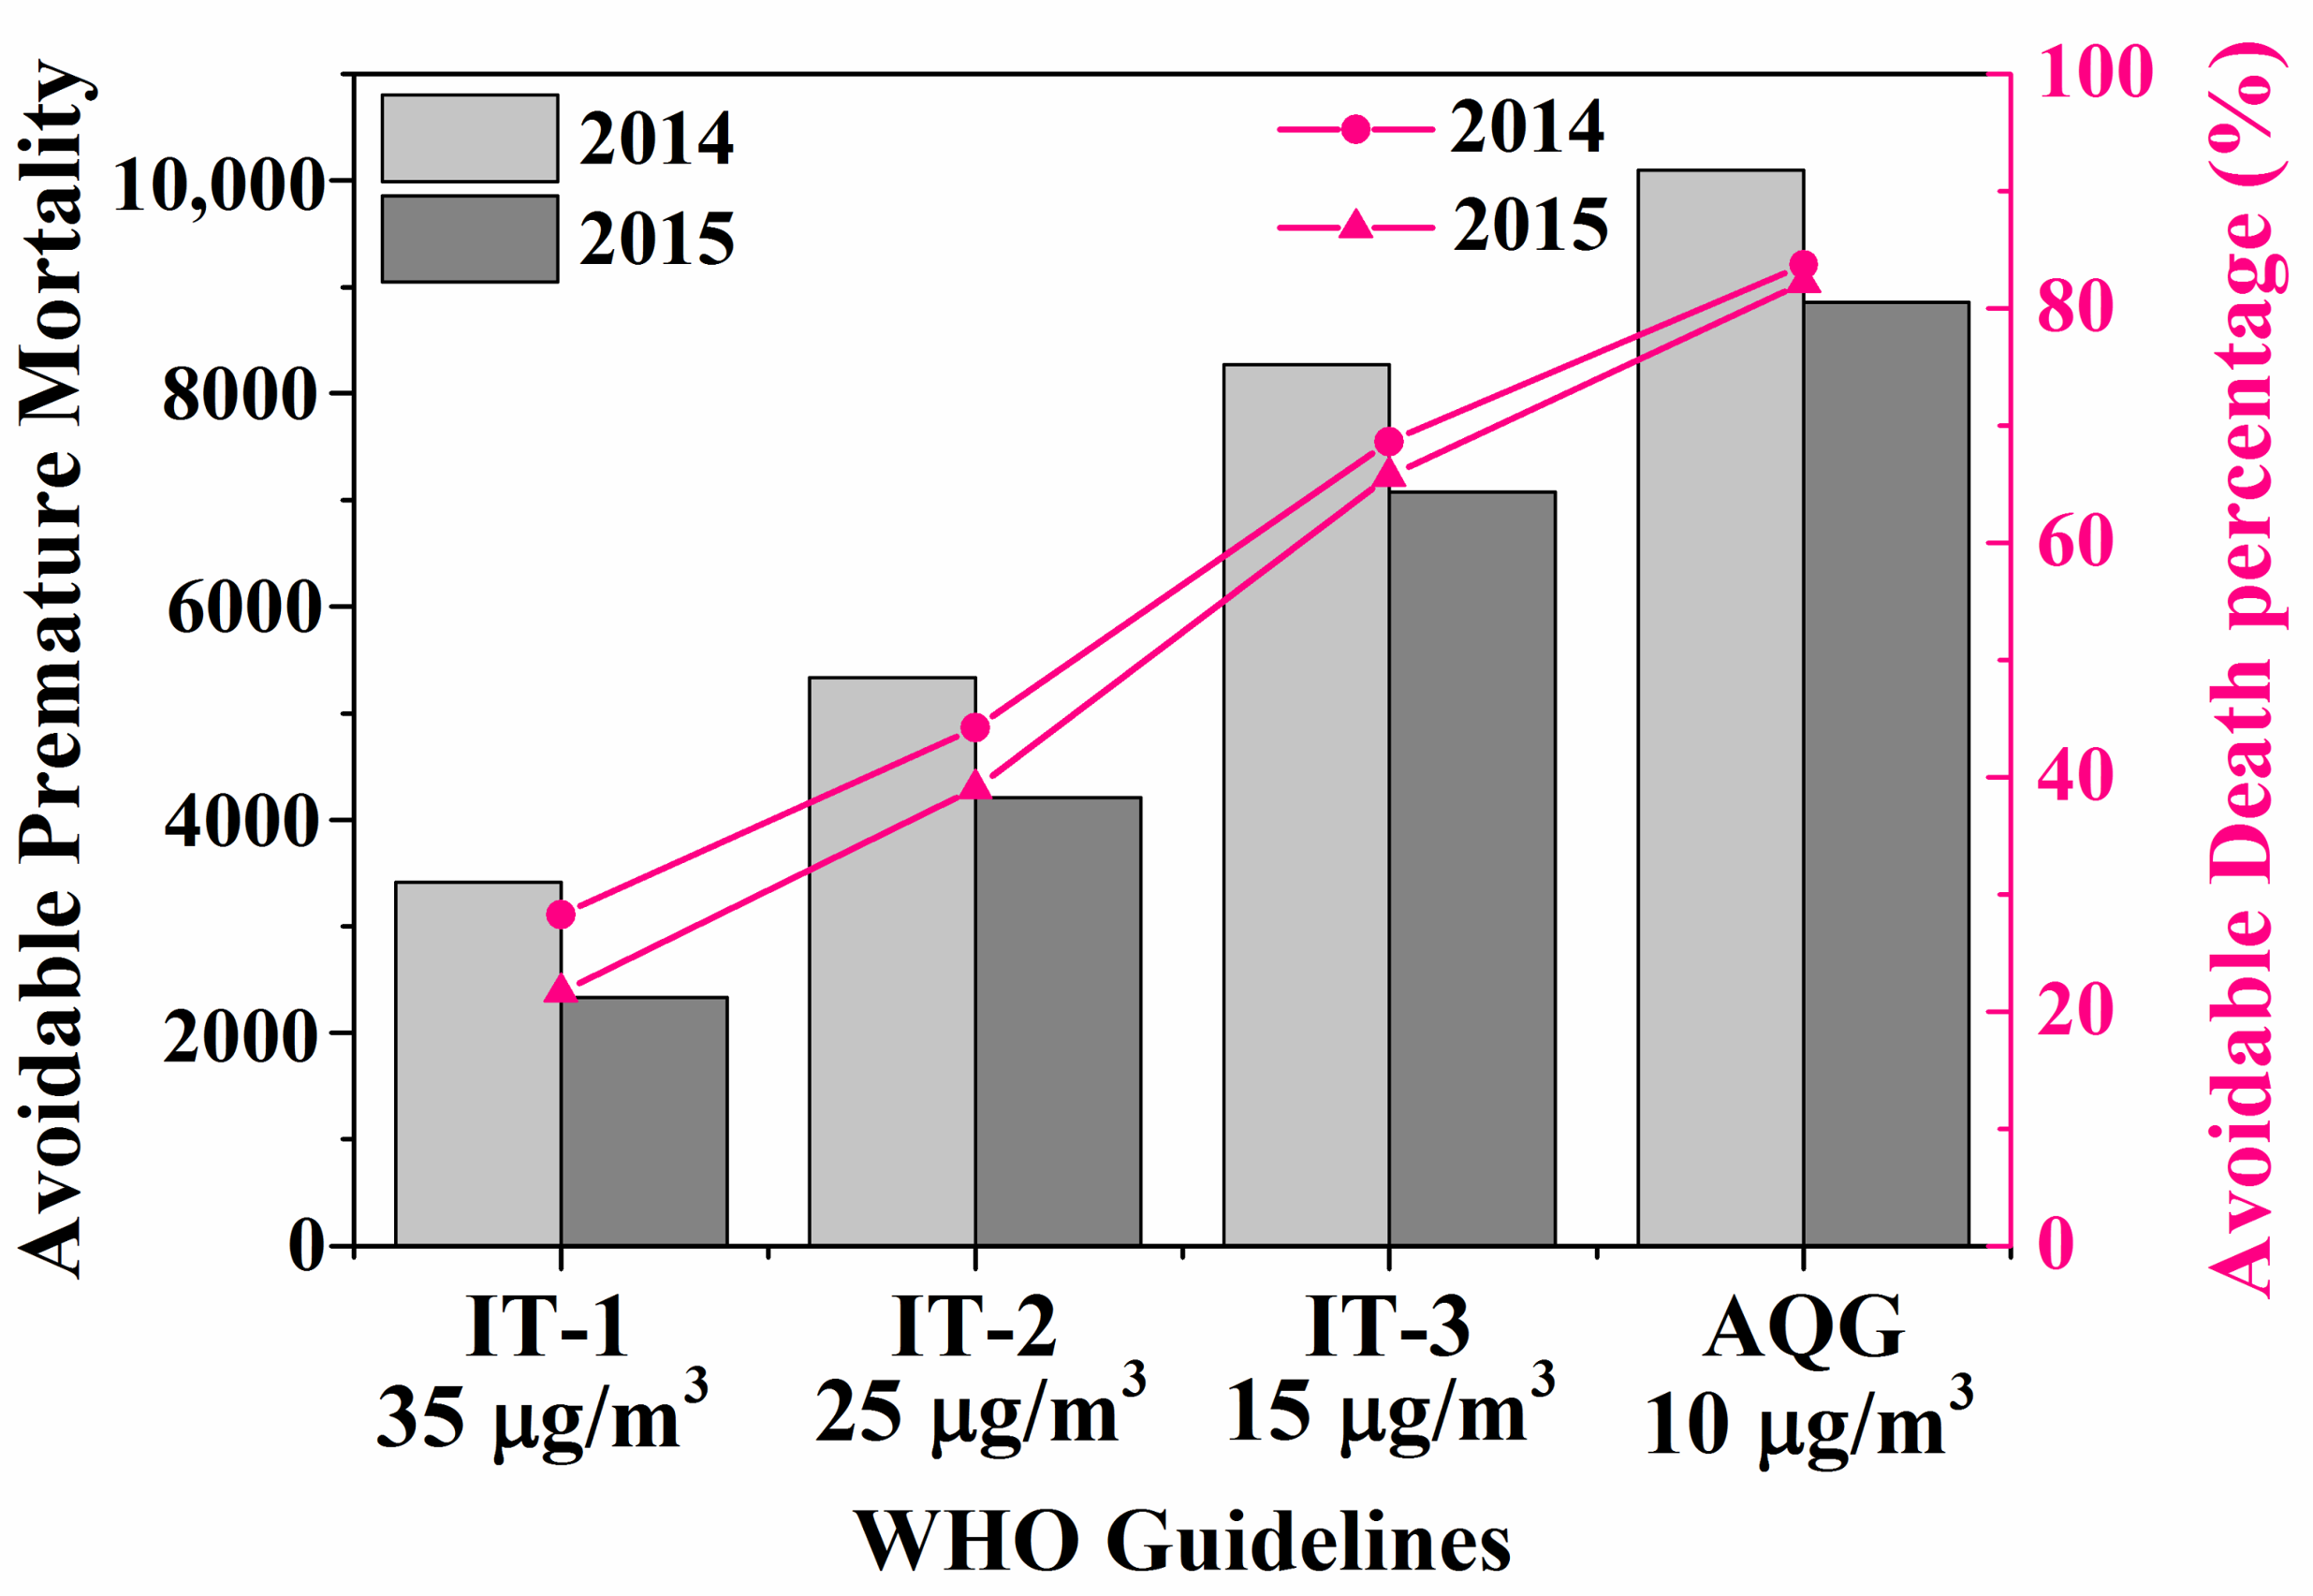
2.4. Evaluating the Effectiveness of PM2.5 Reduction

We also developed four reduction scenarios to calculate the potentially avoidable premature mortality by reducing ambient PM2.5 concentration in Nanjing to WHO IT1, IT2, IT3 and AQG standards. The annual PM2.5 concentrations of IT1, IT2, IT3 and AQG are 35, 25, 15 and 10 μg/m3, respectively. During this estimation, we assume that (1) the cause-specific mortality rates are independent of PM2.5 concentrations; (2) the population and age distribution also remain unchanged.

3. Results and Discussion

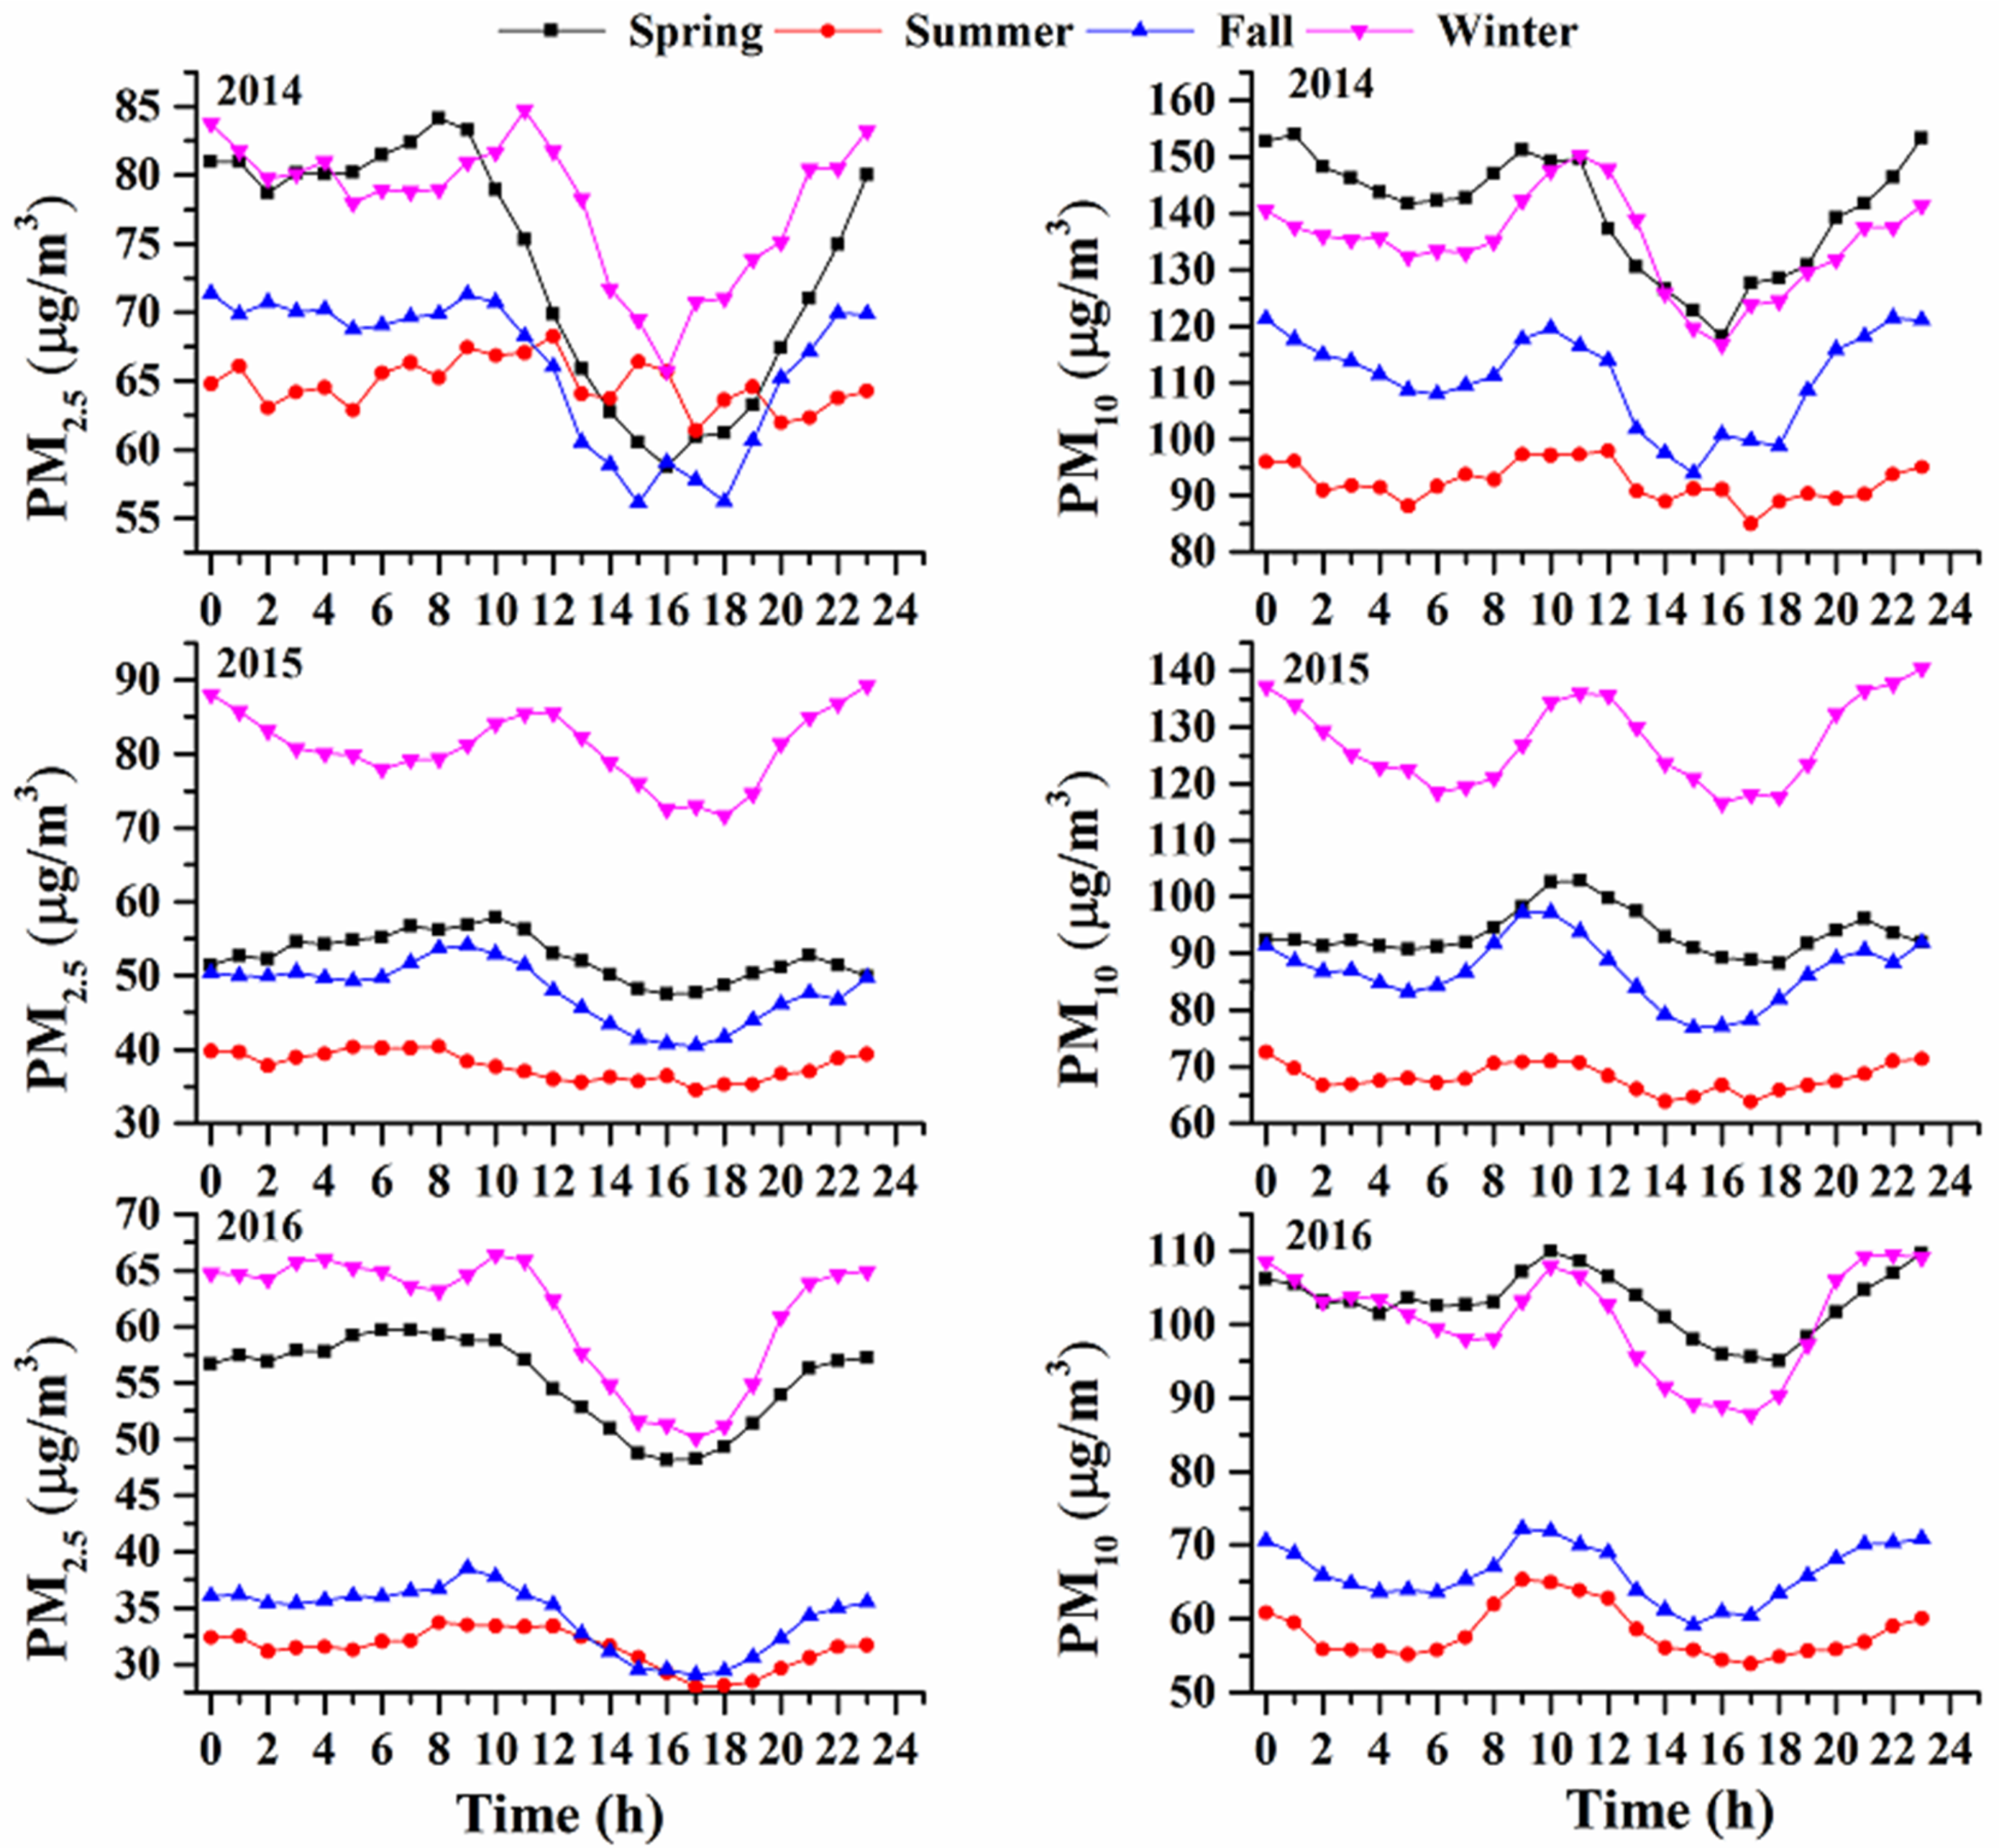
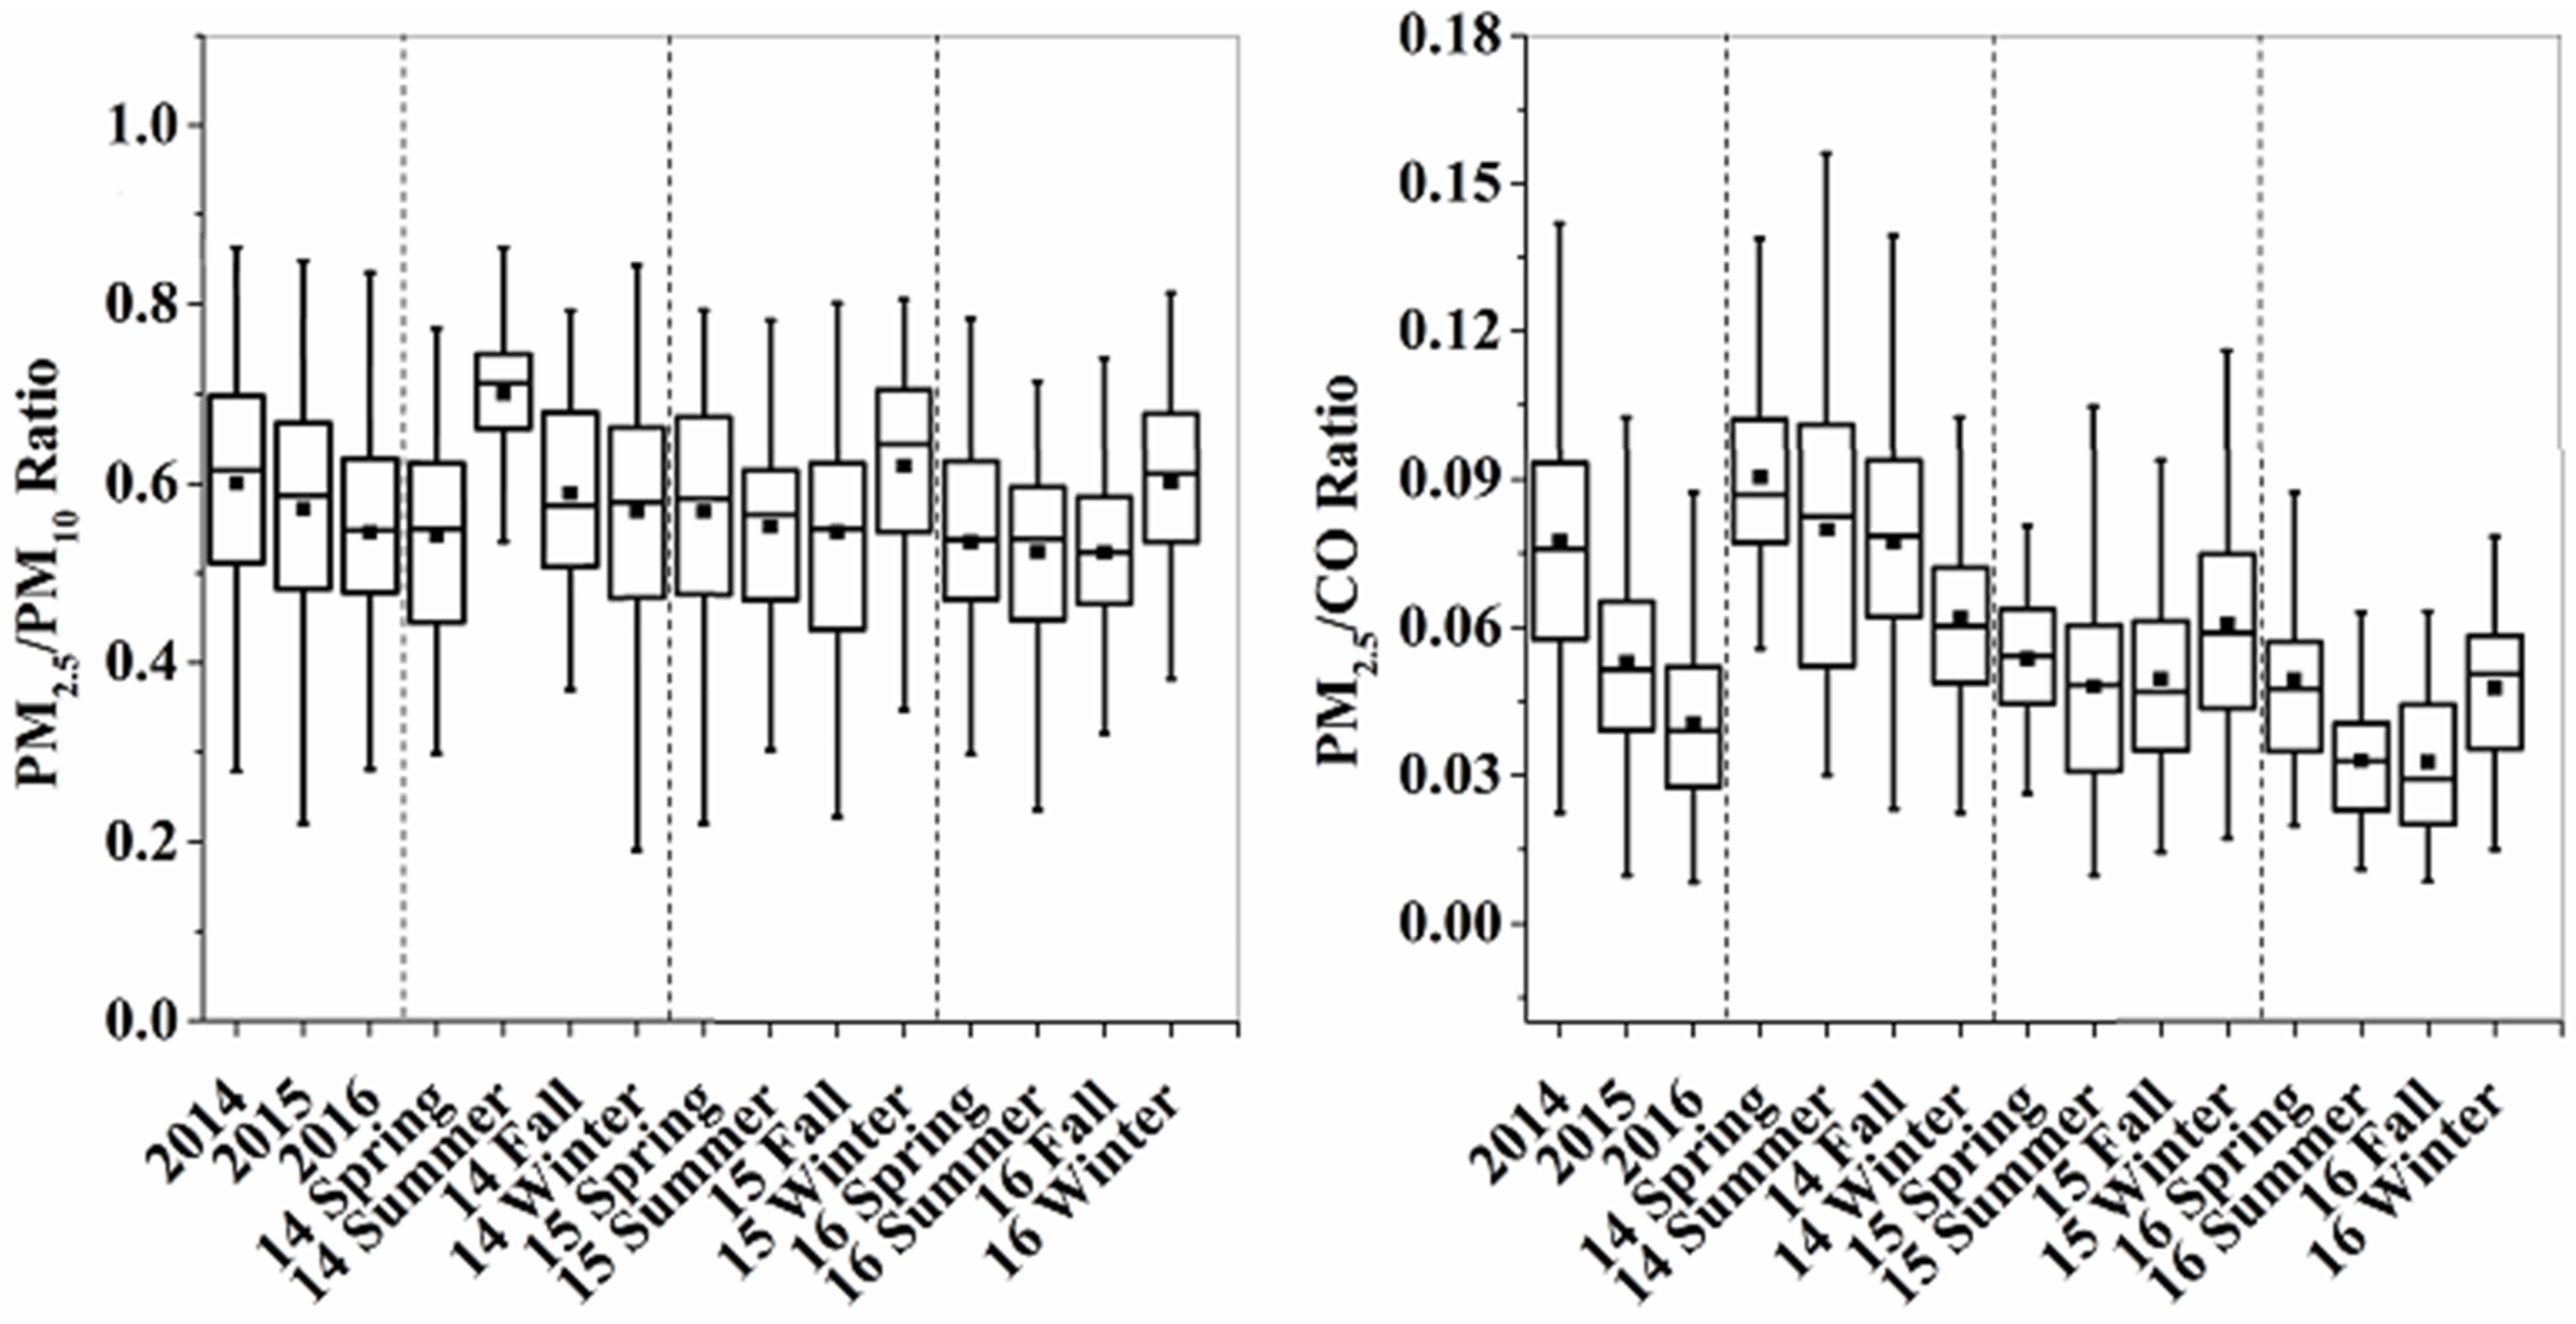
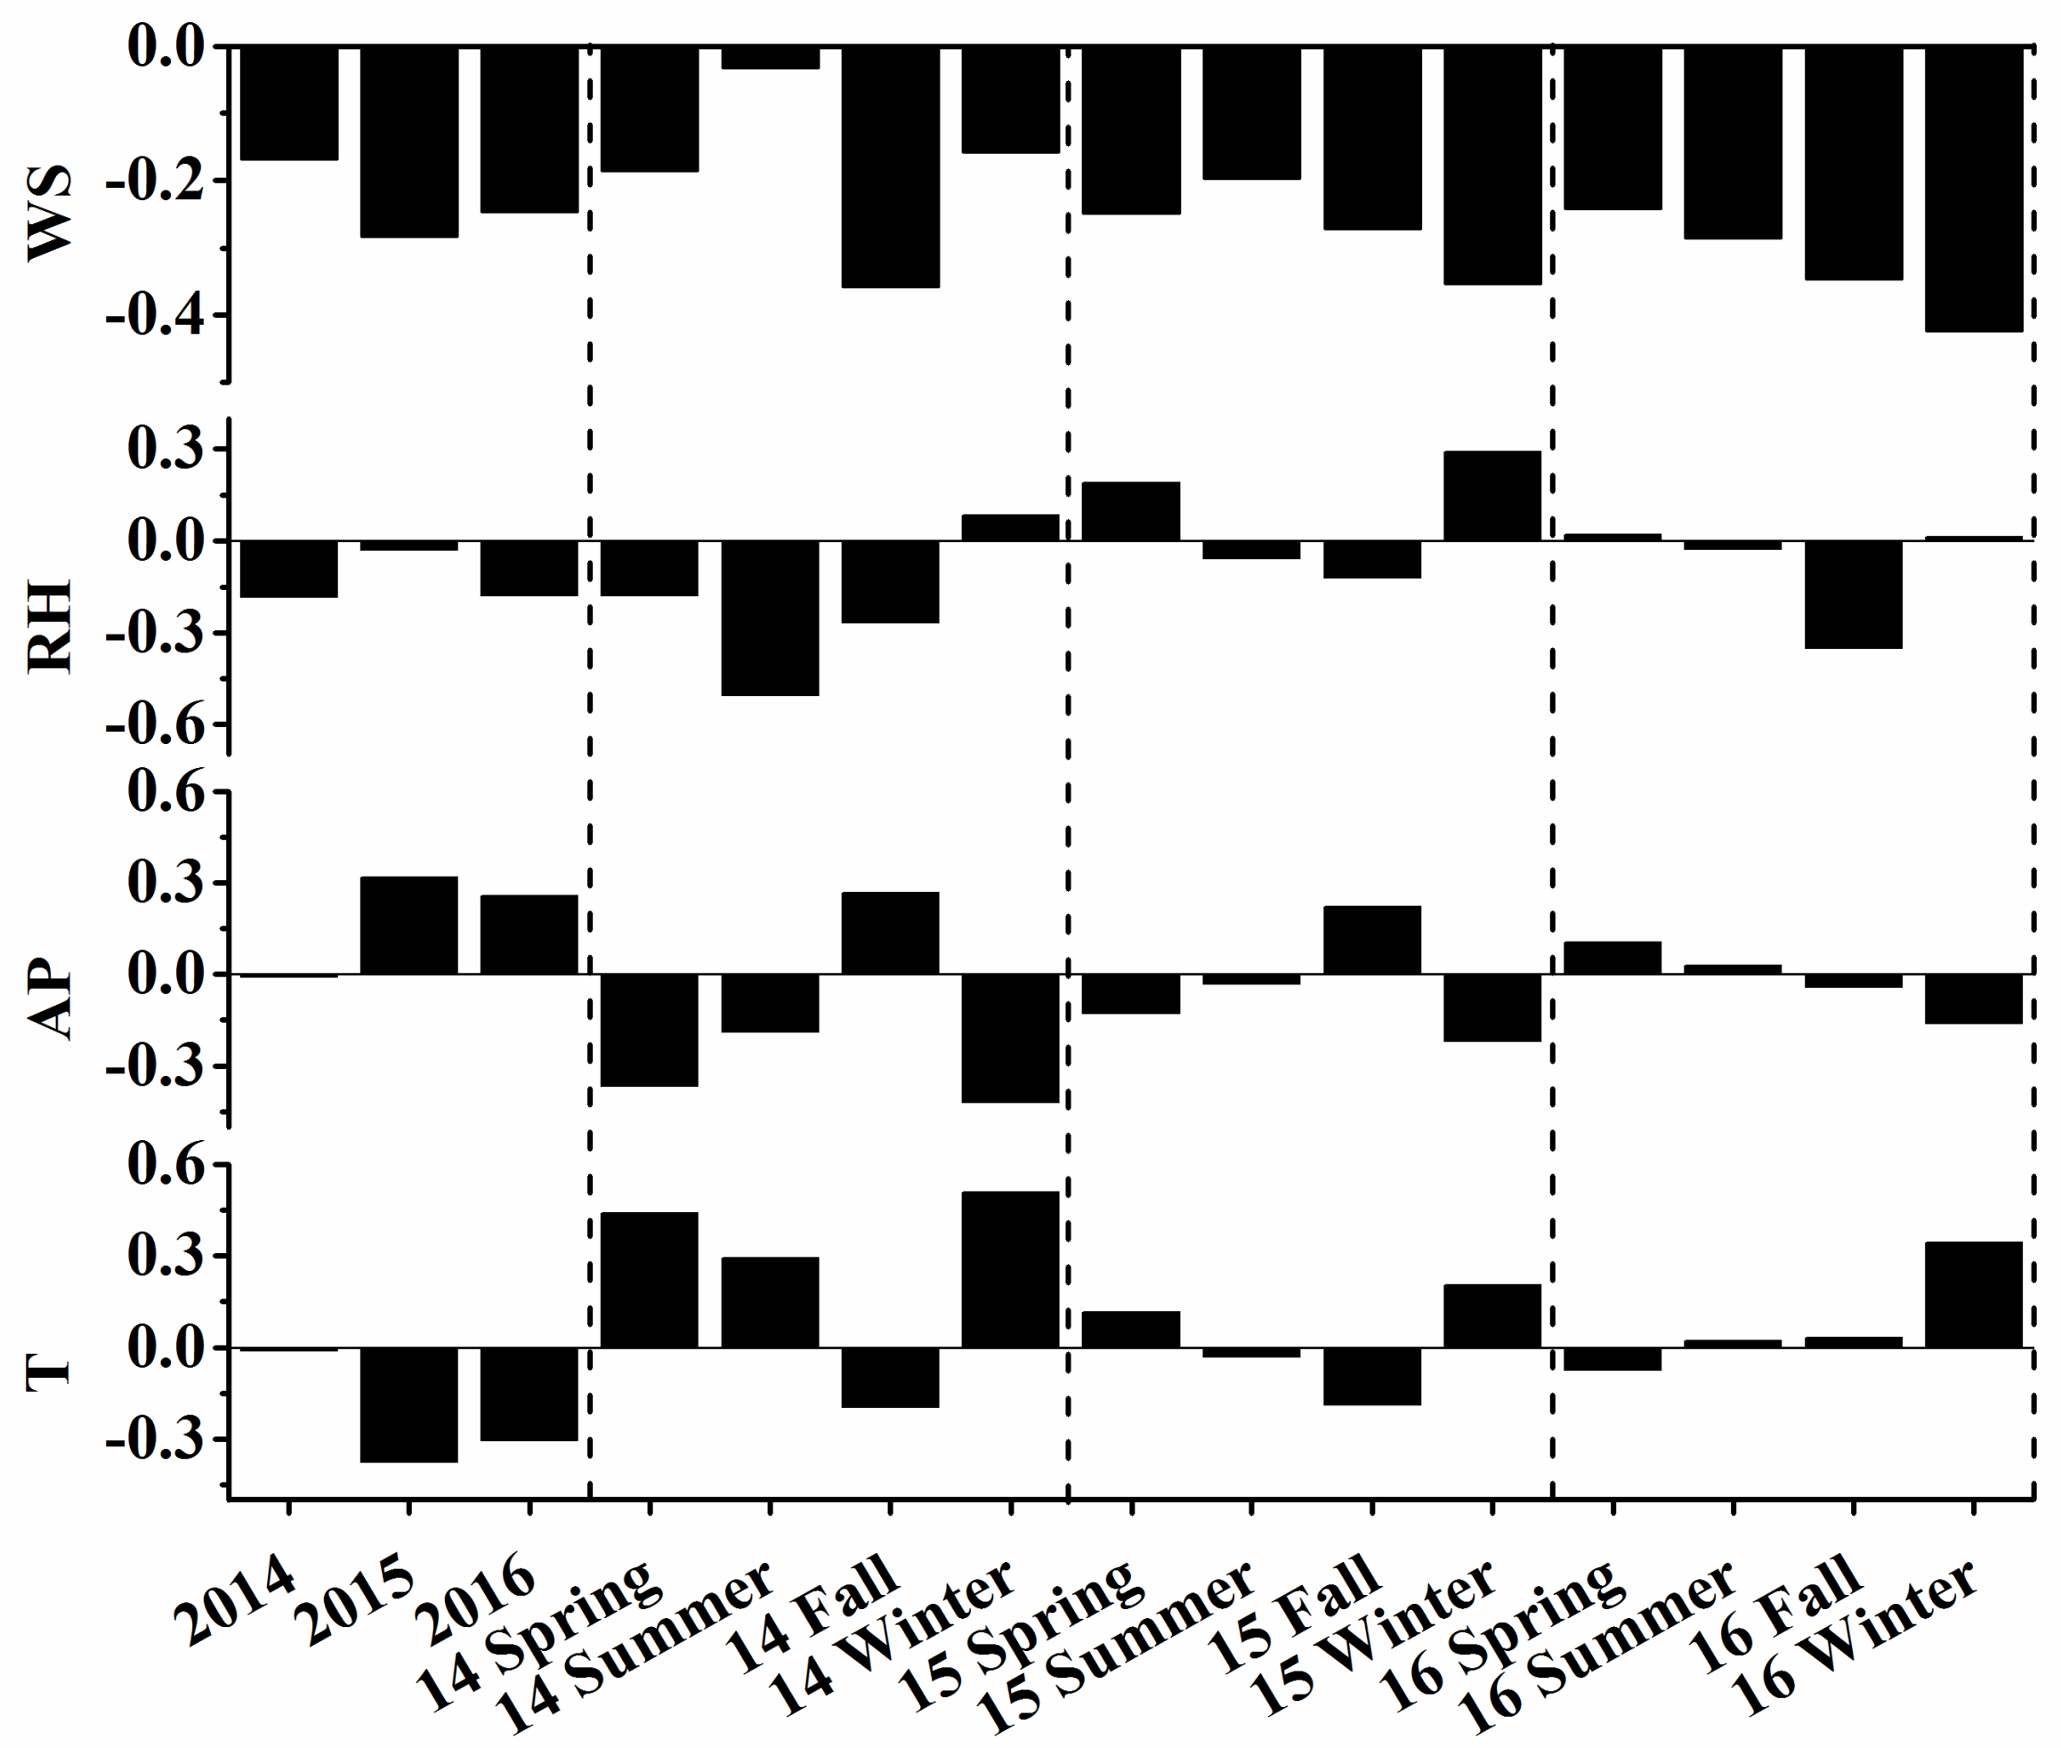
3.1. Characterization of PM2.5 Pollution in Nanjing

Annual average PM2.5 concentrations in 2014, 2015 and 2016 were 71 ± 35, 55 ± 33, 45 ± 29 μg/m3 (mean ± SD, calculated from daily values), respectively (Table 1). This downward trend on a yearly basis implied an improvement in the air quality of Nanjing after the implementation of China’s National Air Pollution Control Action Plan. However, the annual average concentration of PM2.5 in 2016 is still higher than the Chinese Ambient Air Quality Standards (CAAQS, GB3095-2012: 15 μg/m3 for Grade I and 35 μg/m3 for Grade II). The reduction and regulation of PM2.5 pollution is a long and arduous task. A remarkable seasonal variability was observed in Nanjing, where winter had the highest PM2.5 concentrations (74 ± 40 μg/m3) while summer had the lowest (45 ± 29 μg/m3). Such variations might be mainly caused by the enhanced anthropogenic emissions from fossil fuel combustion and biomass burning, the unfavorable meteorological conditions for pollution dispersion in winter (i.e., more frequent occurrences of stagnant weather and temperature inversion during the cold periods), as well as the pollutants transportation from Northern China under East Asian winter monsoon climate [7].
Hourly data were used to examine diurnal variability in PM2.5 (Figure 1). Similarly, the diurnal variation in PM2.5 concentrations was more obvious in winter and spring than in fall and summer. The moderate PM2.5 peak appeared in the morning (i.e., 8:00 am to 11:00 am), in accordance with the morning rush hours, indicating that vehicle emissions make the main contribution to this pollution. From 12:00 to 16:00, the concentrations of PM2.5 decreased, and the lowest concentrations can be observed in the afternoon hours, mainly caused by the increasing boundary layer depth and the reducing of anthropogenic emissions in the afternoon. Later, PM2.5 concentrations peaked again due to the decreasing boundary layer heights and the evening rush hours. The changes in PM10 concentration showed a similar trend to those of PM2.5, but the peak of PM10 during rush hours was higher than PM2.5 peak, suggesting that vehicle emission made greater contributions to PM10 concentrations.
The ratios of PM2.5/PM10 and PM2.5/CO have been used to analyze the sources of PM2.5 pollution semi-quantitatively. Figure 2 shows the statistical boxes for the ratio of PM2.5/PM10 and PM2.5/CO across different seasons in 3 years. In general, the ratio of PM2.5 to PM10 slightly decreased from 2014 to 2016; in other words, the proportion of coarse particles increased, suggesting that the current PM2.5 control strategies (i.e., reduce fossil/non-fossil combustion derived VOCs and PM emissions) had a greater impact on PM2.5 pollution in Nanjing [7]. Moreover, this ratio was higher during the winter months of 2015 and 2016 in comparison to other seasons, suggesting the importance of combustion sources and the formation of fine particles of secondary origin in winter. The PM2.5/CO value is often used to discuss the secondary contribution to PM2.5 which excludes the influence of primary combustion emissions and meteorological factors [7]. The decreased ratios of PM2.5/CO from 2014 to 2016 showed that secondary contributions were better restrained under the implementation of PM2.5 control strategies in recent years. Comparable with PM2.5/PM10, the PM2.5/CO ratios in winter were slightly higher than that in other seasons, also demonstrating the contribution of secondary formation to PM2.5 in winter. Besides this, CO concentration is considered as an indicator of vehicle exhaust [37]. An obvious increasing trend can be found in CO concentration from 2014 to 2016, and winter often had a comparatively higher level of CO. When we combined our ratio data with the results of CO concentrations, we proposed that the relative increase of primary contribution to PM2.5 was partially caused by the increasing vehicle exhaust.
Meteorological conditions have been demonstrated to play an important role in PM2.5 pollution [5,38,39,40]. Figure 3 shows the correlation coefficients between daily mass concentrations of PM2.5 and meteorological parameters across different seasons in three years. In general, the relationships between PM2.5 concentrations and meteorological parameters were complicated. PM2.5 concentrations were negatively correlated with wind speed in all cases, which indicates that strong horizontal dispersion played an important role in reducing PM2.5 pollution. Based on the annual statistics, PM2.5 concentrations exhibited negative correlations with relative humidity, and this was likely caused by the wet scavenging effects. However, in some seasons, positive correlations can be found, mainly because high relative humidity favors the formation of secondary aerosol from liquid phase reaction and moist condition usually accompanies with low boundary layer heights for particles accumulation [1,41,42]. PM2.5 concentrations were positively correlated with air pressure in the annual analysis, mainly because high air pressure restrained the upward movement of particles, leading to the accumulation of PM2.5 in the boundary layer. In general, temperature could affect the PM2.5 concentrations by affecting the dispersion or the formation of particles. The correlations between PM2.5 and temperature were different between annual analysis and seasonal analysis. In the annual analysis, there were negative correlations between PM2.5 and temperature due to the efficient vertical dispersion of pollutants under high temperatures. But in the seasonal analysis, positive correlations were found in some cases, likely caused by the formation of secondary particles via photochemical processes under higher air temperature conditions [1]. These variations indicated that the influence of temperature on PM2.5 is different.

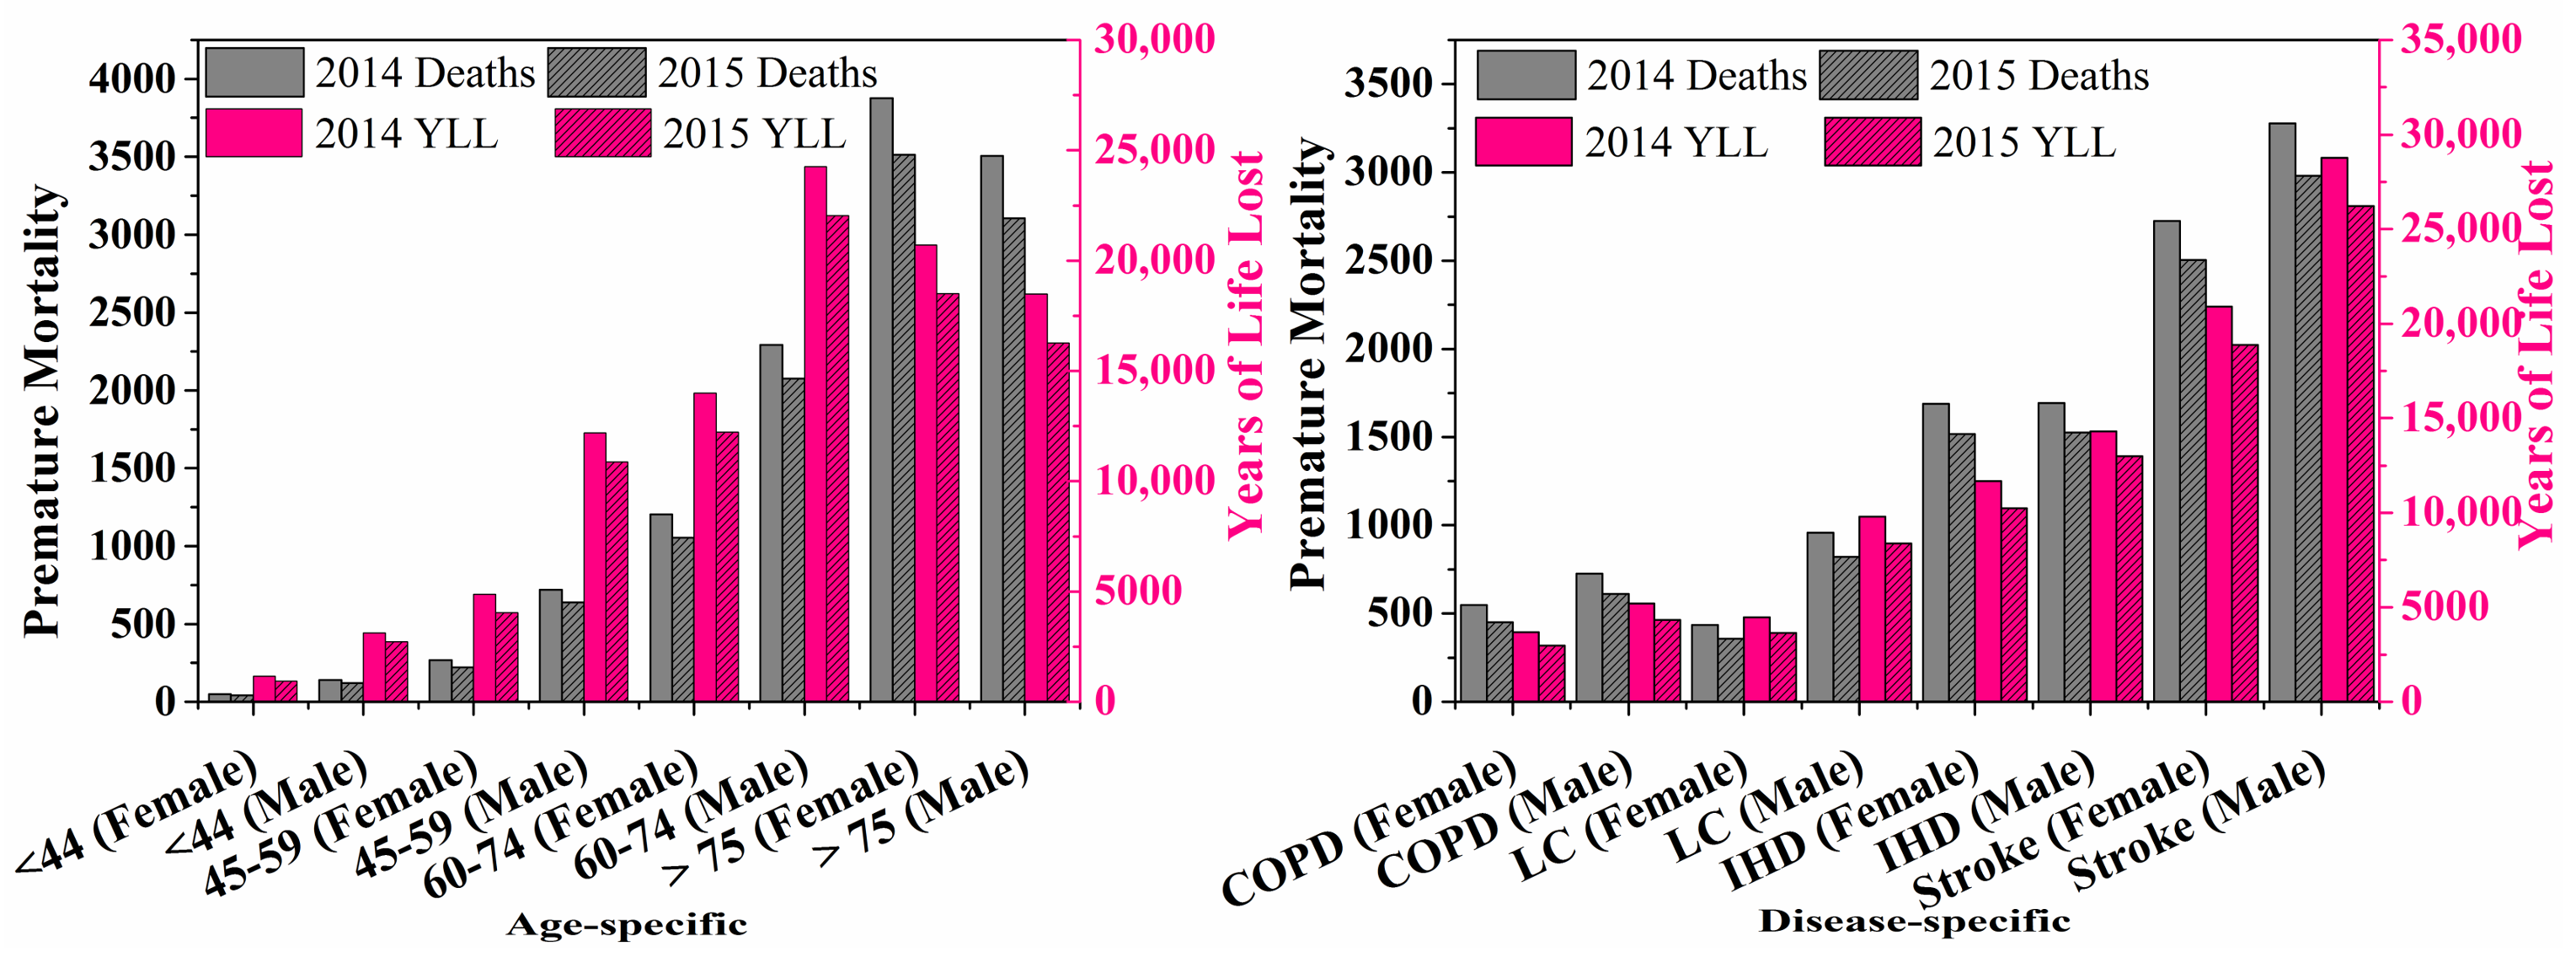
3.2. Health Burdens Attributable to PM2.5

The relative risk (RR) for disease-specific mortality was estimated based on the IER model. The attributable fractions (AFs) of the premature mortality due to PM2.5 for these four diseases were then calculated using Equation (2) (Table 2). In 2014, the AFs (%) for COPD, LC, IHD, and stroke were 23% (95% CI 12–32%), 29% (95% CI 11–40%), 30% (95% CI 21–48%), and 46% (95% CI 17–57%), respectively. In 2015, with the decrease of PM2.5, the AFs had fallen to 20% (95% CI 10–29%), 25% (95% CI 8–35%), 28% (95% CI 19–44%), and 44% (95% CI 15–55%). Consistent with previous studies, in the current environment, AF was the largest for stroke, followed by IHD, LC and COPD [23,24,27,28]. There is still significant scope for a decline of AFs if the government continues to improve ambient air quality to meet the WHO IT-1, IT2, IT3 and AQG standards. When PM2.5 was <15 μg/m3 (IT-3), IHD instead of stroke became the major cause of death.
Based on the disease-specific mortality and the population data in Nanjing, we estimated the mortality burden attributable to current ambient PM2.5 exposure in the year 2014 and 2015. Figure 4 shows the premature mortality caused by IHD, stroke, COPD and LC for males and females. The total deaths from IHD, stroke, COPD and LC in Nanjing attributable to PM2.5 were 12,055 and 10,771 in 2014 and 2015. The disease-specific deaths for IHD, stroke, COPD and LC in 2014 were 3382, 6002, 1276 and 1395, respectively. The deaths caused by PM2.5 decreased to 3043, 5485, 1064 and 1179, respectively, due to the reduction of AFs in 2015. Stroke was the major cause of death, followed by IHD, similar to the results from a national estimation [22]. The occurrence of these diseases suggested that PM2.5 not only injure the respiratory system but also significantly affect the cerebrovascular system. Moreover, there existed significant gender differences in the mortality burden: disease deaths in males were generally higher than that in females. It should be noted that LC has a long latent period [43], and that LC could be compounded by smoking; the health burden for LC in males deserves more attention. The differences mainly resulted from the gender-specific baseline mortality rate. Figure 4 shows the numbers of premature deaths in different age categories. The elderly (>60) accounted for a substantial proportion of total deaths, especially as people older than 75, while the youngers (<44) contributed little to the deaths. This is mainly caused by the differences in baseline mortality rate among the different age groups, as the older people are more sensitive to PM2.5 exposure.
Long-term exposure to PM2.5 contributed to 98,802 and 87,647 years of life lost in 2014 and 2015, respectively. Relative contributions of COPD, LC, IHD and stroke to YLL are shown in Figure 4. In general, additional YLL attributable to PM2.5 decreased from 2014 to 2015, and the lost years were also higher in males than in females, mainly because of a higher all-cause mortality rate in males. Similar to the premature death, the contribution of stroke to YLL was the highest, followed by IHD, suggesting that cardiovascular disease (stroke and IHD) instead of respiratory diseases (COPD and LC) accounted for the majority of deaths and YLL attributable to ambient PM2.5 air pollution. YLL per 1000 person for COPD, LC, IHD and stroke were 1.08, 1.73, 3.16 and 6.05 years in 2014, and 0.89, 1.46, 2.82 and 5.48 years in 2015, respectively. As expected, YLL per 1000 person was higher in males than in females, and the contributions of cardiovascular disease were higher than that of respiratory diseases. Figure 4 shows the contributions of deaths in different ages to YLL. Differently to the premature mortality, 60–74 gerontism contributed more to YLL than the gerontism (>75) did. YLL in Nanjing (estimated in this study) was about 1065 years per 100,000, higher than the numbers of developed countries, such as USA (337.1 years per 100,000), Brazil (573.7 years per 100,000), Japan (261.7 years per 100,000) in 2015 estimated by Cohen et al. [28]. These results implied that health burden associated with PM2.5 in Nanjing was serious, and more rigorous regulations should be taken in Nanjing.
Figure 5 estimates the avoidable premature mortality when PM2.5 concentrations are reduced to different levels. A 50% reduction in PM2.5 concentrations in 2014 would lead to 35%, 20%, 35% and 24% reductions in premature mortality for COPD, IHD, LC and stroke, respectively. The corresponding reductions in premature mortality were 40%, 25%, 40% and 34% from the 2015 level. To achieve a 50% reduction in COPD, IHD, LC and stroke-caused excess mortality, PM2.5 concentrations need to be reduced by 64%, 80%, 64% and 68% relative to the 2014 level, and 60%, 74%, 58% and 60% relative to the 2015 level, respectively. The benefits of reducing PM2.5 for COPD and LC were higher than those for stroke and IHD. Besides this, the excess mortality as a whole decreased slowly in the beginning, but the marginal benefit grew faster with a progressive reduction in PM2.5 concentrations. We can conclude that higher benefits could be obtained by a proportionate reduction in PM2.5 when initial PM2.5 concentration was lower, and these results were consistent with earlier research by Hu et al. and Joshua et al. [22,23].
Figure 6 describes the potential mortality benefits when PM2.5 concentrations in Nanjing were reduced to different levels. The PM2.5-related premature mortality in Nanjing would be reduced by 28% from 12,055 to 8646 when the concentrations of PM2.5 in 2014 meet the current CAAQS grade II standard (or WHO IT1, 35 μg/m3). Under stricter standards, the reductions in premature deaths were 44%, 69%, and 84% when meeting the standard of 25 μg/m3 (WHO IT2), 15 μg/m3 (WHO IT3), and 10 μg/m3 (AQG), respectively. The avoidable premature deaths in 2015 were slightly lower than that of 2014, and males were still at higher health risk than females. Even if the PM2.5 concentration meets the Chinese National Grade II standard (35 μg/m3) in the next few years, it could still contribute to more than eight thousand total deaths in Nanjing, with relative high premature mortality. Satisfactory decline could be found only when meeting stricter standards. Considering the huge health benefits, more rigorous control measures should be taken in Nanjing to improve the air quality.
Estimation of health burden in our study was based on the most reliable notification data, including PM2.5 concentrations and population data. There were still some limitations and uncertainties, however, like all model studies. First, a comparison has been made between the RRs observed in China and those calculated by the IER model. Although the IER model yielded reasonable results in China [21,22,26,27], the concentration–response function obtained by epidemiology studies conducted at a city level should be developed in the future. Second, the toxicity of PM2.5 varied according to its chemical composition. Risk assessment would be better to use the chemical composition data, but these data were not available. More studies are needed to investigate the long-term health effects related to PM2.5 chemical component. Third, changes in the model parameters (e.g., baseline mortality rate, population and age distribution) were neglected in benefits analyses of PM2.5 reduction. Despite these limitations, our study highlights the necessity to improve air quality to effectively reduce mortality.

4. Conclusions

This paper analyzed the temporal characteristics of PM2.5 in Nanjing from March 2014 to February 2017, as well as their relationships with meteorological parameters. Then, the IER model was applied to assess the premature mortality and YLL due to PM2.5. Furthermore, the mortality benefits were estimated under different scenarios of meeting the standards of WHO IT1, IT2, IT3 and AQG.
Annual average PM2.5 concentrations in 2014, 2015 and 2016 were 71 ± 35, 55 ± 33 and 45 ± 29 μg/m3 (mean ± SD, calculated from daily values), respectively, which showed a continuous decrease on a year to year basis. A remarkable seasonal variation (maximum in winter and minimum in summer) in PM2.5 concentrations can be found during our study periods. Diurnal variations showed that the concentrations of PM2.5 were mainly influenced by anthropogenic emissions, diffusion conditions, and secondary formations. The ratios of particles to gaseous pollutants suggested that secondary contributions had been effectively regulated, while the relative contributions of vehicle exhaust increased in recent years. There were negative relationships between PM2.5 concentrations and wind speed, but the correlations between PM2.5 and other meteorological factors varied as per annual analysis and seasonal analysis, and their combined effects need to be further considered.
The total premature mortality in Nanjing caused by PM2.5 were 12,055 and 10,771 in 2014 and 2015, respectively. Stroke was the leading cause of death, followed by IHD, LC and COPD. Generally, disease deaths in males and the elderly were higher than that in females and youngsters, indicating that the former two are more sensitive to PM2.5 pollution. Long-term exposure to PM2.5 resulted in 98,802 and 87,647 years of life lost in 2014 and 2015, respectively. To achieve a 50% reduction in COPD, IHD, LC and stroke-caused excess mortality, corresponding reductions of PM2.5 concentrations by 64%, 80%, 64% and 68% relative to the 2014 level, and 60%, 74%, 58% and 60% relative to the 2015 level, respectively, are necessary. When the concentrations of PM2.5 in 2014 meet the current CAAQS grade II standard of 35 μg/m3, the related premature mortality in Nanjing would be reduced by 28%, and higher health benefits could be achieved if Nanjing adopted more stringent guidelines. According to our results, the health burdens associated with PM2.5 in Nanjing were higher than that in developed countries, and more rigorous regulations should be taken in Nanjing to ameliorate existing pollution.

Acknowledgments

The authors sincerely acknowledge financial support from the National Natural Science Foundation of China (Grant No. 91543115, 21577065), International ST Cooperation Program of China (2014DFA90780), National Development and Reform Commission (2014078), Environmental Protection Department of Jiangsu Province, China (2017022) and the Priority Academic Program Development of Jiangsu Higher Education Institutions.

Author Contributions

Dongyang Nie conceived the study and wrote the manuscript; Kai Zhang and Pengxiang Ge collected the study data; Jianlin Hu and Xinlei Ge analyzed and interpreted the data; Mindong Chen and Yun Wu supervised and contributed to the revision.

Conflicts of Interest

The authors declare no conflict of interest.

References

  1. Li, X.; Ma, Y.; Wang, Y.; Liu, N.; Hong, Y. Temporal and spatial analyses of particulate matter (PM10 and PM2.5) and its relationship with meteorological parameters over an urban city in northeast China. Atmos. Res. 2017, 198, 185–193. [Google Scholar] [CrossRef]
  2. Xie, Y.; Zhao, B.; Zhang, L.; Luo, R. Spatiotemporal variations of PM2.5 and PM10 concentrations between 31 chinese cities and their relationships with SO2, NO2, CO and O3. Particuology 2015, 20, 141–149. [Google Scholar] [CrossRef]
  3. Chen, T.; He, J.; Lu, X.; She, J.; Guan, Z. Spatial and temporal variations of PM2.5 and its relation to meteorological factors in the urban area of Nanjing, China. Int. J. Environ. Res. Public Health 2016, 13, 921. [Google Scholar] [CrossRef] [PubMed]
  4. Zhan, D.; Kwan, M.-P.; Zhang, W.; Wang, S.; Yu, J. Spatiotemporal variations and driving factors of air pollution in China. Int. J. Environ. Public Health 2017, 14, 1538. [Google Scholar] [CrossRef] [PubMed]
  5. Zhang, H.; Wang, Y.; Hu, J.; Ying, Q.; Hu, X.M. Relationships between meteorological parameters and criteria air pollutants in three megacities in China. Environ. Res. 2015, 140, 242–254. [Google Scholar] [CrossRef] [PubMed]
  6. Lai, Y.; Brimblecombe, P. Regulatory effects on particulate pollution in the early hours of Chinese new year, 2015. Environ. Monit. Assess. 2017, 189, 467. [Google Scholar] [CrossRef] [PubMed]
  7. Zhang, Y.L.; Cao, F. Fine particulate matter (PM2.5) in China at a city level. Sci. Rep. 2015, 5, 14884. [Google Scholar] [CrossRef] [PubMed]
  8. Huang, L.; Zhang, C.; Bi, J. Development of land use regression models for PM2.5, SO2, NO2 and O3 in Nanjing, China. Environ. Res. 2017, 158, 542–552. [Google Scholar] [CrossRef] [PubMed]
  9. Li, L.; Chen, C.H.; Fu, J.S.; Huang, C.; Streets, D.G.; Huang, H.Y.; Zhang, G.F.; Wang, Y.J.; Jang, C.J.; Wang, H.L.; et al. Air quality and emissions in the Yangtze river delta, China. Atmos. Chem. Phys. 2011, 11, 1621–1639. [Google Scholar] [CrossRef] [Green Version]
  10. Luo, K.; Li, R.; Wang, Z.; Zhang, R.; Xu, Q. Effect modification of the association between temperature variability and daily cardiovascular mortality by air pollutants in three Chinese cities. Environ. Pollut. 2017, 230, 989–999. [Google Scholar] [CrossRef] [PubMed]
  11. Chen, F.; Lin, Z.; Chen, R.; Norback, D.; Liu, C.; Kan, H.; Deng, Q.; Huang, C.; Hu, Y.; Zou, Z.; et al. The effects of PM2.5 on asthmatic and allergic diseases or symptoms in preschool children of six Chinese cities, based on China, children, homes and health (CCHH) project. Environ. Pollut. 2018, 232, 329–337. [Google Scholar] [CrossRef] [PubMed]
  12. Mazidi, M.; Speakman, J.R. Ambient particulate air pollution (PM2.5) is associated with the ratio of type 2 diabetes to obesity. Sci. Rep. 2017, 7, 9144. [Google Scholar] [CrossRef] [PubMed]
  13. Guo, P.; Wang, Y.; Feng, W.; Wu, J.; Fu, C.; Deng, H.; Huang, J.; Wang, L.; Zheng, M.; Liu, H. Ambient air pollution and risk for ischemic stroke: A short-term exposure assessment in south China. Int. J. Environ. Public Health 2017, 14, 1091. [Google Scholar] [CrossRef] [PubMed]
  14. Liu, S.; Zhou, Y.; Liu, S.; Chen, X.; Zou, W.; Zhao, D.; Li, X.; Pu, J.; Huang, L.; Chen, J.; et al. Association between exposure to ambient particulate matter and chronic obstructive pulmonary disease: Results from a cross-sectional study in China. Thorax 2017, 72, 788–795. [Google Scholar] [CrossRef] [PubMed]
  15. Shao, D.; Du, Y.; Liu, S.; Brunekreef, B.; Meliefste, K.; Zhao, Q.; Chen, J.; Song, X.; Wang, M.; Wang, J.; et al. Cardiorespiratory responses of air filtration: A randomized crossover intervention trial in seniors living in Beijing: Beijing indoor air purifier study, biapsy. Sci. Total. Environ. 2017, 603, 541–549. [Google Scholar] [CrossRef] [PubMed]
  16. Girguis, M.S.; Strickland, M.J.; Hu, X.; Liu, Y.; Chang, H.H.; Belanoff, C.; Bartell, S.M.; Vieira, V.M. Chronic PM2.5 exposure and risk of infant bronchiolitis and otitis media clinical encounters. Int. J. Hyg. Environ. Health 2017, 220, 1055–1063. [Google Scholar] [CrossRef] [PubMed]
  17. Stockfelt, L.; Andersson, E.M.; Molnar, P.; Gidhagen, L.; Segersson, D.; Rosengren, A.; Barregard, L.; Sallsten, G. Long-term effects of total and source-specific particulate air pollution on incident cardiovascular disease in Gothenburg, Sweden. Environ. Res. 2017, 158, 61–71. [Google Scholar] [CrossRef] [PubMed]
  18. Mbelambela, E.P.; Hirota, R.; Eitoku, M.; Muchanga, S.M.J.; Kiyosawa, H.; Yasumitsu-Lovell, K.; Lawanga, O.L.; Suganuma, N. Occupation exposed to road-traffic emissions and respiratory health among Congolese transit workers, particularly bus conductors, in Kinshasa: A cross-sectional study. Environ. Health. Prev. Med. 2017, 22, 11. [Google Scholar] [CrossRef] [PubMed]
  19. Nenna, R.; Evangelisti, M.; Frassanito, A.; Scagnolari, C.; Pierangeli, A.; Antonelli, G.; Nicolai, A.; Arima, S.; Moretti, C.; Papoff, P.; et al. Respiratory syncytial virus bronchiolitis, weather conditions and air pollution in an Italian urban area: An observational study. Environ. Res. 2017, 158, 188–193. [Google Scholar] [CrossRef] [PubMed]
  20. Burnett, R.T.; Iii, C.A.P.; Ezzati, M.; Olives, C.; Lim, S.S.; Mehta, S.; Shin, H.H.; Singh, G.; Hubbell, B.; Brauer, M. An integrated risk function for estimating the global burden of disease attributable to ambient fine particulate matter exposure. Environ. Health. Perspect. 2014, 122, 397. [Google Scholar] [CrossRef] [PubMed]
  21. Song, C.; He, J.; Wu, L.; Jin, T.; Chen, X.; Li, R.; Ren, P.; Zhang, L.; Mao, H. Health burden attributable to ambient PM2.5 in China. Environ. Pollut. 2017, 223, 575–586. [Google Scholar] [CrossRef] [PubMed]
  22. Hu, J.; Huang, L.; Chen, M.; Liao, H.; Zhang, H.; Wang, S.; Zhang, Q.; Ying, Q. Premature mortality attributable to particulate matter in China: Source contributions and responses to reductions. Environ. Sci. Technol. 2017, 51, 9950–9959. [Google Scholar] [CrossRef] [PubMed]
  23. Apte, J.S.; Marshall, J.D.; Cohen, A.J.; Brauer, M. Addressing global mortality from ambient PM2.5. Environ. Sci. Technol. 2015, 49, 8057–8066. [Google Scholar] [CrossRef] [PubMed]
  24. Evans, J.; van Donkelaar, A.; Martin, R.V.; Burnett, R.; Rainham, D.G.; Birkett, N.J.; Krewski, D. Estimates of global mortality attributable to particulate air pollution using satellite imagery. Environ. Res. 2013, 120, 33–42. [Google Scholar] [CrossRef] [PubMed]
  25. Shen, F.; Ge, X.; Hu, J.; Nie, D.; Tian, L.; Chen, M. Air pollution characteristics and health risks in Henan province, China. Environ. Res. 2017, 156, 625–634. [Google Scholar] [CrossRef] [PubMed]
  26. Lin, H.; Liu, T.; Xiao, J.; Zeng, W.; Li, X.; Guo, L.; Zhang, Y.; Xu, Y.; Tao, J.; Xian, H.; et al. Mortality burden of ambient fine particulate air pollution in six Chinese cities: Results from the pearl river delta study. Environ. Int. 2016, 96, 91–97. [Google Scholar] [CrossRef] [PubMed]
  27. Liu, J.; Han, Y.; Tang, X.; Zhu, J.; Zhu, T. Estimating adult mortality attributable to PM2.5 exposure in China with assimilated PM2.5 concentrations based on a ground monitoring network. Sci. Total. Environ. 2016, 568, 1253–1262. [Google Scholar] [CrossRef] [PubMed]
  28. Cohen, A.J.; Brauer, M.; Burnett, R.; Anderson, H.R.; Frostad, J.; Estep, K.; Balakrishnan, K.; Brunekreef, B.; Dandona, L.; Dandona, R.; et al. Estimates and 25-year trends of the global burden of disease attributable to ambient air pollution: An analysis of data from the global burden of diseases study 2015. Lancet 2017, 389, 1907–1918. [Google Scholar] [CrossRef]
  29. Anenberg, S.C.; Horowitz, L.W.; Tong, D.Q.; West, J.J. An estimate of the global burden of anthropogenic ozone and fine particulate matter on premature human mortality using atmospheric modeling. Environ. Health. Perspect. 2010, 118, 1189–1195. [Google Scholar] [CrossRef] [PubMed]
  30. Xie, Y.; Dai, H.; Dong, H.; Hanaoka, T.; Masui, T. Economic impacts from PM2.5 pollution-related health effects in China: A provincial-level analysis. Environ. Sci. Technol. 2016, 50, 4836–4843. [Google Scholar] [CrossRef] [PubMed]
  31. Shiraiwa, M.; Ueda, K.; Pozzer, A.; Lammel, G.; Kampf, C.J.; Fushimi, A.; Enami, S.; Arangio, A.M.; Frohlich-Nowoisky, J.; Fujitani, Y.; et al. Aerosol health effects from molecular to global scales. Environ. Sci. Technol. 2017, 51, 13545–13567. [Google Scholar] [CrossRef] [PubMed]
  32. Lelieveld, J.; Barlas, C.; Giannadaki, D.; Pozzer, A. Model calculated global, regional and megacity premature mortality due to air pollution. Atmos. Chem. Phys. 2013, 13, 7023–7037. [Google Scholar] [CrossRef]
  33. Zheng, Y.; Xue, T.; Zhang, Q.; Geng, G.; Tong, D.; Li, X.; He, K. Air quality improvements and health benefits from china’s clean air action since 2013. Environ. Res. Lett. 2017, 12, 114020. [Google Scholar] [CrossRef]
  34. Wang, Y.; Ying, Q.; Hu, J.; Zhang, H. Spatial and temporal variations of six criteria air pollutants in 31 provincial capital cities in china during 2013–2014. Environ. Int. 2014, 73, 413–422. [Google Scholar] [CrossRef] [PubMed]
  35. Zhao, S.; Yu, Y.; Yin, D.; He, J.; Liu, N.; Qu, J.; Xiao, J. Annual and diurnal variations of gaseous and particulate pollutants in 31 provincial capital cities based on in situ air quality monitoring data from china national environmental monitoring center. Environ. Int. 2016, 86, 92–106. [Google Scholar] [CrossRef] [PubMed]
  36. Lim, S.S.; Vos, T.; Flaxman, A.D.; Danaei, G.; Shibuya, K.; Adair-Rohani, H.; AlMazroa, M.A.; Amann, M.; Anderson, H.R.; Andrews, K.G.; et al. A comparative risk assessment of burden of disease and injury attributable to 67 risk factors and risk factor clusters in 21 regions, 1990–2010: A systematic analysis for the global burden of disease study 2010. Lancet 2012, 380, 2224–2260. [Google Scholar] [CrossRef]
  37. Chen, H.; Lin, Y.; Su, Q.; Cheng, L. Spatial variation of multiple air pollutants and their potential contributions to all-cause, respiratory, and cardiovascular mortality across China in 2015–2016. Atmos. Environ. 2017, 168, 23–35. [Google Scholar] [CrossRef]
  38. Pyrri, I.; Kapsanaki-Gotsi, E. Functional relations of airborne fungi to meteorological and pollution factors in a mediterranean urban environment. Fungal. Ecol. 2017, 30, 48–54. [Google Scholar] [CrossRef]
  39. Zu, Y.; Huang, L.; Hu, J.; Zhao, Z.; Liu, H.; Zhang, H.; Ying, Q.; Chen, M. Investigation of relationships between meteorological conditions and high PM10 pollution in a megacity in the western Yangtze river delta, china. Air Qual. Atmos. Health 2017, 10, 713–724. [Google Scholar] [CrossRef]
  40. Liang, P.; Zhu, T.; Fang, Y.; Li, Y.; Han, Y.; Wu, Y.; Hu, M.; Wang, J. The role of meteorological conditions and pollution control strategies in reducing air pollution in Beijing during APEC 2014 and victory parade 2015. Atmos. Chem. Phys. 2017, 17, 1–62. [Google Scholar] [CrossRef]
  41. Hu, X.-M.; Zhang, Y.; Jacobson, M.Z.; Chan, C.K. Coupling and evaluating gas/particle mass transfer treatments for aerosol simulation and forecast. J. Geophys. Res. Atmos. 2008, 113. [Google Scholar] [CrossRef]
  42. Sandeep, A.; Rao, T.N.; Ramkiran, C.N.; Rao, S.V.B. Differences in atmospheric boundary-layer characteristics between wet and dry episodes of the Indian summer monsoon. Bound. Layer Meteorol. 2014, 153, 217–236. [Google Scholar] [CrossRef]
  43. Archer, V.E.; Coons, T.; Saccomanno, G.; Hong, D.-Y. Latency and the lung cancer epidemic among United States uranium miners. Health Phys. 2004, 87, 480–489. [Google Scholar] [CrossRef] [PubMed]
Figure 1. Diurnal variation of hourly PM2.5 and PM10 concentrations in 2014, 2015 and 2016.
Ijerph 15 00602 g001
Figure 2. The statistical boxes for the ratios of PM2.5/PM10 and PM2.5/CO across different seasons in 3 years.
Ijerph 15 00602 g002
Figure 3. Correlations between PM2.5 and meteorological parameters: air temperature (T), air pressure (AP), relative humidity (RH) and wind speed (WS) across different seasons in three years.
Ijerph 15 00602 g003
Figure 4. Premature mortality and years of life lost attributable to PM2.5 in Nanjing.
Ijerph 15 00602 g004
Figure 5. Normalized premature mortality as a function of fractional reduction in PM2.5 concentrations.
Ijerph 15 00602 g005
Figure 6. Potentially avoidable premature mortality and relative percentage if the PM2.5 concentrations were reduced to the World Health Organization (WHO) three interim targets (ITs) and air quality guidelines (AQG).
Ijerph 15 00602 g006
Table 1. Annual and seasonal average fine particulate matter (PM2.5) concentrations during the study period (μg/m3, mean ± SD, calculated from daily values).
Annual MeanSpringSummerFallWinter
201471 ± 3574 ± 2965 ± 3467 ± 3478 ± 42
201555 ± 3353 ± 2138 ± 2147 ± 2881 ± 42
201645 ± 2955 ± 3231 ± 1634 ± 1961 ± 32
Average57 ± 3460 ± 2945 ± 2949 ± 3174 ± 40
Table 2. The attributable fractions due to PM2.5 for chronic obstructive pulmonary disease (COPD), ischemic heart disease (IHD), lung cancer (LC) and stroke under target scenarios.
PM2.5 (μg/m3)Attributable Fractions (AFs) (%)
COPDIHDLCStroke
20147123302946
20155520282544
20164518262241
IT-13515231834
IT-22511201425
IT-315715811
AQG1031044

