Influence of Vehicle Speed on the Characteristics of Driver’s Eye Movement at a Highway Tunnel Entrance during Day and Night Conditions: A Pilot Study


Abstract
:1. Introduction
2. Literature Review on Drivers’ Eye Movement Characteristics While Driving
3. Experimental Methodology
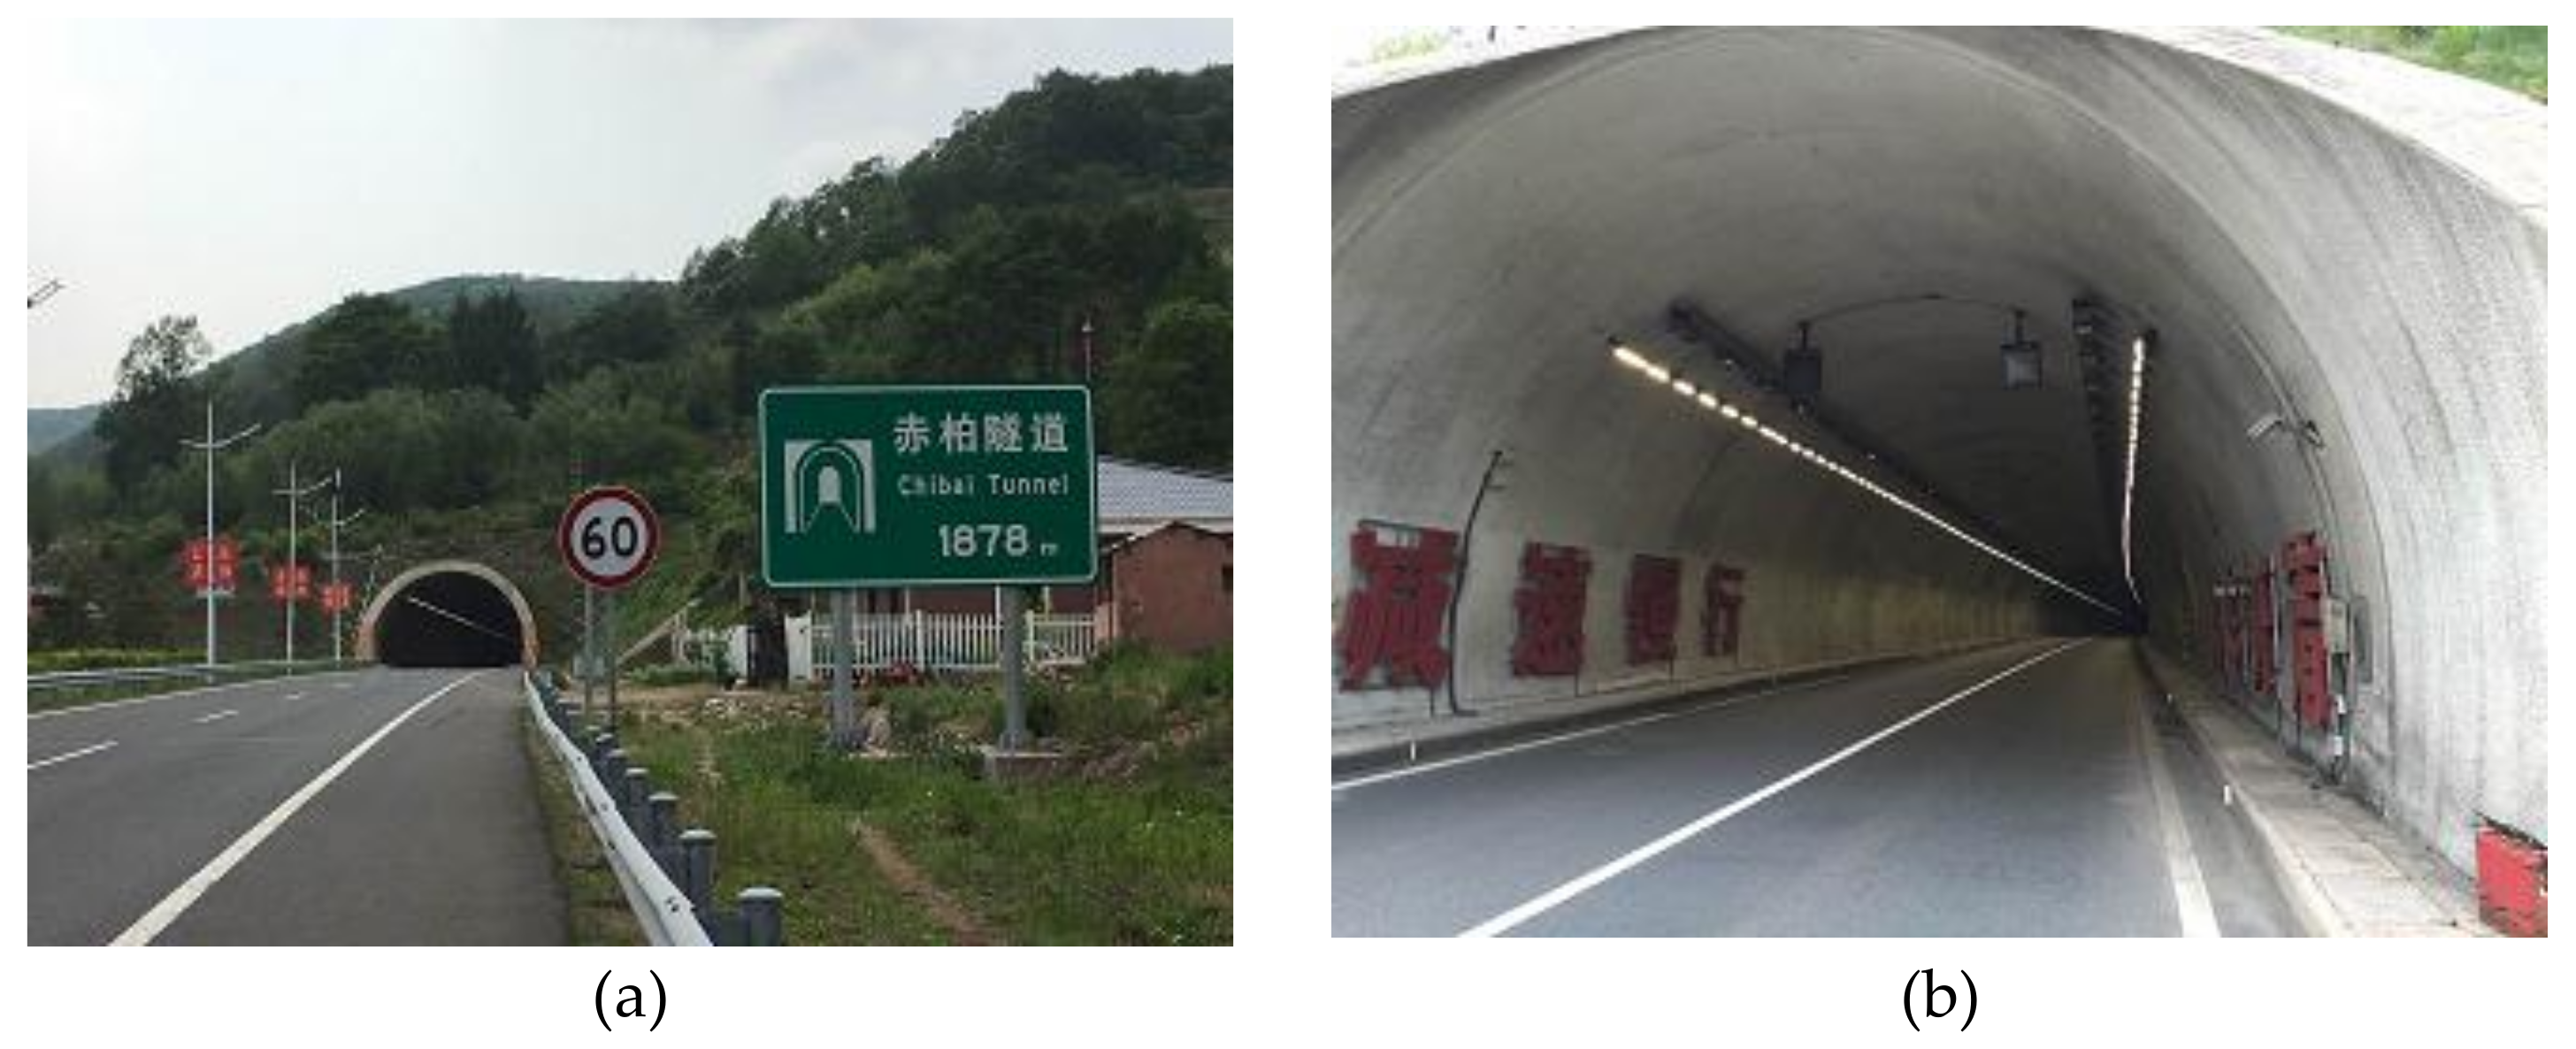
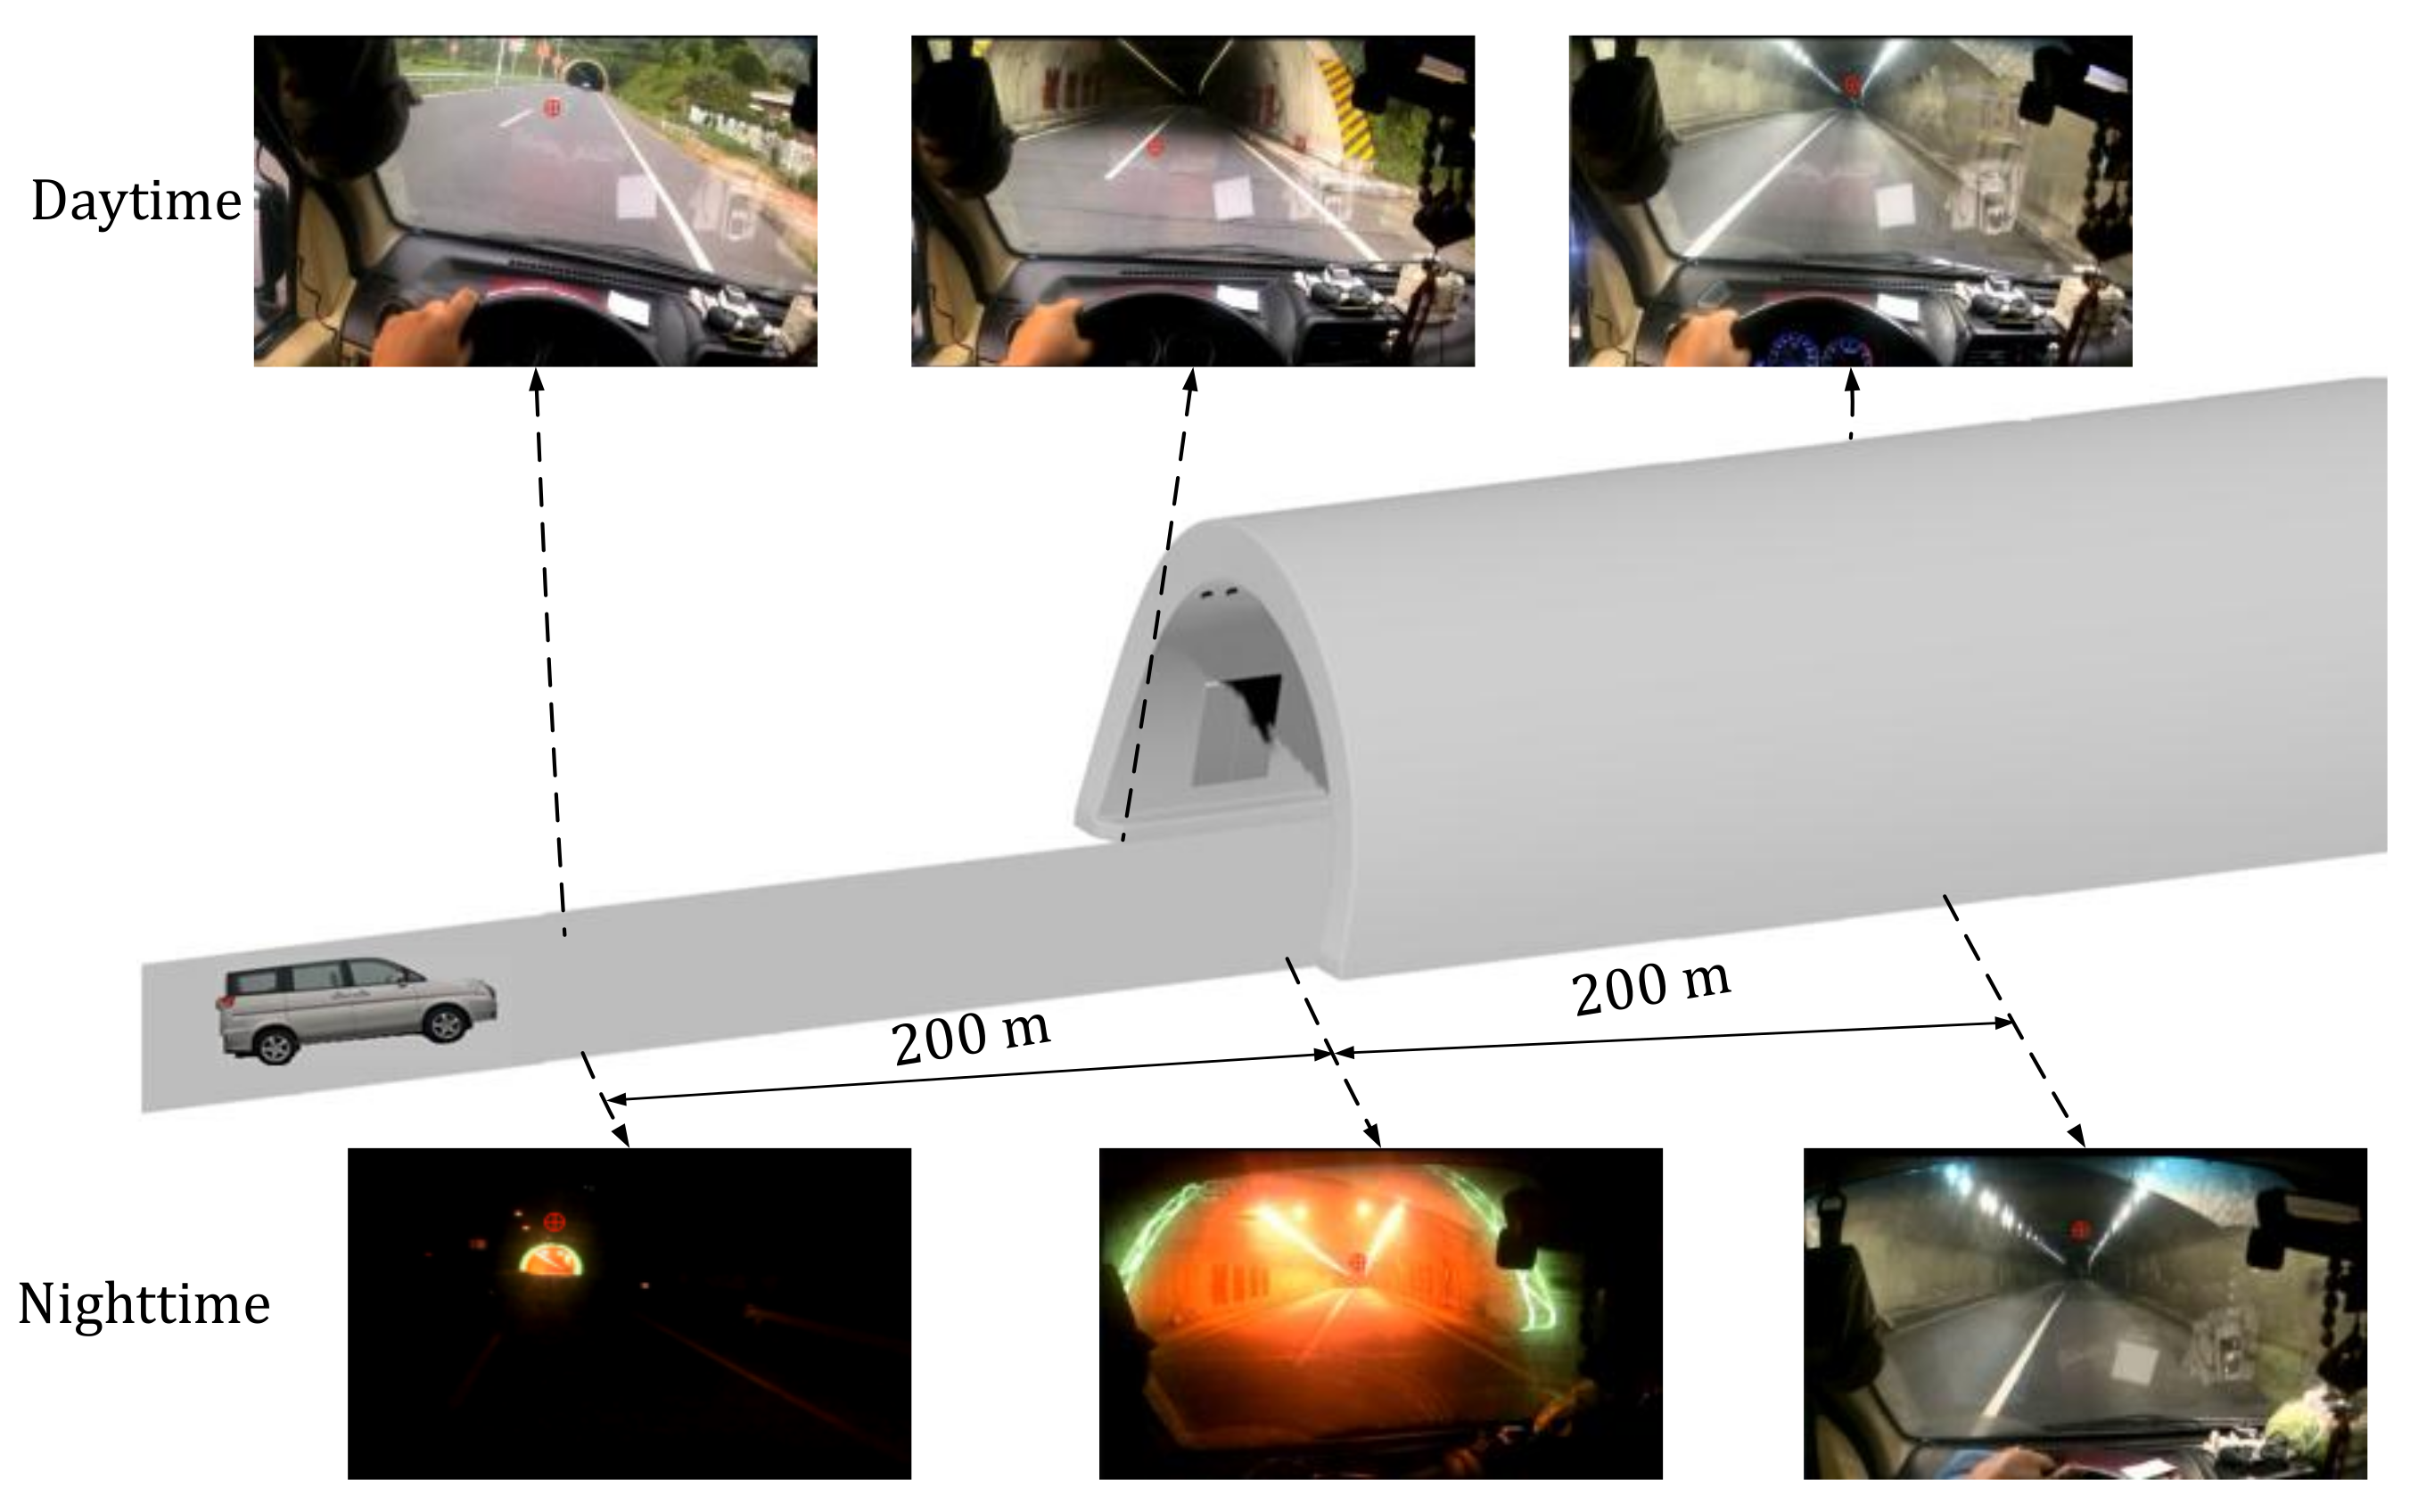
3.1. Driving Environment
3.2. Participants
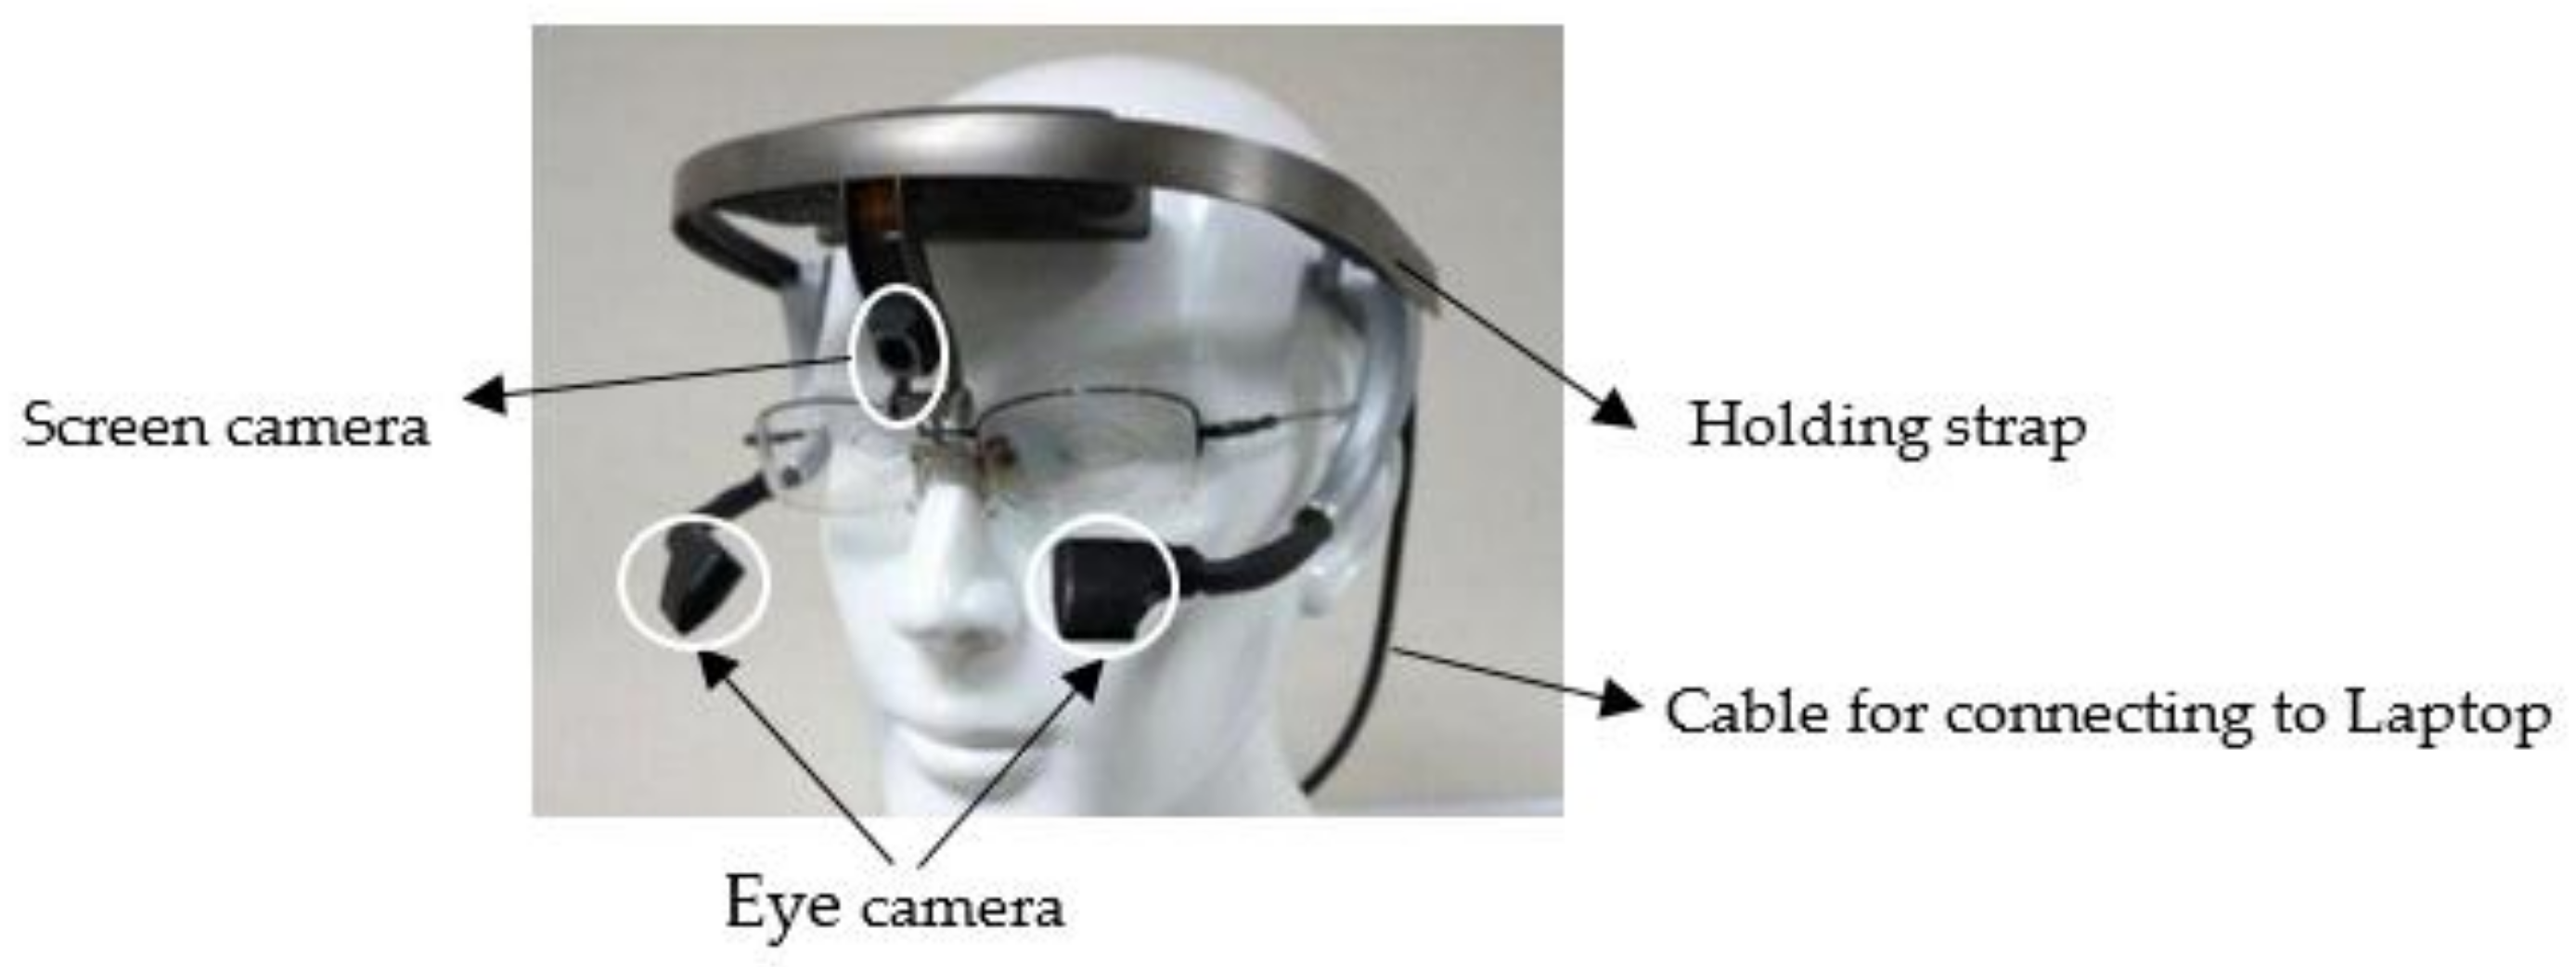
3.3. Apparatus
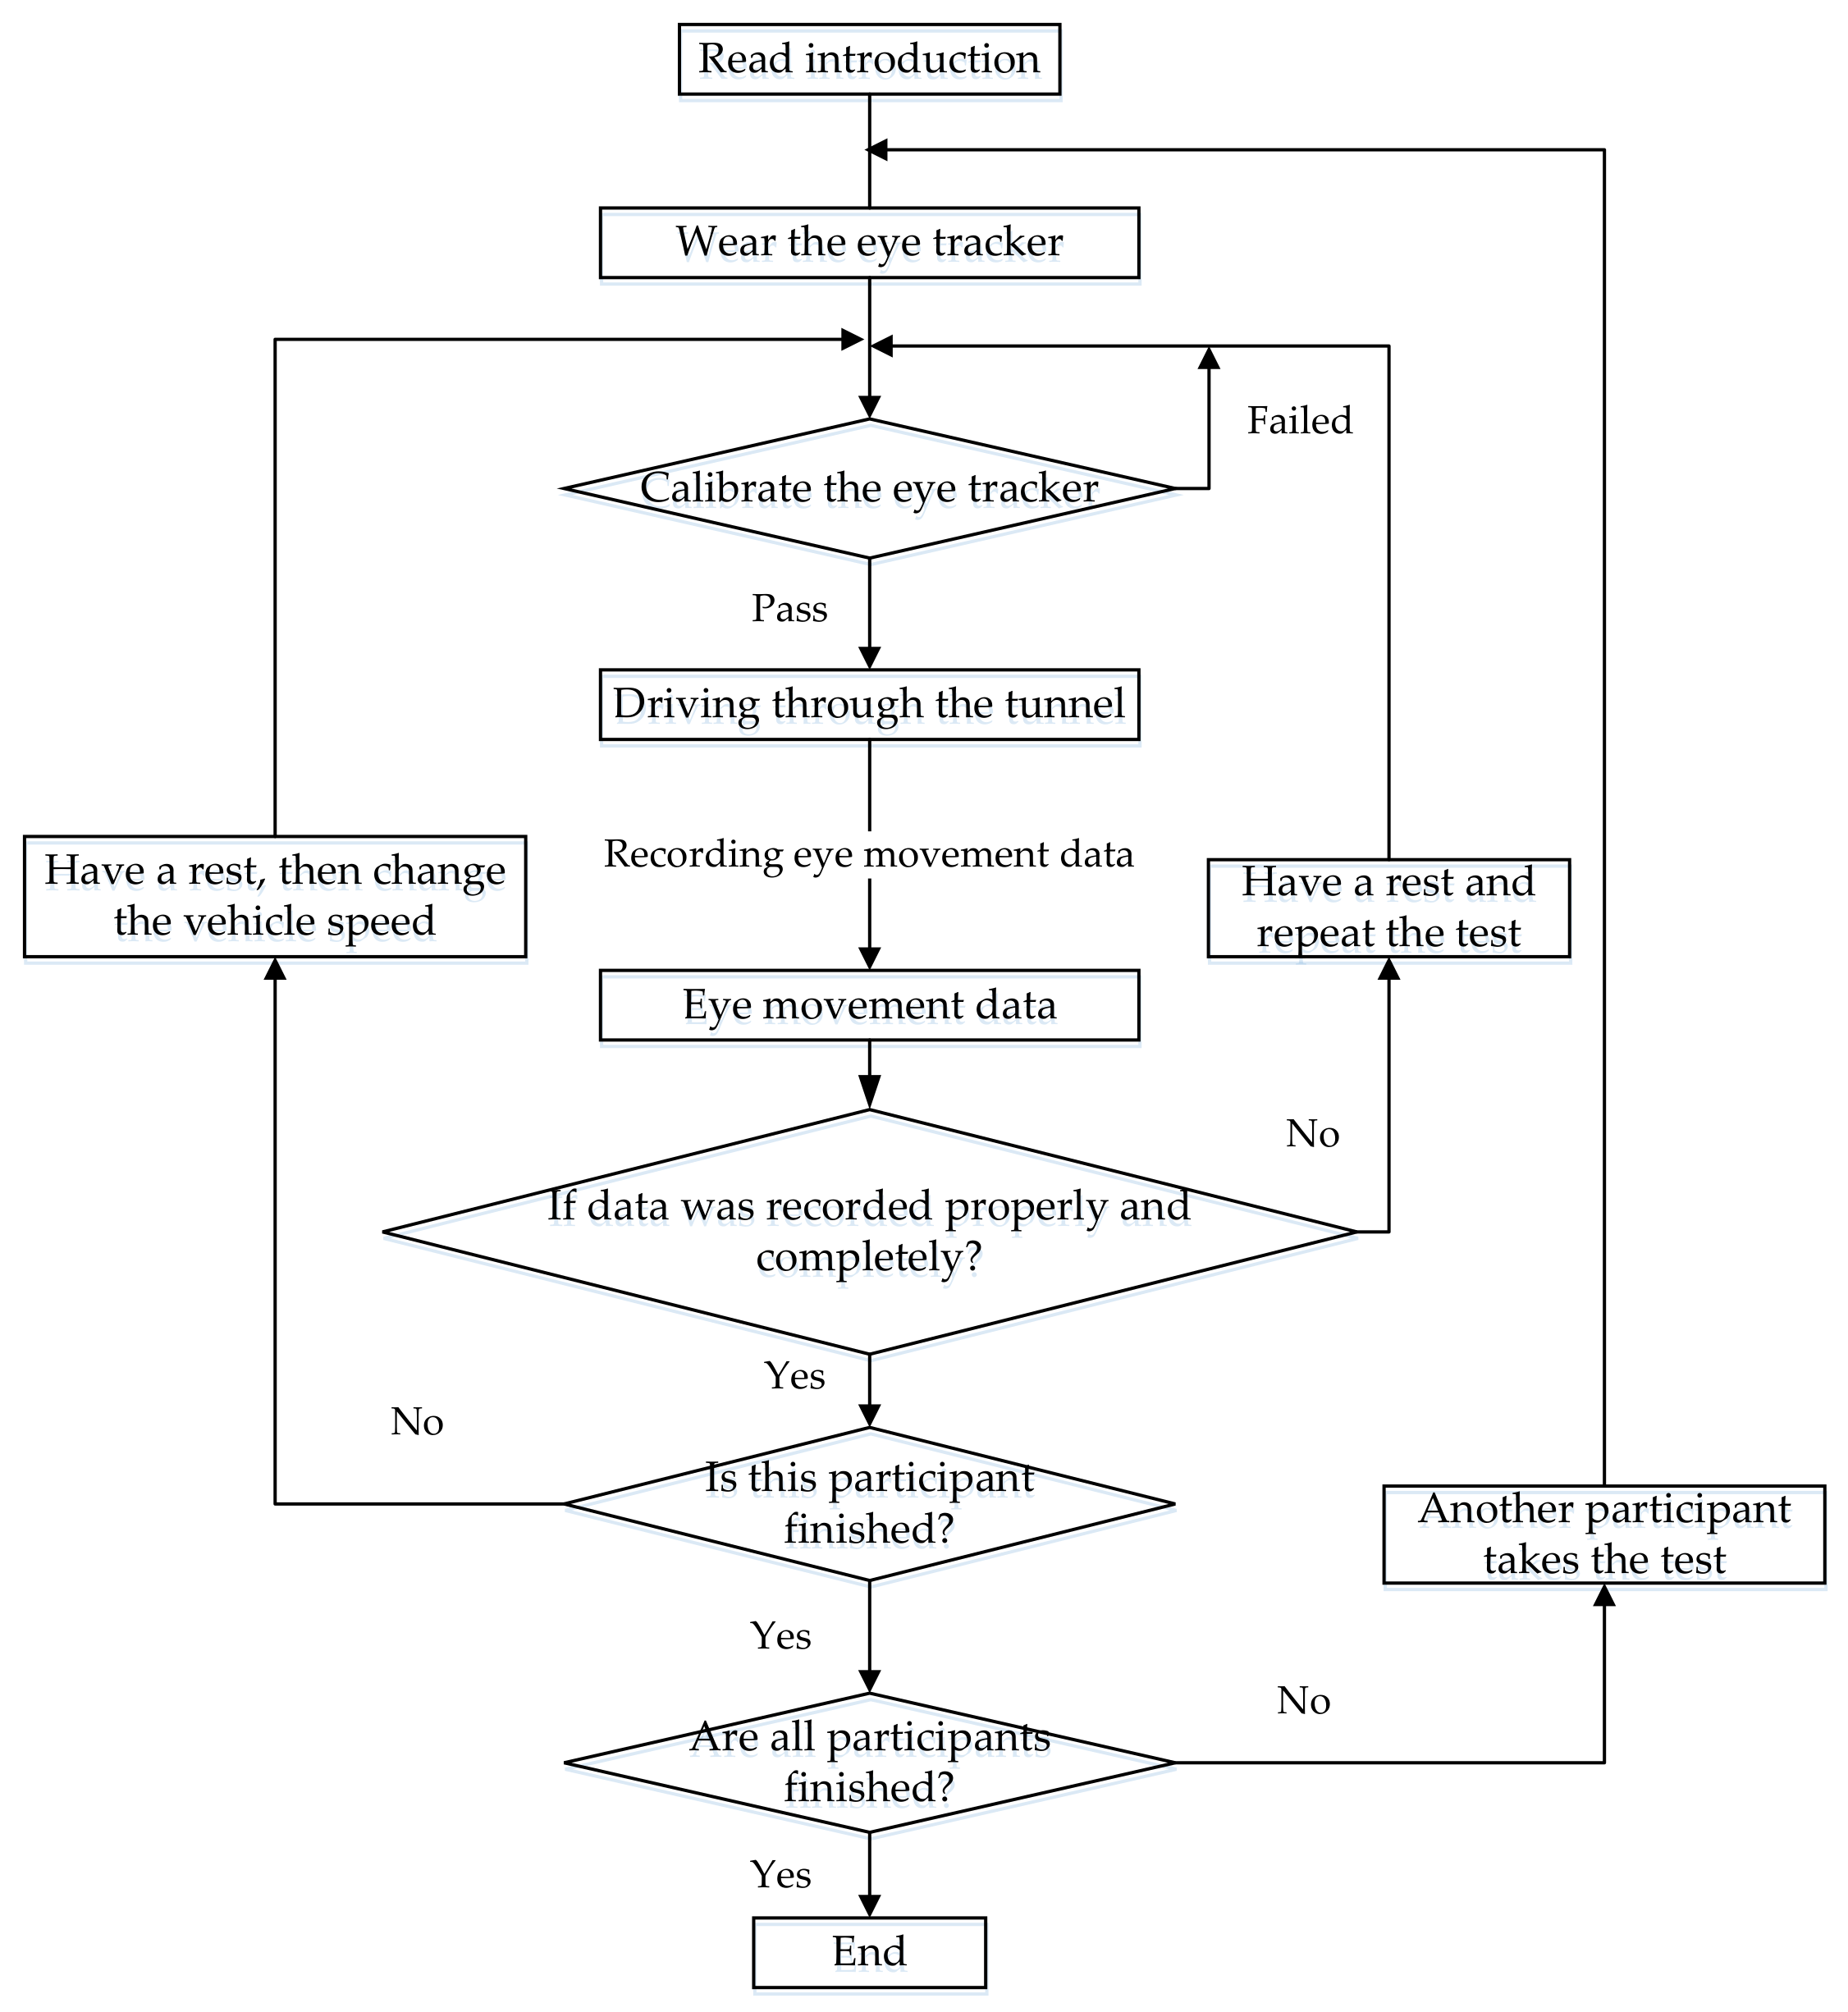
3.4. Experimental Procedure
4. Results and Discussion
4.1. Data Processing
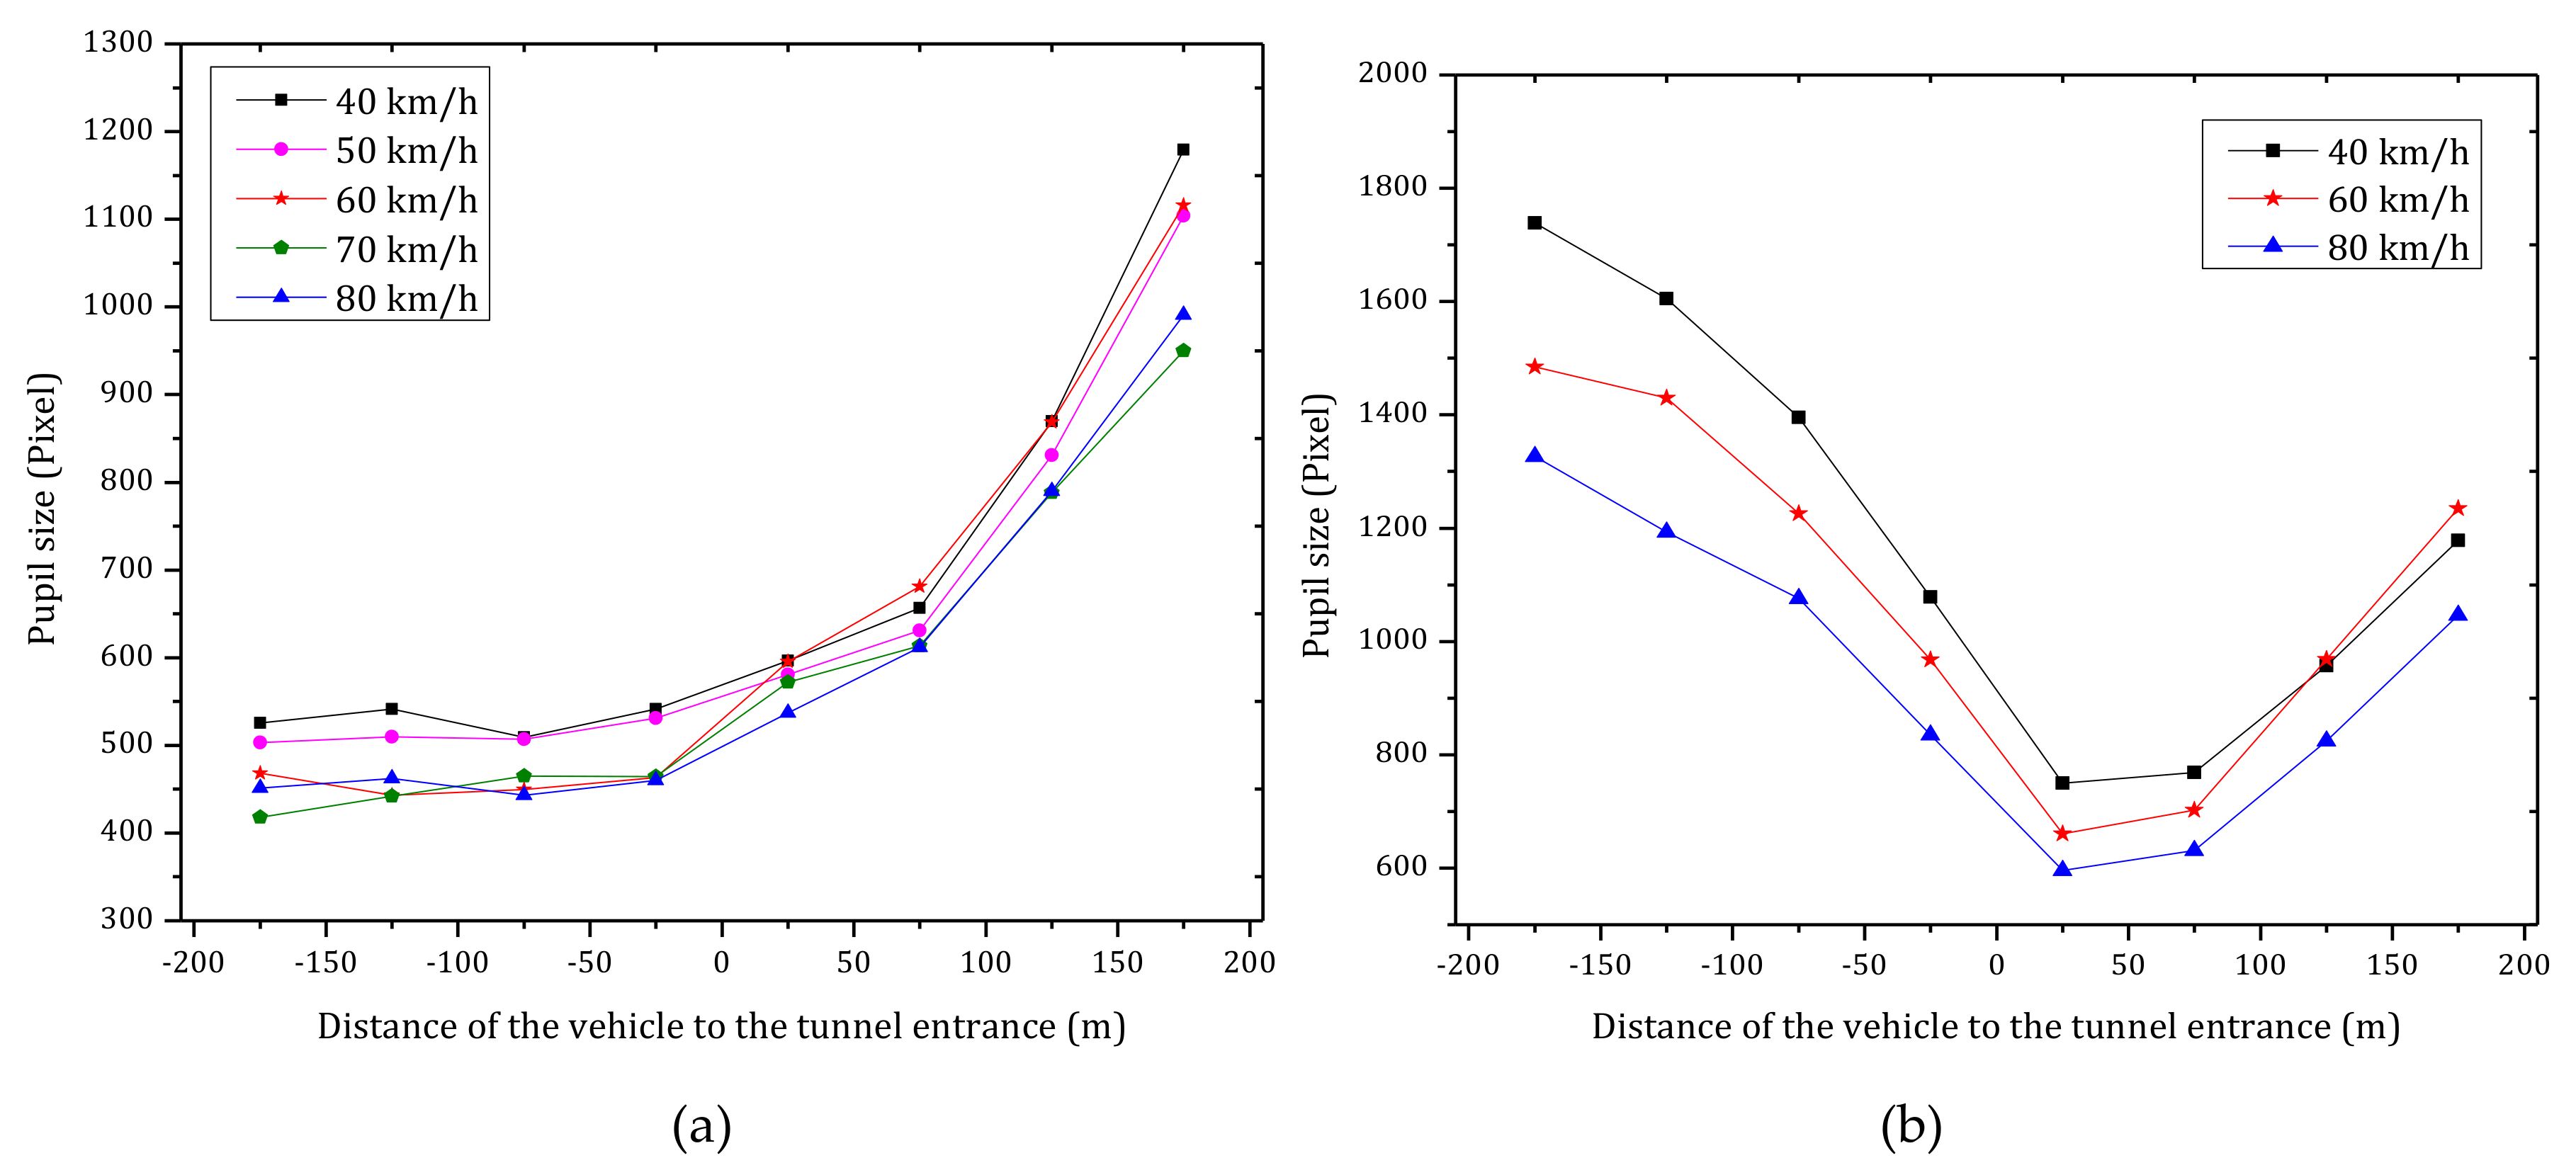
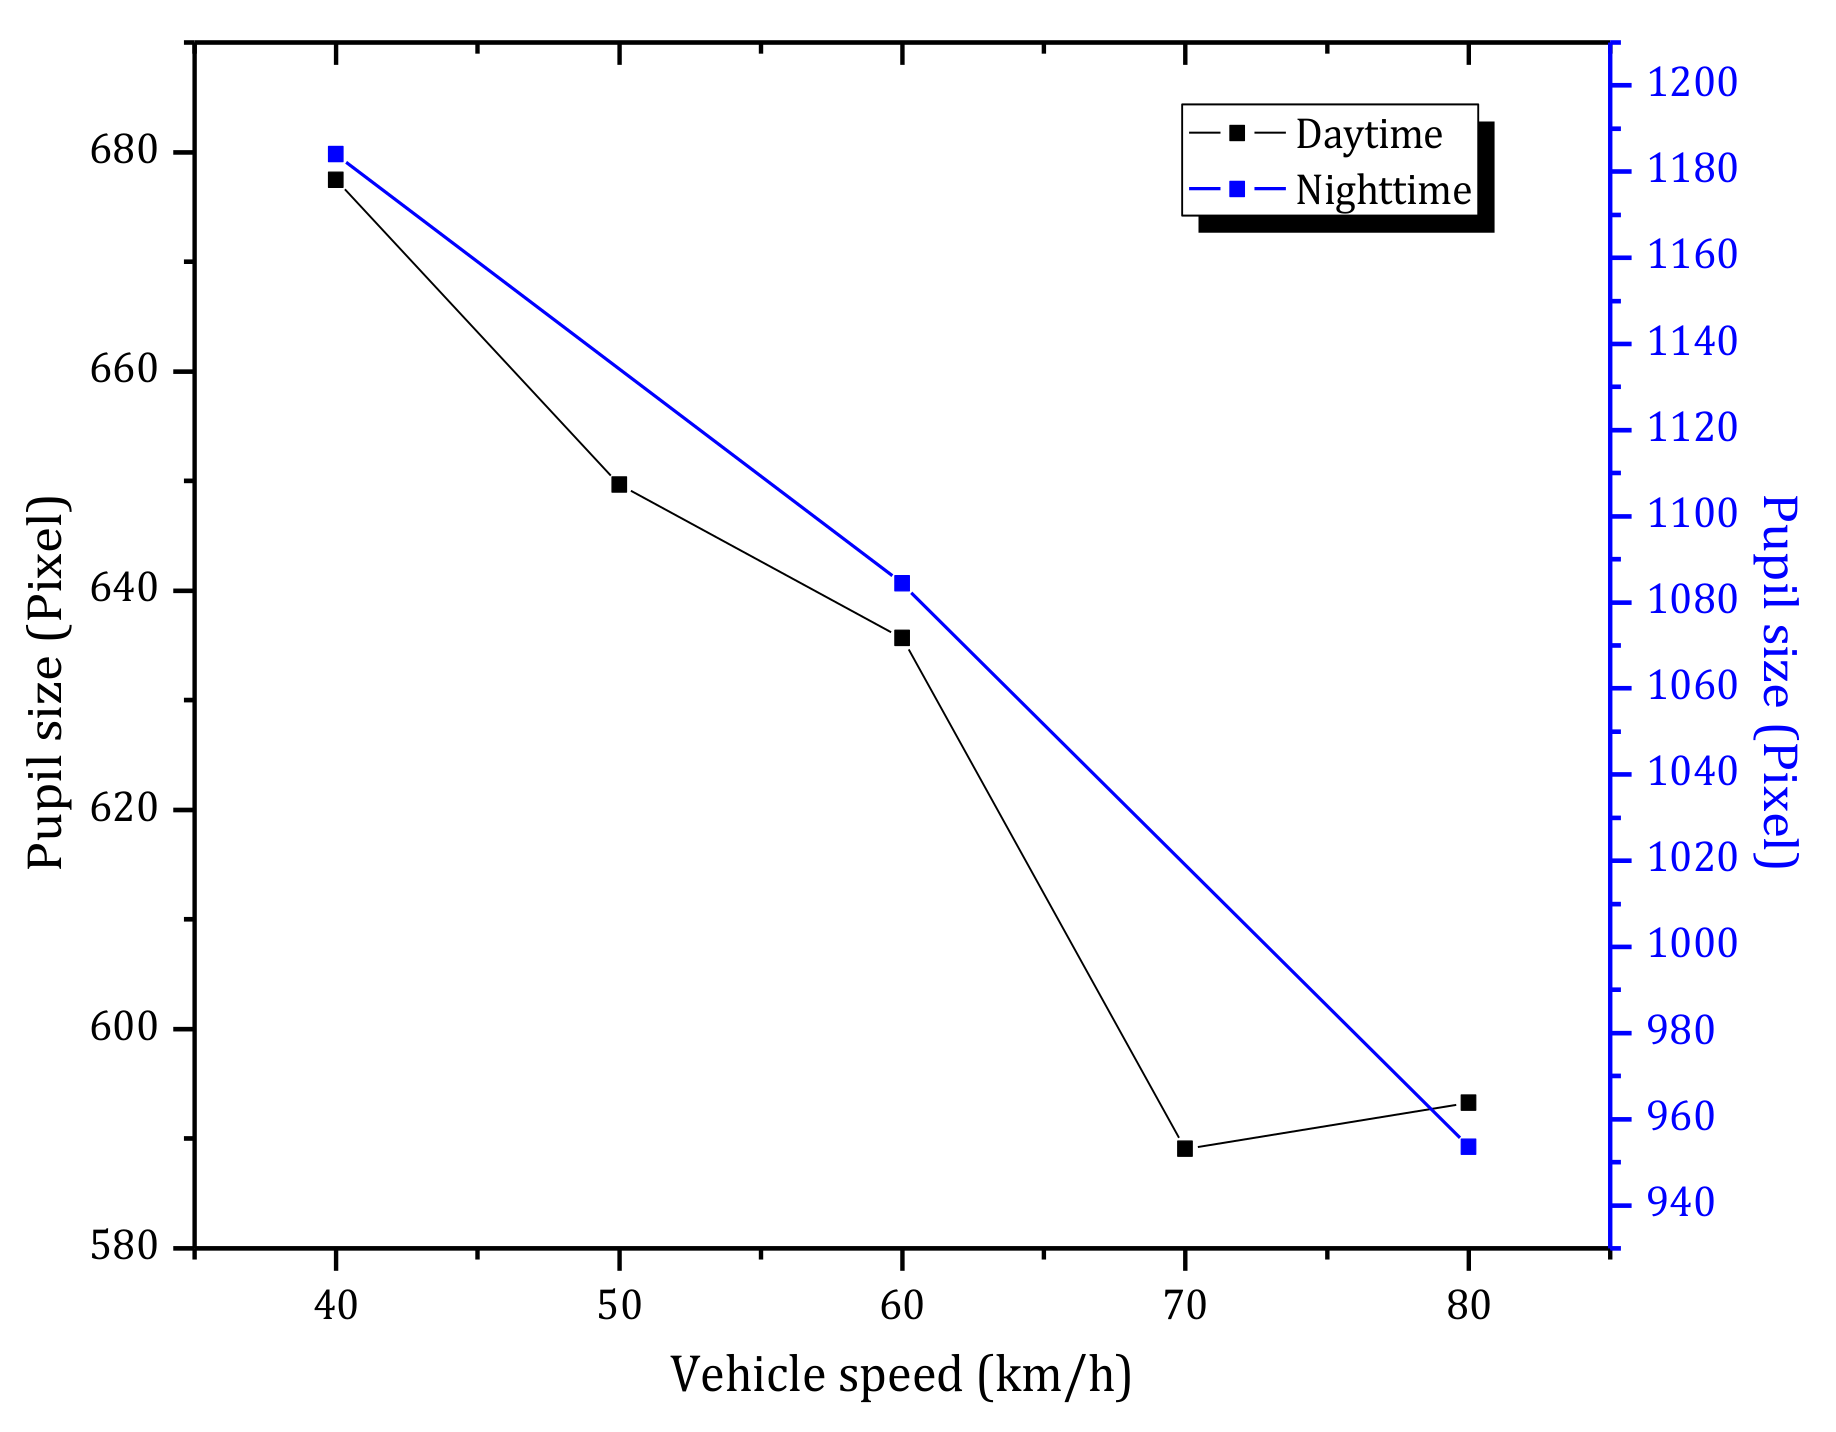
4.2. Pupil Size
4.3. Fixations
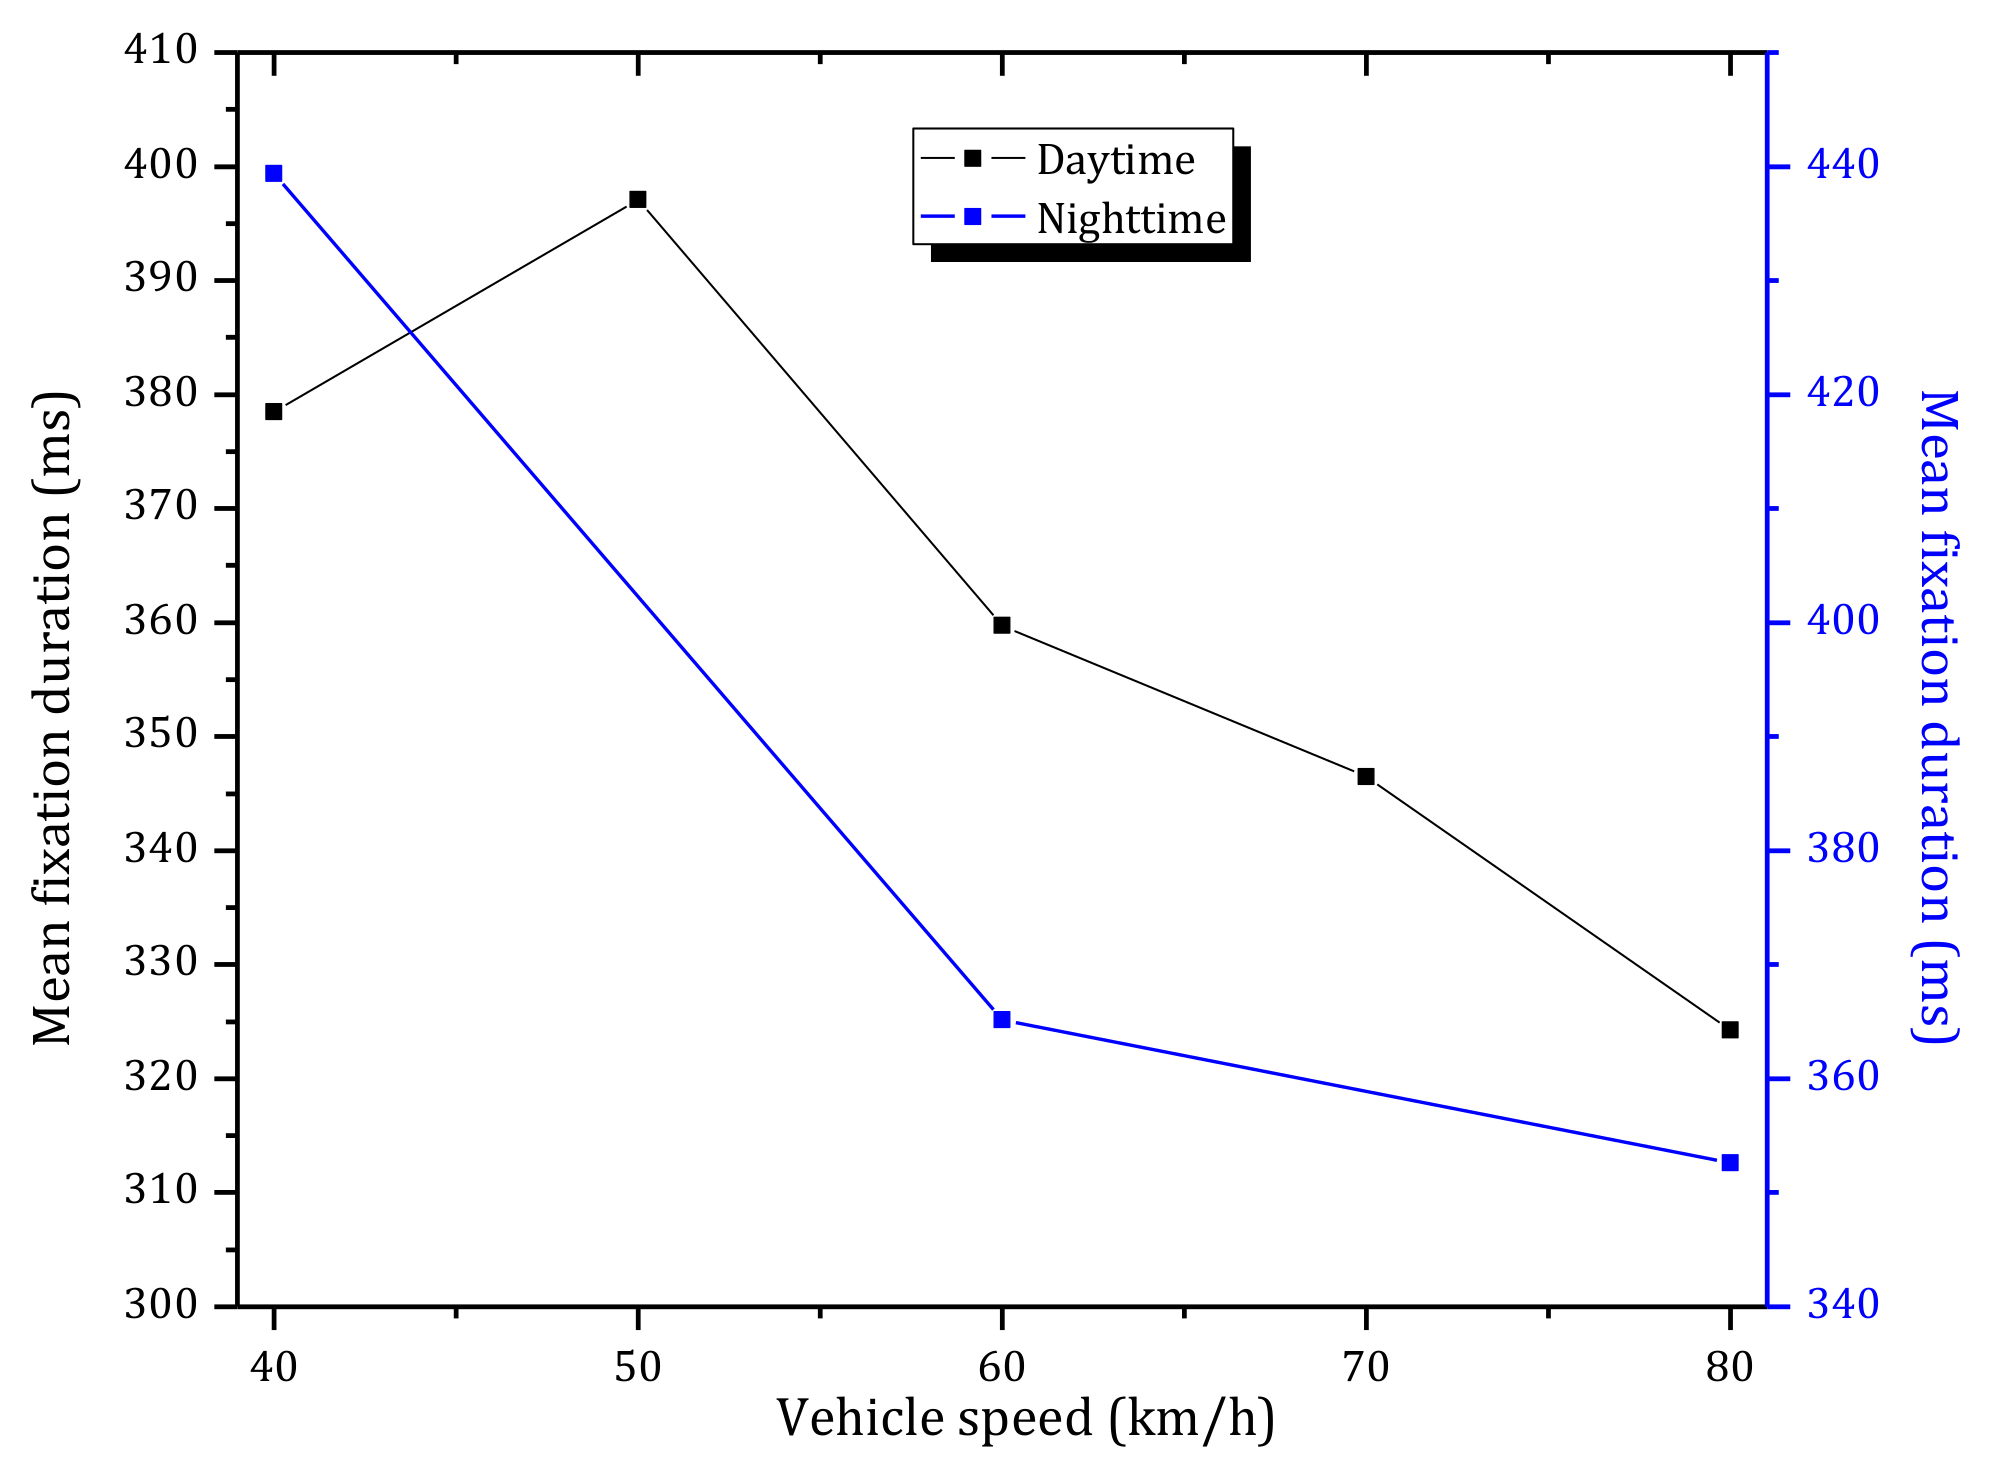
4.3.1. Fixation Duration
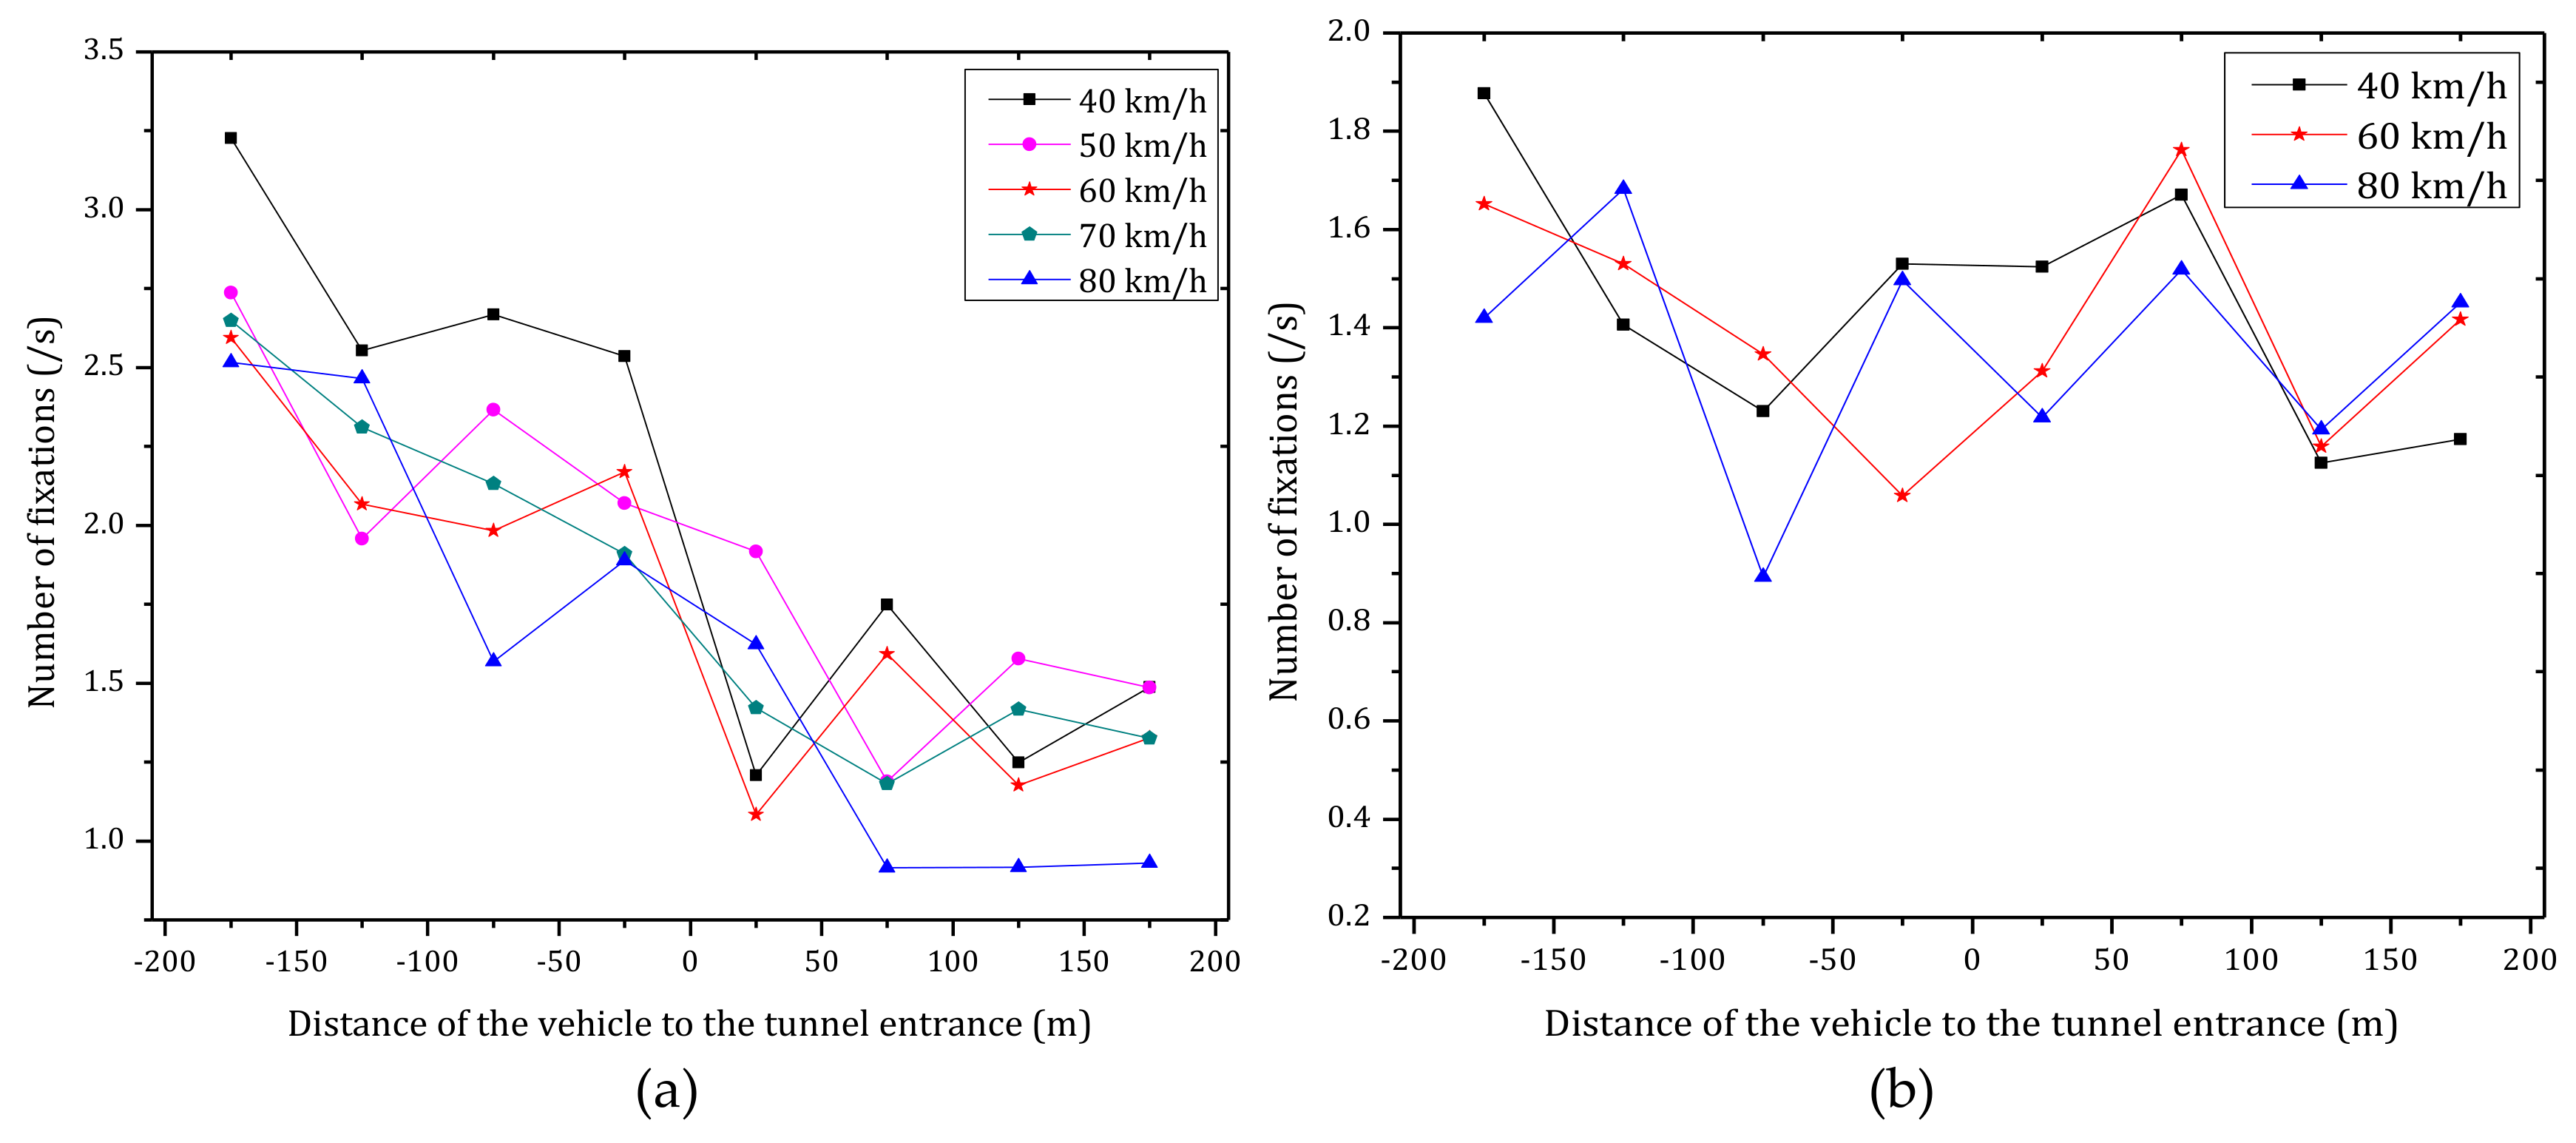
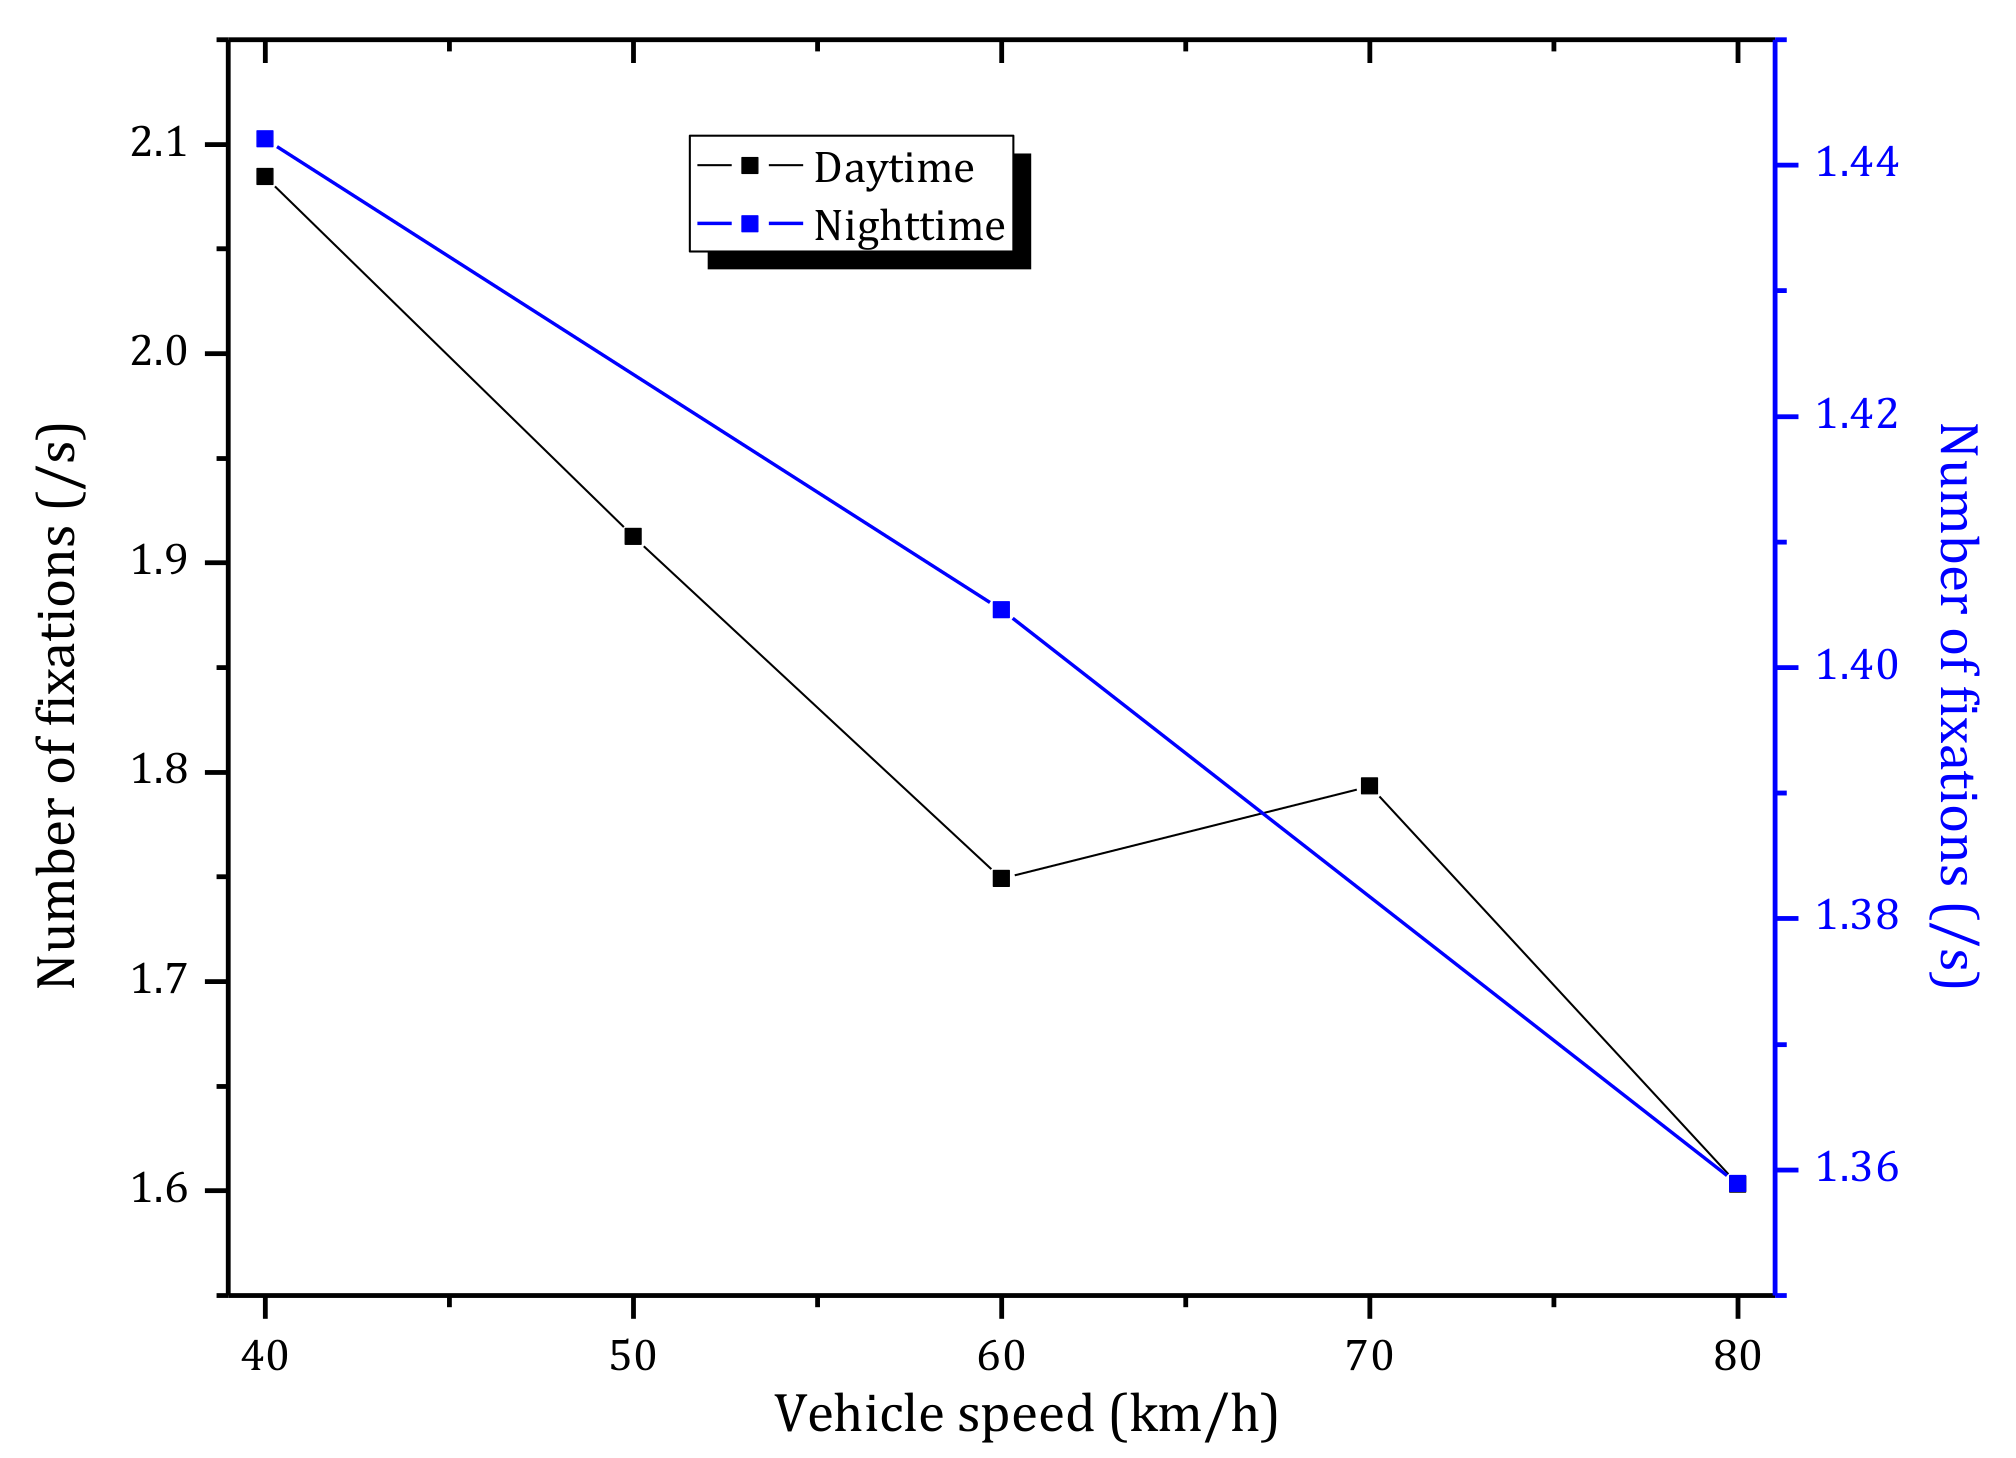
4.3.2. Number of Fixations
5. Conclusions
Acknowledgments
Author Contributions
Conflicts of Interest
References
- Mashimo, H. State of the road tunnel safety technology in Japan. Tunn. Undergr. Space Technol. 2002, 17, 145–152. [Google Scholar] [CrossRef]
- Department of Transportation, China. Communique for the development of traffic and transportation industry in 2016. Financ. Account. Commun. 2016, 5, 92–96. [Google Scholar] [CrossRef]
- Wang, S.F. Classification of highway tunnel and discussion on the concept of highway tunnel group. Highw. Tunn. 2009, 2, 10–14. [Google Scholar]
- Salata, F.; Golasi, I.; Bovenzi, S.; de Lieto Vollaro, E.; Pagliaro, F.; Cellucci, L.; Coppi, M.; Gugliermetti, F.; de Lieto Vollaro, A. Energy optimization of road tunnel lighting systems. Sustainability 2015, 7, 9664–9680. [Google Scholar] [CrossRef]
- Guo, L.Y.; Liang, B. Study on lighting control system of the tunnel on expressway. Microcomput. Inf. 2009, 7, 38–39. [Google Scholar]
- Qin, L.; Dong, L.; Xu, W.; Zhang, L.; Yan, Q.; Chen, X. A “vehicle in, light brightens; vehicle out, light darkens” energy-saving control system of highway tunnel lighting. Tunn. Undergr. Space Technol. 2017, 66, 147–156. [Google Scholar] [CrossRef]
- Yang, C.; Fan, S.; Wang, Z.; Li, W. Application of fuzzy control method in a tunnel lighting system. Math. Comput. Model. Int. J. 2011, 54, 931–937. [Google Scholar] [CrossRef]
- Beka, M.C. A study on tunnel lighting. J. Light. Des. Appl. 2005, 6, 10–16. [Google Scholar]
- Shimojo, A.; Takagi, H.; Onuma, H. A simulation study of driving performance in long tunnel. In Proceedings of the Vehicle Navigation and Information Systems Conference, in Conjunction with the Pacific Rim Transtech Conference, 6th International VNIS, a Ride into the Future, Seattle, WA, USA, 30 July–2 August 1995; pp. 96–103. [Google Scholar]
- Yeung, J.S.; Wong, Y.D. The effect of road tunnel environment on car following behaviour. Accid. Anal. Prev. 2014, 70, 100–109. [Google Scholar] [CrossRef] [PubMed]
- Nussbaumer, C. Comparative Analysis of Safety in Tunnels; Young Researchers Seminar; Austrian Road Safety Board: Brno, Czech Republic, 2007. [Google Scholar]
- Lemke, K. Road safety in tunnels. Transp. Res. Rec. J. Transp. Res. Board 2000, 1740, 170–174. [Google Scholar] [CrossRef]
- Leitner, A. The fire catastrophe in the Tauern tunnel: Experience and conclusions for the Austrian guidelines. Tunn. Undergr. Space Technol. 2001, 16, 217–223. [Google Scholar] [CrossRef]
- Carvel, R.; Marlair, G. A history of fire incidents in tunnels. In The Handbook of Tunnel Fire Safety London; Beard, A., Carvel, R., Eds.; Thomas Telford: London, UK, 2005; pp. 3–23. [Google Scholar]
- Alan, B.; Richard, C. The Handbook of Tunnel Fire Safety; Thomas Telford: London, UK, 2005; pp. 3–41. [Google Scholar]
- Kirkland, C.J. The fire in the channel tunnel. Tunn. Undergr. Space Technol. 2002, 17, 129–132. [Google Scholar] [CrossRef]
- Amundsen, F.H.; Ranes, G. Studies on traffic accidents in Norwegian road tunnels. Tunn. Undergr. Space Technol. 2000, 15, 3–11. [Google Scholar] [CrossRef]
- Ma, Z.L.; Shao, C.F.; Zhang, S.R. Characteristics of traffic accidents in Chinese freeway tunnels. Tunn. Undergr. Space Technol. 2009, 24, 350–355. [Google Scholar] [CrossRef]
- Amundsen, F.H. Studies of driver behaviour in Norwegian road tunnels. Tunn. Undergr. Space Technol. 1994, 9, 9–15. [Google Scholar] [CrossRef]
- Guo, B.Y. Study on the Eye Movement Fixation Characteristics of Drivers on the Entrance and Exit Section of the Nighttime Tunnels. Master’s Thesis, Chang’an University, Xi’an, China, 2014. [Google Scholar]
- Zhang, Y.H. A Research on Alignment Safety at Entrance of Tunnel Based on Driver’s Visual Load. Master’s Thesis, Southwest Jiaotong University, Chengdu, Sichuan, China, 2012. [Google Scholar]
- Parker, D.; Reason, J.T.; Asr, M.; Stradling, S.G. Driving errors, driving violations and accident involvement. Ergonomics 1995, 38, 1036–1048. [Google Scholar] [CrossRef] [PubMed]
- Gu-Chang, A.O.; Yang, L. Correlation analysis on driver’s human factors and accident hazard in road traffic accidents. J. Chongqing Jiaotong Univ. 2010, 29, 121–124. (In Chinese) [Google Scholar]
- Luo, Y.; Li, X. The effects of human factor on Chinese road traffic accidents. Highw. Automot. Appl. 2001, 3, 19–20. [Google Scholar] [CrossRef]
- Wang, J.Z. Traffic accidents and human factor of drivers. Qinghai Jiaotong Keji 2007, 1, 58–60. [Google Scholar] [CrossRef]
- Zhang, W.; Dai, J.; Pei, Y.; Li, P.; Yan, Y.; Chen, X. Drivers’ visual search patterns during overtaking maneuvers on freeway. Int. J. Environ. Res. Public Health 2016, 13, 1159. [Google Scholar] [CrossRef] [PubMed]
- Du, Z.-G.; Pan, X.-D.; Guo, X.-B. Experimental studies of visual adaptation on driving through freeway tunnel’s entrance and exit. J. Harbin Inst. Technol. 2007, 39, 1998–2001. [Google Scholar]
- Sivak, M. The information that drivers use: Is it indeed 90% visual? Perception 1996, 25, 1081. [Google Scholar] [CrossRef] [PubMed]
- Mäntyjärvi, M.; Tuppurainen, K.; Rouhiainen, H. Visual function in professional truck drivers. Int. Arch. Occup. Environ. Health 1998, 71, 357–362. [Google Scholar] [CrossRef] [PubMed]
- Yan, Y.; Yuan, H.; Wang, X.; Xu, T.; Liu, H. Study on driver’s fixation variation at entrance and inside sections of tunnel on highway. Adv. Mech. Eng. 2014, 7, 273427:1–273427:10. [Google Scholar] [CrossRef]
- Guo, Y.S.; Fu, R.; Yuan, W.; Zhang, J.F. Influences of passage width on driver’s dynamic vision and operation behavior. China J. Highw. Transp. 2006, 19, 83–87. [Google Scholar]
- Zhao, B. Driver’s dynamic visual characters and its effects. J. Highw. Transp. Res. Dev. 1998, 15, 102–104. [Google Scholar]
- Ni, H.L.; Dai, Y.H.; Zhao, Q.X. Research on distribution characteristics of traffic accidents in expressway tunnel. Highway 2010, 4, 126–129. [Google Scholar]
- Zhang, R.S.; Ma, Z.L.; Xu, J.C. Traffic accidents distribution law in freeway tunnel. J. Chang’an Univ. 2008, 28, 74–78. (In Chinese) [Google Scholar]
- Jian, S.Y.; Wong, Y.D. Road traffic accidents in Singapore expressway tunnels. Tunn. Undergr. Space Technol. 2013, 38, 534–541. [Google Scholar]
- Wang, H.; Liu, H.X.; Zhao, W.H.; Ding, G.; Liu, K. Analysis on traffic accident feature in expressway tunnel. Highway 2009, 11, 144–147. (In Chinese) [Google Scholar]
- Zhang, S.R.; Zhuang, L.M.A.; Qiang, S. Distribution characteristics and countermeasures of traffic accidents in expressway tunnel group. J. Chang’an Univ. 2007, 27, 63–66. (In Chinese) [Google Scholar]
- Mannering, F. The effect of interstate speed limits on driving speeds: Some new evidence. In Proceedings of the 86th Annual Meeting of the Transportation Research Board, Paper No. 07-0120, Washington, DC, USA, 21–25 January 2007. [Google Scholar]
- Ma, S.Q.; Liu, D.; Zheng, Y.L. Influence of vehicle speed on road traffic safety and Countermeasures. J. Chin. People’s Public Secur. Univ. 2009, 3, 59–62. (In Chinese) [Google Scholar]
- Bédard, M.; Guyatt, G.H.; Stones, M.J.; Hirdes, J.P. The independent contribution of driver, crash, and vehicle characteristics to driver fatalities. Accid. Anal. Prev. 2002, 34, 717–727. [Google Scholar] [CrossRef]
- Crundall, D.E.; Underwood, G. Effects of experience and processing demands on visual information acquisition in drivers. Ergonomics 1998, 41, 448–458. [Google Scholar] [CrossRef]
- Underwood, G.; Chapman, P.; Brocklehurst, N.; Underwood, J.; Crundall, D. Visual attention while driving: Sequences of eye fixations made by experienced and novice drivers. Ergonomics 2003, 46, 629–646. [Google Scholar] [CrossRef] [PubMed]
- Maltz, M.; Shinar, D. Eye movements of younger and older drivers. Hum. Factors 1999, 41, 15–25. [Google Scholar] [CrossRef] [PubMed]
- Falkmer, T.; Gregersen, N.P. A comparison of eye movement behavior of inexperienced and experienced drivers in real traffic environments. Optom. Vis. Sci. 2005, 82, 732–739. [Google Scholar] [CrossRef] [PubMed]
- Li, L.; Jin, Z.; Yu, D. Differential effects of road situations and driving behaviors on eye movements in experienced and novice drivers. J. Vis. 2013, 13, 1117. [Google Scholar] [CrossRef]
- Kojima, Y. Driving characteristics of novice and experienced drivers—Part 1: Characteristics of visual search. Trans.Soc. Automot. Eng. Jpn. 1997, 28, 73–78. [Google Scholar]
- Leeuwen, P.M.V.; Happee, R.; Winter, J.C.F.D. Changes of driving performance and gaze behavior of novice drivers during a 30-min simulator-based training. Procedia Manuf. 2015, 3, 3325–3332. [Google Scholar] [CrossRef]
- Mourant, R.R.; Rockwell, T.H. Strategies of visual search by novice and experimental drivers. Hum. Factors 1972, 14, 325. [Google Scholar] [CrossRef] [PubMed]
- Torbjörn, F.; Nils Petter, G. Fixation patterns of learner drivers with and without cerebral palsy (CP) when driving in real traffic environments. Transp. Res. Part F Traffic Psychol. Behav. 2001, 4, 171–185. [Google Scholar]
- Gramann, K.; El, S.J.; Deubel, H. Eye-movements during navigation in a virtual tunnel. Int. J. Neurosci. 2009, 119, 1755–1778. [Google Scholar] [CrossRef] [PubMed]
- Miyoshi, T.; Nakayasu, H. Analysis of relationship between characteristics of driver’s eye movements and visual scene in driving events. In Proceedings of the IEEE International Conference on Fuzzy Systems, Taipei, Taiwan, 27–30 June 2011; pp. 2720–2727. [Google Scholar]
- Akamatsu, M.; Imachou, N.; Sasaki, Y.; Ushiro-Oka, H.; Hamanaka, T.; Sakauchi, Y.; Onuki, M. Simulator study on driver’s behavior while driving through a tunnel in a rolling area. In Proceedings of the Driving Simulation Conference, North America 2003, Dearborn, MI, USA, 8–10 October 2003. [Google Scholar]
- Calvi, A.; D’Amico, F. A study of the effects of road tunnel on driver behavior and road safety using driving simulator. Adv. Transp. Stud. 2013, 30, 59–76. [Google Scholar]
- Xiao, D.; Fang, Y.; Zhang, Y.; Guo, Z. Analysis of driving behavior at the bridge-tunnel transition section in reduced visibility situations. In Proceedings of the 4th International Conference on Transportation Information and Safety, Banff, AB, Canada, 8–10 August 2017; pp. 581–588. [Google Scholar]
- Bella, F. Can the driving simulators contribute to solving the critical issues in geometric design? Transp. Res. Rec. 2009, 2138, 120–126. [Google Scholar] [CrossRef]
- Verwey, W.B. Effects of tunnel entrances on drivers’ physiological condition and performance. Available online: https://trid.trb.org/view/453312 (accessed on 29 March 2018).
- Pan, X.; Du, Z.; Yang, Z. Safety research during entrance and exit of highway tunnel based on drivers’ eye movement experiment. In Proceedings of the Seventh International Conference of Chinese Transportation Professionals Congress (ICCTP), Shanghai, China, 21–22 May 2007; pp. 381–388. [Google Scholar]
- Zhao, W.H.; Liu, H.X.; Liu, W.; Lin, M.; Zhu, T. Visual features of driver in exit and entrance of tunnel group. J. Transp. Sci. Eng. 2011, 27, 75–81. [Google Scholar]
- Hu, Y.K.; Chen, Z.L.; Zhang, Q.W.; Weng, J.; Huang, K. Changing rule of drivers’ pupil size as driving into tunnels. J. Civ. Archit. Environ. Eng. 2015, 37, 106–113. [Google Scholar]
- Wu, S.N.; Chen, X.; Guo, T.Y. A study on differences of physiological characteristics of drivers driving through urban tunnels. J. Transp. Inf. Saf. 2016, 34, 38–45. [Google Scholar] [CrossRef]
- Du, Z.G.; Huang, F.M.; Yan, X.P.; Pan, X.D. Light and dark adaption time based on pupil area variation at entrance and exit areas of highway tunnel. J. Highw. Transp. Res. Dev. 2013, 30, 98–102. [Google Scholar] [CrossRef]
- Du, Z.; Zheng, Z.; Zheng, M.; Ran, B.; Zhao, X. Drivers’ visual comfort at highway tunnel portals: A quantitative analysis based on visual oscillation. Transp. Res. Part D Transp. Environ. 2014, 31, 37–47. [Google Scholar]
- Xu, B.P.; Zhang, J.; Liang, J.; Zhang, P. Study of drivers’ pupil size changing at entrance and exit of tunnels. Highw. Automot. Appl. 2011, 5, 54–58. [Google Scholar] [CrossRef]
- Wang, Y.; Wang, L.; Wang, C.; Zhao, Y. How eye movement and driving performance vary before, during, and after entering a long expressway tunnel: Considering the differences of novice and experienced drivers under daytime and nighttime conditions. Springerplus 2016, 5, 538:1–538:10. [Google Scholar] [CrossRef] [PubMed]
- He, S.; Liang, B.; Pan, G.; Wang, F.; Cui, L. Influence of dynamic highway tunnel lighting environment on driving safety based on eye movement parameters of the driver. Tunn. Undergr. Space Technol. 2017, 67, 52–60. [Google Scholar] [CrossRef]
- Shao, F.; Xu, Q.; Xu, X.; Ma, C. Measuring safety for urban tunnel entrance and exit based on nanoscopic driving behaviors. In Proceedings of the Eighth International Conference on Measuring Technology and Mechatronics Automation, Macau, China, 11–12 March 2016; pp. 386–392. [Google Scholar]
- Clarke, D.D.; Ward, P.; Bartle, C.; Truman, W. Young driver accidents in the UK: The influence of age, experience, and time of day. Accid. Anal. Prev. 2006, 38, 871–878. [Google Scholar] [CrossRef] [PubMed]
- Williams, A.F. Teenage drivers: Patterns of risk. J. Saf. Res. 2003, 34, 5–15. [Google Scholar] [CrossRef]
- Owens, D.A. Twilight vision and road safety: Seeing more than we notice but less than we think. In Visual Perception: The Influence of H. W. Leibowitz, Apa Symposium; American Psychological Association: Washington, DC, USA, 2013; pp. 157–180. ISBN 1-55798-945-1. [Google Scholar]
- Plainis, S.; Murray, I.J. Reaction times as an index of visual conspicuity when driving at night. Ophthalmic Physiol. Opt. 2002, 22, 409–415. [Google Scholar] [CrossRef] [PubMed]
- Akkil, D.; Isokoski, P. Accuracy of interpreting pointing gestures in egocentric view. In Proceedings of the 2016 ACM International Joint Conference on Pervasive and Ubiquitous Computing, Heidelberg, Germany, 12–16 September 2016; pp. 262–273. [Google Scholar]
- Braunagel, C.; Rosenstiel, W.; Kasneci, E. Ready for take-over? A new driver assistance system for an automated classification of driver take-over readiness. IEEE Intell. Transp. Syst. Mag. 2017, 9, 10–22. [Google Scholar] [CrossRef]
- Wibirama, S.; Nugroho, H.A. Towards understanding addiction factors of mobile devices: An eye tracking study on effect of screen size. In Proceedings of the Annual International Conference of the IEEE Engineering in Medicine and Biology Society, EMBS, Seogwipo, South Korea, 11–15 July 2017; pp. 2454–2457. [Google Scholar]
- Kasneci, E.; Sippel, K.; Aehling, K.; Heister, M.; Rosenstiel, W.; Schiefer, U.; Papageorgiou, E. Driving with binocular visual field loss? A study on a supervised on-road parcours with simultaneous eye and head tracking. PLoS ONE 2014, 9, e87470. [Google Scholar] [CrossRef] [PubMed]
- Shi, L.D. Study on the Driver’s Eye Movement Fixation Characteristics at Highway Super Long Tunnel Section. Master’s Thesis, Chang’an University, Xi’an, China, 2011. [Google Scholar]
- Zhao, W.H.; Wang, L.H.; Liu, H.X. Variation of drivers’ visual features in expressway tunnel entrance. J. Wuhan Univ. Technol. 2013, 37, 261–265. (In Chinese) [Google Scholar]
- Spijkers, W. Distribution of eye-fixations driving—Effects of road characteristics and driving speed as assessed by two eye-movements registration devices. Iatss Res. 1992, 16, 27–34. [Google Scholar]
- Jacob, R.J.K.; Karn, K.S. Eye tracking in human-computer interaction and usability research: Ready to deliver the promises. Mind 2003, 2, 573–605. [Google Scholar]
- Yuan, W. Study on Drivers’ Dynamic Visual Characteristics Experiments of Urban Road Environment. Ph.D. Thesis, Chang’an University, Xi’an, China, 2008. [Google Scholar]
- Fuhl, W.; Tonsen, M.; Bulling, A.; Kasneci, E. Pupil detection for head-mounted eye tracking in the wild: An evaluation of the state of the art. Mach. Vis. Appl. 2016, 27, 1275–1288. [Google Scholar] [CrossRef]
- Qiao, F.Y. Research on Driver’s Visual Characteristics and Heart Rate on Expressway Tunnel Section. Master’s Thesis, Jilin University, Changchun, China, 2012. [Google Scholar]
- Kasneci, E.; Kübler, T.; Broelemann, K.; Kasneci, G. Aggregating physiological and eye tracking signals to predict perception in the absence of ground truth. Comput. Hum. Behav. 2017, 68, 450–455. [Google Scholar] [CrossRef]
- Kübler, T.C.; Kasneci, E.; Vintila, F. Pupil response as an indicator of hazard perception during simulator driving. J. Eye Mov. Res. 2017, 10, 1–9. [Google Scholar] [CrossRef]
- Jukka, H.; Jorma, T.; AnnaMari, A. Pupil dilation as a measure of processing load in simultaneous interpretation and other language tasks. Q. J. Exp. Psychol. Hum. Exp. Psychol. 1995, 48, 598. [Google Scholar]
- Wickens, C.D.; Hollands, J.G. Engineering Psychology and Human Performance; Prentice-Hall: Englewood Cliffs, NJ, USA, 1999. [Google Scholar]
- Ahlstrom, C.; Nyström, M.; Holmqvist, K.; Fors, C.; Sandberg, D.; Anund, A.; Kecklund, G.; Åkerstedt, T. Fit-for-duty test for estimation of drivers’ sleepiness level: Eye movements improve the sleep/wake predictor. Transp. Res. Part C Emerg. Technol. 2013, 26, 20–32. [Google Scholar] [CrossRef]
- Di Stasi, L.L.; Marchitto, M.; Antolí, A.; Cañas, J.J. Saccadic peak velocity as an alternative index of operator attention: A short review. Revue Europeenne De Psychologie Appliquee 2013, 63, 335–343. [Google Scholar] [CrossRef]
- Hess, E.H.; Polt, J.M. Pupil size in relation to mental activity during simple problem-solving. Science 1964, 143, 1190–1192. [Google Scholar] [CrossRef] [PubMed]
- Ahern, S.; Beatty, J. Pupillary responses during information processing vary with scholastic aptitude test scores. Science 1979, 205, 1289–1292. [Google Scholar] [CrossRef] [PubMed]
- Steinhauer, S.R.; Condray, R.; Kasparek, A. Cognitive modulation of midbrain function: Task-induced reduction of the pupillary light reflex. Int. J. Psychophysiol. 2000, 39, 21–30. [Google Scholar] [CrossRef]
- Brisson, J.; Mainville, M.; Mailloux, D.; Beaulieu, C.; Serres, J.; Sirois, S. Pupil diameter measurement errors as a function of gaze direction in corneal reflection eyetrackers. Behav. Res. Methods 2013, 45, 1322–1331. [Google Scholar] [CrossRef] [PubMed]
- Pfleging, B.; Fekety, D.A.; Schmidt, A.; Kun, L.A. A Model relating pupil diameter to mental workload and lighting conditions. In Proceedings of the 2016 CHI Conference on Human Factors in Computing Systems, San Jose, CA, USA, 7–12 May 2016. [Google Scholar]
- Benjamini, Y.; Hochberg, Y. Controlling the false discovery rate: A practical and powerful approach to multiple testing. J. R. Stat. Soc. Ser. B 1995, 57, 289–300. [Google Scholar]
- Wang, H. Study on the Driver’s Eye Movement Characteristics at Freeway Long Tunnel Section. Master’s Thesis, Chang’an University, Xi’an, China, 2010. [Google Scholar]
- Yan, Y.; Wang, X.F.; Shi, L.D.; Liu, H.X. Influence of light zones on drivers’ visual fixation characteristics and traffic safety in extra-long tunnels. Traffic Inj. Prev. 2016, 18, 102–110. [Google Scholar] [CrossRef] [PubMed]
- Fitts, P.M.; Jones, R.E.; Milton, J.L. Eye movements of aircraft pilots during instrument-landing approaches. Aeronaut. Eng. Rev. 1950, 9, 24–29. [Google Scholar]
- Goldberg, J.H.; Kotval, X.P. Eye movement-based evaluation of the computer interface. In Advances in Occupational Ergonomics and Safety; Kumar, S., Ed.; ISO Press: Amsterdam, The Netherlands, 1998; pp. 529–532. [Google Scholar]
- She, H.C.; Chen, Y.Z. The impact of multimedia effect on science learning: Evidence from eye movements. Comput Educ. 2009, 53, 1297–1307. [Google Scholar] [CrossRef]
- Underwood, G.; Crundall, D.; Chapman, P. Driving simulator validation with hazard perception. Transp. Res. Part F Traffic Psychol. Behav. 2011, 14, 435–446. [Google Scholar] [CrossRef]
- Marquart, G.; Cabrall, C.; Winter, J.D. Review of eye-related measures of drivers’ mental workload. Procedia Manuf. 2015, 3, 2854–2861. [Google Scholar] [CrossRef]
- Recarte, M.A.; Nunes, L.M. Effects of verbal and spatial-imagery task on eye fixations while driving. J. Exp. Psychol. Appl. 2000, 6, 31–43. [Google Scholar] [CrossRef] [PubMed]
- Reimer, B.; Mehler, B.; Wang, Y.; Coughlin, J. The impact of systematic variation of cognitive demand on drivers’ visual attention across multiple age groups. In Proceedings of the Human Factors and Ergonomics Society 54th Annual Meeting, San Francisco, CA, USA, 27 September–1 October 2010; pp. 2052–2055. [Google Scholar]
- May, J.; Kennedy, R.; Williams, M.; Dunlap, W.; Brannan, J. Eye movement indices of mental workload. Acta Psychol. 1990, 75, 75–89. [Google Scholar] [CrossRef]
- Swanston, M.T.; Walley, C.E. Factors affecting the speed of acquisition of tabulated information from visual displays. Ergonomics 1984, 27, 321–330. [Google Scholar] [CrossRef] [PubMed]
- Liu, H.X.; Ding, G.M.; Zhao, W.H.; Wang, H.; Liu, K.Z.; Shi, L.D. Variation of drivers’ visual features in long-tunnel entrance section on expressway. J. Transp. Saf. Secur. 2011, 3, 27–37. [Google Scholar] [CrossRef]


| Participant | Gender | Age | Type of Driver License | Driving Experience (Years) |
|---|---|---|---|---|
| A | male | 36 | A | 14 |
| B | male | 37 | A | 12 |
| C | male | 39 | A | 16 |
| D | male | 58 | A | 32 |
| E | male | 32 | A | 13 |
| F | male | 35 | A | 12 |
| Measure | Speed | Distance | Daytime PZ | Nighttime PZ | Daytime AFD | Nighttime AFD | Daytime MNF | Nighttime MNF |
|---|---|---|---|---|---|---|---|---|
| Speed | 1 | / | −0.960 p = 0.054 | −0.997 p = 0.123 | −0.893 p = 0.111 | −0.957 p = 0.419 | −0.946 p = 0.062 | −0.990 p = 0.177 |
| Distance | / | 1 | 0.878 * p = 0.027 | −0.649 p = 0.170 | 0.943 ** p = 0.000 | −0.344 p = 0.736 | −0.946 ** p = 0.000 | −0.380 p = 0.562 |
| Daytime PZ | −0.960 p = 0.054 | 0.878 * p = 0.027 | 1 | −0.234 p = 0.736 | 0.691 p = 0.131 | −0.465 p = 0.419 | −0.736 p = 0.111 | −0.282 p = 0.672 |
| Nighttime PZ | −0.997 p = 0.123 | −0.649 p = 0.170 | −0.234 p = 0.736 | 1 | −0.807 p = 0.062 | −0.214 p = 0.736 | 0.784 p = 0.071 | 0.202 p = 0.736 |
| Daytime AFD | −0.893 p = 0.111 | 0.943 ** p = 0.000 | 0.691 p = 0.131 | −0.807 p = 0.062 | 1 | 0.050 p = 0.964 | −0.978 ** p = 0.000 | −0.346 p = 0.591 |
| Nighttime AFD | −0.957 p = 0.419 | −0.344 p = 0.736 | −0.465 p = 0.419 | −0.214 p = 0.736 | 0.050 p = 0.964 | 1 | 0.033 p = 0.964 | −0.019 p = 0.964 |
| Daytime MNF | −0.946 p = 0.062 | −0.946 ** p = 0.000 | −0.736 p = 0.111 | 0.784 p = 0.071 | −0.978 ** p = 0.000 | 0.033 p = 0.964 | 1 | 0.336 p = 0.591 |
| Nighttime MNF | −0.990 p = 0.177 | −0.380 p = 0.562 | −0.282 p = 0.672 | 0.202 p = 0.736 | −0.346 p = 0.591 | −0.019 p = 0.964 | 0.336 p = 0.591 | 1 |
© 2018 by the authors. Licensee MDPI, Basel, Switzerland. This article is an open access article distributed under the terms and conditions of the Creative Commons Attribution (CC BY) license (http://creativecommons.org/licenses/by/4.0/).
Share and Cite
Qin, L.; Dong, L.-L.; Xu, W.-H.; Zhang, L.-D.; Leon, A.S. Influence of Vehicle Speed on the Characteristics of Driver’s Eye Movement at a Highway Tunnel Entrance during Day and Night Conditions: A Pilot Study. Int. J. Environ. Res. Public Health 2018, 15, 656. https://doi.org/10.3390/ijerph15040656
Qin L, Dong L-L, Xu W-H, Zhang L-D, Leon AS. Influence of Vehicle Speed on the Characteristics of Driver’s Eye Movement at a Highway Tunnel Entrance during Day and Night Conditions: A Pilot Study. International Journal of Environmental Research and Public Health. 2018; 15(4):656. https://doi.org/10.3390/ijerph15040656
Chicago/Turabian StyleQin, Li, Li-Li Dong, Wen-Hai Xu, Li-Dong Zhang, and Arturo S. Leon. 2018. "Influence of Vehicle Speed on the Characteristics of Driver’s Eye Movement at a Highway Tunnel Entrance during Day and Night Conditions: A Pilot Study" International Journal of Environmental Research and Public Health 15, no. 4: 656. https://doi.org/10.3390/ijerph15040656