Red-Light-Running Crashes’ Classification, Comparison, and Risk Analysis Based on General Estimates System (GES) Crash Database


Abstract
:1. Introduction
2. Methodology
2.1. Crash Database
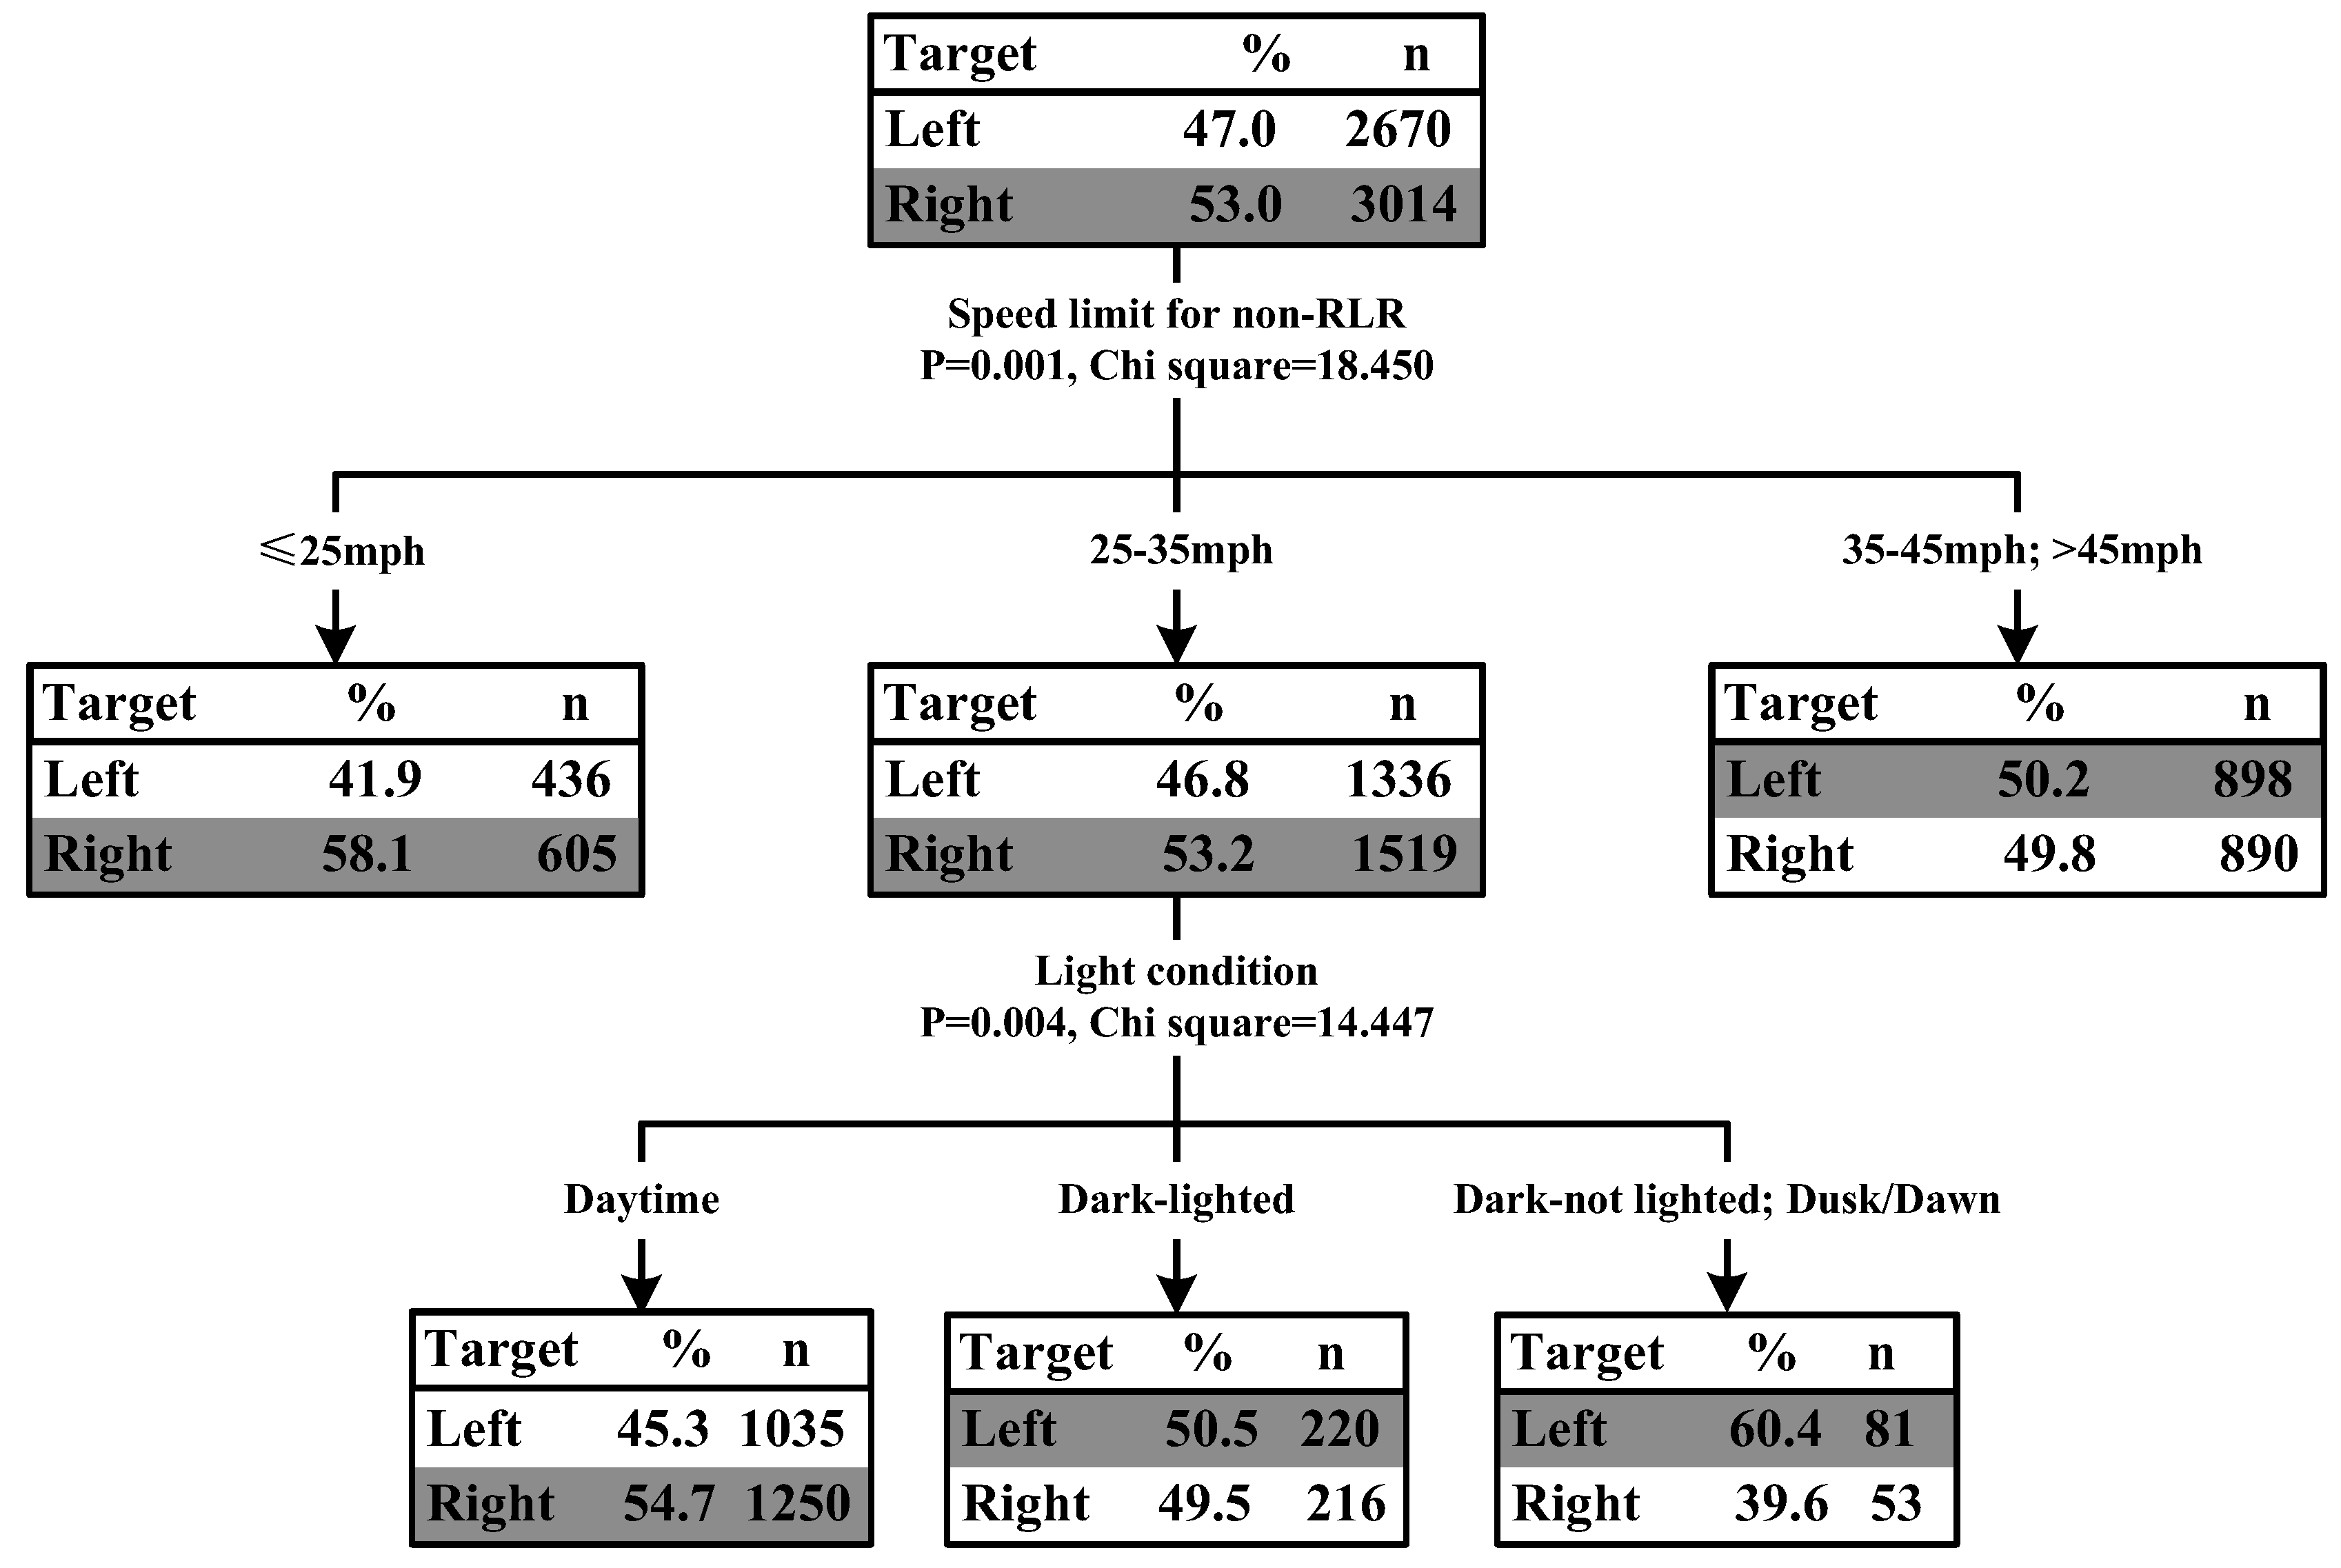
2.2. Crash Feature Comparisons for Each RLR Crash Types Based on Classification Tree Method
2.3. Comparison of GS and LT RLR Behavior Propensities Using the Quasi-Induced Exposure Technique
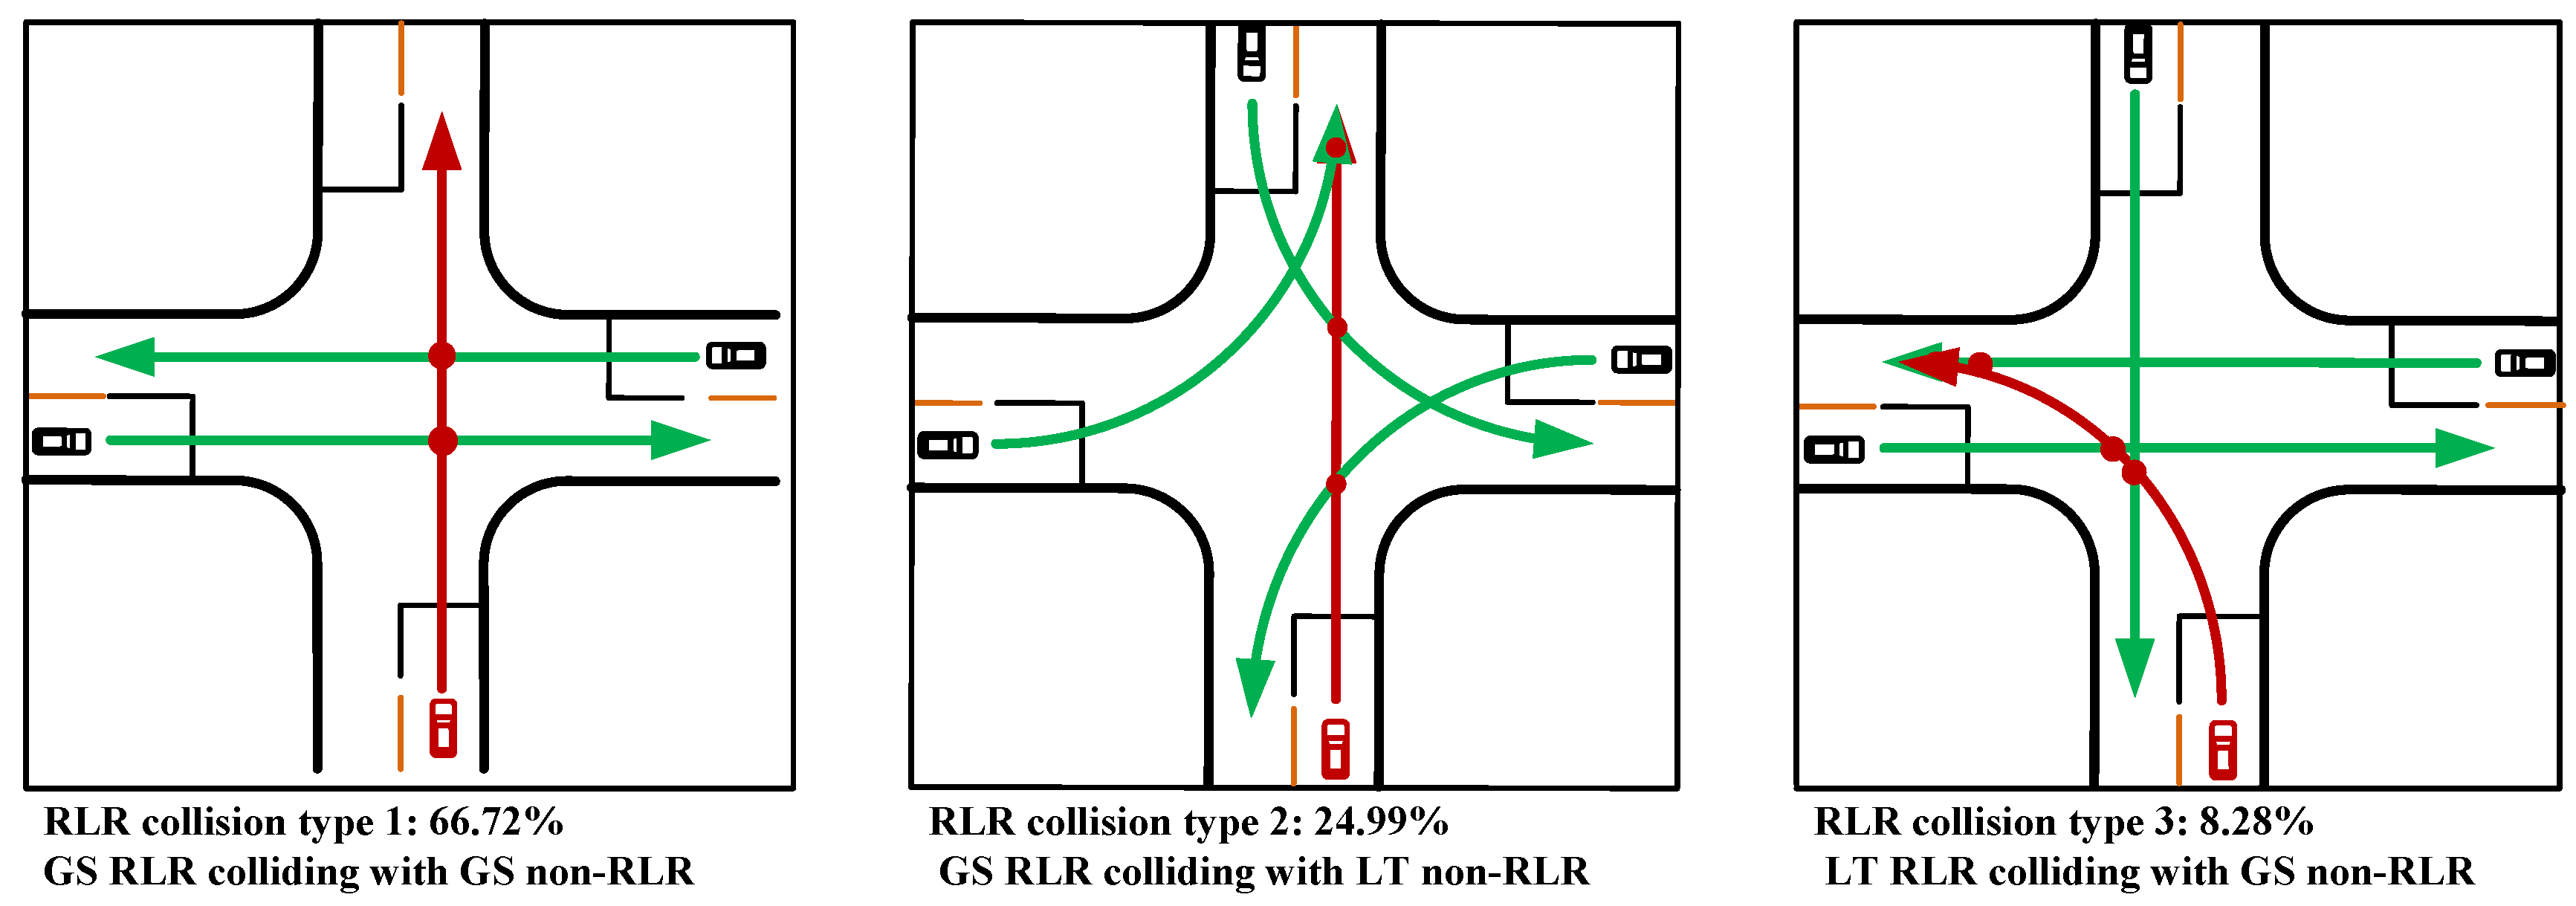
3. Analysis of RLR Crash Types Based on Classification Tree Models
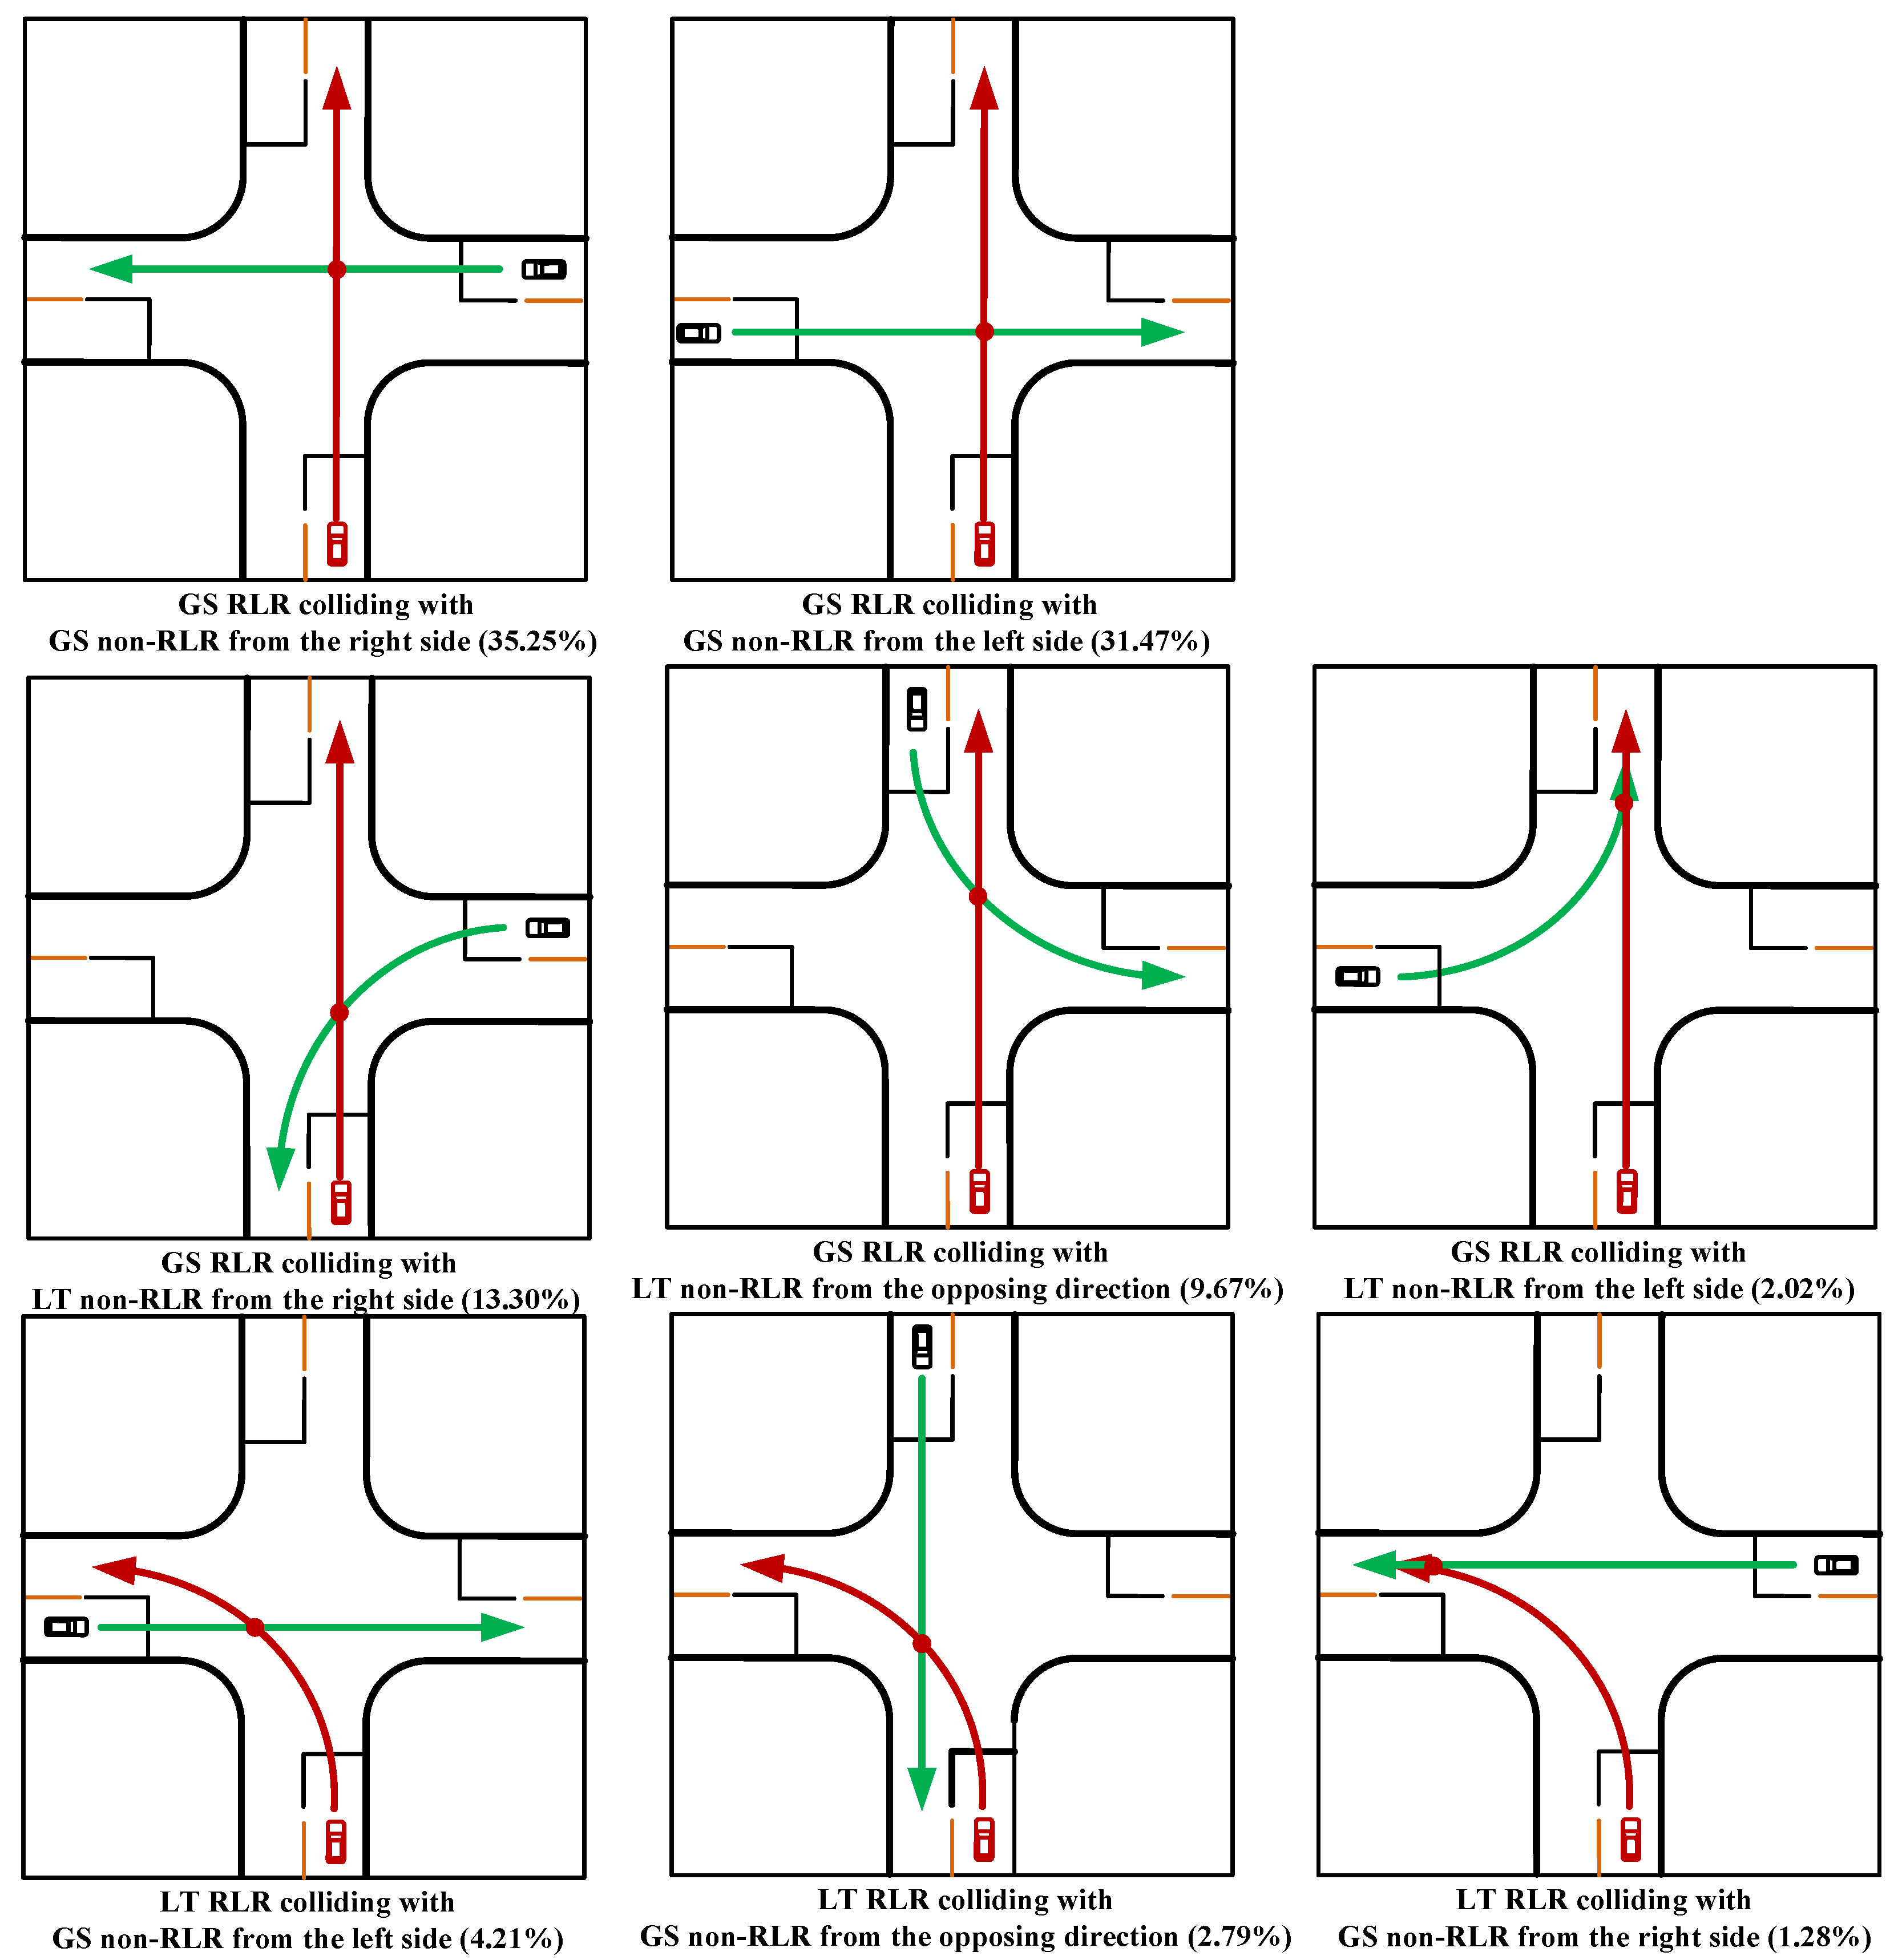
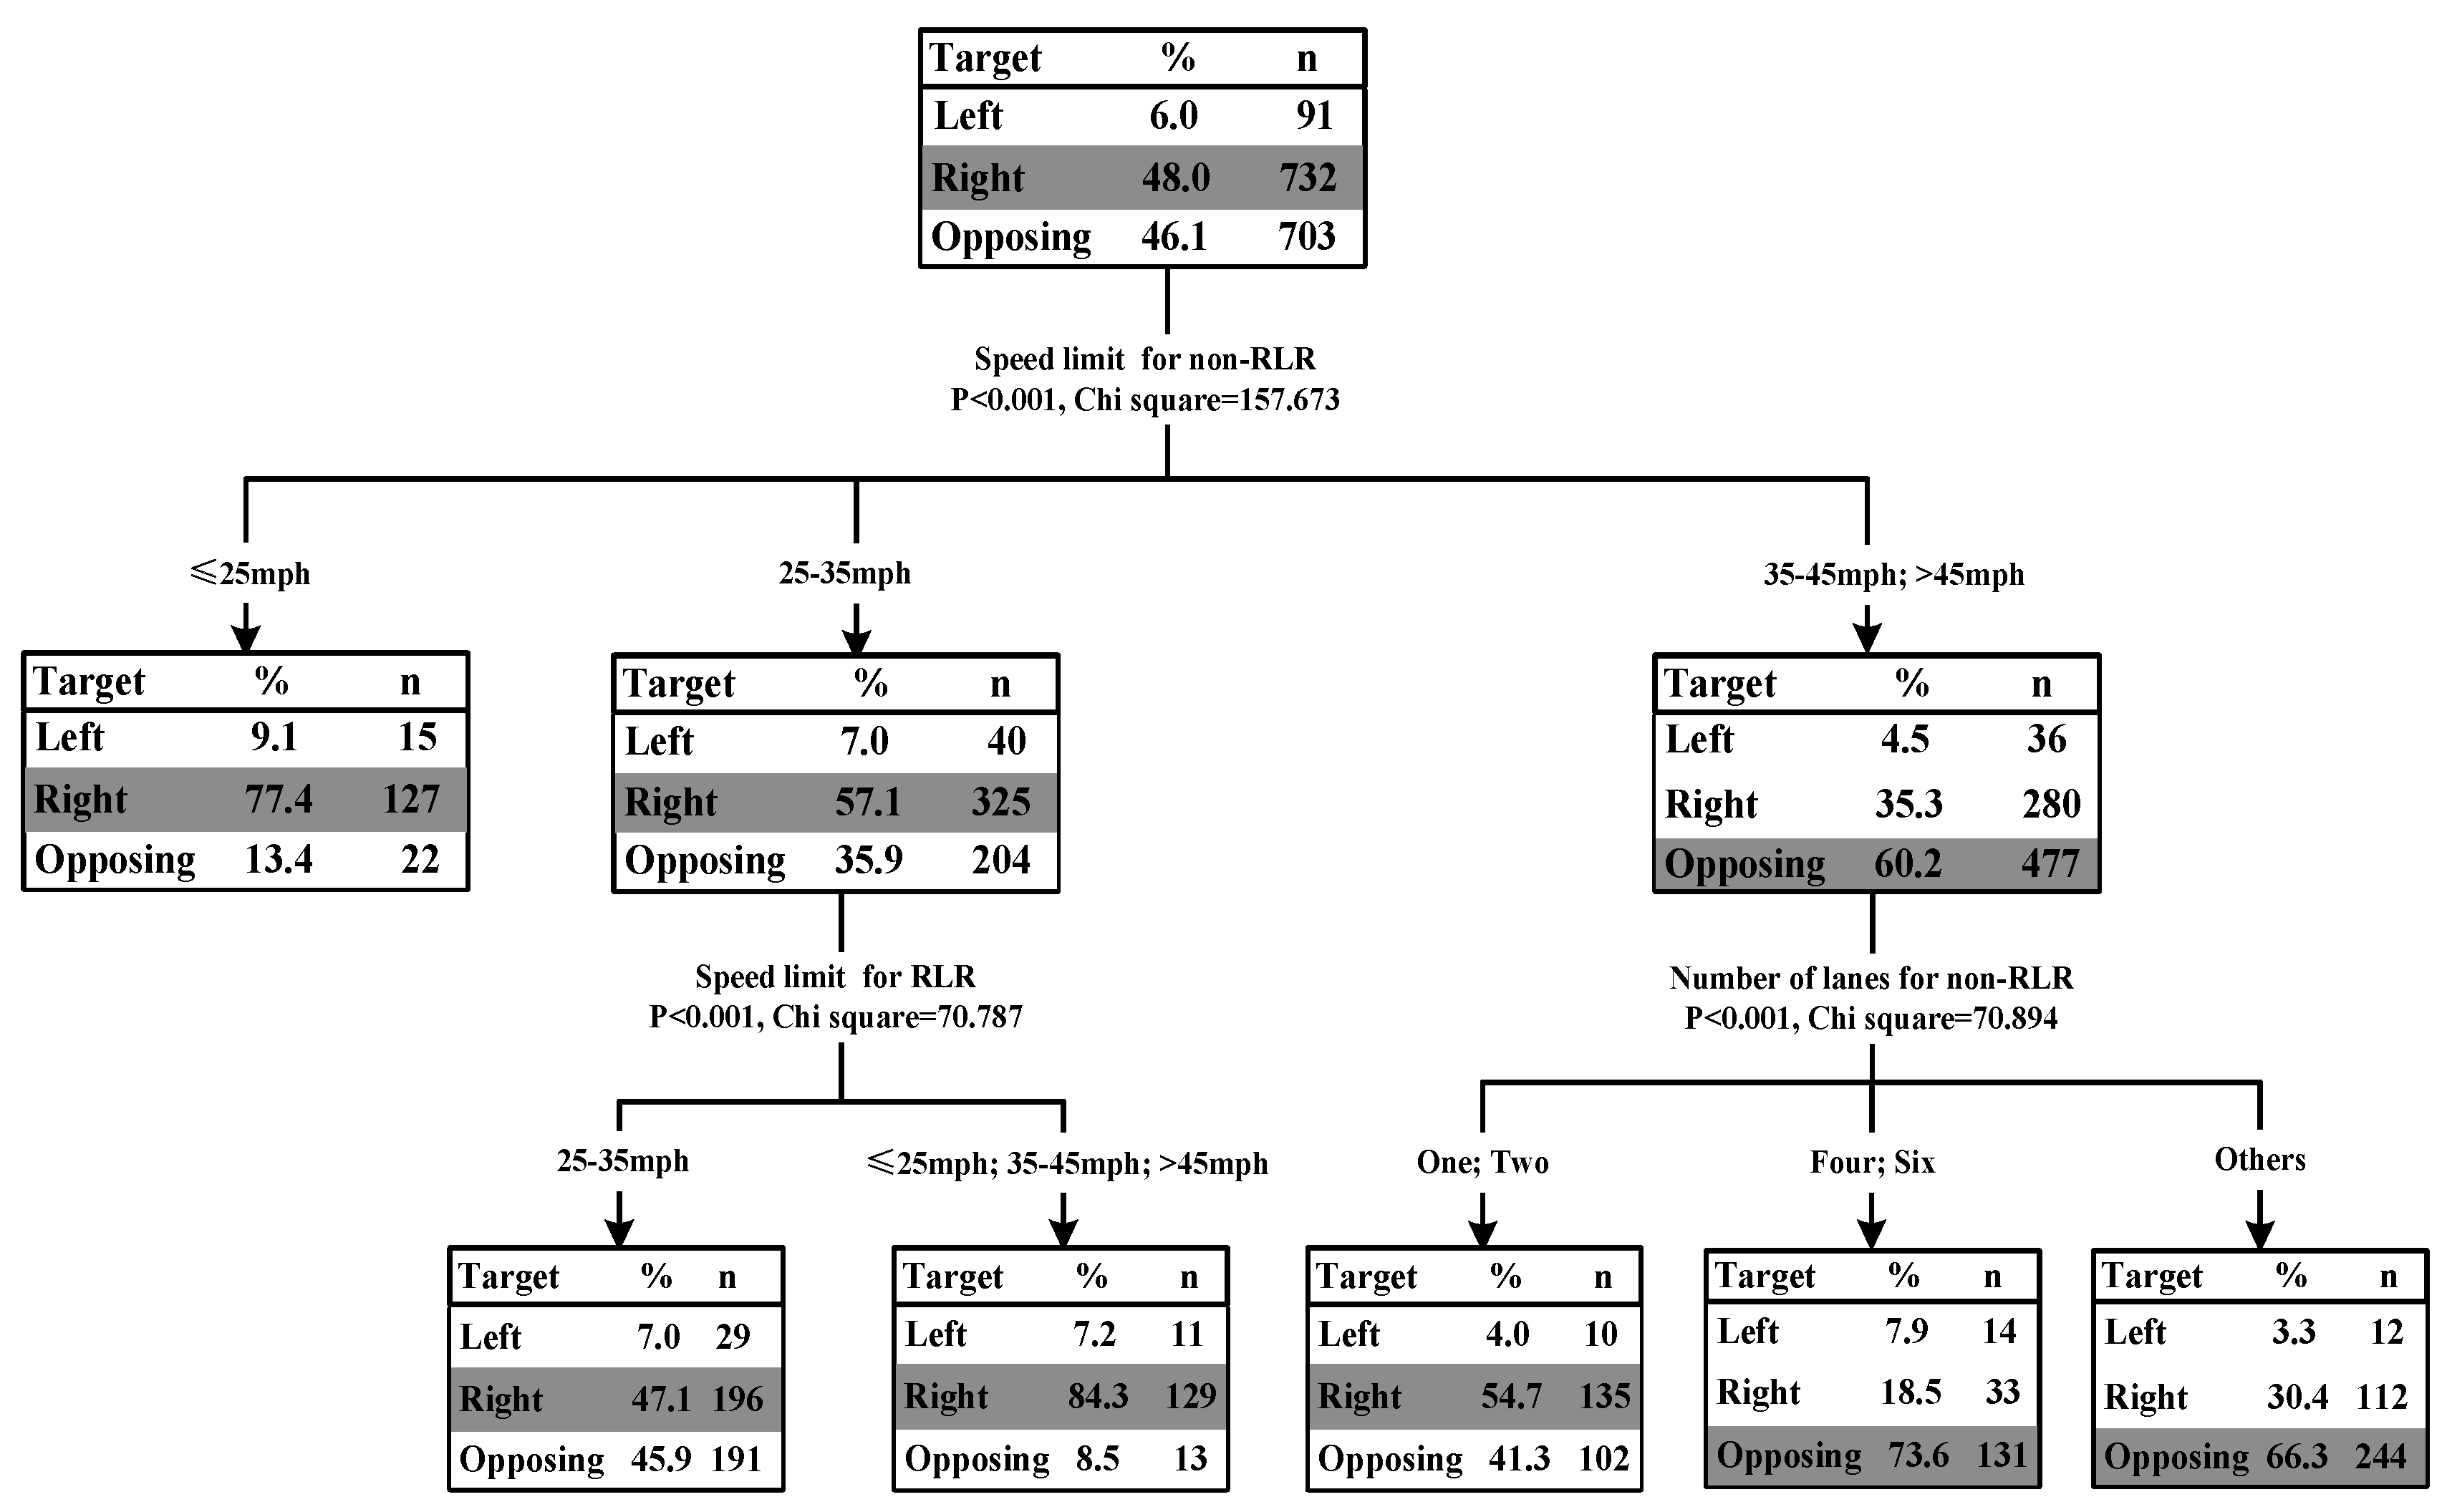
3.1. RLR Crash Type #1: GS RLR and GS Non-RLR
3.2. RLR Crash Type #2: GS RLR and LT Non-RLR
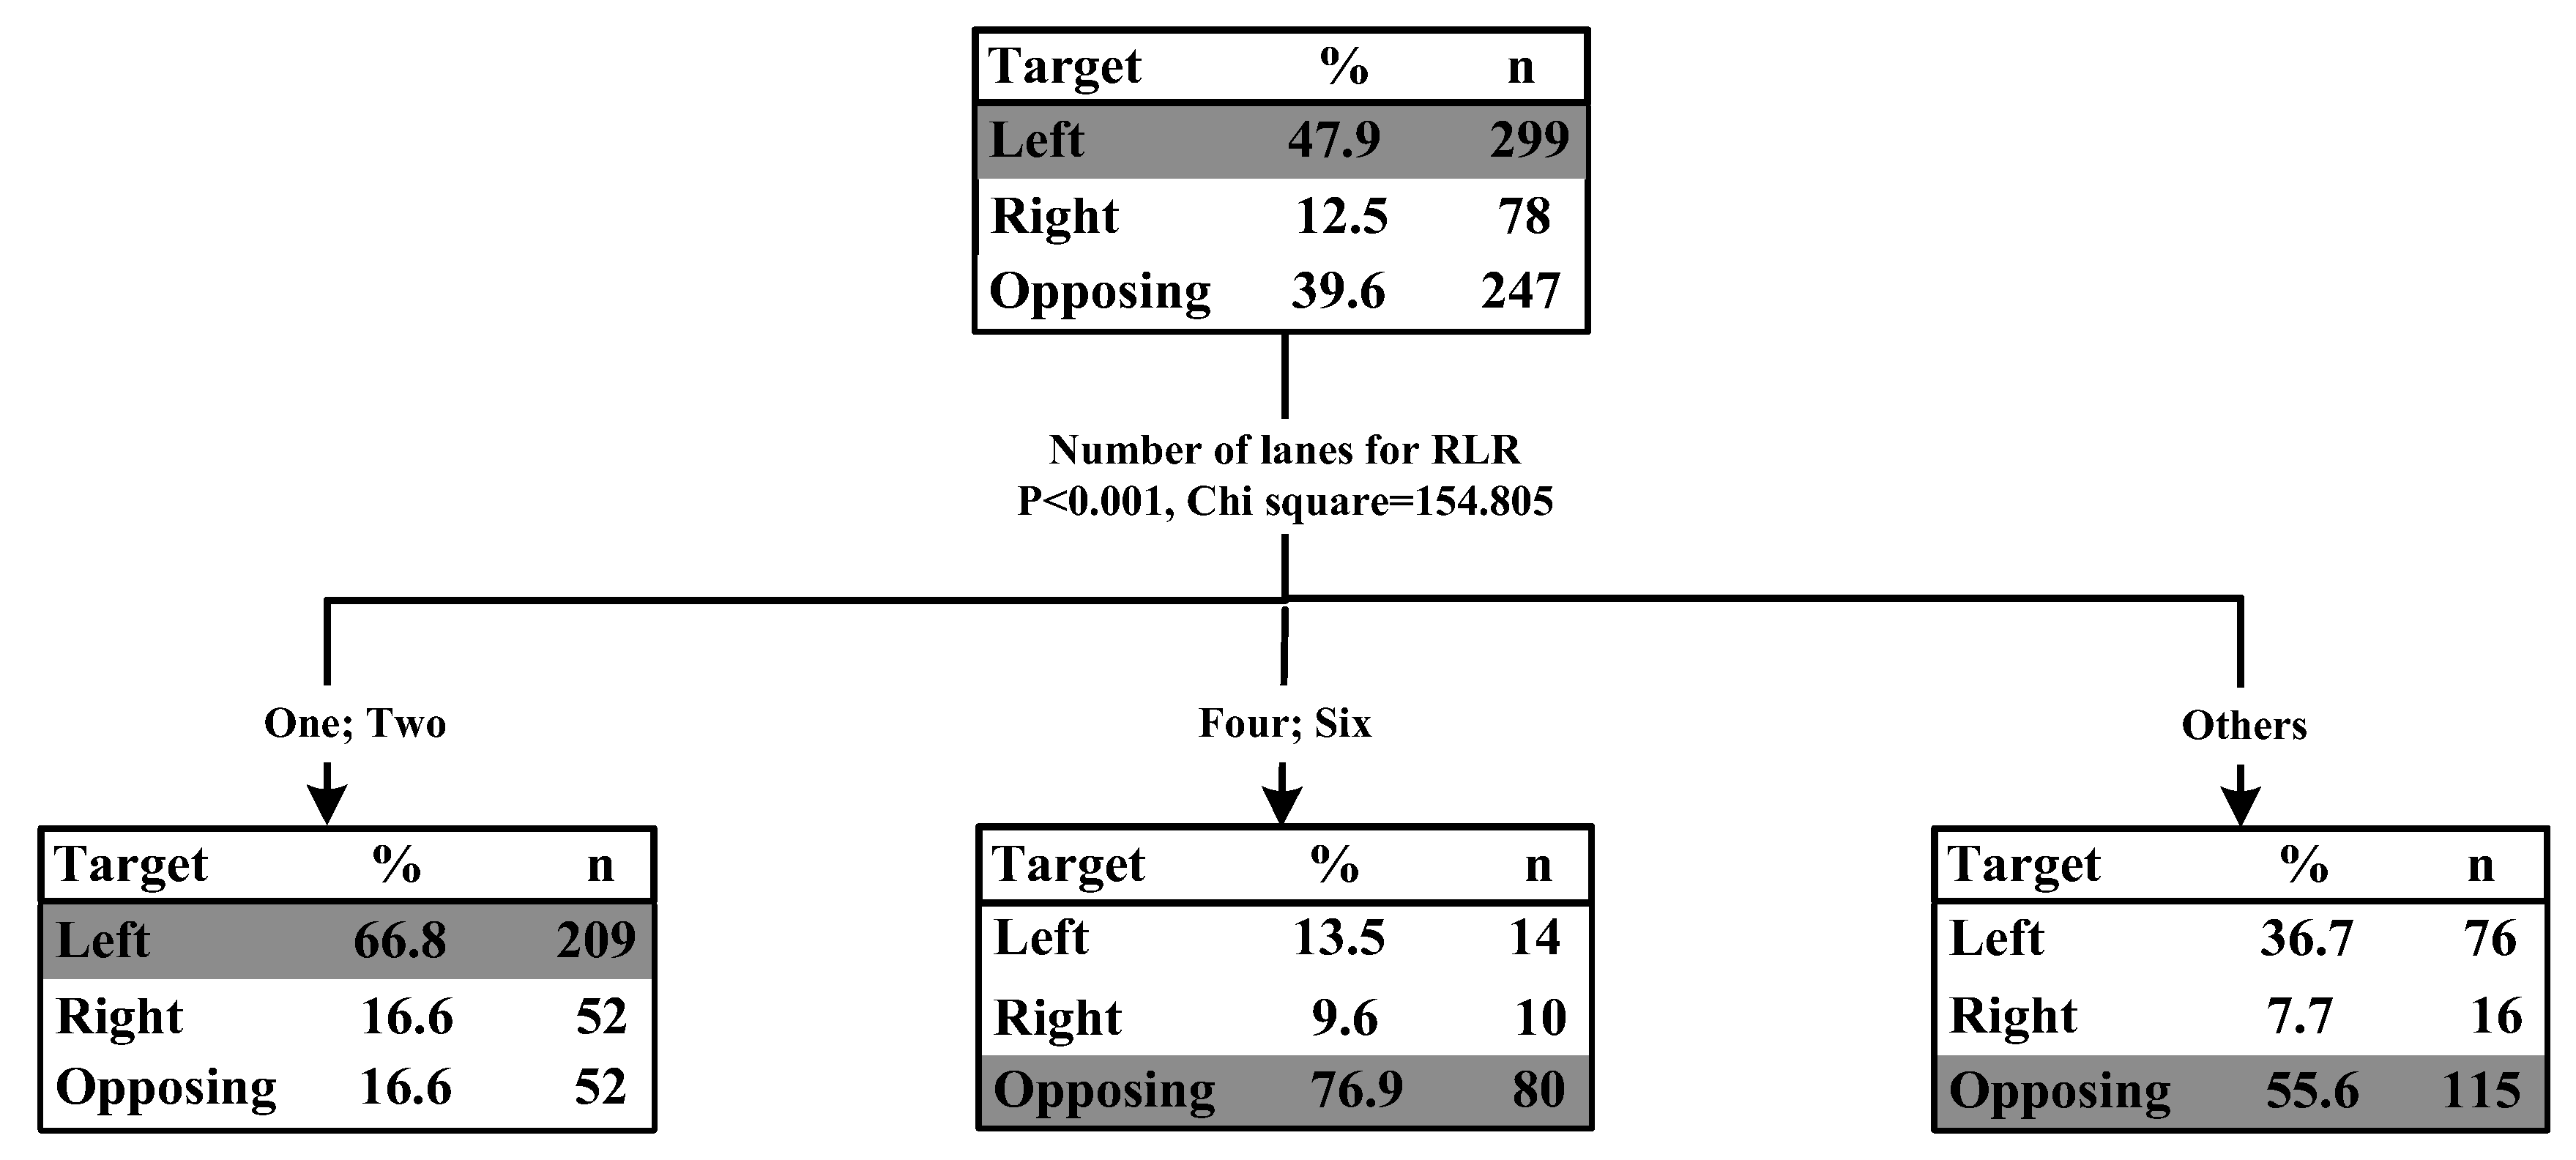
3.3. RLR Crash Type #3: LT RLR and GS Non-RLR
4. Results and Discussion of RLR Behavior Propensity Analysis
5. Conclusions
Author Contributions
Funding
Conflicts of Interest
References
- Baratian-Ghorghi, F.; Zhou, H.; Zech, W.C. Red-light running traffic violations: A novel time-based method for determining a fine structure. Transp. Res. Part A Policy Pract. 2016, 93, 55–65. [Google Scholar] [CrossRef]
- Young, K.L.; Salmon, P.M.; Lenné, M.G. At the cross-roads: An on-road examination of driving errors at intersections. Accid. Anal. Prev. 2013, 58, 226–234. [Google Scholar] [CrossRef] [PubMed]
- Polders, E.; Cornu, J.; De, C.T.; Daniels, S.; Brijs, K.; Brijs, T.; Hermans, E.; Wets, G. Drivers’ behavioral responses to combined speed and red light cameras. Accid. Anal. Prev. 2015, 81, 153–166. [Google Scholar] [CrossRef] [PubMed]
- Jahangiri, A.; Rakha, H.; Dingus, T.A. Red-light running violation prediction using observational and simulator data. Accid. Anal. Prev. 2016, 96, 316–328. [Google Scholar] [CrossRef] [PubMed]
- Ren, Y.; Wang, Y.; Wu, X.; Yu, G.; Ding, C. Influential factors of red-light running at signalized intersection and prediction using a rare events logistic regression model. Accid. Anal. Prev. 2016, 95, 266–273. [Google Scholar] [CrossRef] [PubMed]
- McCarthy, N. The Most Dangerous US Cities for Red-Light Running. 2015. Available online: https://www.statista.com/chart/3717/red-light-running (accessed on 12 August 2015).
- Kanitpong, K.; Jensupakarn, A.; Jensupakarn, P.; Jiwattanakulpaisarn, P. National Statistics of Traffic Accident in Thailand 2015; ThaiRoads Foundation: Bangkok, Thailand, 2015. [Google Scholar]
- Jensupakarn, A.; Kanitpong, K. Influences of motorcycle rider and driver characteristics and road environment on red light running behavior at signalized intersections. Accid. Anal. Prev. 2018, 113, 317–324. [Google Scholar] [CrossRef] [PubMed]
- Kweon, Y.J. Development of a Safety Evaluation Procedure for Identifying High-Risk Signalized Intersections in the Virginia Department of Transportation’s Northern Virginia District; Crash Rates; Virginia Transportation Research Council: Charlottesville, VA, USA, 2007. [Google Scholar]
- Wang, L.; Zhang, L.; Zhou, K.; Zhang, W.B.; Wang, X. Prediction of red-light running on basis of inductive-loop detectors for dynamic all-red extension. Transp. Res. Rec. J. Transp. Res. Board 2012, 2311, 44–50. [Google Scholar] [CrossRef]
- Xiang, W.; Yan, X.; Weng, J.; Li, X. Effect of auditory in-vehicle warning information on drivers’ brake response time to red-light running vehicles during collision avoidance. Transp. Res. Part F Traffic Psychol. Behav. 2016, 40, 56–67. [Google Scholar] [CrossRef]
- Porter, B.E.; Berry, T.D. A nationwide survey of self-reported red light running: Measuring prevalence, predictors, and perceived consequences. Accid. Anal. Prev. 2001, 33, 735–741. [Google Scholar] [CrossRef]
- Alomari, B.H.; Almasaeid, H.R. Red light violations at rural and suburban signalized intersections in Jordan. J. Crash Prev. Inj. Control 2003, 4, 169–172. [Google Scholar]
- Neale, V.L.; Perez, M.A.; Lee, S.E.; Stone, S.; Dingus, T.A. Intersection Decision Support: Evaluation of a Violation Warning System to Mitigate Straight Crossing Path Collisions; Virginia Center for Transportation Innovation & Research: Charlottesville, VA, USA, 2006. [Google Scholar]
- Retting, R.A.; Ferguson, S.A.; Farmer, C.M. Reducing red light running through longer yellow signal timing and red light camera enforcement: Results of a field investigation. Accid. Anal. Prev. 2008, 40, 327–333. [Google Scholar] [CrossRef] [PubMed]
- Bonneson, J.; Zimmerman, K.; Brewer, M. Engineering Countermeasures to Reduce Red-Light-Running; Countermeasures; Texas Transportation Institute, Texas A&M University System: College Station, TX, USA, 2002. [Google Scholar]
- Wang, X.; Yu, R.; Zhong, C. A field investigation of red-light-running in Shanghai, China. Transp. Res. Part F Traffic Psychol. Behav. 2016, 37, 144–153. [Google Scholar] [CrossRef]
- Porter, B.E.; England, K.J. Predicting red-light running behavior—A traffic safety study in three urban settings. J. Saf. Res. 2000, 31, 1–8. [Google Scholar] [CrossRef]
- Hill, S.E.; Lindly, J.K. Red Light Running Prediction and Analysis; Distance; UTCA Report, No. 02112; UTCA: Tuscaloosa, AL, USA, 2003. [Google Scholar]
- Chen, P.; Yu, G.; Wu, X.; Ren, Y.; Li, Y. Estimation of red-light running frequency using high-resolution traffic and signal data. Accid. Anal. Prev. 2017, 102, 235–247. [Google Scholar] [CrossRef] [PubMed]
- Yang, C.Y.D.; Najm, W.G. Analysis of Red Light Violation Data Collected from Intersections Equipped with Red Light Photo Enforcement Cameras; Human Factors; National Technical Information Service: Springfield, VA, USA, 2006. [Google Scholar]
- Mccartt, A.T.; Hu, W. Effects of red light camera enforcement on red light violations in Arlington county, Virginia. J. Saf. Res. 2014, 48, 57–62. [Google Scholar] [CrossRef] [PubMed]
- Dingus, T.A.; Klauer, S.G.; Neale, V.L.; Petersen, A.; Lee, S.E.; Sudweeks, J.; Perez, M.A.; Hankey, J.; Ramsey, D.J.; Gupta, S.; et al. The 100-Car Naturalistic Driving Study Phase II—Results of the 100-Car Field Experiment; Behavior; National Technical Information Service: Springfield, VA, USA, 2006. [Google Scholar]
- Caird, J.K.; Chisholm, S.L.; Edwards, C.J.; Creaser, J.I. The effect of yellow light onset time on older and younger drivers’ perception response time (PRT) and intersection behavior. Transp. Res. Part F Traffic Psychol. Behav. 2007, 10, 383–396. [Google Scholar] [CrossRef]
- Boyle, L.N.; Lee, J.D. Using driving simulators to assess driving safety. Accid. Anal. Prev. 2010, 42, 785–787. [Google Scholar] [CrossRef] [PubMed]
- Haque, M.M.; Ohlhauser, A.D.; Washington, S.; Boyle, L.N. Decisions and actions of distracted drivers at the onset of yellow lights. Accid. Anal. Prev. 2016, 96, 290–299. [Google Scholar] [CrossRef] [PubMed] [Green Version]
- Machiani, S.G.; Abbas, M. Assessment of driver stopping prediction models before and after the onset of yellow using two driving simulator datasets. Accid. Anal. Prev. 2015, 96, 308–315. [Google Scholar] [CrossRef] [PubMed]
- National Highway Traffic Safety Administration (NHTSA). General Estimates System (GES); US Department of Transportation: Washington, DC, USA, 2014. [Google Scholar]
- Harb, R.; Yan, X.; Radwan, E.; Su, X. Exploring precrash maneuvers using classification trees and random forests. Accid. Anal. Prev. 2009, 41, 98–107. [Google Scholar] [CrossRef] [PubMed]
- Stamatiadis, N.; Deacon, J.A. Trends in highway safety: Effects of an aging population on accident propensity. Accid. Anal. Prev. 1995, 27, 443–459. [Google Scholar] [CrossRef]
- Huang, H.; Chin, H.C. Disaggregate propensity study on red light running crashes using quasi-induced exposure method. J. Transp. Eng. 2009, 135, 104–111. [Google Scholar] [CrossRef]
- Hing, J.Y.; Stamatiadis, N.; Aultmanhall, L. Evaluating the impact of passengers on the safety of older drivers. J. Saf. Res. 2003, 34, 343–351. [Google Scholar] [CrossRef]
- Yan, X.; Radwan, E.; Birriel, E. Analysis of red light running crashes based on quasi-induced exposure and multiple logistic regression method. Transp. Res. Rec. J. Transp. Res. Board 2005, 1908, 70–79. [Google Scholar] [CrossRef]
- Murphy, T. A-pillar conflict visibility vs. roof crush. Ward’s Auto World, 1 August 2011. [Google Scholar]
- Fildes, B.N.; Fletcher, M.R.; Corrigan, J.M. Speed Perception 2: Driver’s Judgements of Safety and Travel Speed on Rural Curved Roads and at Night; Report CR60; Federal Office of Road Safety, Department of Transport and Communications: Canberra, Australia, 1989. [Google Scholar]
- Rifaat, S.M.; Chin, H.C. Analysis of Severity of Single-Vehicle Crashes in Singapore. In Proceedings of the 84th Annual Meeting of Transportation Research Board, Washington, DC, USA, 9–13 January 2005. [Google Scholar]
- Kockelman, K.M.; Kweon, Y.J. Driver injury severity: An application of ordered Probit models. Accid. Anal. Prev. 2002, 34, 313–321. [Google Scholar] [CrossRef]
- Huang, H.; Chin, H.C.; Haque, M.M. Severity of driver injury and vehicle damage in traffic crashes at intersections: A Bayesian hierarchical analysis. Accid. Anal. Prev. 2008, 40, 45–54. [Google Scholar] [CrossRef] [PubMed]
- Li, X.; Yan, X.; Wu, J.; Radwan, E.; Zhang, Y. A rear-end collision risk assessment model based on drivers’ collision avoidance process under influences of cell phone use and gender—A driving simulator based study. Accid. Anal. Prev. 2016, 97, 1–18. [Google Scholar] [CrossRef] [PubMed]
- Mccartt, A.T.; Hellinga, L.A.; Bratiman, K.A. Cell phones and driving: Review of research. Traffic Inj. Prev. 2006, 7, 89–106. [Google Scholar] [CrossRef] [PubMed]
- Hancock, P.A.; de Ridder, S.N. Behavioural accident avoidance science: Understanding response in collision incipient conditions. Ergonomics 2003, 46, 1111–1135. [Google Scholar] [CrossRef] [PubMed]
- Harb, R.; Radwan, E.; Yan, X.; Abdel-Aty, M. Light truck vehicles (LTVS) contribution to rear-end collisions. Accid. Anal. Prev. 2007, 39, 1026–1036. [Google Scholar] [CrossRef] [PubMed]
- Harb, R.; Radwan, E.; Yan, X. Larger size vehicles (LSVS) contribution to red light running, based on a driving simulator experiment. Transp. Res. Part F Traffic Psychol. Behav. 2007, 10, 229–241. [Google Scholar] [CrossRef]
- Doerzaph, Z.R.; Bhagavathula, R. Identification of Factors Related to Violation Propensity: Mining the Data of the Franklin Intersections; Virginia Tech Transportation Institute: Blacksburg, VA, USA, 2011. [Google Scholar]
- Yan, X.; Radwan, E.; Mannila, K.K.; Richards, S. Investigation of truck-involved angle crashes based on GES and FARS crash databases. Open Transp. J. 2009, 3, 52–62. [Google Scholar] [CrossRef]
- Wang, C.; Lu, L.; Lu, J.; Wang, T. Correlation between crash avoidance maneuvers and injury severity sustained by motorcyclists in single-vehicle crashes. J. Crash Prev. Inj. Control 2016, 17, 188–194. [Google Scholar] [CrossRef] [PubMed]


| Variables | Definition | Categorical Values |
|---|---|---|
| Age | Indicates drivers’ age at the time of the crash. Six groups are divided in this study. | <20 |
| 20–29 | ||
| 30–39 | ||
| 40–49 | ||
| 50–59 | ||
| ≥60 | ||
| Gender | Indicates the sex of drivers involved in the crash. | Male |
| Female | ||
| Alcohol or drug use | Indicates whether alcohol/drug use involved in crash. | No |
| Yes | ||
| Types of vehicle | Indicates a classification of vehicle based on its general configuration. | Car |
| Light vehicle | ||
| Heavy vehicle | ||
| Others | ||
| Number of lanes | Indicates the number of travel lanes. | One |
| Two | ||
| Four | ||
| Six | ||
| Others | ||
| Speed limit | Indicates posted speed limit in miles per hour. Four groups are divided in this study. | <25 mph |
| 25–35 mph | ||
| 36–45 mph | ||
| >45 mph | ||
| Speeding | Indicates whether the driver’s speed is larger than the posted speed limit. | No |
| Yes | ||
| Weather | Indicates the atmospheric conditions. Two groups are divided in this study. | Clear |
| Adverse | ||
| Light conditions | Indicates the type/level of light that exists at the time of the crash. | Daylight |
| Dark—Not lighted | ||
| Dark—Lighted | ||
| Dawn/Dusk | ||
| Distracted | Indicates whether the driver is distracted before the crash occurs. | No |
| Yes | ||
| Visibility obstruction | Indicates whether the driver’s vision is obstructed before the crash occurs. | No |
| Yes |
| Factors | GS Group | LT Group | ||||
|---|---|---|---|---|---|---|
| NON-RLR% | RLR% | RAIR | NON-RLR% | RLR% | RAIR | |
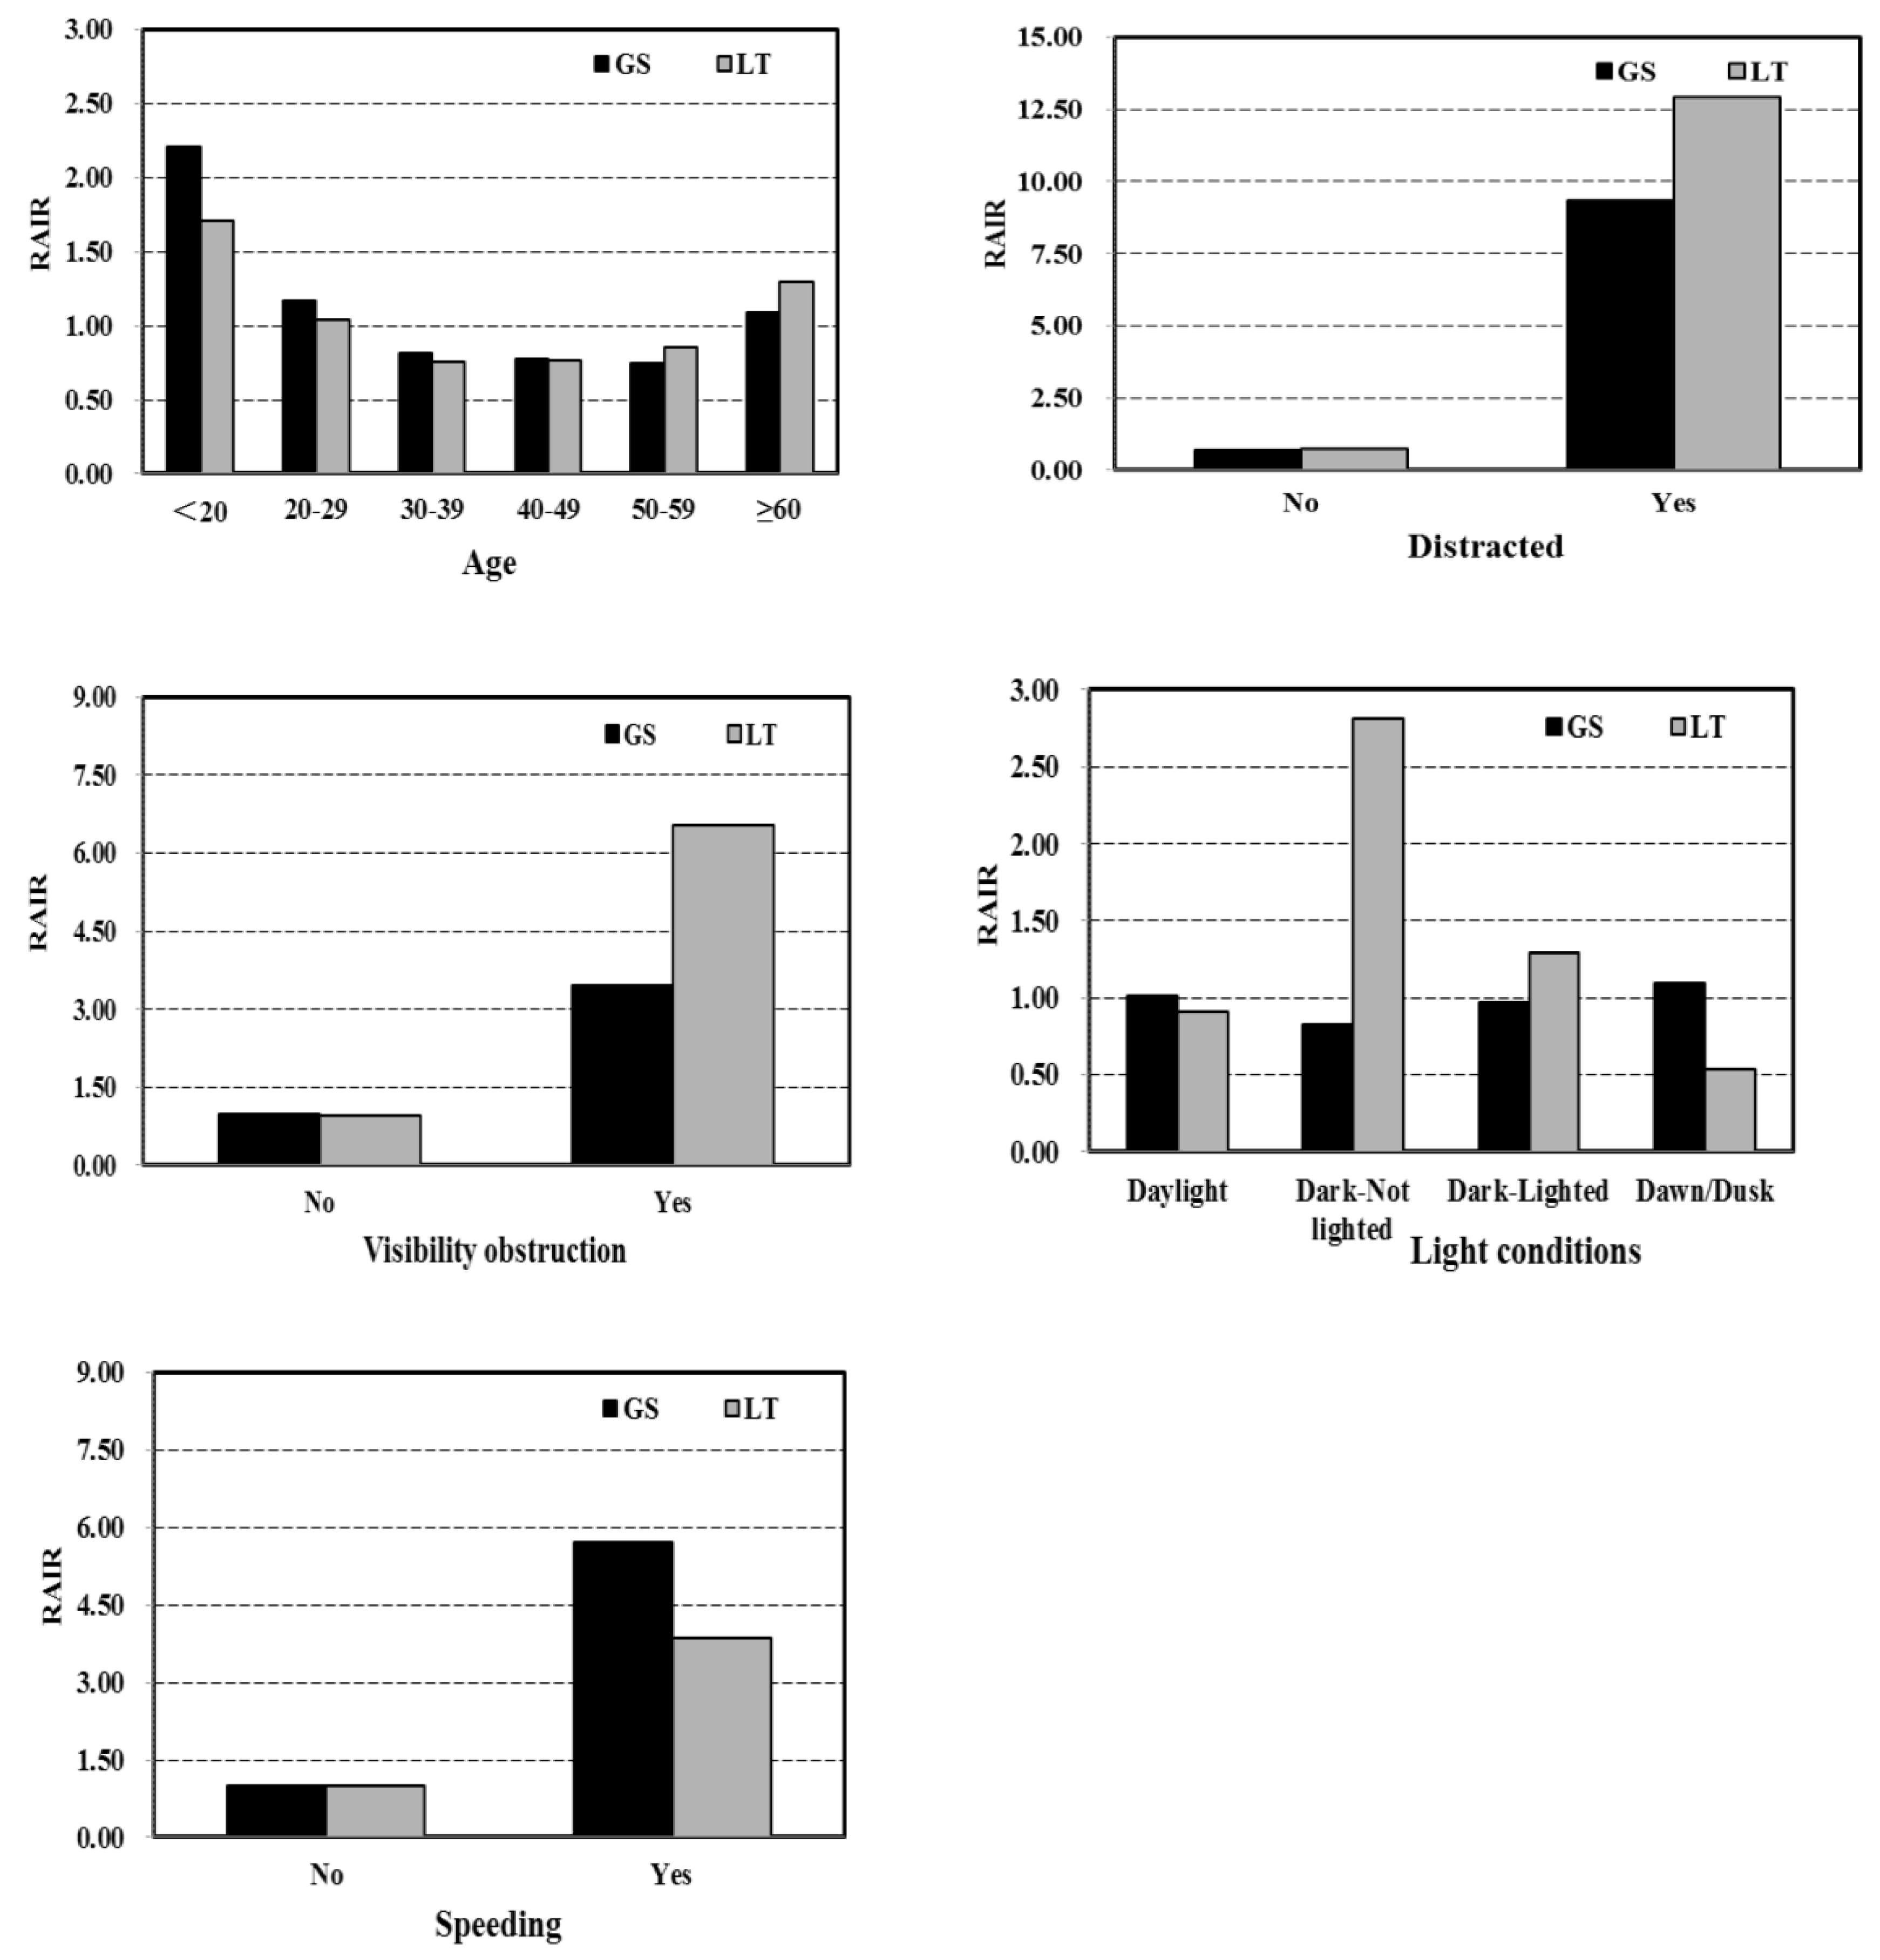
| Age | ||||||
| <20 | 6.26% | 13.82% | 2.209 | 8.57% | 14.61% | 1.705 |
| 20–29 | 21.52% | 25.07% | 1.165 | 20.86% | 21.77% | 1.044 |
| 30–39 | 19.79% | 16.15% | 0.816 | 18.90% | 14.21% | 0.752 |
| 40–49 | 19.89% | 15.35% | 0.772 | 20.00% | 15.31% | 0.765 |
| 50–59 | 16.66% | 12.33% | 0.740 | 15.66% | 13.42% | 0.857 |
| ≥60 | 15.89% | 17.27% | 1.086 | 16.01% | 20.68% | 1.292 |
| Distracted | ||||||
| No | 96.54% | 67.68% | 0.701 | 97.77% | 71.18% | 0.728 |
| Yes | 3.46% | 32.32% | 9.337 | 2.23% | 28.82% | 12.931 |
| Visibility obstruction | ||||||
| No | 98.80% | 95.86% | 0.970 | 98.89% | 92.72% | 0.938 |
| Yes | 1.20% | 4.14% | 3.457 | 1.11% | 7.28% | 6.547 |
| Light conditions | ||||||
| Daylight | 78.23% | 78.94% | 1.009 | 78.64% | 71.85% | 0.914 |
| Dark—Not lighted | 3.29% | 2.72% | 0.827 | 2.20% | 6.20% | 2.813 |
| Dark—Lighted | 15.51% | 15.08% | 0.972 | 15.46% | 19.98% | 1.292 |
| Dawn/Dusk | 2.97% | 3.27% | 1.098 | 3.70% | 1.97% | 0.533 |
| Speeding | ||||||
| No | 99.71% | 98.33% | 0.986 | 99.80% | 99.22% | 0.994 |
| Yes | 0.29% | 1.67% | 5.696 | 0.20% | 0.78% | 3.841 |
| Factors | df | GS Groups | LT Groups | ||||
|---|---|---|---|---|---|---|---|
| B | Sig. | Exp (B) | B | Sig. | Exp (B) | ||
| Age (<20) | 5 | --- | 0.000 | --- | --- | 0.024 | --- |
| Age (20–29) | 1 | −0.648 | 0.000 | 0.523 | −0.396 | 0.087 | 0.673 |
| Age (30–39) | 1 | −0.959 | 0.000 | 0.383 | −0.721 | 0.006 | 0.486 |
| Age (40–49) | 1 | −1.073 | 0.000 | 0.342 | −0.728 | 0.004 | 0.483 |
| Age (50–59) | 1 | −1.084 | 0.000 | 0.338 | −0.537 | 0.038 | 0.584 |
| Age (≥60) | 1 | −0.646 | 0.000 | 0.524 | −0.227 | 0.361 | 0.797 |
| Distracted (Yes) | 1 | 2.850 | 0.000 | 17.292 | 3.016 | 0.000 | 20.406 |
| Visibility obstruction (Yes) | 1 | 1.650 | 0.000 | 5.206 | 1.357 | 0.000 | 3.884 |
| Light conditions (Daylight) | 3 | --- | 0.009 | --- | --- | 0.000 | --- |
| Light conditions (Dark—Not lighted) | 1 | −0.261 | 0.069 | 0.770 | 1.254 | 0.000 | 3.505 |
| Light conditions (Dark—Lighted) | 1 | −0.198 | 0.004 | 0.821 | 0.528 | 0.002 | 1.695 |
| Light conditions (Dawn/Dusk) | 1 | 0.098 | 0.474 | 1.103 | −0.342 | 0.382 | 0.711 |
| Speeding (Yes) | 1 | 1.945 | 0.000 | 6.990 | 1.981 | 0.011 | 7.252 |
| Number of lanes (One) | 4 | --- | 0.000 | --- | --- | --- | --- |
| Number of lanes (Two) | 1 | 0.627 | 0.010 | 1.872 | --- | --- | --- |
| Number of lanes (Four) | 1 | 0.985 | 0.000 | 2.679 | --- | --- | --- |
| Number of lanes (Six) | 1 | 1.320 | 0.000 | 3.742 | --- | --- | --- |
| Number of lanes (Others) | 1 | 0.819 | 0.001 | 2.268 | --- | --- | --- |
| Speed limit (≤25 mph) | 3 | --- | 0.000 | --- | --- | ||
| Speed limit (25–35 mph) | 1 | 0.164 | 0.034 | 1.178 | --- | --- | --- |
| Speed limit (35–45 mph) | 1 | 0.387 | 0.000 | 1.473 | --- | --- | --- |
| Speed limit (>45 mph) | 1 | 0.201 | 0.058 | 1.223 | --- | --- | --- |
| Vehicle types (Car) | 3 | --- | --- | --- | --- | 0.023 | --- |
| Vehicle types (Light vehicle) | 1 | --- | --- | --- | −0.192 | 0.281 | 0.826 |
| Vehicle types (Heavy vehicle) | 1 | --- | --- | --- | 0.599 | 0.012 | 1.820 |
| Vehicle types (Others) | 1 | --- | --- | --- | −0.117 | 0.528 | 0.889 |
| Constants | 1 | −0.452 | 0.081 | 0.637 | −1.788 | 0.000 | 0.167 |
© 2018 by the authors. Licensee MDPI, Basel, Switzerland. This article is an open access article distributed under the terms and conditions of the Creative Commons Attribution (CC BY) license (http://creativecommons.org/licenses/by/4.0/).
Share and Cite
Zhang, Y.; Yan, X.; Li, X.; Wu, J.; Dixit, V.V. Red-Light-Running Crashes’ Classification, Comparison, and Risk Analysis Based on General Estimates System (GES) Crash Database. Int. J. Environ. Res. Public Health 2018, 15, 1290. https://doi.org/10.3390/ijerph15061290
Zhang Y, Yan X, Li X, Wu J, Dixit VV. Red-Light-Running Crashes’ Classification, Comparison, and Risk Analysis Based on General Estimates System (GES) Crash Database. International Journal of Environmental Research and Public Health. 2018; 15(6):1290. https://doi.org/10.3390/ijerph15061290
Chicago/Turabian StyleZhang, Yuting, Xuedong Yan, Xiaomeng Li, Jiawei Wu, and Vinayak V. Dixit. 2018. "Red-Light-Running Crashes’ Classification, Comparison, and Risk Analysis Based on General Estimates System (GES) Crash Database" International Journal of Environmental Research and Public Health 15, no. 6: 1290. https://doi.org/10.3390/ijerph15061290