Gender Differences in the Association between Serum Uric Acid and Prediabetes: A Six-Year Longitudinal Cohort Study


Abstract
:1. Introduction
2. Materials and Methods
2.1. Study Population
2.2. Definition of Prediabetes
2.3. Anthropology Measurements and Laboratory Measurements
2.4. Statistical Analysis
3. Results
4. Discussion
5. Conclusions
Supplementary Materials
Author Contributions
Funding
Conflicts of Interest
Abbreviations
| SUA | serum uric acid |
| GEE | generalized estimating equation |
| BHMC | Beijing Health Management Cohort |
| CVD | Cardiovascular disease |
| BMI | Body mass index |
| FPG | Fasting plasma glucose |
| TC | Total cholesterol |
| TG | Triglycerides |
| LDL | Low-density lipoprotein |
| HDL | High-density lipoprotein |
| WBC | White blood cell |
| RBC | Red blood cell |
| MCV | Erythrocyte mean corpuscular volume |
| RDW | Red blood cell distribution width |
| PLT | Platelet count |
| MPV | Mean platelet volume |
| PDW | Platelet distribution width |
| GGT | Gamma-glutamyl transferase |
| TBil | Total bilirubin |
| STP | Serum total protein |
| BUN | Blood urea nitrogen |
| CREA | Serum creatinine |
References
- GBD 2013 Risk Factors Collaborators. Global, regional, and national comparative risk assessment of 79 behavioural, environmental and occupational, and metabolic risks or clusters of risks in 188 countries, 1990–2013: A systematic analysis for the Global Burden of Disease Study 2013. Lancet 2015, 386, 2287–2323. [Google Scholar]
- Wang, L.; Gao, P.; Zhang, M.; Huang, Z.; Zhang, D.; Deng, Q.; Li, Y.; Zhao, Z.; Qin, X.; Jin, D.; et al. Prevalence and Ethnic Pattern of Diabetes and Prediabetes in China in 2013. JAMA 2017, 317, 2515–2523. [Google Scholar] [CrossRef] [PubMed]
- Tabak, A.G.; Herder, C.; Rathmann, W.; Brunner, E.J.; Kivimaki, M. Prediabetes: A high-risk state for diabetes development. Lancet 2012, 379, 2279–2290. [Google Scholar] [CrossRef]
- Li, G.; Zhang, P.; Wang, J.; Gregg, E.W.; Yang, W.; Gong, Q.; Li, H.; Li, H.; Jiang, Y.; An, Y.; et al. The long-term effect of lifestyle interventions to prevent diabetes in the China Da Qing Diabetes Prevention Study: A 20-year follow-up study. Lancet 2008, 371, 1783–1789. [Google Scholar] [CrossRef]
- Diabetes Prevention Program Research Group. Long-term effects of lifestyle intervention or metformin on diabetes development and microvascular complications over 15-year follow-up: The Diabetes Prevention Program Outcomes Study. Lancet Diabetes Endocrinol. 2015, 3, 866–875. [Google Scholar]
- Cha, S.A.; Lim, S.Y.; Kim, K.R.; Lee, E.Y.; Kang, B.; Choi, Y.H.; Yoon, K.H.; Ahn, Y.B.; Lee, J.H.; Ko, S.H. Community-based randomized controlled trial of diabetes prevention study for high-risk individuals of type 2 diabetes: Lifestyle intervention using web-based system. BMC Public Health 2017, 17, 387. [Google Scholar] [CrossRef] [PubMed]
- Chan, J.C.; Zhang, Y.; Ning, G. Diabetes in China: A societal solution for a personal challenge. Lancet Diabetes Endocrinol. 2014, 2, 969–979. [Google Scholar] [CrossRef]
- Lv, Q.; Meng, X.F.; He, F.F.; Chen, S.; Su, H.; Xiong, J.; Gao, P.; Tian, X.J.; Liu, J.S.; Zhu, Z.H.; et al. High serum uric acid and increased risk of type 2 diabetes: A systemic review and meta-analysis of prospective cohort studies. PLoS ONE 2013, 8, 56864. [Google Scholar] [CrossRef] [PubMed]
- Yamada, T.; Fukatsu, M.; Suzuki, S.; Wada, T.; Joh, T. Elevated serum uric acid predicts impaired fasting glucose and type 2 diabetes only among Japanese women undergoing health checkups. Diabetes Metab. 2011, 37, 252–258. [Google Scholar] [CrossRef] [PubMed]
- Liu, Y.; Jin, C.; Xing, A.; Liu, X.; Chen, S.; Li, D.; Feng, P.; Liu, J.; Li, Z.; Wu, S. Serum uric acid levels and the risk of impaired fasting glucose: A prospective study in adults of north China. PLoS ONE 2013, 8, 84712. [Google Scholar] [CrossRef] [PubMed]
- Jia, Z.; Zhang, X.; Kang, S.; Wu, Y. Serum uric acid levels and incidence of impaired fasting glucose and type 2 diabetes mellitus: A meta-analysis of cohort studies. Diabetes Res. Clin. Pract. 2013, 101, 88–96. [Google Scholar] [CrossRef] [PubMed]
- Zhao, M.; Lin, H.; Yuan, Y.; Wang, F.; Xi, Y.; Wen, L.M.; Shen, P.; Bu, S. Prevalence of Pre-Diabetes and Its Associated Risk Factors in Rural Areas of Ningbo, China. Int. J. Environ. Res. Public Health 2016, 13, 808. [Google Scholar] [CrossRef] [PubMed]
- Dagogo-Jack, S.; Edeoga, C.; Ebenibo, S.; Nyenwe, E.; Wan, J. Lack of racial disparity in incident prediabetes and glycemic progression among black and white offspring of parents with type 2 diabetes: The pathobiology of prediabetes in a biracial cohort (POP-ABC) study. J. Clin. Endocrinol. Metab. 2014, 99, 1078–1087. [Google Scholar] [CrossRef] [PubMed]
- Maiuolo, J.; Oppedisano, F.; Gratteri, S.; Muscoli, C.; Mollace, V. Regulation of uric acid metabolism and excretion. Int. J. Cardiol. 2016, 213, 8–14. [Google Scholar] [CrossRef] [PubMed]
- Caliceti, C.; Calabria, D.; Roda, A.; Cicero, A.F. Fructose Intake, Serum Uric Acid, and Cardiometabolic Disorders: A Critical Review. Nutrients 2017, 9, 395. [Google Scholar] [CrossRef] [PubMed]
- Hubbard, A.E.; Ahern, J.; Fleischer, N.L.; Van der Laan, M.; Lippman, S.A.; Jewell, N.; Bruckner, T.; Satariano, W.A. To GEE or not to GEE: Comparing population average and mixed models for estimating the associations between neighborhood risk factors and health. Epidemiology 2010, 21, 467–474. [Google Scholar] [CrossRef] [PubMed]
- Lee, J.H.; Herzog, T.A.; Meade, C.D.; Webb, M.S.; Brandon, T.H. The use of GEE for analyzing longitudinal binomial data: A primer using data from a tobacco intervention. Addict. Behav. 2007, 32, 187–193. [Google Scholar] [CrossRef] [PubMed]
- World Health Organization. Definition and Diagnosis of Diabetes Mellitus and Intermediate Hyperglycemia-Report of a WHO/IDF Consultation; World Health Organization: Geneva, Switzerland, 2006; ISBN 978-92-4-159493-6. [Google Scholar]
- Teerenstra, S.; Lu, B.; Preisser, J.S.; Achterberg, T.V.; Borm, G.F. Sample size considerations for GEE analyses of three-level cluster randomized trials. Biometrics 2010, 66, 1230–1237. [Google Scholar] [CrossRef] [PubMed]
- Van Der Schaft, N.; Brahimaj, A.; Wen, K.X.; Franco, O.H.; Dehghan, A. The association between serum uric acid and the incidence of prediabetes and type 2 diabetes mellitus: The Rotterdam Study. PLoS ONE 2017, 12, 0179482. [Google Scholar] [CrossRef] [PubMed]
- Tuttle, K.R.; Short, R.A.; Johnson, R.J. Sex differences in uric acid and risk factors for coronary artery disease. Am. J. Cardiol. 2001, 87, 1411–1414. [Google Scholar] [CrossRef]
- Hoieggen, A.; Alderman, M.H.; Kjeldsen, S.E.; Julius, S.; Devereux, R.B.; De Faire, U.; Fyhrquist, F.; Ibsen, H.; Kristianson, K.; Lederballe-Pedersen, O.; et al. The impact of serum uric acid on cardiovascular outcomes in the LIFE study. Kidney Int. 2004, 65, 1041–1049. [Google Scholar] [CrossRef] [PubMed] [Green Version]
- Krzystek-Korpacka, M.; Patryn, E.; Kustrzeba-Wojcicka, I.; Chrzanowska, J.; Gamian, A.; Noczynska, A. Gender-specific association of serum uric acid with metabolic syndrome and its components in juvenile obesity. Clin. Chem. Lab. Med. 2001, 49, 129–136. [Google Scholar] [CrossRef] [PubMed]
- Nie, G.; Wang, X.; Yang, H.; Ou, A. The research on the factors affecting the timing of natural menopause in Chinese city women. Matern. Child Health Care China 2001, 26, 1191–1193. [Google Scholar]
- Blenck, C.L.; Harvey, P.A.; Reckelhoff, J.F.; Leinwand, L.A. The Importance of Biological Sex and Estrogen in Rodent Models of Cardiovascular Health and Disease. Circ. Res. 2016, 118, 1294–1312. [Google Scholar] [CrossRef] [PubMed] [Green Version]
- Yahyaoui, R.; Esteva, I.; Haro-Mora, J.J.; Almaraz, M.C.; Morcillo, S.; Rojo-Martínez, G.; Martínez, J.; Gómez-Zumaquero, J.M.; González, I.; Hernando, V.; et al. Effect of long-term administration of cross-sex hormone therapy on serum and urinary uric acid in transsexual persons. J. Clin. Endocrinol. Metab. 2008, 93, 2230–2233. [Google Scholar] [CrossRef] [PubMed]
- Hak, A.E.; Choi, H.K. Menopause, postmenopausal hormone use and serum uric acid levels in US women—The Third National Health and Nutrition Examination Survey. Arthritis Res. Ther. 2008, 10, R116. [Google Scholar] [CrossRef] [PubMed]
- Simon, J.A.; Lin, F.; Vittinghoff, E.; Bittner, V. The relation of postmenopausal hormone therapy to serum uric acid and the risk of coronary heart disease events: The Heart and Estrogen-Progestin Replacement Study (HERS). Ann. Epidemiol. 2006, 16, 138–145. [Google Scholar] [CrossRef] [PubMed]
- Park, J.H.; Jin, Y.M.; Hwang, S.; Cho, D.H.; Kang, D.H.; Jo, I. Uric acid attenuates nitric oxide production by decreasing the interaction between endothelial nitric oxide synthase and calmodulin in human umbilical vein endothelial cells: A mechanism for uric acid-induced cardiovascular disease development. Nitric Oxide 2013, 32, 36–42. [Google Scholar] [CrossRef] [PubMed]
- Moreau, K.L.; Hildreth, K.L.; Meditz, A.L.; Deane, K.D.; Kohrt, W.M. Endothelial function is impaired across the stages of the menopause transition in healthy women. J. Clin. Endocrinol. Metab. 2012, 97, 4692–4700. [Google Scholar] [CrossRef] [PubMed]
- Zhang, Y.; Yamamoto, T.; Hisatome, I.; Li, Y.; Cheng, W.; Sun, N.; Cai, B.; Huang, T.; Zhu, Y.; Li, Z.; et al. Uric acid induces oxidative stress and growth inhibition by activating adenosine monophosphate-activated protein kinase and extracellular signal-regulated kinase signal pathways in pancreatic β cells. Mol. Cell Endocrinol. 2013, 375, 89–96. [Google Scholar] [CrossRef] [PubMed]
- Bi, Y.; Zhu, D.; Jing, Y.; Hu, Y.; Feng, W.; Shen, S.; Tong, G.; Shen, X.; Yu, T.; Song, D.; et al. Decreased beta cell function and insulin sensitivity contributed to increasing fasting glucose in Chinese. Acta Diabetol. 2012, 49, S51–S58. [Google Scholar] [CrossRef] [PubMed]
- Lee, S.H.; Kim, K.M.; Kim, K.N. Combined effect of serum gamma-glutamyltransferase and uric acid on incidence of diabetes mellitus: A longitudinal study. Medicine (Baltimore) 2017, 96, 6901. [Google Scholar] [CrossRef] [PubMed]


| Variables | Uric Acid Quartile | p Value | |||
|---|---|---|---|---|---|
| Quartile 1 (n = 2427) | Quartile 2 (n = 2028) | Quartile 3 (n = 1959) | Quartile 4 (n = 1823) | ||
| Age (years) | 44 (36–53) | 47 (38–58) | 48 (39–61) | 49 (39–61) | <0.0001 |
| TC (mmol/L) | 4.55 (4.00–5.13) | 4.69 (4.13–5.30) | 4.82 (4.24–5.42) | 4.91 (4.33–5.56) | <0.0001 |
| TG (mmol/L) | 0.95 (0.70–1.31) | 1.23 (0.88–1.78) | 1.50 (1.06–2.13) | 1.75 (1.27–2.57) | <0.0001 |
| LDL (mmol/L) | 2.78 (2.31–3.31) | 2.98 (2.47–3.53) | 3.12 (2.60–3.66) | 3.18 (2.68–3.74) | <0.0001 |
| HDL (mmol/L) | 1.42 (1.24–1.66) | 1.29 (1.11–1.48) | 1.21 (1.07–1.39) | 1.17 (1.03–1.36) | <0.0001 |
| WBC (109/L) | 5.30 (4.50–6.16) | 5.60 (4.80–6.69) | 5.70 (4.80–6.80) | 5.90 (5.08–6.94) | <0.0001 |
| RBC (1012/L) | 4.32 (4.07–4.62) | 4.58 (4.27–4.92) | 4.70 (4.39–5.03) | 4.72 (4.42–5.02) | <0.0001 |
| MCV (fL) | 90.50 (87.30–93.70) | 91.60 (88.20–95.1) | 91.60 (88.09–95.10) | 92.00 (88.80–95.33) | <0.0001 |
| RDW (%) | 11.90 (11.20–12.70) | 12.10 (11.11–14.90) | 12.12 (11.02–15.90) | 12.30 (11.30–16.60) | <0.0001 |
| PLT (109/L) | 201 (172–236) | 194 (165–226) | 192 (163–226) | 189 (159–221) | <0.0001 |
| MPV (fL) | 8.20 (7.60–8.90) | 8.20 (7.66–8.90) | 8.20 (7.60–8.90) | 8.33 (7.70–8.90) | 0.0165 |
| PDW (%) | 8.30 (7.70–10.30) | 8.30 (7.60–10.25) | 8.40 (7.60–10.50) | 8.40 (7.70–10.25) | 0.8953 |
| GGT (U/L) | 14.10 (10.70–22.00) | 20.60 (14.10–33.20) | 24.90 (17.30–41.60) | 31.30 (21.00–52.90) | <0.0001 |
| TBIL (μmol/L) | 12.90 (10.10–16.50) | 14.60 (11.40–18.00) | 15.20 (12.09–18.50) | 15.50 (12.30–18.80) | <0.0001 |
| STP (g/L) | 72.20 (69.40–75.13) | 72.40 (69.60–75.17) | 72.40 (69.80–75.40) | 73.02 (70.30–75.86) | <0.0001 |
| BUN (mmol/L) | 4.71 (3.90–5.63) | 5.12 (4.36–5.98) | 5.36 (4.61–6.17) | 5.44 (4.66–6.33) | <0.0001 |
| CREA (umol/L) | 74.40 (68.50–82.70) | 85.85 (78.15–93.40) | 90.60 (84.00–97.30) | 94.80 (88.10–102.40) | <0.0001 |
| BMI | 23.33 (21.19–25.59) | 24.84 (22.81–26.89) | 25.95 (23.89–28.02) | 26.62 (24.66–28.70) | <0.0001 |
| Waist (cm) | 79 (73–85) | 86 (80–93) | 90 (84–96) | 93 (88–98) | <0.0001 |
| SBP (mm Hg) | 110 (100–120) | 118 (110–130) | 120 (110–130) | 120 (110–130) | <0.0001 |
| High school or higher education (%) | 1894 (94.75) | 1608 (94.64) | 1577 (93.7) | 1449 (94.46) | 0.5298 |
| Regular physical activity (%) | 701 (35.07) | 609 (35.84) | 596 (35.41) | 567 (36.96) | 0.6879 |
| Smoking (%) | 201 (10.06) | 195 (11.48) | 199 (11.82) | 175 (11.41) | 0.3233 |
| Alcohol drinking (%) | 215 (10.76) | 255 (15.01) | 260 (15.45) | 255 (16.62) | <0.0001 |
| Uric Acid Quartile | n | Prediabetes Events | Incidence Rate | RR (95%CI) | Multivariate-Adjusted | ||
|---|---|---|---|---|---|---|---|
| RR | 95% CI | p Value | |||||
| all 1 |  | ||||||
| Q1 | 2427 | 183 | 7.54% | ||||
| Q2 | 2028 | 248 | 12.23% | 1.388 | 1.135–1.698 | 0.001 | |
| Q3 | 1959 | 320 | 16.33% | 1.357 | 1.097–1.678 | 0.005 | |
| Q4 | 1823 | 332 | 18.21% | 1.362 | 1.095–1.696 | 0.006 | |
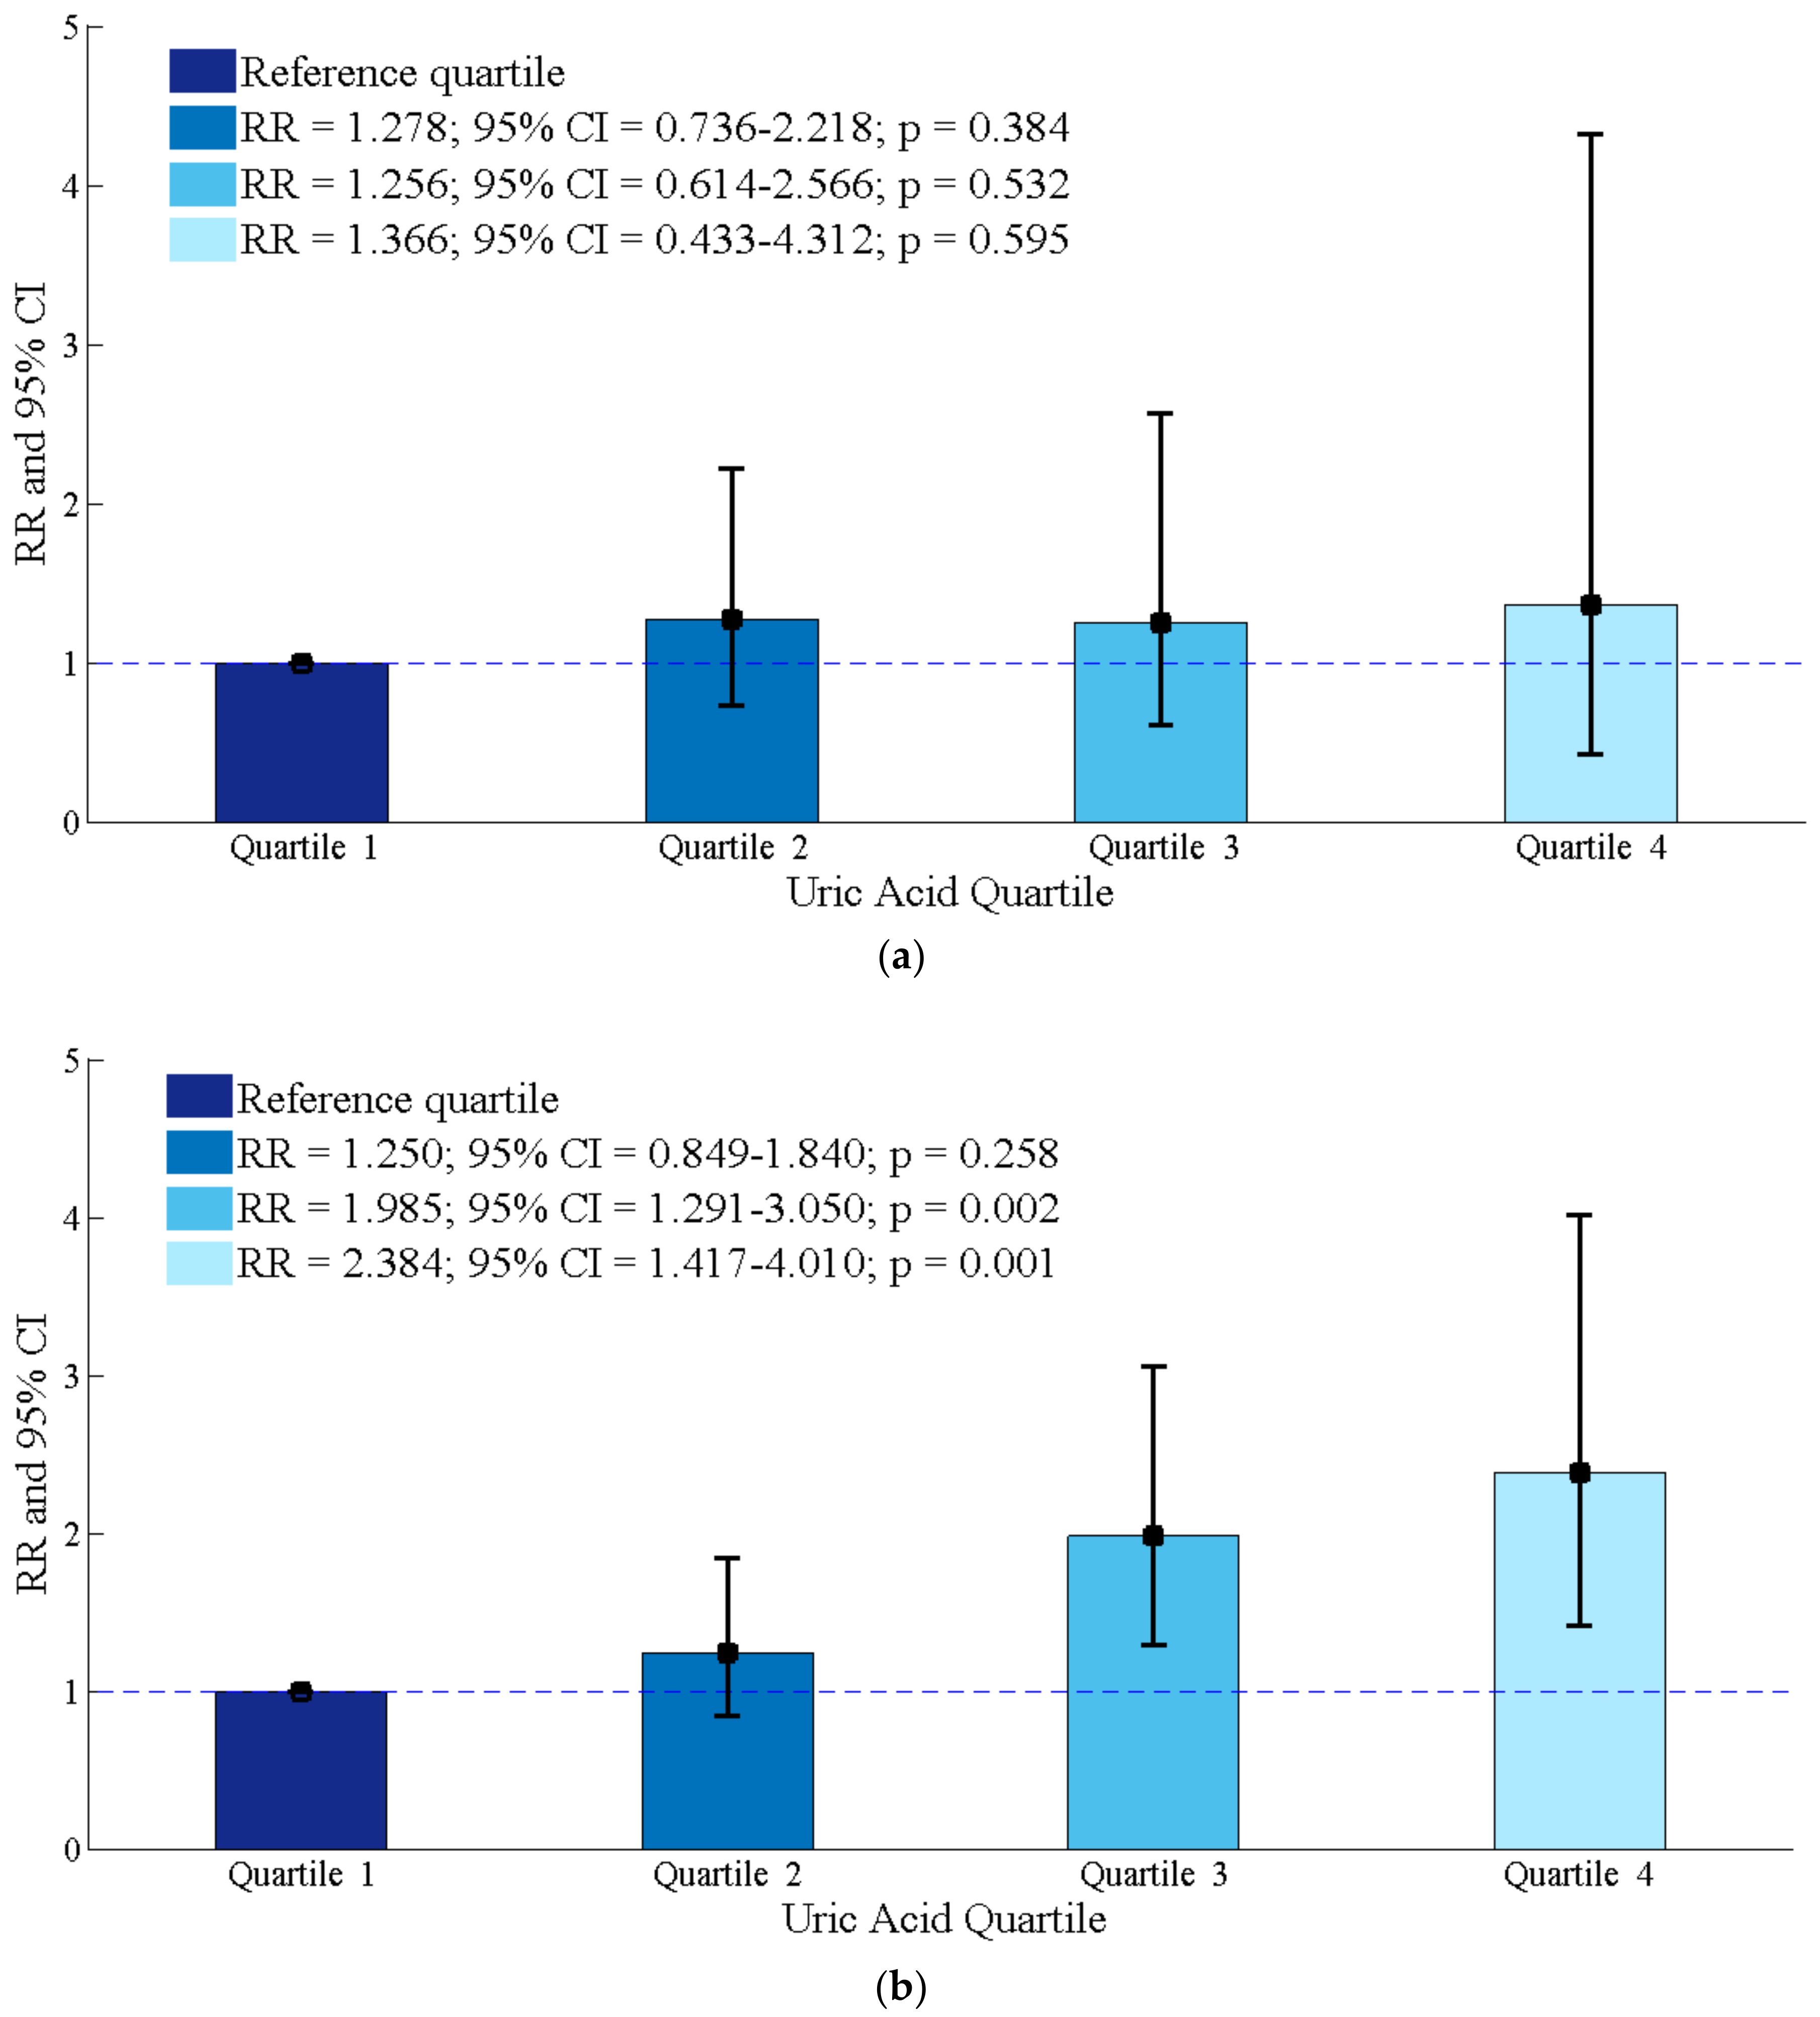
| male 2 | |||||||
| Q1 | 632 | 68 | 10.76% | ||||
| Q2 | 1398 | 190 | 13.59% | 1.272 | 0.963–1.681 | 0.091 | |
| Q3 | 1705 | 279 | 16.36% | 1.118 | 0.846–1.477 | 0.434 | |
| Q4 | 1736 | 311 | 17.91% | 1.161 | 0.877–1.537 | 0.297 | |
| female 3 | |||||||
| Q1 | 1795 | 115 | 6.41% | ||||
| Q2 | 630 | 58 | 9.21% | 1.266 | 0.925–1.731 | 0.140 | |
| Q3 | 254 | 41 | 16.14% | 1.792 | 1.241–2.588 | 0.002 | |
| Q4 | 87 | 21 | 24.14% | 2.109 | 1.329–3.347 | 0.002 | |
© 2018 by the authors. Licensee MDPI, Basel, Switzerland. This article is an open access article distributed under the terms and conditions of the Creative Commons Attribution (CC BY) license (http://creativecommons.org/licenses/by/4.0/).
Share and Cite
Liu, J.; Zhao, Z.; Mu, Y.; Zou, X.; Zou, D.; Zhang, J.; Chen, S.; Tao, L.; Guo, X. Gender Differences in the Association between Serum Uric Acid and Prediabetes: A Six-Year Longitudinal Cohort Study. Int. J. Environ. Res. Public Health 2018, 15, 1560. https://doi.org/10.3390/ijerph15071560
Liu J, Zhao Z, Mu Y, Zou X, Zou D, Zhang J, Chen S, Tao L, Guo X. Gender Differences in the Association between Serum Uric Acid and Prediabetes: A Six-Year Longitudinal Cohort Study. International Journal of Environmental Research and Public Health. 2018; 15(7):1560. https://doi.org/10.3390/ijerph15071560
Chicago/Turabian StyleLiu, Jia, Zhan Zhao, Yongmin Mu, Xiaoping Zou, Dechun Zou, Jingbo Zhang, Shuo Chen, Lixin Tao, and Xiuhua Guo. 2018. "Gender Differences in the Association between Serum Uric Acid and Prediabetes: A Six-Year Longitudinal Cohort Study" International Journal of Environmental Research and Public Health 15, no. 7: 1560. https://doi.org/10.3390/ijerph15071560