Concentration and Potential Ecological Risk of PAHs in Different Layers of Soil in the Petroleum-Contaminated Areas of the Loess Plateau, China


Abstract
:1. Introduction
2. Materials and Methods
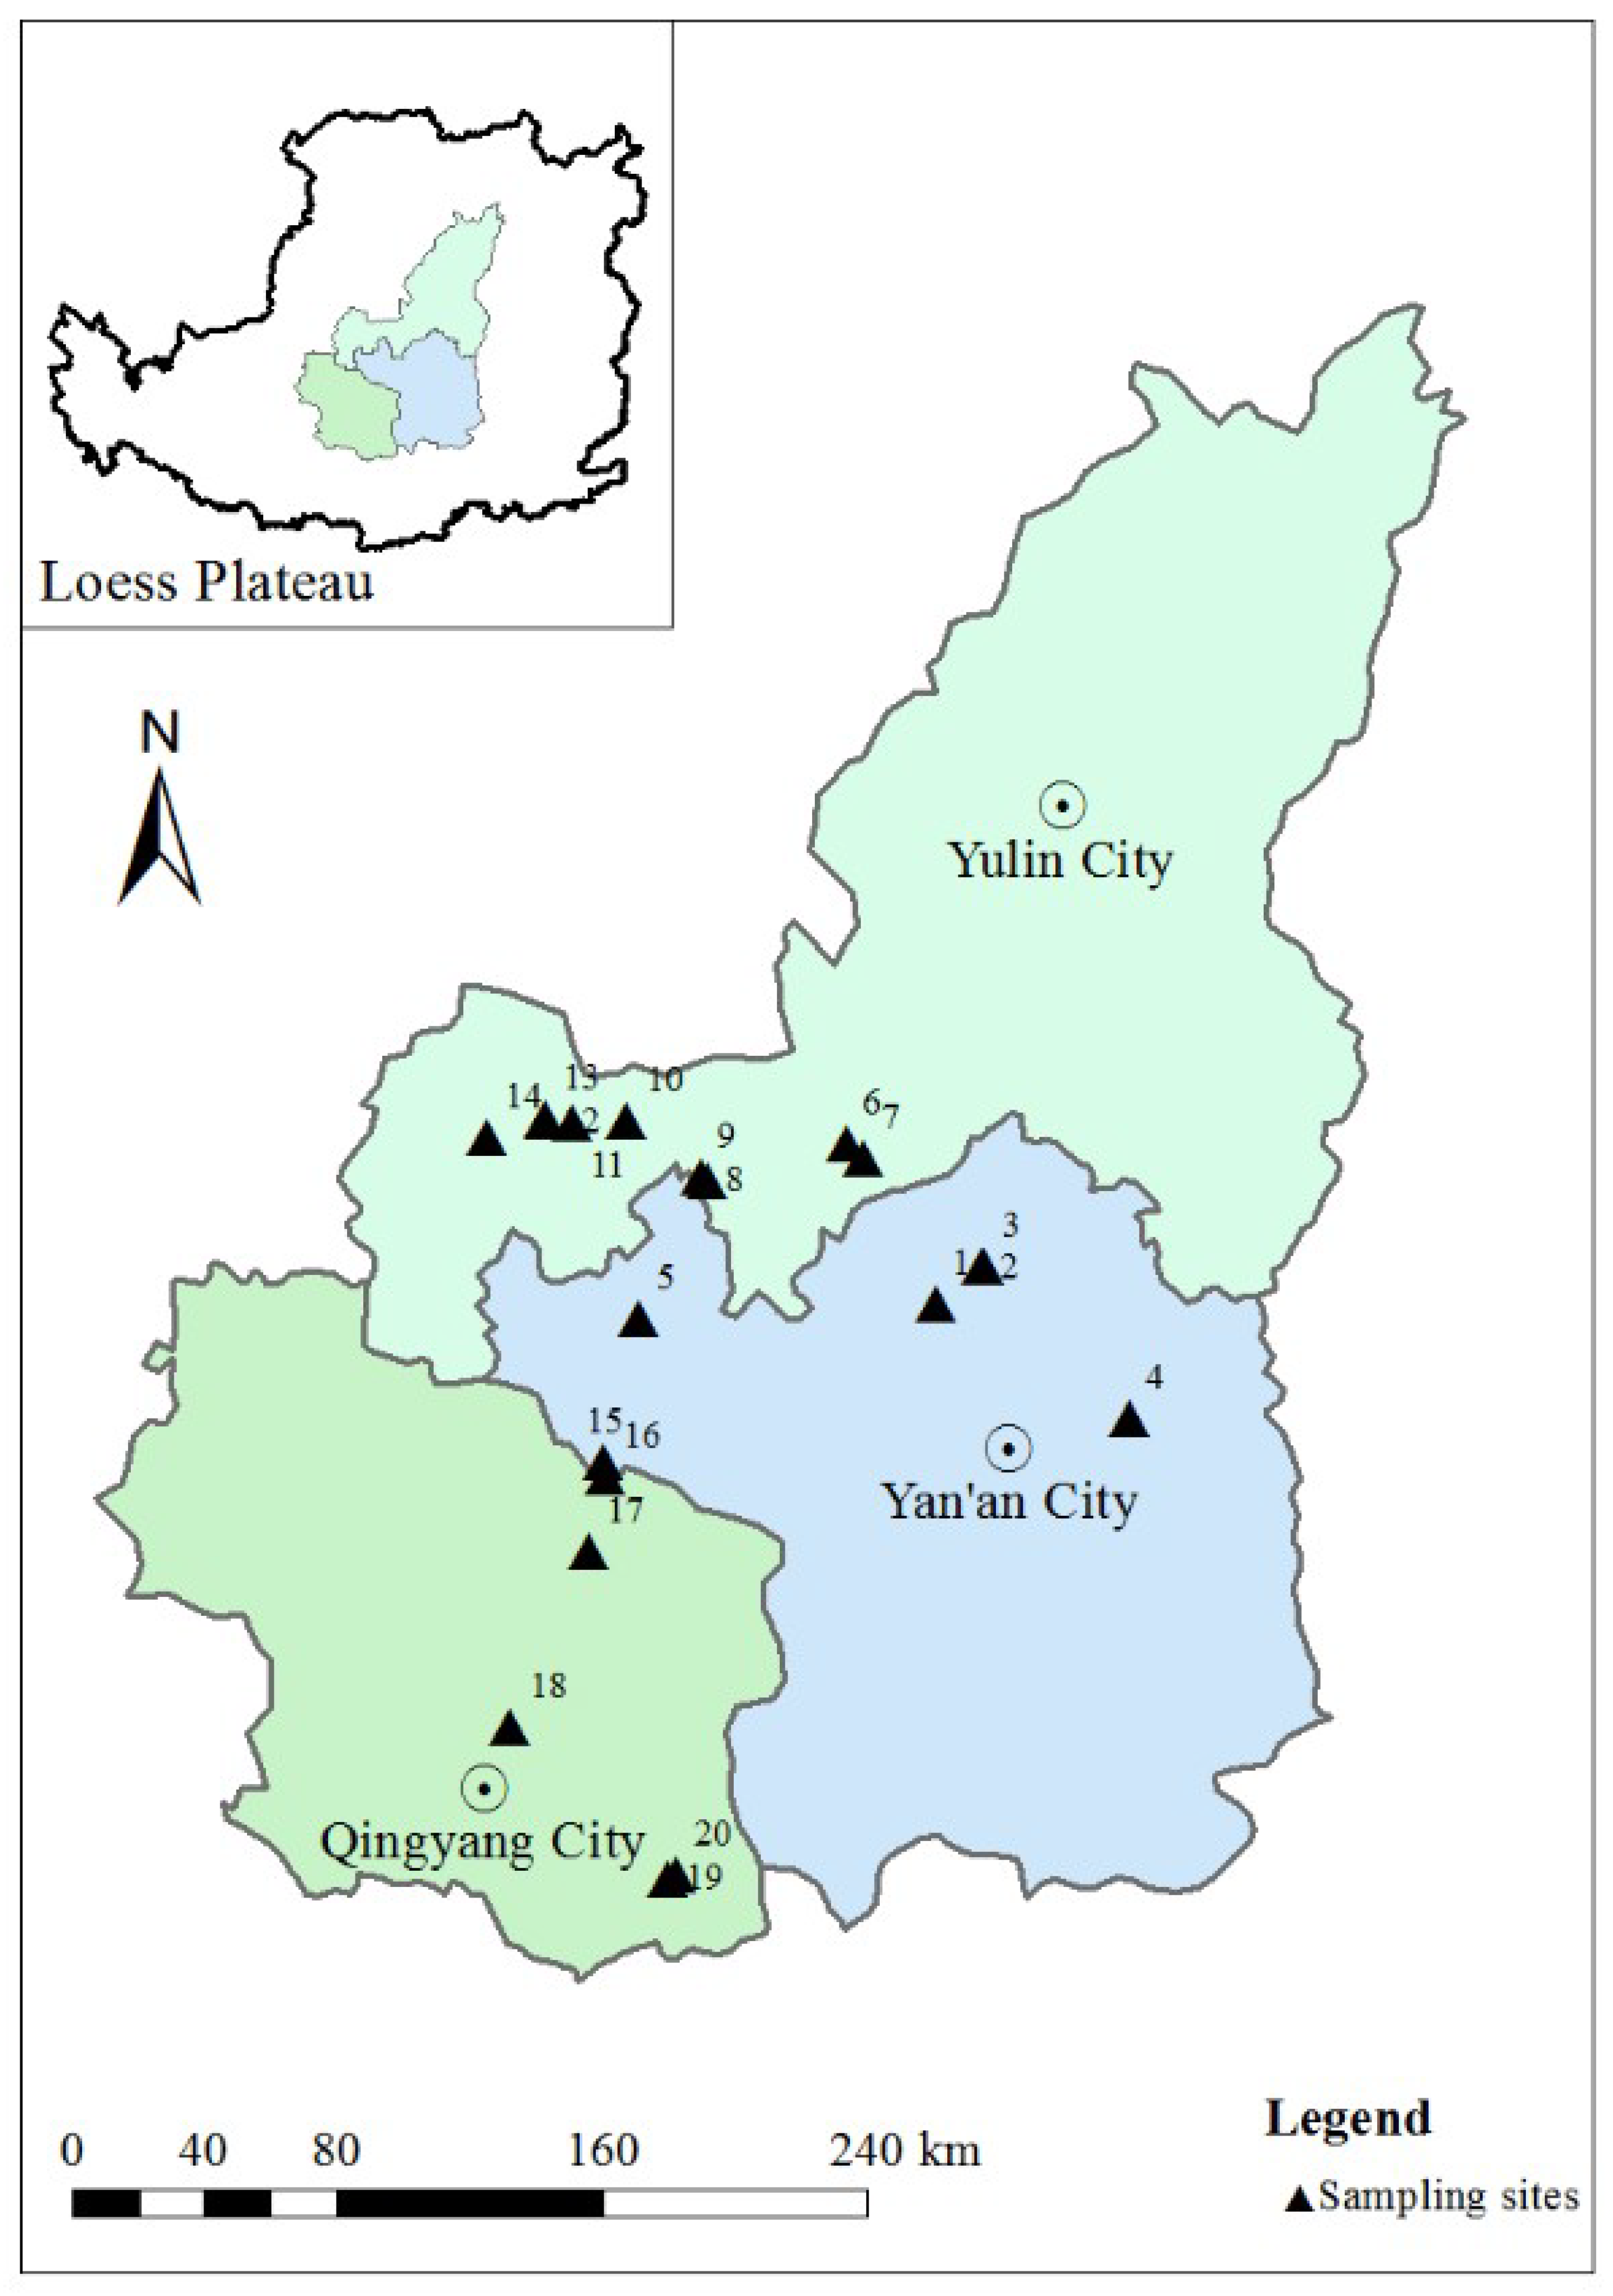
2.1. Study Area Description
2.2. Sample Collection
2.3. Reagents and Standards
2.4. Sample Extraction
2.5. Instrumental Analysis
2.6. Quality Control
2.7. Ecological Risk of PAHs in Soils
2.8. Toxicity Assessment of PAHs in Soils
2.9. Properties Analysis
3. Results and Discussion
3.1. Characteristics of PAHs Concentrations in Soils
3.2. Characteristics of the PAHs Distribution in Soils
3.3. Correlation Analysis
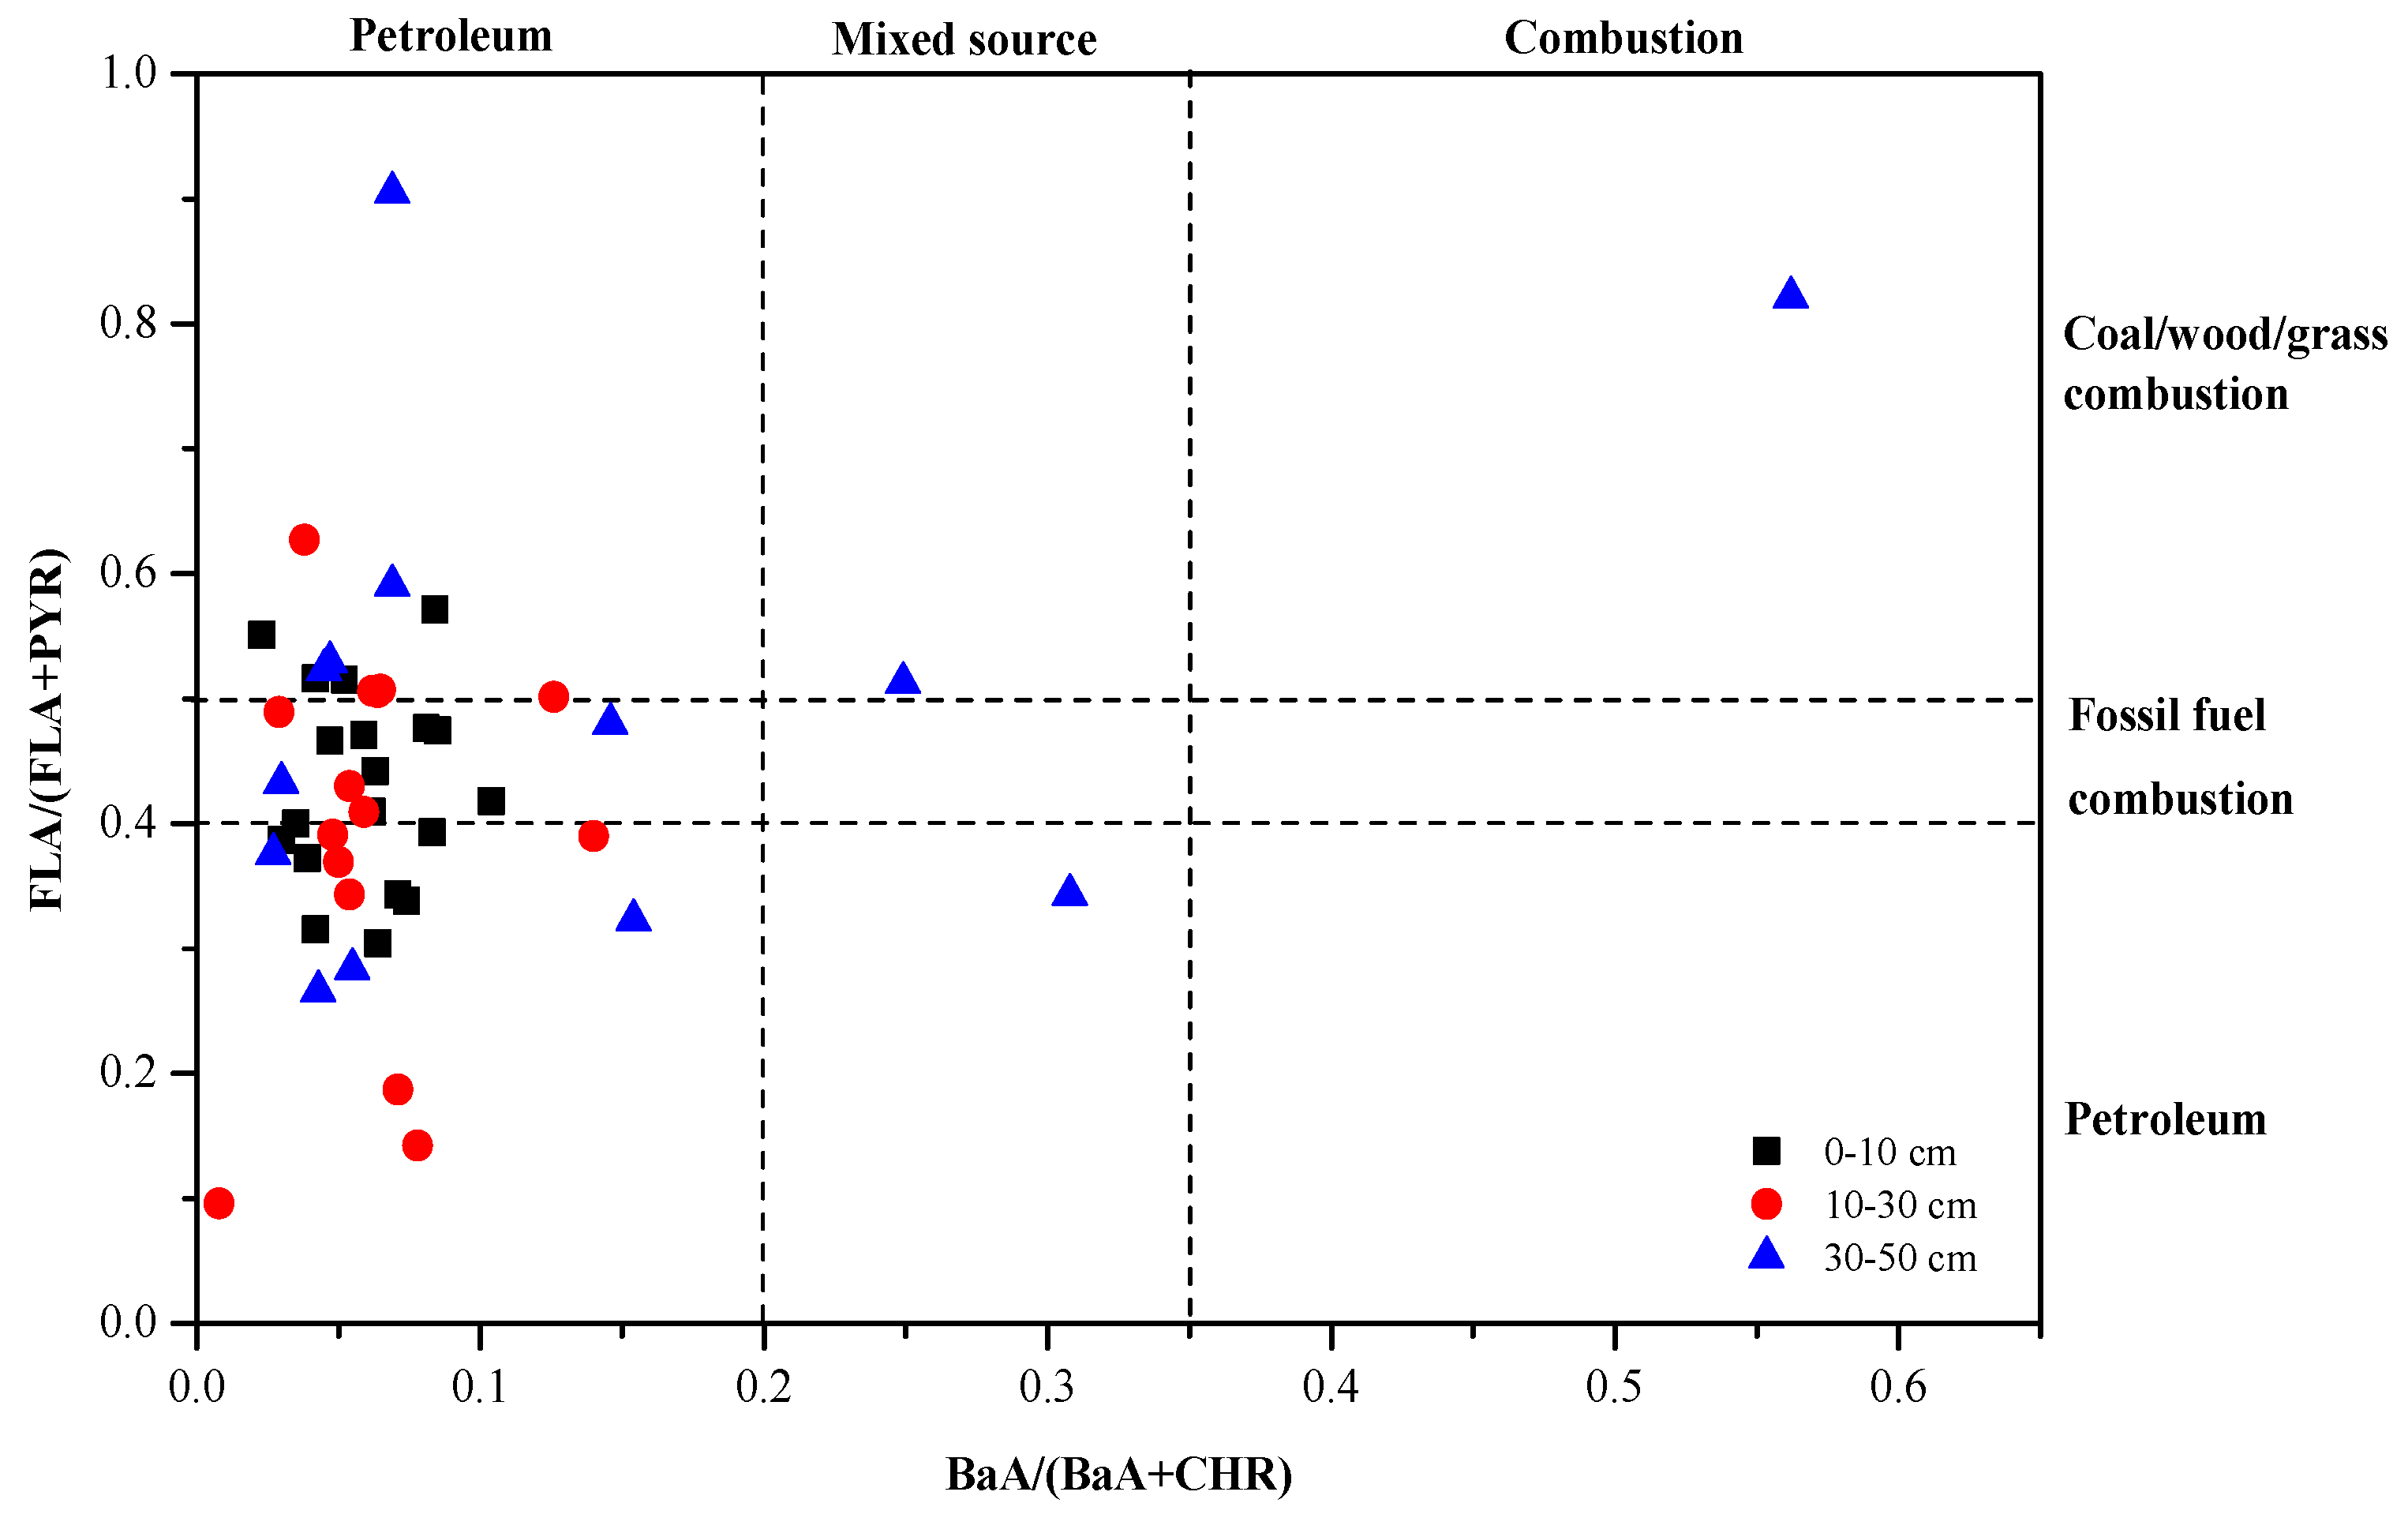
3.4. Source Identification of PAHs in Soils
3.5. Ecological Risk of PAHs in Soils
3.6. Toxicity Potential of PAHs in Soils
4. Conclusions
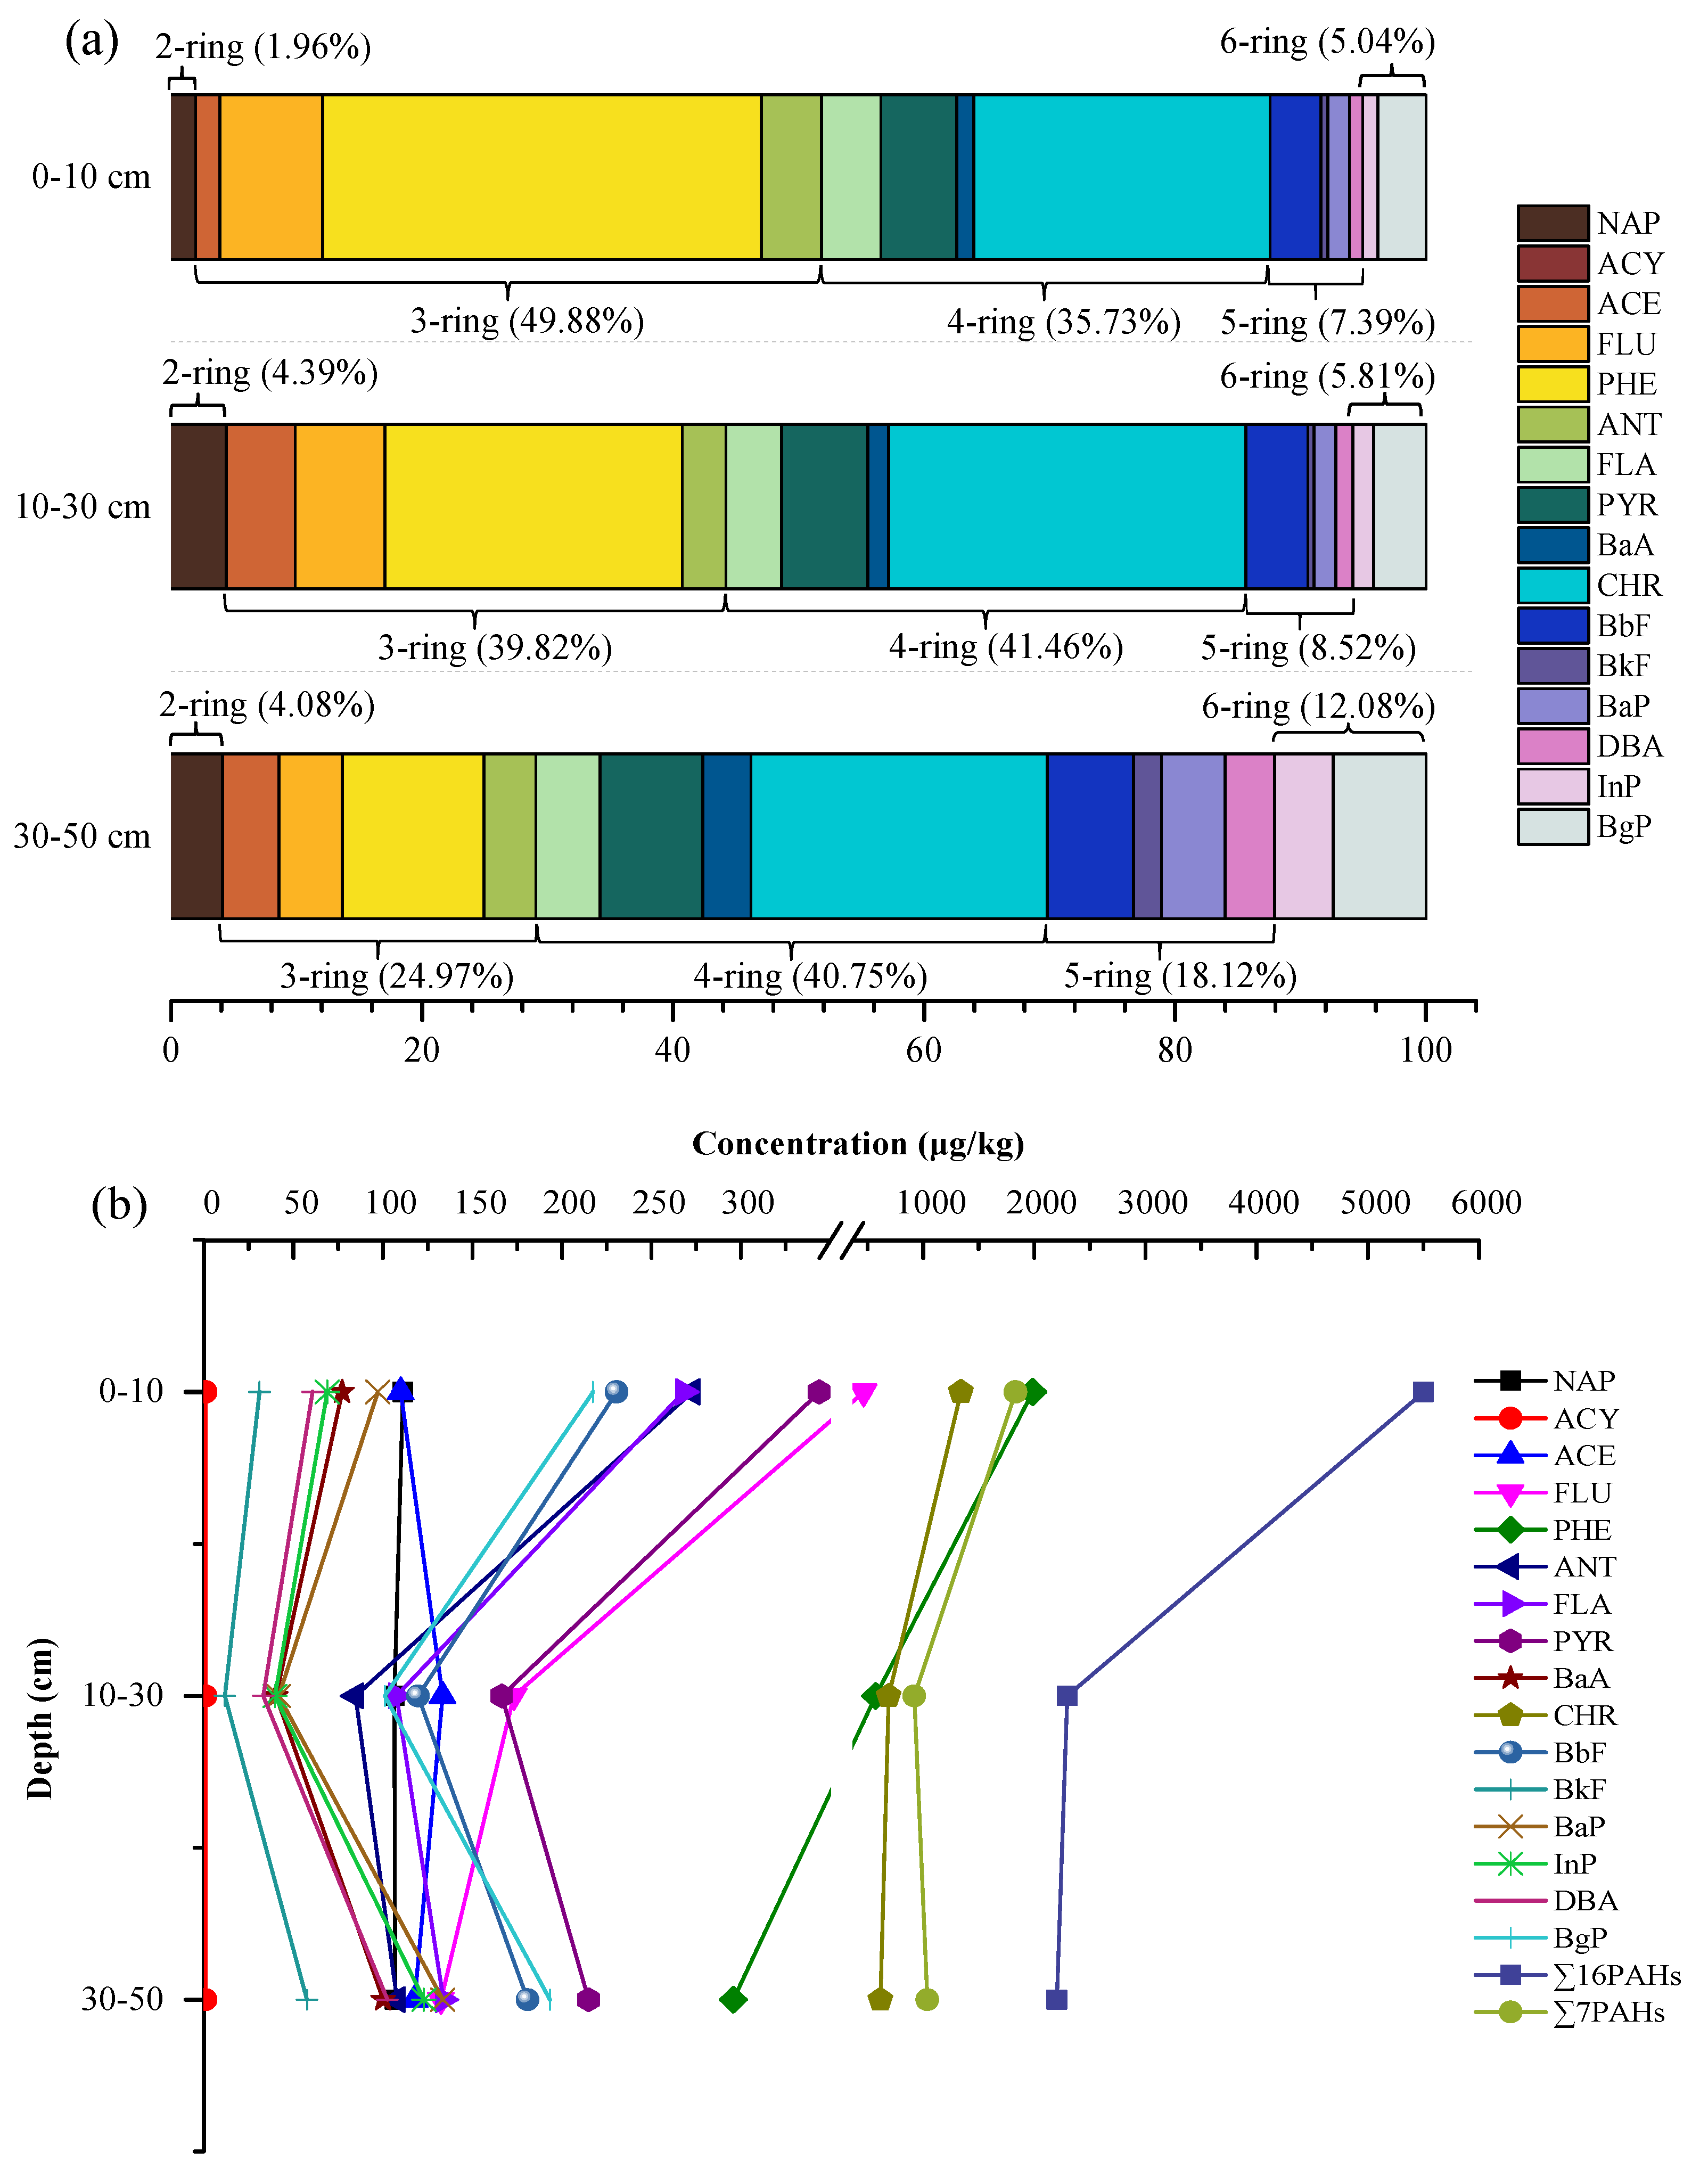
- The concentrations of ∑16PAHs and ∑7PAHs ranged from 1010.67 to 18,068.80 μg/kg and from 223.97 to 4642.40 μg/kg in top layer soils (0–10 cm), from 495.85 to 9868.56 μg/kg and from 85.71 to 3466.19 μg/kg in middle layer soils (10–30 cm), and from 213.16 to 12,552.53 μg/kg and from 23.89 to 6588.26 μg/kg in bottom layer soils (30–50 cm), respectively. In general, the Σ16PAHs presented heavy pollution.
- It is noted that ∑16PAHs gradually decreases over increasing depth. The most prominent compositions analyzed in all soil samples were the 3-ring and 4-ring PAHs, and FLU, PHE and CHR were dominant compounds.
- There was no significant correlation between ∑16PAHs and soil pH, but noteworthy correlations between ∑16PAHs and SOM.
- The source of PAHs in the studied soils is primarily petroleum, and only a small quantity of these originates from combustion.
Author Contributions
Funding
Acknowledgments
Conflicts of Interest
References
- Gu, Y.G.; Ke, C.L.; Liu, Q.; Lin, Q. Polycyclic aromatic hydrocarbons (PAHs) in sediments of Zhelin Bay, the largest mariculture base on the eastern Guangdong coast, South China: Characterization and risk implications. Mar. Pollut. Bull. 2016, 110, 603–608. [Google Scholar] [CrossRef] [PubMed]
- Johnsen, A.R.; Wick, L.Y.; Harms, H. Principles of microbial PAH-degradation in soil. Environ. Pollut. 2005, 133, 71–84. [Google Scholar] [CrossRef] [PubMed]
- Jiang, Y.; Yves, U.J.; Sun, H.; Hu, X.; Zhan, H.; Wu, Y. Distribution, compositional pattern and sources of polycyclic aromatic hydrocarbons in urban soils of an industrial city, Lanzhou, China. Ecotoxicol. Environ. Saf. 2016, 126, 154–162. [Google Scholar] [CrossRef] [PubMed]
- Yin, C.Q.; Jiang, X.; Yang, X.L.; Bian, Y.R.; Wang, F. Polycyclic aromatic hydrocarbons in soils in the vicinity of Nanjing, China. Chemosphere 2008, 73, 389–394. [Google Scholar] [CrossRef] [PubMed]
- Kamal, A.; Cincinelli, A.; Martellini, T.; Malik, R.N. A review of PAH exposure from the combustion of biomass fuel and their less surveyed effect on the blood parameters. Environ. Sci. Pollut. Res. 2015, 22, 4076–4098. [Google Scholar] [CrossRef] [PubMed]
- Wild, S.R.; Jones, K.C. Polynuclear aromatic hydrocarbons in the United Kingdom environment: A preliminary source inventory and budget. Environ. Pollut. 1995, 88, 91–108. [Google Scholar] [CrossRef]
- Wang, L.J.; Xu, X.; Lu, X.W. Composition, source and potential risk of polycyclic aromatic hydrocarbons (PAHs) in vegetable soil from the suburbs of Xianyang City, Northwest China: A case study. Environ. Earth Sci. 2016, 75, 56. [Google Scholar] [CrossRef]
- Thorsen, W.A.; Cope, W.G.; Shea, D. Bioavailability of PAHs: Effects of soot carbon and PAH source. Environ. Sci. Technol. 2004, 38, 2029–2037. [Google Scholar] [CrossRef] [PubMed]
- Cornelissen, G.; Breedveld, G.D.; Kalaitzidis, S.; Christanis, K.; Kibsgaard, A.; Oen, A.M.P. Strong sorption of native PAHs to pyrogenic and unburned carbonaceous geosorbents in sediments. Environ. Sci. Technol. 2006, 40, 1197–1203. [Google Scholar] [CrossRef] [PubMed]
- United States Environmental Protection Agency (USEPA). Guidelines for ecological risk assessment. Fed. Regist. 1998, 63, 846–924.
- Shamilishvily, G.; Abakumov, E.; Gabov, D. Polycyclic aromatic hydrocarbon in urban soils of an Eastern European megalopolis: Distribution, source identification and cancer risk evaluation. Solid Earth 2018, 9, 669–682. [Google Scholar] [CrossRef]
- Tong, R.P.; Yang, X.Y.; Su, H.R.; Pan, Y.; Zhang, Q.Z.; Wang, J.; Long, M.C. Levels, sources and probabilistic health risks of polycyclic aromatic hydrocarbons in the agricultural soils from sites neighboring suburban industries in Shanghai. Sci. Total Environ. 2018, 616, 1365–1373. [Google Scholar] [CrossRef] [PubMed]
- Liu, H.; Yu, X.L.; Liu, Z.R.; Sun, Y. Occurrence, characteristics and sources of polycyclic aromatic hydrocarbons in arable soils of Beijing, China. Ecotoxicol. Environ. Saf. 2018, 159, 120–126. [Google Scholar] [CrossRef] [PubMed]
- Wang, Y.P.; Liang, J.D.; Wang, J.X.; Gao, S. Combining stable carbon isotope analysis and petroleum-fingerprinting to evaluate petroleum contamination in the Yanchang oilfield located on loess plateau in China. Environ. Sci. Pollut. Res. 2018, 25, 2830–2841. [Google Scholar] [CrossRef] [PubMed]
- Suman, S.; Sinha, A.; Tarafdar, A. Polycyclic aromatic hydrocarbons (PAHs) concentration levels, pattern, source identification and soil toxicity assessment in urban traffic soil of Dhanbad, India. Sci. Total Environ. 2016, 545–546, 353–360. [Google Scholar] [CrossRef] [PubMed]
- Kalf, D.F.; Crommentuijn, T.; Van De Plassche, E.J. Environmental quality objectives for 10 polycyclic aromatic hydrocarbons (PAHs). Ecotoxicol. Environ. Saf. 1997, 36, 89–97. [Google Scholar] [CrossRef] [PubMed]
- Nisbet, I.C.T.; LaGoy, P.K. Toxic equivalency factors (TEFs) for polycyclic aromatic hydrocarbons (PAHs). Regul. Toxicol. Pharmacol. 1992, 16, 290–300. [Google Scholar] [CrossRef]
- Sun, C.; Liu, J.; Wang, Y.; Sun, L.; Yu, H. Multivariate and geostatistical analyses of the spatial distribution and sources of heavy metals in agricultural soil in Dehui, Northeast China. Chemosphere 2013, 92, 517–523. [Google Scholar] [CrossRef] [PubMed]
- Jiao, H.H.; Wang, Q.; Zhao, N.N.; Jin, B.; Zhuang, X.L.; Bai, Z.H. Distributions and sources of Polycyclic Aromatic Hydrocarbons (PAHs) in soils around a chemical plant in Shanxi, China. Int. J. Environ. Res. Public Health 2017, 14, 1198. [Google Scholar] [CrossRef] [PubMed]
- Maliszewska-Kordybach, B. Polycyclic aromatic hydrocarbons in agricultural soils in Poland: Preliminary proposals for criteria to evaluate the level of soil contamination. Appl. Geochem. 1996, 11, 121–127. [Google Scholar] [CrossRef]
- Wang, X.T.; Miao, Y.; Zhang, Y.; Li, Y.C.; Wu, M.H.; Yu, G. Polycyclic aromatic hydrocarbons (PAHs) in urban soils of the megacity Shanghai: Occurrence, source apportionment and potential human health risk. Sci. Total Environ. 2013, 447, 80–89. [Google Scholar] [CrossRef] [PubMed]
- Wang, C.H.; Wu, S.H.; Zhou, S.L.; Wang, H.; Li, B.J.; Chen, H.; Yu, Y.N.; Shi, Y.X. Polycyclic aromatic hydrocarbons in soils from urban to rural areas in Nanjing: Concentration, source, spatial distribution, and potential human health risk. Sci. Total Environ. 2015, 527, 375–383. [Google Scholar] [CrossRef] [PubMed]
- Shi, R.G.; Xu, M.M.; Liu, A.F.; Tian, Y.; Zhao, Z.S. Characteristics of PAHs in farmland soil and rainfall runoff in Tianjin, China. Environ. Monit. Assess. 2017, 189, 558. [Google Scholar] [CrossRef] [PubMed]
- Chen, Y.A.; Zhang, J.Q.; Zhang, F.; Li, F.X.; Zhou, M. Polycyclic aromatic hydrocarbons in farmland soils around main reservoirs of Jilin Province, China: Occurrence, sources and potential human health risk. Environ. Geochem. Health 2018, 40, 791–802. [Google Scholar] [CrossRef] [PubMed]
- Xu, J.L.; Wang, H.X.; Sheng, L.X.; Liu, X.J.; Zheng, X.X. Distribution characteristics and risk assessment of Polycyclic Aromatic Hydrocarbons in the Momoge Wetland, China. Int. J. Environ. Res. Public Health 2017, 14, 85. [Google Scholar] [CrossRef] [PubMed]
- Wang, J.; Zhang, X.F.; Ling, W.T.; Liu, R.; Liu, J.; Kang, F.X.; Gao, Y.Z. Contamination and health risk assessment of PAHs in soils and crops in industrial areas of the Yangtze River Delta region, China. Chemosphere 2017, 168, 976–987. [Google Scholar] [CrossRef] [PubMed]
- Vane, C.H.; Kim, A.W.; Beriro, D.; Cave, M.R.; Knights, K.; Moss-Hayes, V.; Nathanail, P.C. Polycyclic aromatic hydrocarbons (PAH) and polychlorinated biphenyls (PCB) in urban soils of Greater London, UK. Appl. Geochem. 2014, 51, 303–314. [Google Scholar] [CrossRef] [Green Version]
- Mielke, H.W.; Wang, G.D.; Gonzales, C.R.; Powell, E.T.; Le, B.; Quach, V.N. PAHs and metals in the soils of inner-city and suburban New Orleans, Louisiana, USA. Environ. Toxicol. Pharmacol. 2004, 18, 243–247. [Google Scholar] [CrossRef] [PubMed]
- Marquez-Bravo, L.G.; Briggs, D.; Shayler, H.; McBride, M.; Lopp, D.; Stone, E.; Ferenz, G.; Bogdan, K.G.; Mitchell, R.G.; Spliethoff, H.M. Concentrations of polycyclic aromatic hydrocarbons in New York City community garden soils: Potential sources and influential factors. Environ. Toxicol. Chem. 2016, 35, 357–367. [Google Scholar] [CrossRef] [PubMed]
- Kwon, H.O.; Choi, S.D. Polycyclic aromatic hydrocarbons (PAHs) in soils from a multi-industrial city, South Korea. Sci. Total Environ. 2014, 470–471, 1494–1501. [Google Scholar] [CrossRef] [PubMed]
- Cachada, A.; Pato, P.; Tocha-Santos, T.; Ferreira da Silva, E.; Duarte, A.C. Levels, sources and potential human health risks of organic pollutants in urban soils. Sci. Total Environ. 2012, 430, 184–192. [Google Scholar] [CrossRef] [PubMed]
- Moore, F.; Akhbarizadeh, R.; Keshavarzi, B.; Khabazi, S.; Lahijanzadeh, A.; Kermani, M. Ecotoxicological risk of polycyclic aromatic hydrocarbons (PAHs) in urban soil of Isfahan metropolis, Iran. Environ. Monit. Assess. 2015, 187, 207. [Google Scholar] [CrossRef] [PubMed]
- Jiao, W.T.; Wang, T.Y.; Lu, Y.L.; Chang, A.; Chen, W.P. Multi-factors influencing the spatial distribution of polycyclic aromatic hydrocarbons in soils surrounding drinking water protection zone. J. Environ. Sci. 2013, 25, 1643–1648. [Google Scholar] [CrossRef]
- Nam, J.J.; Thomas, G.O.; Jaward, F.M.; Steinnes, E.; Gustafsson, O.; Jones, K.C. PAHs in background soils from Western Europe: Influence of atmospheric deposition and soil organic matter. Chemosphere 2008, 70, 1596–1602. [Google Scholar] [CrossRef] [PubMed]
- Zhang, J.; Yang, J.C.; Wang, R.Q.; Hou, H.; Du, X.M.; Fan, S.K.; Liu, J.S.; Dai, J.L. Effects of pollution sources and soil properties on distribution of polycyclic aromatic hydrocarbons and risk assessment. Sci. Total Environ. 2013, 463–464, 1–10. [Google Scholar] [CrossRef] [PubMed]
- Yunker, M.B.; Macdonald, R.W.; Vingarzan, R.; Mitchell, R.H.; Goyette, D.; Sylvestre, S. PAHs in the Fraser River basin: A critical appraisal of PAH ratios as indicators of PAH source and composition. Org. Geochem. 2002, 33, 489–515. [Google Scholar] [CrossRef]
- Christensen, E.R.; Bzdusek, P.A. PAHs in sediments of the Black River and the Ashtabula River, Ohio: Source apportionment by factor analysis. Water Res. 2005, 39, 511–524. [Google Scholar] [CrossRef] [PubMed]
- Chen, Y.Y.; Jia, R.; Yang, S.K. Distribution and source of polycyclic aromatic hydrocarbons (PAHs) in water dissolved phase, suspended particulate matter and sediment from Weihe River in Northwest, China. Int. J. Environ. Res. Public Health 2015, 12, 14148–14163. [Google Scholar] [CrossRef] [PubMed]
- Canadian Council of Ministers of the Environment. Polycyclic Aromatic Hydrocarbons. Canadian Soil Quality Guide-Lines for Protection of Environmental and Human Health. In Canadian Soil Quality Guidelines; Canadian Council of Ministers of the Environment: Winnipeg, MB, Canada. Available online: http://ceqg-rcqe.ccme.ca/en/index.html (accessed on 18 August 2010).
- Zhao, L.; Hou, H.; Shangguan, Y.X.; Cheng, B.; Xu, Y.F.; Zhao, R.F.; Zhang, Y.L.; Hua, X.Z.; Huo, X.L.; Zhao, X.F. Occurrence, sources, and potential human health risks of polycyclic aromatic hydrocarbons in agricultural soils of the coal production area surrounding Xinzhou, China. Ecotoxicol. Environ. Saf. 2014, 108, 120–128. [Google Scholar] [CrossRef] [PubMed]
- Li, G.L.; Lang, Y.H.; Yang, W.; Peng, P.; Wang, X.M. Source contributions of PAHs and toxicity in reed wetland soils of Liaohe estuary using a CMB-TEQ method. Sci. Total Environ. 2014, 490, 199–204. [Google Scholar] [CrossRef] [PubMed]
- Yuan, H.M.; Li, T.G.; Ding, X.G.; Zhao, G.M.; Ye, S.Y. Distribution, sources and potential toxicological significance of polycyclic aromatic hydrocarbons (PAHs) in surface soils of the Yellow River Delta, China. Mar. Pollut. Bull. 2014, 83, 258–264. [Google Scholar] [CrossRef] [PubMed]
- Wang, L.J.; Zhang, S.W.; Wang, L.; Zhang, W.J.; Shi, X.M.; Lu, X.W.; Li, X.P.; Li, X.Y. Concentration and Risk Evaluation of Polycyclic Aromatic Hydrocarbons in Urban Soil in the Typical Semi-Arid City of Xi’an in Northwest China. Int. J. Environ. Res. Public Health 2018, 15, 607. [Google Scholar] [CrossRef] [PubMed]


| Sites | City | Detailed Information of the Sampling Sites | Altitude (m) | Geographic Coordinates | Era of Close-By Oil Wells | |
|---|---|---|---|---|---|---|
| Latitude (N) | Longitude (E) | |||||
| S1 | Yan’an | Hua Zi Ping Town, Ansai District | 1109 | 36°59′00″ | 109°14′22″ | 1983s |
| S2 | Yu Jia Ping Town, Zichang County | 1322 | 37°04′36″ | 109°24′25″ | 2002s | |
| S3 | Yu Jia Ping Town, Zichang County | 1365 | 37°04′45″ | 109°24′41″ | 2003s | |
| S4 | Hei Jia Bao Town, Yanchang County | 860 | 36°39′09″ | 109°53′05″ | 1980s | |
| S5 | Wu Cang Bao Town, Wuqi County | 1522 | 36°58′33″ | 108°12′58″ | 2013s | |
| S6 | Yulin | Xiao He Town, Jingbian County | 1475 | 37°25′02″ | 108°57′04″ | 2009s |
| S7 | Xiao He Town, Jingbian County | 1415 | 37°22′40″ | 109°00′45″ | 1989s | |
| S8 | Zhong Shan Jian Town, Jingbian County | 1518 | 37°19′52″ | 108°27′56″ | 2015s | |
| S9 | Zhong Shan Jian Town, Jingbian County | 1630 | 37°20′46″ | 108°26′32″ | 2015s | |
| S10 | Hao Tan Village, Dingbian County | 1374 | 37°29′58″ | 108°11′36″ | 2012s | |
| S11 | An Bian Town, Dingbian County | 1456 | 37°29′58″ | 108°00′25″ | 2012s | |
| S12 | Zhuan Jing Town, Dingbian County | 1430 | 37°30′39″ | 107°54′26″ | 1992s | |
| S13 | Zhuan Jing Town, Dingbian County | 1452 | 37°30′41″ | 107°54′27″ | 2016s | |
| S14 | Zhuan Jing Town, Dingbian County | 1564 | 37°28′08″ | 107°42′12″ | 2003s | |
| S15 | Qingyang | Qiao He Village, Huachi County | 1644 | 36°35′44″ | 108°04′39″ | 1980s |
| S16 | Qiao He Village, Huachi County | 1502 | 36°33′08″ | 108°04′52″ | 2008s | |
| S17 | Yue Le Town, Huachi County | 1316 | 36°21′27″ | 108°00′59″ | 2012s | |
| S18 | Bai Ma Pu Town, Qingcheng County | 1422 | 35°53′40″ | 107°43′51″ | 2004s | |
| S19 | Mi Qiao Village, Ning County | 1380 | 35°28′44″ | 108°14′55″ | 2010s | |
| S20 | Mi Qiao Village, Ning County | 1396 | 35°29′18″ | 108°16′44″ | 2012s | |
| PAH Compounds | Abbreviation | Ring of Numbers | 0–10 cm (μg/kg) | 10–30 cm (μg/kg) | 30–50 cm (μg/kg) | ||||||
|---|---|---|---|---|---|---|---|---|---|---|---|
| Range | Mean | Median | Range | Mean | Median | Range | Mean | Median | |||
| Naphthalene | NAP | 2-ring | 64.46–196.55 | 111.17 | 94.52 | 59.61–196.45 | 106.40 | 83.88 | 59.14–167.77 | 106.88 | 96.30 |
| Acenaphthylene | ACY | 3-ring | N.D. | N.D. | N.D. | N.D. | N.D. | N.D. | N.D.–31.05 | N.D. | N.D. |
| Acenaphthene | ACE | 3-ring | N.D.–157.98 | 109.97 | 119.69 | N.D.–466.99 | 133.41 | 113.21 | N.D.–390.27 | 117.72 | 86.98 |
| Fluorene | FLU | 3-ring | 44.48-2383.70 | 465.33 | 169.63 | 57.77–1326.62 | 173.08 | 88.57 | 32.71–598.08 | 132.46 | 88.57 |
| Phenanthrene | PHE | 4-ring | 127.81–8052.24 | 1984.77 | 1009.95 | 108.04–5857.47 | 574.11 | 203.14 | 68.82–895.03 | 295.71 | 187.66 |
| Anthracene | ANT | 3-ring | N.D.–1317.29 | 272.76 | 104.87 | N.D.–743.06 | 84.64 | 38.75 | N.D.–593.61 | 107.96 | 40.31 |
| Fluoranthene | FLA | 4-ring | 23.09–867.22 | 267.97 | 195.62 | N.D.–538.54 | 107.55 | 55.73 | 9.76–951.35 | 133.81 | 27.75 |
| Pyrene | PYR | 4-ring | 34.62–872.94 | 343.67 | 300.32 | 20.95–596.16 | 166.36 | 118.32 | N.D.–2404.15 | 214.93 | 59.72 |
| Benzo(a)anthracene | BaA | 4-ring | N.D.–185.51 | 77.19 | 72.97 | N.D.–153.01 | 40.27 | 24.67 | N.D.–507.76 | 100.25 | 31.06 |
| Chrysene | CHR | 4-ring | 116.65–3796.53 | 1340.26 | 1142.36 | 42.23–2688.38 | 690.65 | 367.48 | N.D.–2976.13 | 618.21 | 391.56 |
| Benzo(b)fluoranthene | BbF | 5–ring | 27.08–572.11 | 230.53 | 167.74 | 12.00–381.80 | 119.70 | 88.44 | N.D.–1243.23 | 180.78 | 95.57 |
| Benzo(k)fluoranthene | BkF | 5–ring | N.D.–67.05 | 31.13 | 21.57 | N.D.–21.69 | 11.71 | 10.72 | N.D.–231.93 | 57.58 | 15.92 |
| Benzo(a)pyrene | BaP | 5–ring | 10.40–225.40 | 97.23 | 73.11 | N.D.–191.80 | 41.86 | 25.61 | N.D.–911.71 | 133.54 | 48.54 |
| Indeno(1,2,3–c,d)pyrene | InP | 6–ring | N.D.–151.52 | 68.92 | 58.50 | N.D.–82.37 | 39.72 | 37.09 | N.D.–467.10 | 122.89 | 30.75 |
| Dibenzo(a,h)anthracene | DBA | 5–ring | N.D.–102.03 | 60.72 | 60.21 | N.D.–80.00 | 33.23 | 31.98 | N.D.–250.40 | 102.59 | 90.71 |
| Benzo(g,h,i)perylene | BgP | 6–ring | N.D.–433.26 | 217.30 | 217.56 | N.D.–272.75 | 101.12 | 98.00 | N.D.–752.43 | 193.43 | 118.27 |
| ∑16PAHs ∑7PAHs | 1010.67–18068.80 | 5502.44 | 4030.25 | 495.85–9868.56 | 2296.94 | 1411.88 | 213.16–12552.53 | 2203.88 | 1070.47 | ||
| 223.97–4642.40 | 1832.55 | 1791.17 | 85.71–3466.19 | 921.45 | 576.88 | 23.89–6588.26 | 1039.09 | 553.09 | |||
| District | Soil Types | Depth (cm) | Number of PAHs | Mean (μg/kg) | References |
|---|---|---|---|---|---|
| Loess Plateau, China | petroleum-contaminated soil | 0–10 | 16 | 5502.44 | This study |
| Xianyang, China | vegetable soil | 0–25 | 16 | 210.31 | Wang et al. [7] |
| Shanghai, China | urban soil | 0–20 | 16 | 1970 | Wang et al. [21] |
| Nanjing, China | urban soil | 0–5 | 16 | 3330 | Wang et al. [22] |
| Tianjin, China | farmland soil | 0–20 | 16 | 941.27 | Shi et al. [23] |
| Jilin, China | agricultural soil | 0–20 | 16 | 877.23 | Chen et al. [24] |
| Momoge Wetland, China | wetland soil | 0–10 | 16 | 96 | Xu et al. [25] |
| Yangtze River Delta region, China | industrial areas soil | 0–20 | 16 | 471.3 | Wang et al. [26] |
| Dhanbad, India | urban traffic soil | 0–5 | 13 | 3488 | Suman et al. [15] |
| London, UK | urban soil | 5–20 | 16 | 18,000 | Vane et al. [27] |
| New Orleans, USA | urban soil | 0–2.5 | 16 | 2927 | Mielke et al. [28] |
| New York, USA | garden soil | 0–10 | 16 | 14,200 | Marquez-Bravo et al. [29] |
| Ulsan, Korea | industrial, urban, and rural soil | 0–5 | 16 | 960 | Kwon et al. [30] |
| Viseu, Portugal | urban soil | 0–10 | 16 | 169 | Cachada et al. [31] |
| Isfahan, Iran | urban soil | 1–5 | 16 | 2000.56 | Moore et al. [32] |
| SOM (0–10 cm) | SOM (10–30 cm) | SOM (30–50 cm) | pH (0–10 cm) | pH (10–30 cm) | pH (30–50 cm) | ∑16PAHs (0–10 cm) | ∑16PAHs (10–30 cm) | ∑16PAHs (30–50 cm) | |
|---|---|---|---|---|---|---|---|---|---|
| SOM (0–10 cm) | 1 | ||||||||
| SOM (10–30 cm) | 0.439 | 1 | |||||||
| SOM (30–50 cm) | 0.138 | 0.821 ** | 1 | ||||||
| pH (0–10 cm) | 0.128 | −0.227 | −0.285 | 1 | |||||
| pH (10–30 cm) | 0.065 | −0.162 | −0.083 | 0.720 ** | 1 | ||||
| pH (30–50 cm) | −0.005 | −0.335 | −0.338 | 0.516 * | 0.676 ** | 1 | |||
| ∑16PAHs (0–10 cm) | 0.810 ** | 0.510 * | 0.234 | 0.168 | 0.171 | 0.021 | 1 | ||
| ∑16PAHs (10–30 cm) | 0.383 | 0.812 ** | 0.567 ** | −0.252 | 0.016 | −0.213 | 0.506 * | 1 | |
| ∑16PAHs (30–50 cm) | 0.075 | 0.439 | 0.780 ** | −0.075 | 0.152 | −0.007 | 0.170 | 0.305 | 1 |
| PAHs | NCs | MPCs | RQ(NCs) | RQ(MPCs) | ||||
|---|---|---|---|---|---|---|---|---|
| 0–10 cm | 10–30 cm | 30–50 cm | 0–10 cm | 10–30 cm | 30–50 cm | |||
| NAP | 1.4 | 140 | 79.41 | 76.00 | 76.35 | 0.79 | 0.76 | 0.76 |
| ACY | 1.2 | 120 | 0.00 | 0.00 | 0.00 | 0.00 | 0.00 | 0.00 |
| ACE | 1.2 | 120 | 91.64 | 111.18 | 98.10 | 0.92 | 1.11 | 0.98 |
| FLU | 1.2 | 120 | 387.77 | 144.23 | 110.38 | 3.88 | 1.44 | 1.10 |
| PHE | 5.1 | 510 | 389.17 | 112.57 | 57.98 | 3.89 | 1.13 | 0.58 |
| ANT | 1.2 | 120 | 227.30 | 70.53 | 89.96 | 2.27 | 0.71 | 0.90 |
| FLA | 26 | 2600 | 10.31 | 4.14 | 5.15 | 0.10 | 0.04 | 0.05 |
| PYR | 1.2 | 120 | 286.39 | 138.63 | 179.11 | 2.86 | 1.39 | 1.79 |
| BaA | 2.5 | 250 | 30.87 | 16.11 | 40.10 | 0.31 | 0.16 | 0.40 |
| CHR | 107 | 10700 | 12.53 | 6.45 | 5.78 | 0.13 | 0.06 | 0.06 |
| BbF | 2.5 | 250 | 92.21 | 47.88 | 72.31 | 0.92 | 0.48 | 0.72 |
| BkF | 24 | 2400 | 1.30 | 0.49 | 2.40 | 0.01 | 0.00 | 0.02 |
| BaP | 2.6 | 260 | 37.39 | 16.10 | 51.36 | 0.37 | 0.16 | 0.51 |
| InP | 59 | 5900 | 1.17 | 0.67 | 2.08 | 0.01 | 0.01 | 0.02 |
| DBA | 2.6 | 260 | 23.35 | 12.78 | 39.46 | 0.23 | 0.13 | 0.39 |
| BgP | 75 | 7500 | 2.90 | 1.35 | 2.58 | 0.03 | 0.01 | 0.03 |
| ∑16PAHs | 1673.72 | 757.96 | 833.10 | 12.91 | 5.07 | 2.89 | ||
| PAHs | TEFs | 0–10 cm (μg/kg) | 10–30 cm (μg/kg) | 30–50 cm (μg/kg) | ||||||
|---|---|---|---|---|---|---|---|---|---|---|
| Min | Max | Mean | Min | Max | Mean | Min | Max | Mean | ||
| NAP | 0.001 | 0.06 | 0.20 | 0.11 | 0.06 | 0.20 | 0.11 | 0.06 | 0.17 | 0.11 |
| ACY | 0.001 | N.D. | N.D. | N.D. | N.D. | N.D. | N.D. | N.D. | 0.03 | N.D. |
| ACE | 0.001 | N.D. | 0.16 | 0.11 | N.D. | 0.47 | 0.13 | N.D. | 0.39 | 0.12 |
| FLU | 0.001 | 0.04 | 2.38 | 0.47 | 0.06 | 1.33 | 0.17 | 0.03 | 0.60 | 0.13 |
| PHE | 0.001 | 0.13 | 8.05 | 1.98 | 0.11 | 5.86 | 0.57 | 0.07 | 0.90 | 0.30 |
| ANT | 0.01 | N.D. | 13.17 | 2.73 | N.D. | 7.43 | 0.85 | N.D. | 5.94 | 1.08 |
| FLA | 0.001 | 0.02 | 0.87 | 0.27 | N.D. | 0.54 | 0.11 | 0.01 | 0.95 | 0.13 |
| PYR | 0.001 | 0.03 | 0.87 | 0.34 | 0.02 | 0.60 | 0.17 | N.D. | 2.40 | 0.21 |
| BaA | 0.1 | N.D. | 18.55 | 7.72 | N.D. | 15.30 | 4.03 | N.D. | 50.78 | 10.02 |
| CHR | 0.01 | 1.17 | 37.97 | 13.40 | 0.42 | 26.88 | 6.91 | N.D. | 29.76 | 6.18 |
| BbF | 0.1 | 2.71 | 57.21 | 23.05 | 1.20 | 38.18 | 11.97 | N.D. | 124.32 | 18.08 |
| BkF | 0.1 | N.D. | 6.70 | 3.11 | N.D. | 2.17 | 1.17 | N.D. | 23.19 | 5.76 |
| BaP | 1 | 10.40 | 225.40 | 97.23 | N.D. | 191.80 | 41.86 | N.D. | 911.71 | 133.54 |
| InP | 0.1 | N.D. | 15.15 | 6.89 | N.D. | 8.24 | 3.97 | N.D. | 46.71 | 12.29 |
| DBA | 1 | N.D. | 102.03 | 60.72 | N.D. | 80.00 | 33.23 | N.D. | 250.40 | 102.59 |
| BgP | 0.01 | N.D. | 4.33 | 2.17 | N.D. | 2.73 | 1.01 | N.D. | 7.52 | 1.93 |
| ∑16PAHs | 16.59 | 303.50 | 220.31 | 2.59 | 165.19 | 106.25 | 0.21 | 1452.16 | 292.48 | |
| ∑7PAHs | 11.90 | 277.19 | 212.13 | 3.23 | 277.28 | 103.14 | 0.24 | 1436.87 | 288.46 | |
© 2018 by the authors. Licensee MDPI, Basel, Switzerland. This article is an open access article distributed under the terms and conditions of the Creative Commons Attribution (CC BY) license (http://creativecommons.org/licenses/by/4.0/).
Share and Cite
Wang, D.; Ma, J.; Li, H.; Zhang, X. Concentration and Potential Ecological Risk of PAHs in Different Layers of Soil in the Petroleum-Contaminated Areas of the Loess Plateau, China. Int. J. Environ. Res. Public Health 2018, 15, 1785. https://doi.org/10.3390/ijerph15081785
Wang D, Ma J, Li H, Zhang X. Concentration and Potential Ecological Risk of PAHs in Different Layers of Soil in the Petroleum-Contaminated Areas of the Loess Plateau, China. International Journal of Environmental Research and Public Health. 2018; 15(8):1785. https://doi.org/10.3390/ijerph15081785
Chicago/Turabian StyleWang, Di, Jing Ma, Hao Li, and Xingchang Zhang. 2018. "Concentration and Potential Ecological Risk of PAHs in Different Layers of Soil in the Petroleum-Contaminated Areas of the Loess Plateau, China" International Journal of Environmental Research and Public Health 15, no. 8: 1785. https://doi.org/10.3390/ijerph15081785