Gentrification and Displacement in the San Francisco Bay Area: A Comparison of Measurement Approaches

 , ,
, ,
Abstract
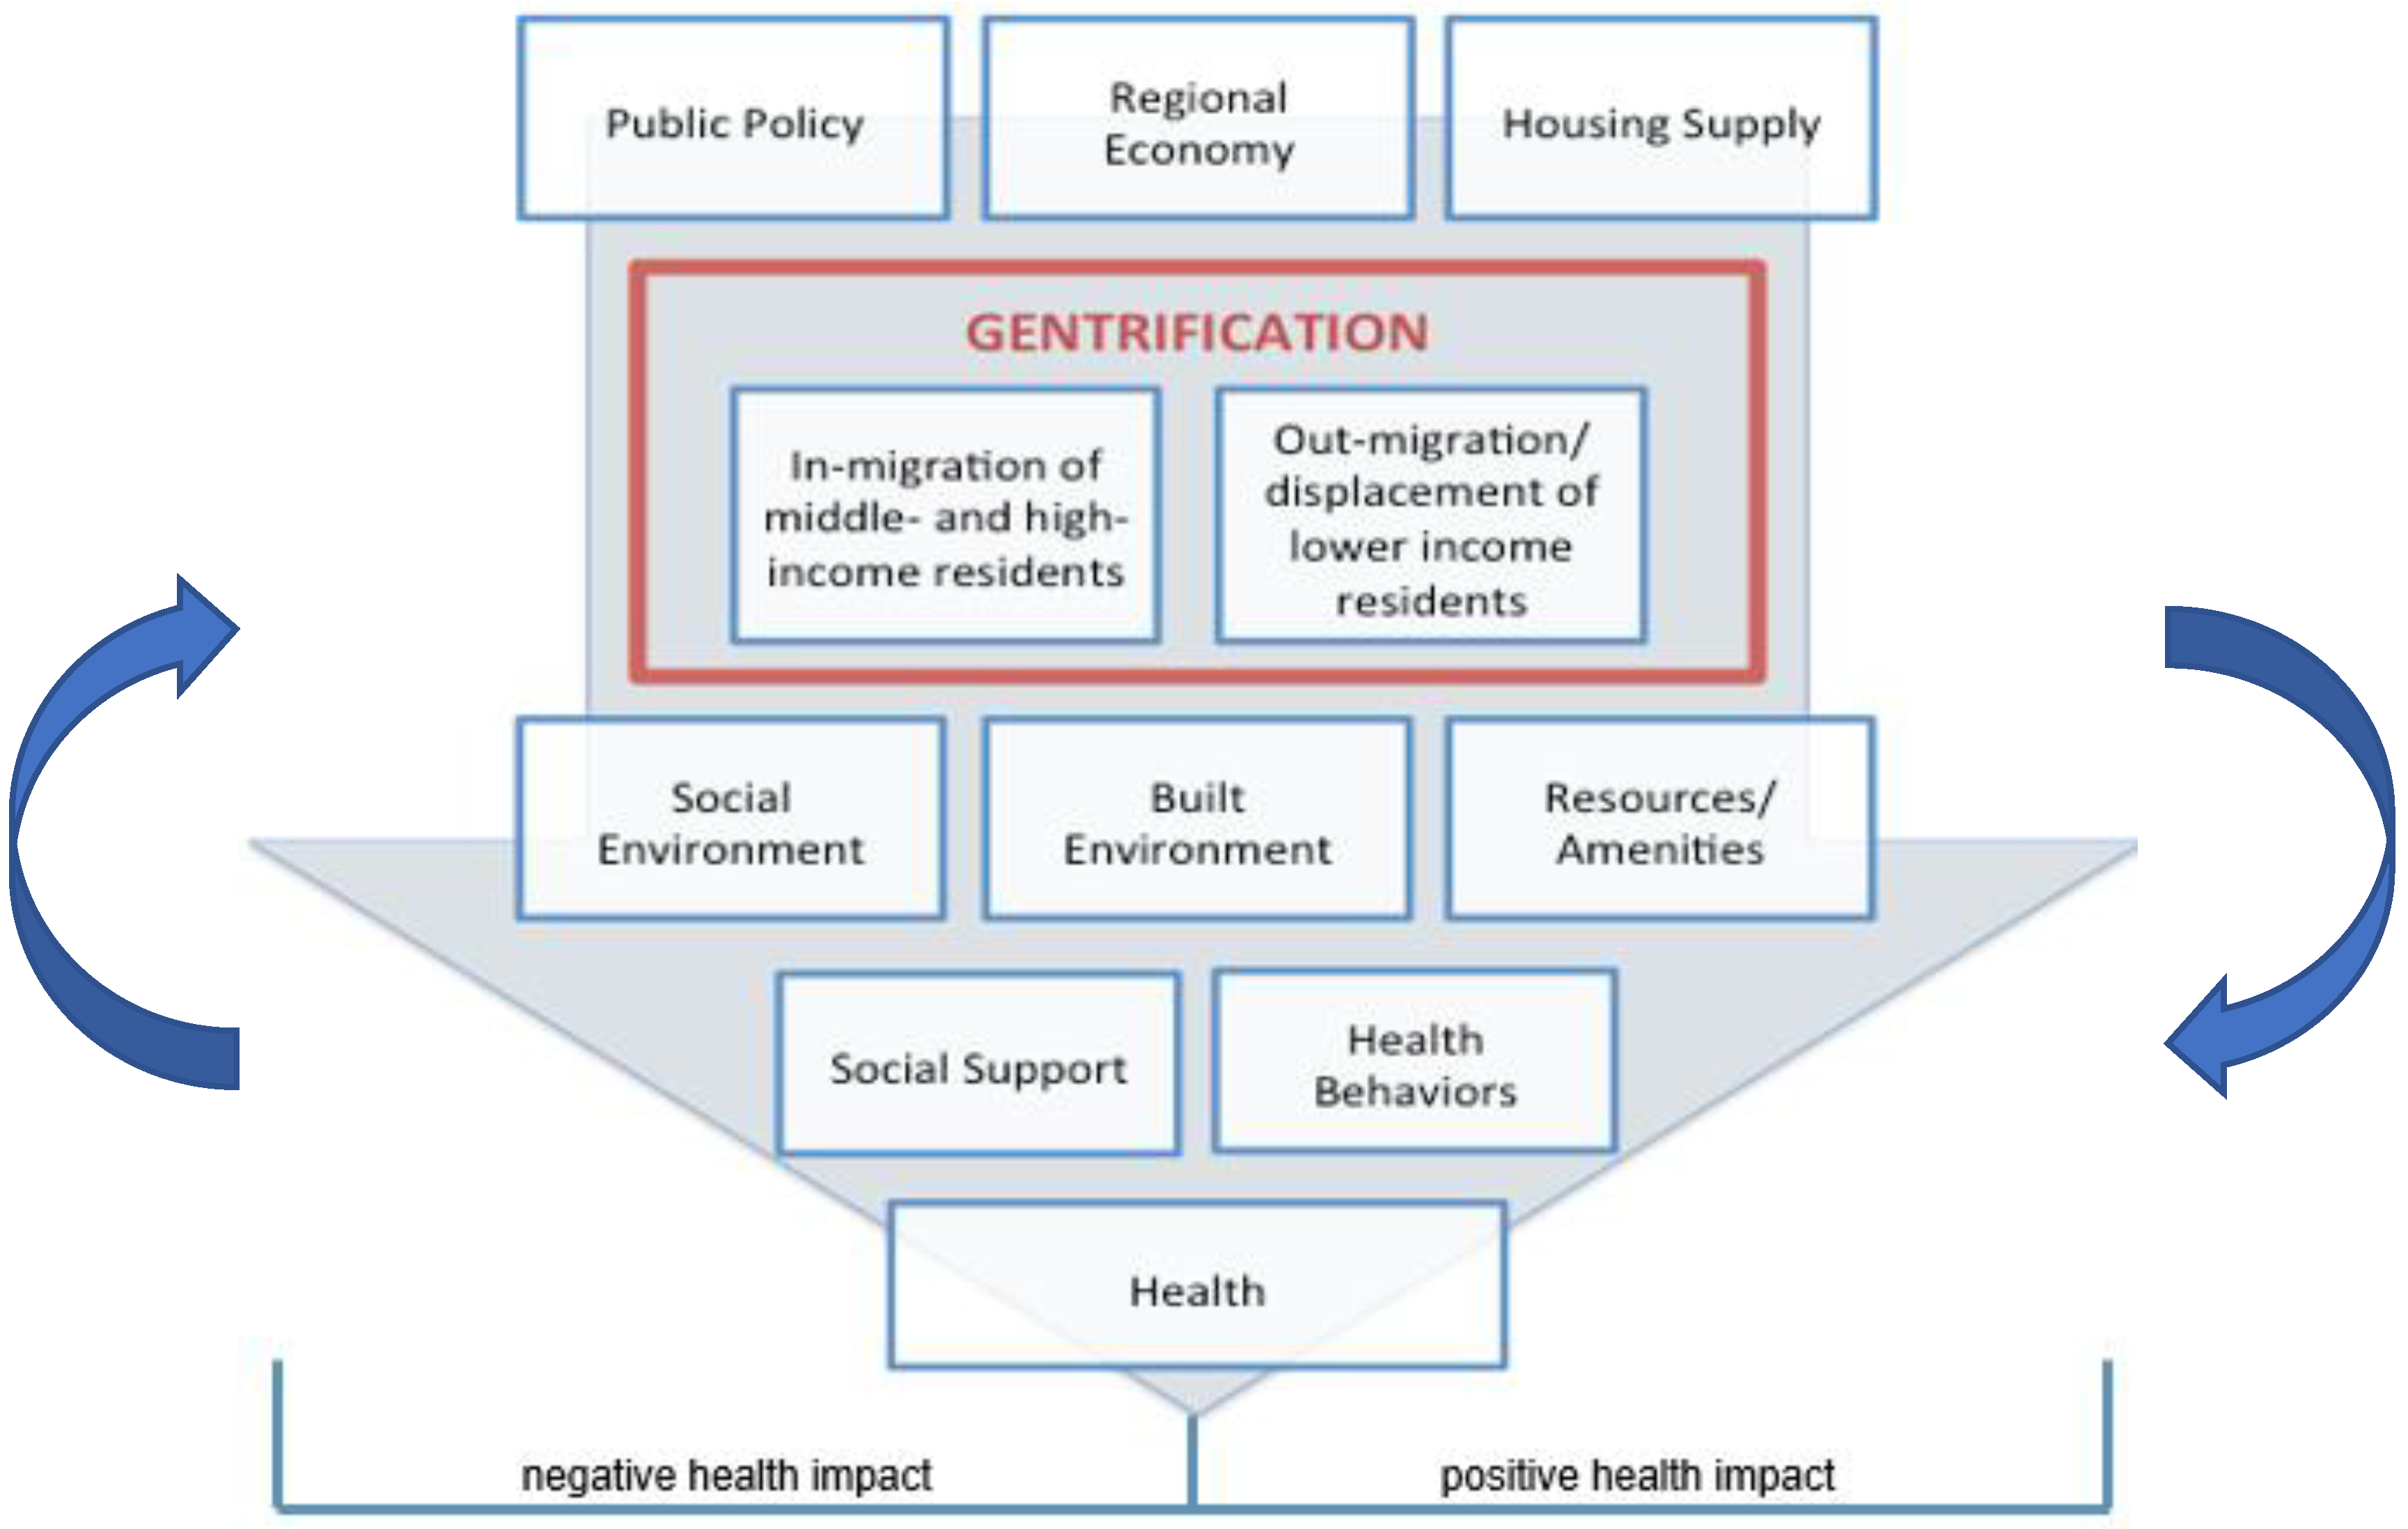
:1. Introduction
2. Materials and Methods
2.1. Setting
2.2. Measuring Gentrification
2.2.1. Freeman Method
2.2.2. Landis Method
2.2.3. Urban Displacement Project
2.3. Data Analysis
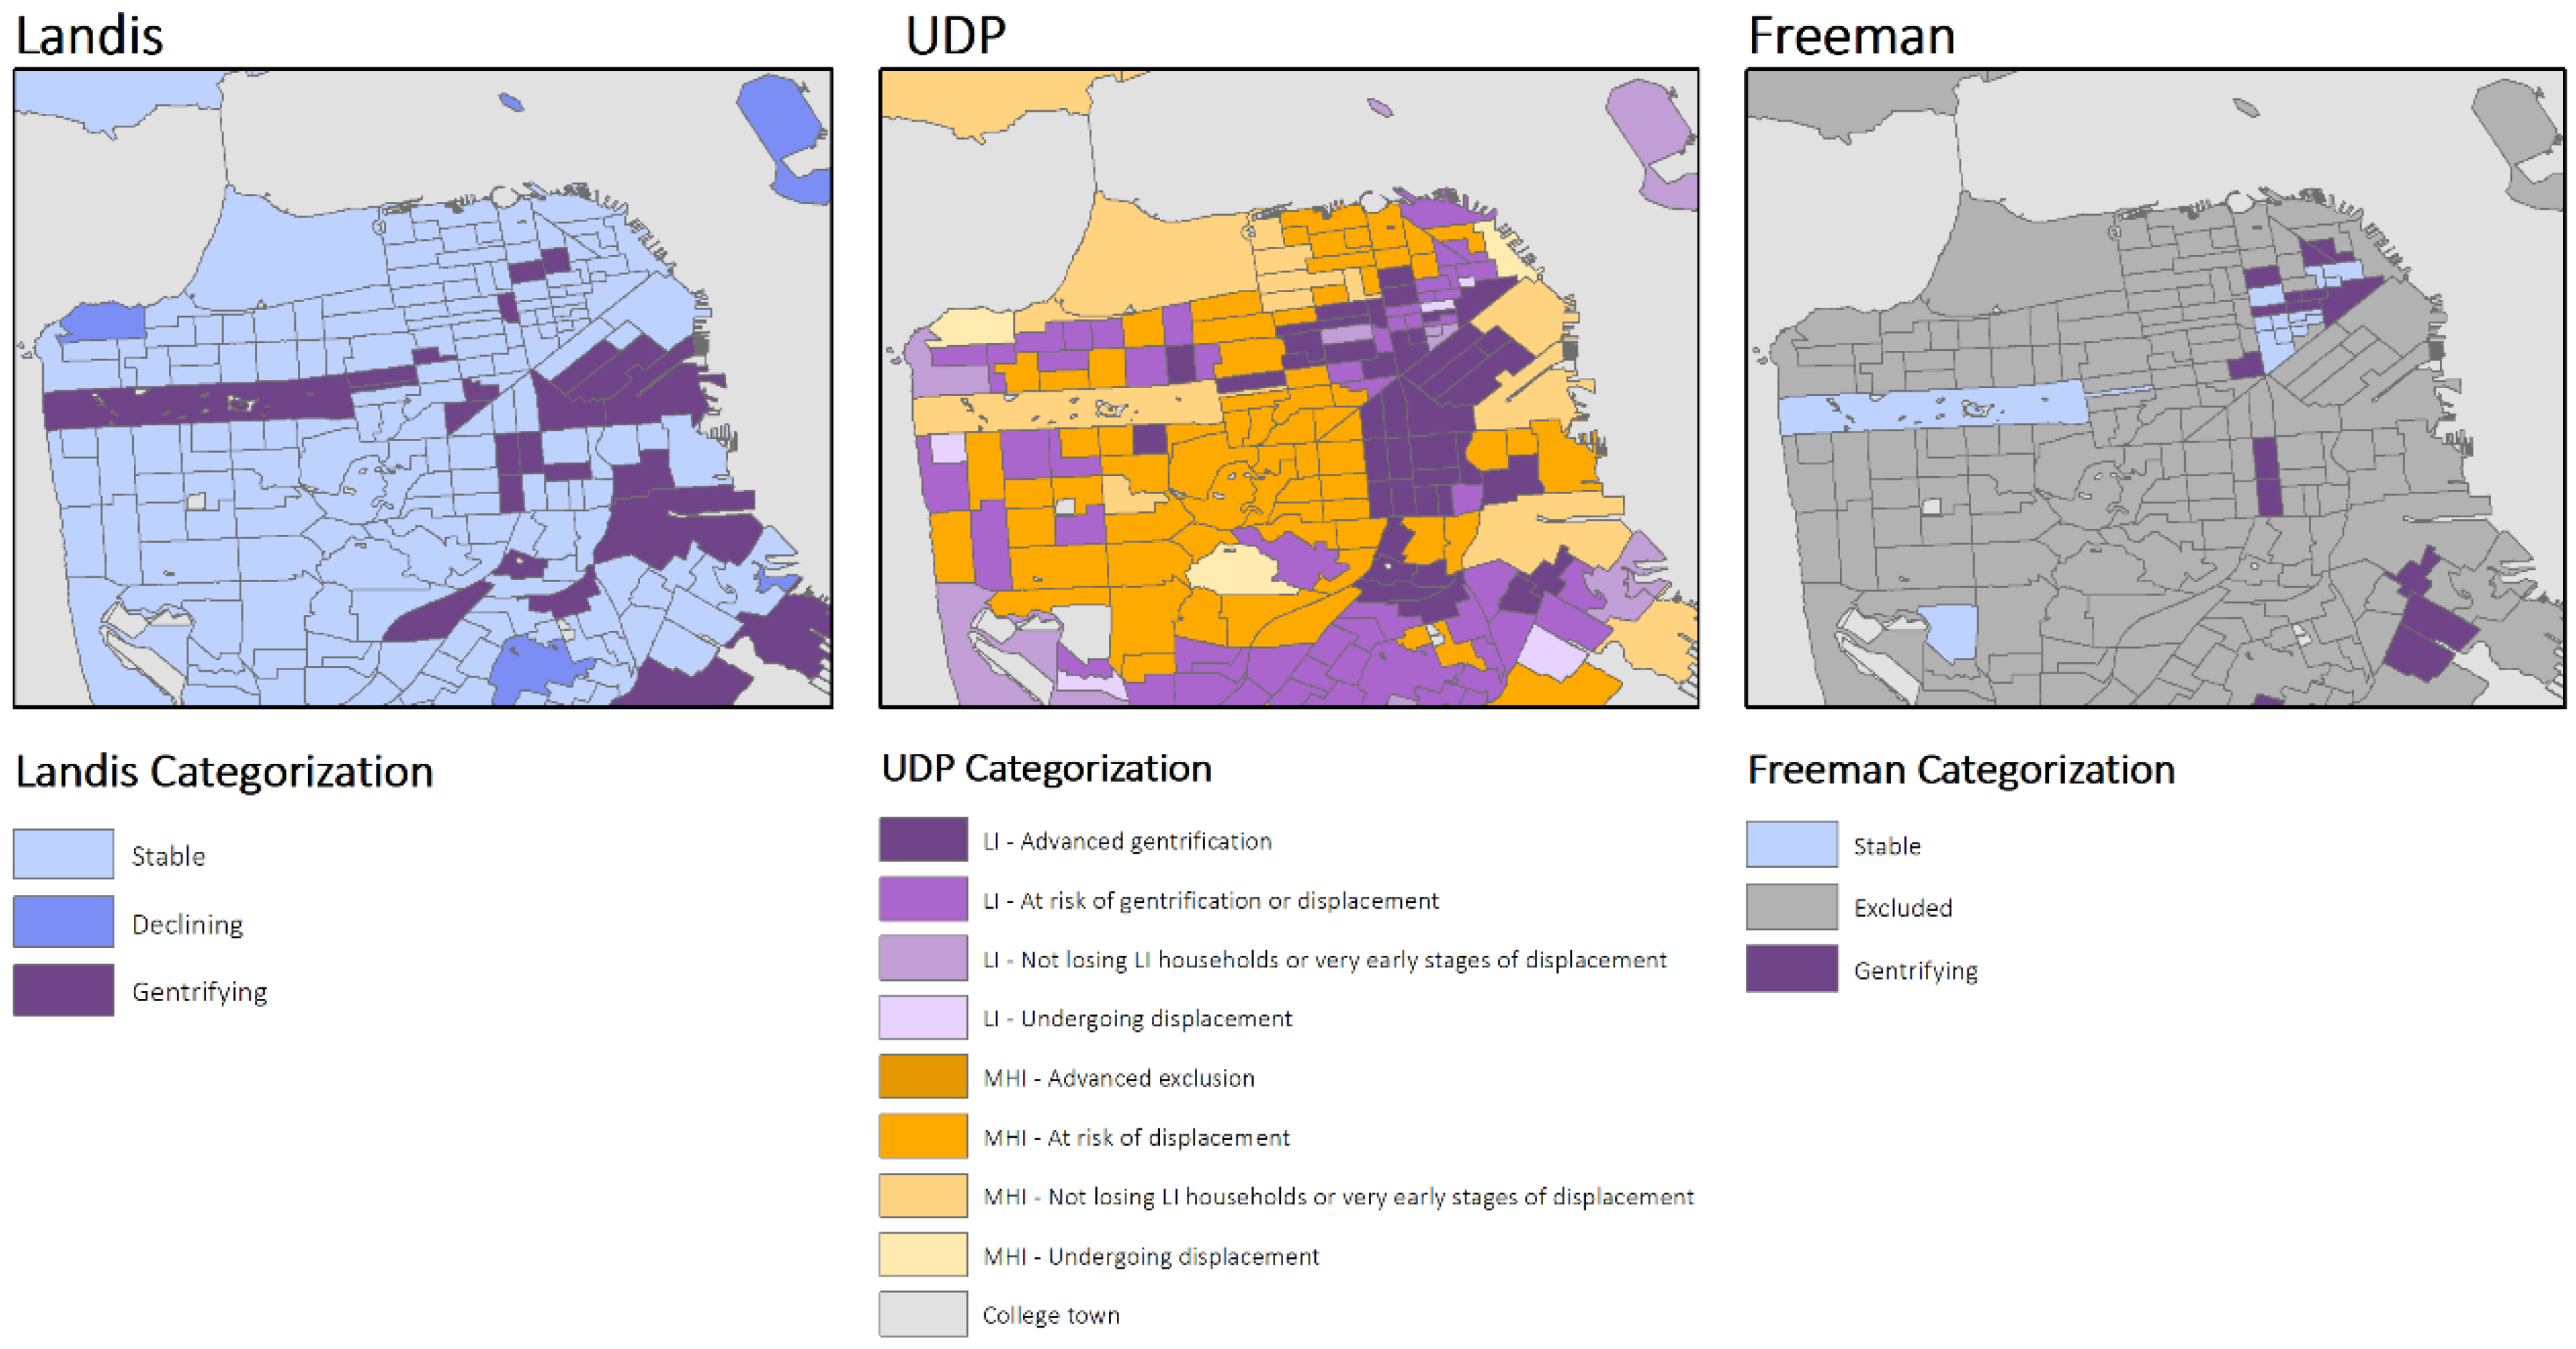
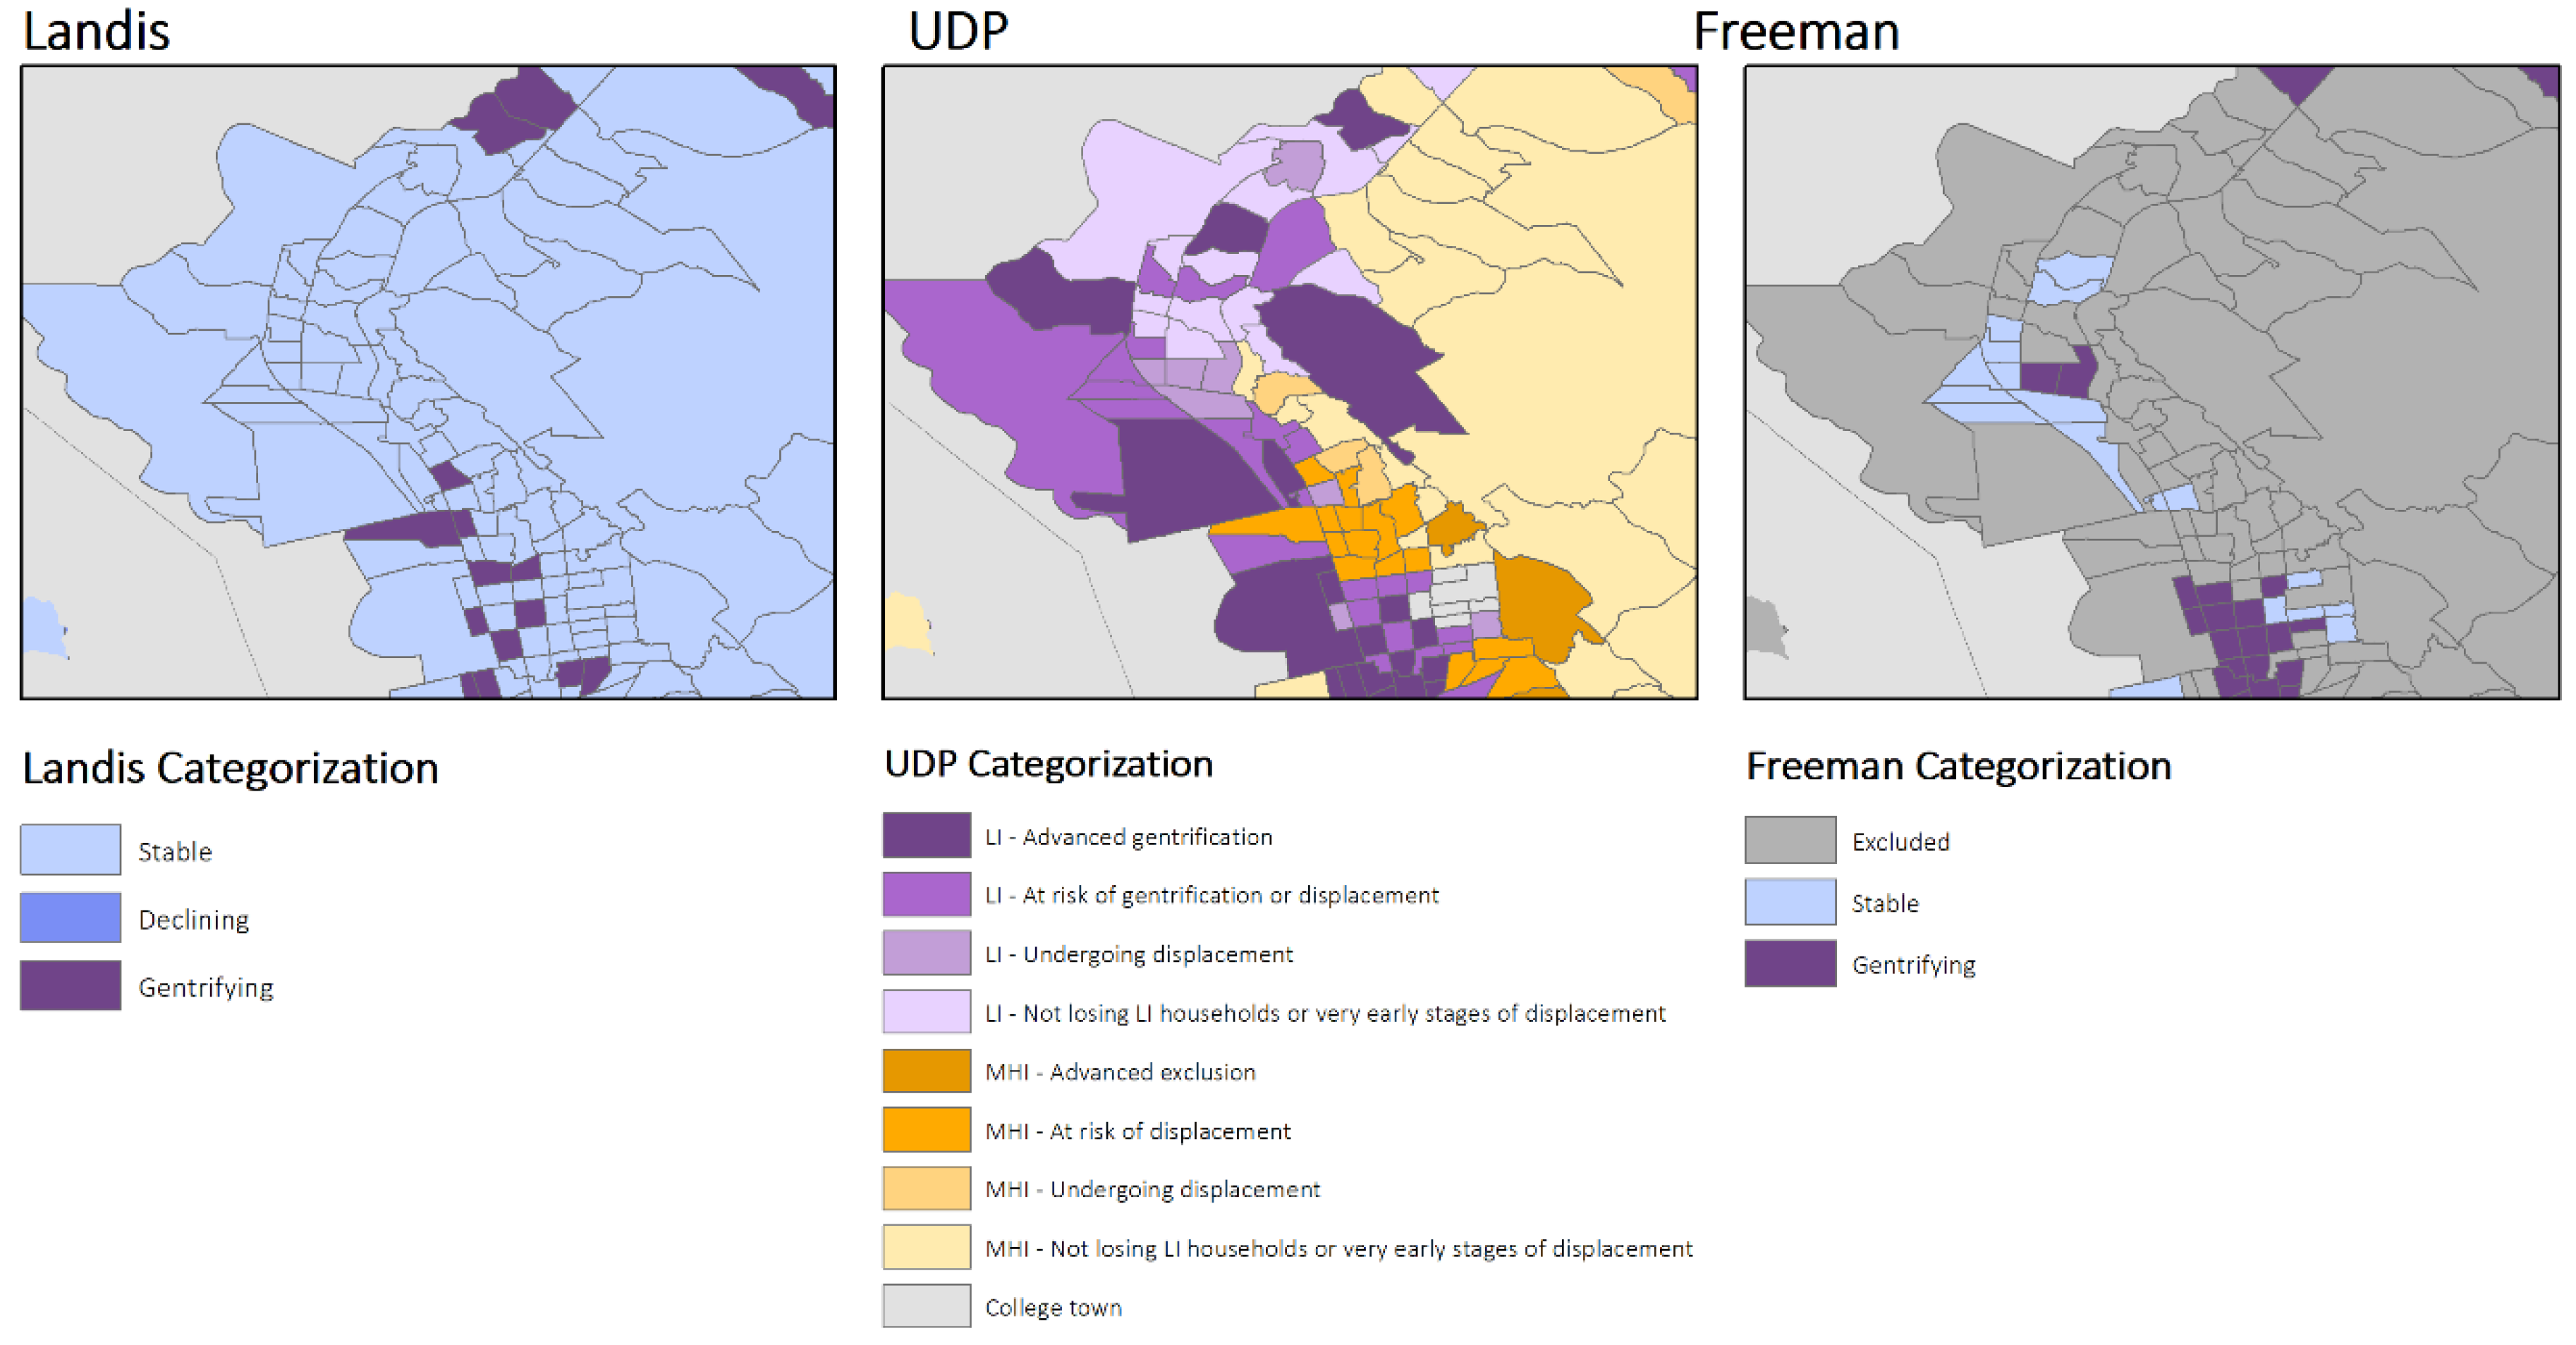
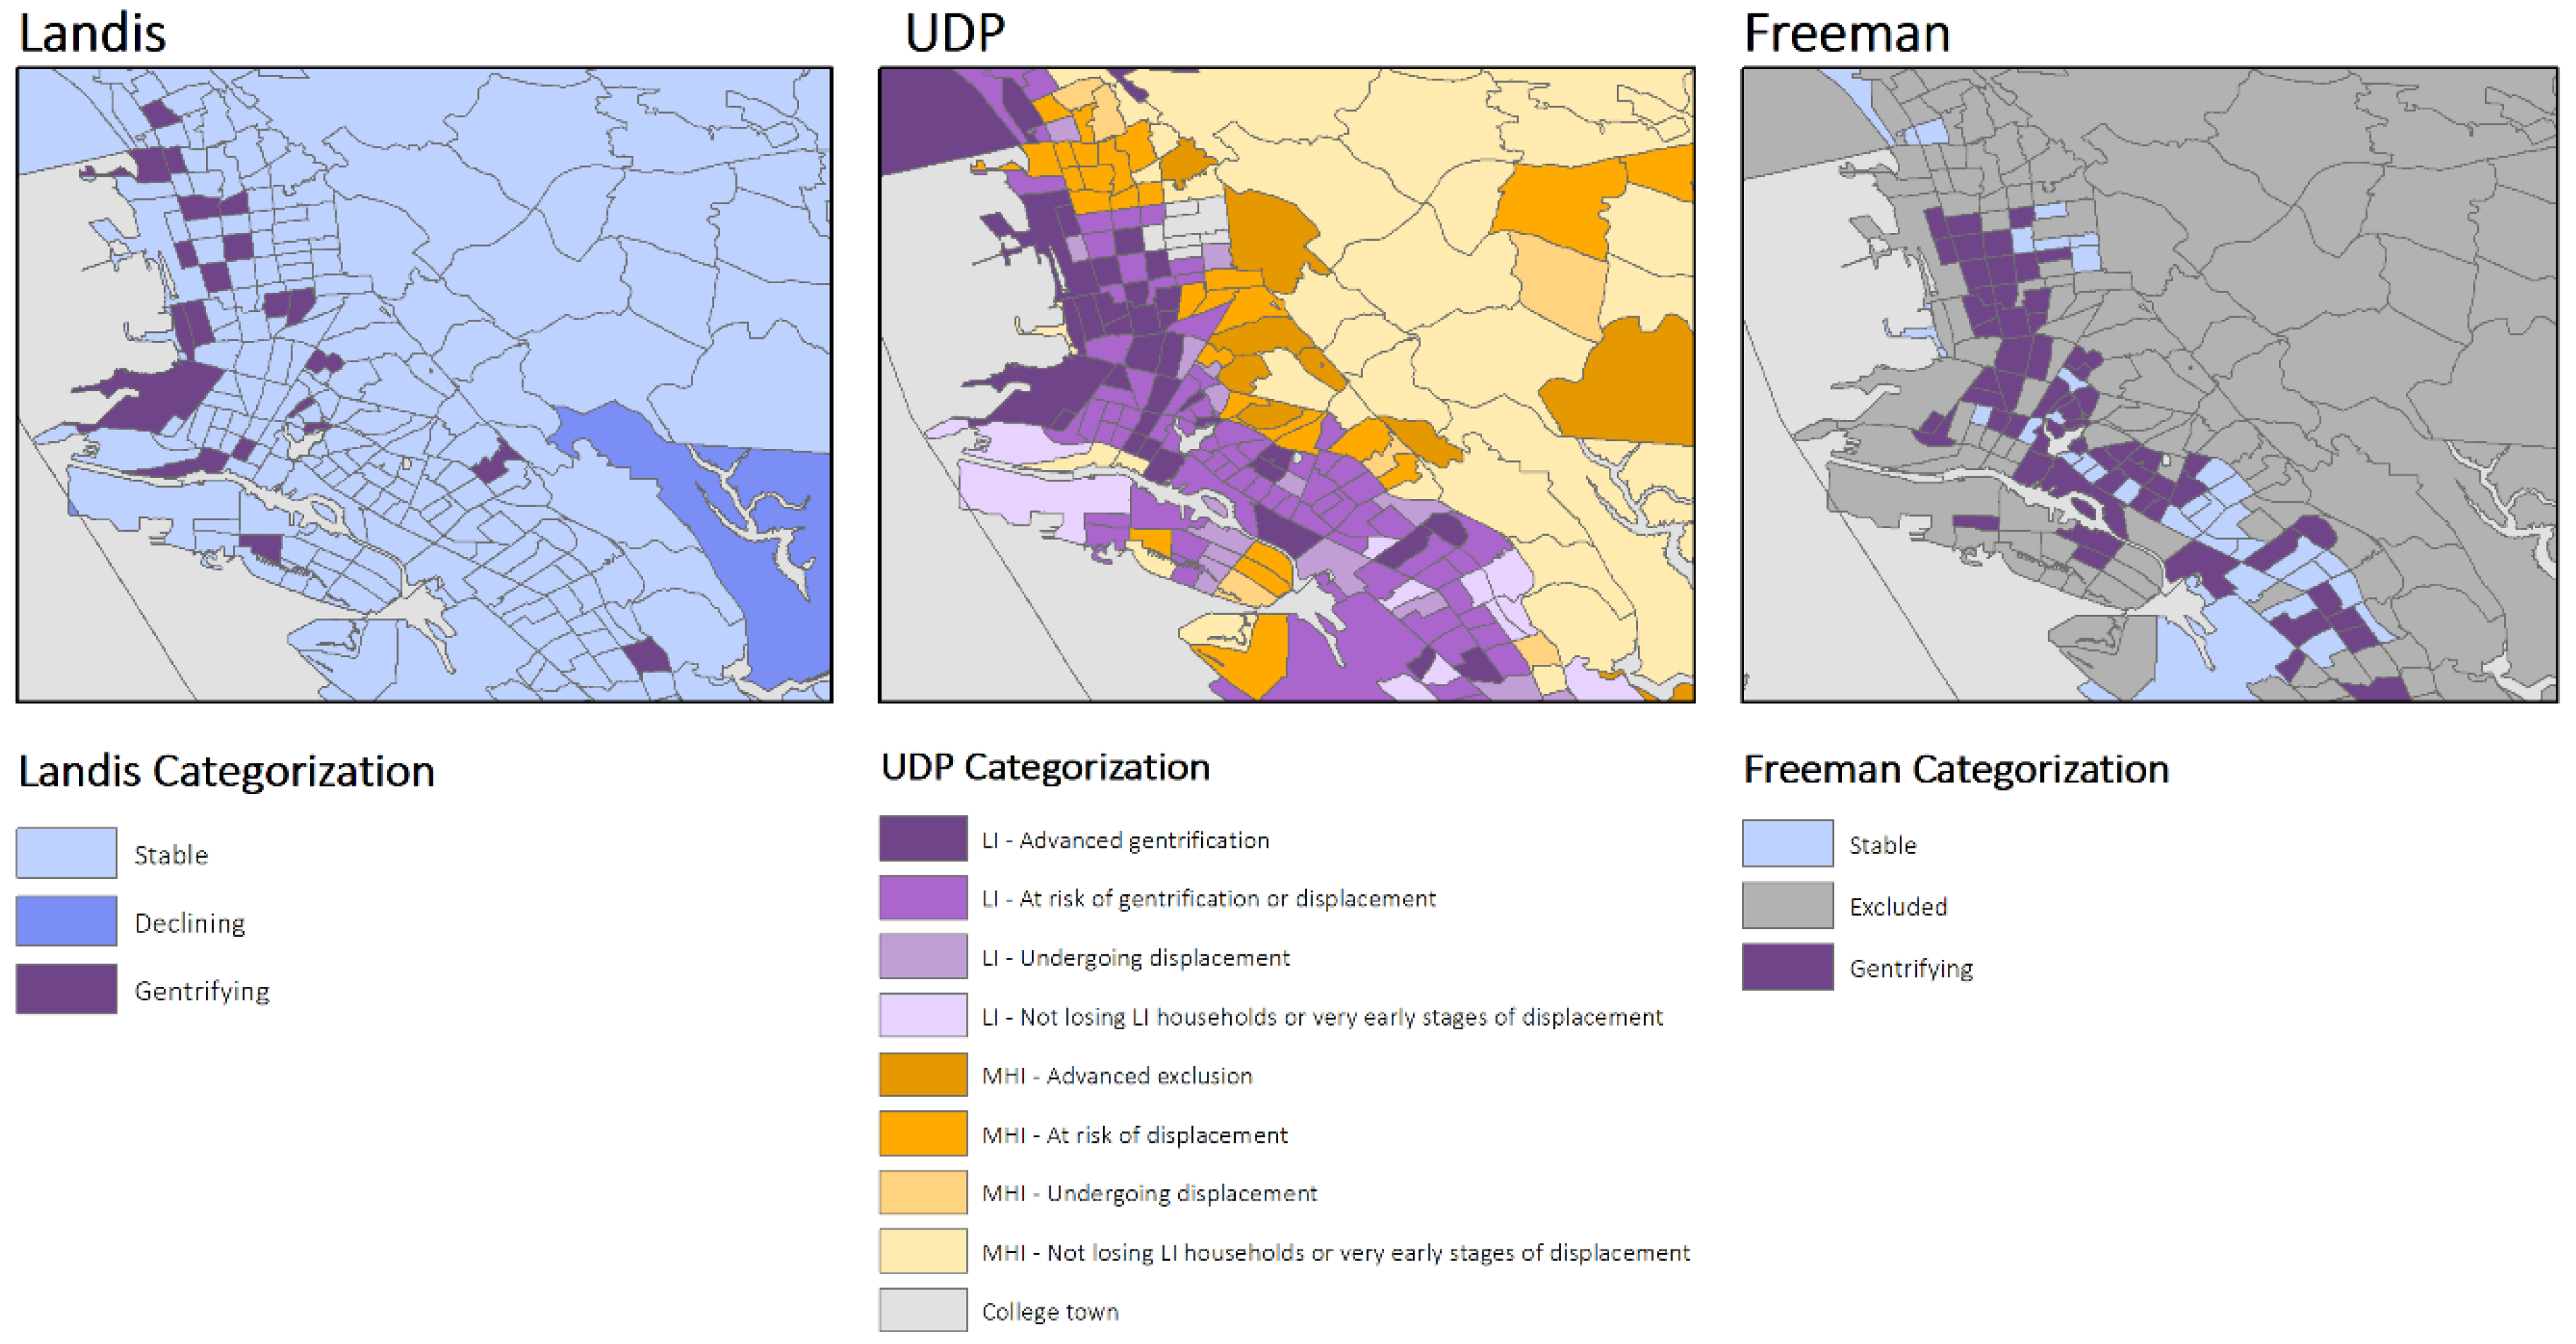
3. Results
4. Discussion
5. Conclusions
Supplementary Materials
Author Contributions
Funding
Acknowledgments
Conflicts of Interest
References
- Diez Roux, A.V.; Mair, C. Neighborhoods and health. Ann. N. Y. Acad. Sci. 2010, 1186, 125–145. [Google Scholar] [CrossRef] [Green Version]
- Arias, E.; Escobedo, L.A.; Kennedy, J.; Fu, C.; Cisewski, J. US small-area life expectancy estimates project: Methodology and results summary. Vital Health Stat. 2 2018, 181, 1–40. [Google Scholar]
- Meijer, M.; Röhl, J.; Bloomfield, K.; Grittner, U. Do neighborhoods affect individual mortality? A systematic review and meta-analysis of multilevel studies. Soc. Sci. Med. 2012, 74, 1204–1212. [Google Scholar] [CrossRef]
- Truong, K.D.; Ma, S. A systematic review of relations between neighborhoods and mental health. J. Ment. Health Policy Econ. 2006, 9, 137–154. [Google Scholar]
- Roux, A.V.D.; Mujahid, M.S.; Hirsch, J.A.; Moore, K.; Moore, L.V. The impact of neighborhoods on CV risk. Glob. Heart 2016, 11, 353–363. [Google Scholar] [CrossRef]
- Metcalfe, A.; Lail, P.; Ghali, W.A.; Sauve, R.S. The association between neighbourhoods and adverse birth outcomes: A systematic review and meta-analysis of multi-level studies. Paediatr. Perinat. Epidemiol. 2011, 25, 236–245. [Google Scholar] [CrossRef]
- Mujahid, M.S.; Moore, L.V.; Petito, L.C.; Kershaw, K.N.; Watson, K.; Roux, A.V.D. Neighborhoods and racial/ethnic differences in ideal cardiovascular health (the Multi-Ethnic Study of Atherosclerosis). Health Place 2017, 44, 61–69. [Google Scholar] [CrossRef] [Green Version]
- LaVeist, T.; Pollack, K.; Thorpe, R., Jr.; Fesahazion, R.; Gaskin, D. Place, not race: Disparities dissipate in southwest Baltimore when blacks and whites live under similar conditions. Health Aff. 2011, 30, 1880–1887. [Google Scholar] [CrossRef]
- Williams, D.R.; Collins, C. Racial residential segregation: A fundamental cause of racial disparities in health. Public Health Rep. 2001, 116, 404–416. [Google Scholar] [CrossRef]
- Dankwa-Mullan, I.; Pérez-Stable, E.J. Addressing health disparities is a place-based issue. Am. J. Public Health 2016, 106, 637–639. [Google Scholar] [CrossRef]
- Amaro, H. The action is upstream: Place-based approaches for achieving population health and health equity. Am. J. Public Health 2014, 104, 964. [Google Scholar] [CrossRef] [PubMed]
- Beauregard, R.A. The chaos and complexity of gentrification. In Gentrification of the City; Routledge: London, UK, 2013; pp. 51–71. [Google Scholar]
- Kohn, M. What is wrong with gentrification? Urban Res. Pract. 2013, 6, 297–310. [Google Scholar] [CrossRef]
- Atkinson, R. Does Gentrification Help or Harm Urban Neighbourhoods?: An Assessment of the Evidence-Base in the Context of New Urban Agenda; ESRC Centre for Neighbourhood Research Glasgow: Bristol, UK, 2002; Volume 5. [Google Scholar]
- Freeman, L. Displacement or succession? Residential mobility in gentrifying neighborhoods. Urban Aff. Rev. 2005, 40, 463–491. [Google Scholar] [CrossRef]
- Hwang, J. Pioneers of gentrification: Transformation in global neighborhoods in Urban America in the late twentieth century. Demography 2016, 53, 1–25. [Google Scholar] [CrossRef] [PubMed]
- Smith, N. Gentrification. In The Encyclopedia of Housing; Van Vliet, W., Ed.; Taylor & Francis: London, UK, 1998; pp. 198–201. [Google Scholar]
- Centre for Urban Studies at University College London (UCL). London: Aspects of Change; MacGibbon & Kee: London, UK, 1964. [Google Scholar]
- Centers for Disease Control and Prevention. Health Effects of Gentrification. Available online: https://www.cdc.gov/healthyplaces/healthtopics/gentrification.htm (accessed on 25 June 2019).
- Werth, A.; Marienthal, E. ‘Gentrification’ as a grid of meaning: On bounding the deserving public of Oakland First Fridays. City 2016, 20, 719–736. [Google Scholar] [CrossRef]
- Mehdipanah, R.; Manzano, A.; Borrell, C.; Malmusi, D.; Rodriguez-Sanz, M.; Greenhalgh, J.; Muntaner, C.; Pawson, R. Exploring complex causal pathways between urban renewal, health and health inequality using a theory-driven realist approach. Soc. Sci. Med. 2015, 124, 266–274. [Google Scholar] [CrossRef] [PubMed]
- Holsten, J.E. Obesity and the community food environment: A systematic review. Public Health Nutr. 2009, 12, 397–405. [Google Scholar] [CrossRef]
- Sallis, J.F.; Floyd, M.F.; Rodríguez, D.A.; Saelens, B.E. Role of built environments in physical activity, obesity, and cardiovascular disease. Circulation 2012, 125, 729–737. [Google Scholar] [CrossRef]
- Landis, J.D. Tracking and explaining neighborhood socioeconomic change in US metropolitan areas between 1990 and 2010. Hous. Policy Debate 2015, 26, 2–52. [Google Scholar] [CrossRef]
- Dangschat, J. Gentrification in Hamburg. In Urban Housing for the Better-Off: Gentrification in Europe; Van Weesep, J., Musterd, S., Eds.; Stedelijke: Netwerken, Utrecht, 1991; pp. 63–88. [Google Scholar]
- Bates, L.K. Gentrification and Displacement Study: Implementing an Equitable Inclusive Development Strategy in the Context of Gentrification; Urban Studies and Planning Faculty Publications and Presentations; Portland State University: Portland, OR, USA, 2013. [Google Scholar]
- Zuk, M. Regional Early Warning System for Displacement; Center for Community Innovation, University of California: Berkeley, CA, USA, 2015. [Google Scholar]
- Barton, M. An exploration of the importance of the strategy used to identify gentrification. Urban Stud. 2016, 53, 92–111. [Google Scholar] [CrossRef]
- Whittle, H.J.; Palar, K.; Hufstedler, L.L.; Seligman, H.K.; Frongillo, E.A.; Weiser, S.D. Food insecurity, chronic illness, and gentrification in the San Francisco Bay Area: An example of structural violence in United States public policy. Soc. Sci. Med. 2015, 143, 154–161. [Google Scholar] [CrossRef] [PubMed] [Green Version]
- PolicyLink; PERE. An Equity Profile of the San Francisco Bay Area Region; PolicyLink and USC Program for Environmental & Regional Equity: Oakland, CA, USA, 2015. [Google Scholar]
- Hammel, D.J.; Wyly, E.K. A model for identifying gentrified areas with census data. Urban Geogr. 1996, 17, 248–268. [Google Scholar] [CrossRef]
- Freeman, L. Neighbourhood diversity, metropolitan segregation and gentrification: What are the links in the US? Urban Stud. 2009, 46, 2079–2101. [Google Scholar] [CrossRef]
- Gentrification in America Report. Available online: https://www.governing.com/gov-data/census/gentrification-in-cities-governing-report.html (accessed on 3 May 2019).
- Izenberg, J.M.; Mujahid, M.S.; Yen, I.H. Gentrification and binge drinking in California neighborhoods: It matters how long you’ve lived there. Drug Lcohol Depend. 2018, 188, 1–9. [Google Scholar] [CrossRef] [PubMed]
- Gibbons, J.; Barton, M.S. The association of minority self-rated health with black versus white gentrification. J. Urban Health 2016, 93, 909–922. [Google Scholar] [CrossRef] [PubMed]
- Gibbons, J.; Barton, M.; Brault, E. Evaluating gentrification’s relation to neighborhood and city health. PLoS ONE 2018, 13, e0207432. [Google Scholar] [CrossRef] [PubMed]
- Hwang, J. Gentrification in changing cities: Immigration, new diversity, and racial inequality in neighborhood renewal. Ann. Am. Acad. Political Soc. Sci. 2015, 660, 319–340. [Google Scholar] [CrossRef]


| Not Gentrifying | Gentrifying | Excluded | |
|---|---|---|---|
| (N = 92) | (N = 97) | (N = 1391) | |
| Population (#, 2013) | 384,152 | 363,446 | 6,509,903 |
| % of Total Population Living in Category (2013) | 5.3% | 5.0% | 89.7% |
| Median Income (2013) | $39,078 | $48,774 | $90,635 |
| Change in median household income (%, 2000–2013) | −11% | 4% | −6% |
| Low-income households (%, 2013) | 67% | 59% | 38% |
| Change in proportion of low-income households (%, 2000–2013) | 3% | −9% | 3% |
| Non-white population (%, 2013) | 75% | 67% | 55% |
| Change in non-white population (%, 2000–2013) | 7% | −4% | 16% |
| Adults (25+) with college degree (%, 2013) | 22% | 37% | 44% |
| Change in college-educated adult population (%, 2000–2013) | 4% | 32% | 12% |
| Renter households (%, 2013) | 69% | 69% | 40% |
| Change in renter households (%, 2000–2013) | 6% | −1% | 3% |
| Declining (N = 56) | Stable (N = 1442) | Gentrifying (N = 82) | |
|---|---|---|---|
| Population (#, 2013) | 234,666 | 6,693,536 | 329,299 |
| % of Total Population Living in Category (2013) | 3% | 92% | 5% |
| Median Income (2013) | $72,918 | $85,340 | $88,486 |
| Change in median household income (%, 2000–2013) | −35% | −7% | 42% |
| Low-income households (%, 2013) | 44% | 41% | 36% |
| Change in proportion of low-income households (%, 2000–2013) | 53% | 8% | −25% |
| Non-white population (%, 2013) | 64% | 56% | 53% |
| Change in non-white population (%, 2000–2013) | 31% | 23% | 10% |
| Adults (25+) with college degree (%, 2013) | 35% | 43% | 50% |
| Change in college-educated adult population (%, 2000–2013) | 2% | 22% | 55% |
| Renter households (%, 2013) | 38% | 43% | 51% |
| Change in renter households (%, 2000–2013) | 60% | 14% | −5% |
| Low Income | Medium/High Income | |||||||
|---|---|---|---|---|---|---|---|---|
| Not Losing Low-Income Households or Very Early Stages of Displacement (N = 329) | At Risk (N = 290) | Undergoing (N = 63) | Advanced (N = 149) | Not Losing Low-Income Households or Very Early Stages of Displacement (N = 476) | At Risk (N = 132) | Undergoing (N = 102) | Advanced (N = 28) | |
| Population (#, 2013) | 1,528,330 | 1,324,550 | 279,821 | 660,038 | 2,259,243 | 570,934 | 465,156 | 119,329 |
| % of Total Population Living in Category (2013) | 21% | 18% | 4% | 9% | 31% | 8% | 6% | 2% |
| Median Income (2013) | $60,727 | $55,15 | $66,208 | $71,264 | $112,466 | $102,540 | $110,760 | $175,259 |
| Change in median household income (%, 2000–2013) | −19% | −13% | 3% | 10% | −4% | 7% | 8% | 4% |
| Low-income households (%, 2013) | 54% | 56% | 50% | 47% | 27% | 30% | 27% | 13% |
| Change in proportion of low-income households (%, 2000–2013) | 20% | 11% | −8% | −6% | 15% | −4% | −18% | −18% |
| Non-white population (%, 2013) | 66% | 67% | 60% | 65% | 48% | 41% | 45% | 41% |
| Change in non-white population (%, 2000–2013) | 22% | 14% | 23% | 3% | 33% | 21% | 35% | 31% |
| Adults (25+) with college degree (%, 2013) | 27% | 31% | 36% | 44% | 51% | 63% | 54% | 75% |
| Change in college-educated adult population (%, 2000–2013) | 18% | 26% | 27% | 54% | 16% | 17% | 24% | 15% |
| Renter households (%, 2013) | 49% | 60% | 57% | 61% | 25% | 47% | 29% | 11% |
| Change in renter households (%, 2000–2013) | 21% | 9% | 6% | −1% | 25% | 1% | -2% | 35% |
| Landis | Freeman | ||||||
|---|---|---|---|---|---|---|---|
| Declining (N = 56) | Stable (N = 1442) | Gentrifying (N = 82) | Not Gentrifying (N = 92) | Gentrifying (N = 97) | Excluded (N = 1391) | ||
| Low Income | Not losing low-income households or very early stages of displacement (N = 329) | 55.4% | 20.6% | 3.7% | 21.7% | 5.15% | 21.8% |
| At risk of gentrification or displacement (N = 290) | 5.4% | 20% | 1.2% | 53.3% | 44.3% | 14.2% | |
| Undergoing displacement (N = 63) | 0.0% | 4.2% | 3.7% | 9.8% | 15.5% | 2.8% | |
| Advanced gentrification (N = 149) | 5.4% | 7.8% | 42.0% | 4.4% | 33.0% | 8.1% | |
| Medium/High Income | Not losing low-income households or very early stages of displacement (N = 476) | 30.4% | 31.1% | 17.3% | 4.4% | 0.0% | 34.0% |
| At risk of displacement (N = 132) | 1.8% | 8.0% | 21.0% | 0.0% | 1.0% | 9.4% | |
| Undergoing displacement (N = 102) | 1.8% | 6.4% | 11.1% | 0.0% | 0.0% | 7.3% | |
| Advanced exclusion (N = 28) | 0.0% | 1.9% | 0.0% | 0.0% | 0.0% | 2.1% | |
| College-town | N/A (N = 11) | 0.0% | 0.0% | 0.0% | 6.5% | 1.0% | 1.0% |
© 2019 by the authors. Licensee MDPI, Basel, Switzerland. This article is an open access article distributed under the terms and conditions of the Creative Commons Attribution (CC BY) license (http://creativecommons.org/licenses/by/4.0/).
Share and Cite
Mujahid, M.S.; Sohn, E.K.; Izenberg, J.; Gao, X.; Tulier, M.E.; Lee, M.M.; Yen, I.H. Gentrification and Displacement in the San Francisco Bay Area: A Comparison of Measurement Approaches. Int. J. Environ. Res. Public Health 2019, 16, 2246. https://doi.org/10.3390/ijerph16122246
Mujahid MS, Sohn EK, Izenberg J, Gao X, Tulier ME, Lee MM, Yen IH. Gentrification and Displacement in the San Francisco Bay Area: A Comparison of Measurement Approaches. International Journal of Environmental Research and Public Health. 2019; 16(12):2246. https://doi.org/10.3390/ijerph16122246
Chicago/Turabian StyleMujahid, Mahasin S., Elizabeth Kelley Sohn, Jacob Izenberg, Xing Gao, Melody E. Tulier, Matthew M. Lee, and Irene H. Yen. 2019. "Gentrification and Displacement in the San Francisco Bay Area: A Comparison of Measurement Approaches" International Journal of Environmental Research and Public Health 16, no. 12: 2246. https://doi.org/10.3390/ijerph16122246