Article

Application of Oligonucleotide Microarrays for Bacterial Source Tracking of Environmental Enterococcus sp. Isolates

by
Karl J. Indest
1,*,
Kelley Betts
3 and
John S. Furey
2
1
U.S. Army Engineer Research and Development Center, Waterways Experiment Station, 3909 Halls Ferry Road, Vicksburg, MS 39180, USA
2
CSC, 3530 Manor Drive, Vicksburg, MS 39180, USA
3
Analytical Services, Inc., 555 Sparkman Drive, Huntsville, Alabama 35816, USA
*
Author to whom correspondence should be addressed.
Int. J. Environ. Res. Public Health 2005, 2(1), 175-185; https://doi.org/10.3390/ijerph2005010175
Submission received: 15 November 2004 / Accepted: 6 February 2005 / Published: 30 April 2005

Abstract

:
In an effort towards adapting new and defensible methods for assessing and managing the risk posed by microbial pollution, we evaluated the utility of oligonucleotide microarrays for bacterial source tracking (BST) of environmental Enterococcus sp. isolates derived from various host sources. Current bacterial source tracking approaches rely on various phenotypic and genotypic methods to identify sources of bacterial contamination resulting from point or non-point pollution. For this study Enterococcus sp. isolates originating from deer, bovine, gull, and human sources were examined using microarrays. Isolates were subjected to Box PCR amplification and the resulting amplification products labeled with Cy5. Fluorescent-labeled templates were hybridized to in-house constructed nonamer oligonucleotide microarrays consisting of 198 probes. Microarray hybridization profiles were obtained using the ArrayPro image analysis software. Principal Components Analysis (PCA) and Hierarchical Cluster Analysis (HCA) were compared for their ability to visually cluster microarray hybridization profiles based on the environmental source from which the Enterococcus sp. isolates originated. The PCA was visually superior at separating origin-specific clusters, even for as few as 3 factors. A Soft Independent Modeling (SIM) classification confirmed the PCA, resulting in zero misclassifications using 5 factors for each class. The implication of these results for the application of random oligonucleotide microarrays for BST is that, given the reproducibility issues, factor-based variable selection such as in PCA and SIM greatly outperforms dendrogram-based similarity measures such as in HCA and K-Nearest Neighbor KNN.

Introduction

As the number of beach closings and advisories continue to rise, so does the public’s concern regarding microbial pollution in recreational waters. In a survey of more than 230 U.S. coastal and Great Lake communities, there were at least a total of 13,410 days of beach closings or advisories during 2001 [1]. The majority of beach closings and advisories were based on the presence of elevated levels of fecal contamination as measured by fecal bacterial indicators, such as Escherichia coli and Enterococci. Under section 303(d) of the 1972 Clean Water Act, states, territories, and authorized tribes are required to develop pollutant-specific lists of impaired waters and may be required to establish a total maximum daily load (TMDL) for those impaired waters [2]. TMDLs specify the maximum amount of a pollutant that a water body can receive and still meet water quality standards. Fecal coliforms are frequently listed as impairment on many states 303(d) list of associated water-quality impairments [3]. While TMDLs have historically focused on chemical impairments, more attention is now being focused on microbial impairments. Recently, the EPA published an extensive protocol for developing pathogen TDMLs [2]. Currently, there are several regional pilot projects underway aimed at establishing fecal coliform TMDLs for impacted watersheds [4].
Reducing the loads of fecal contamination can be problematic because often the pollution sources are not known or have non-point sources. Non-point sources of microbial fecal pollution are mobilized by rain/snow events and can include urban litter, agricultural runoff, failing sewer lines, malfunctioning septic systems, and domestic and wildlife excrement. Implementation of best management practices (BMPs) for TMDL compliance is dependent upon accurately identifying the source(s) of the impairment. Source tracking of non-point sources of microbial pollution, specifically indicator bacteria, has been generically referred to as bacterial source tracking (BST) [5] or microbial source tracking (MST) [6,7] and can be accomplished using a collection of multidisciplinary bacterial sub-typing methods. In addition to determining the origin of fecal contamination, BST methods can differentiate between human and non-human sources of microbial pollution [6,7], which can aid in generating more accurate risk assessments for managing the risk posed by microbial pollution.
BST methods can be divided into two general groups, 1) phenotypic or biochemical-based methods, and 2) genotypic or molecular-based methods [7]. Of the phenotypic methods, multiple antibiotic resistance (MAR) analysis has been reported the most and has been shown to be successful in 1) discriminating human and animal sources of E. coli or fecal streptococci [8, 9, 10] and, 2) further discriminating animal sources by animal type [11]. This method involves isolating and culturing target indicator organisms from various sources and locations to create a reference library. These isolates are subsequently replica plated on selective media containing multiple antibiotics at a range of concentrations. Antibiotic susceptibilities are characterized, subjected to discriminant analysis and compared to a reference antibiotic susceptibility library to determine identity. Reliability of the method is determined by analyzing isolates as both standards and as unknowns. The number of isolates assigned to the correct categories divided by the total number of isolates is referred to as the average rate of correct classification (ARCC) [12]. ARCC values for this method range from 62% to 94% when individuals are compared. Despite the success of this method in simple watersheds [11], some researchers have indicated that MAR lacks the sensitivity, reproducibility, and host specificity that is needed for BST [13].
In contrast to the limited number of phenotypic sub-typing methods, numerous genotypic methods have been described including ribotyping [14, 15, 16], length heterogeneity polymerase chain reaction (LH-PCR), terminal restriction fragment length polymorphism (T-RFLP) PCR [17, 18], repetitive PCR (rep-PCR) [19], denaturing gradient gel electrophoresis (DGGE) [20, 21], pulsed-field gel electrophoresis (PFGE) [22, 23, 24], and amplified fragment length polymorphism (AFLP) [25]. Most of these molecular methods rely on PCR to interrogate a fraction of the target organisms’ available genetic information. PCR amplification products are subsequently resolved by gel-electrophoresis and the resulting banding pattern may be compared to a reference library to determine the identity of the organism. ARCC values can approach 100% when using some of these methods, such as rep-PCR [19]. Despite the success of genotypic methods, there is an ongoing need in BST for increased resolving power to discriminate between closely related microorganisms. Newer technologies, like DNA microarrays, which have been employed for various environmental microbiology applications [26], could potentially increase the resolving power of BST analysis [27]. For example, DNA microarrays interrogate DNA samples at the DNA sequence level. In contrast, gel-based methods rely on DNA fragment sizing; a method in which co-migration of heterogeneous DNA sequence populations of similar sized fragments is possible. Unlike gel-based methods, which rely on size fractionation of banding patterns that are subject to positional variation, DNA microarray profiles are comprised of physically immobilized, addressable spots. In addition, the resolving power of the microarray can be further improved by increasing the amount of oligonucleotide elements on the micro array.
The methods and data analysis algorithms for the application of DNA microarrays towards BST are just starting to be developed. Recently, oligonucleotide microarrays were evaluated for their ability to differentiate 25 closely related Salmonella isolates [27]. Previously, the same authors used a similar microarray approach to discriminate closely related Xanthomonas pathovars [28]. In this study, we aim to build upon these findings and further the development of oligonucleotide microarrays for use in BST. Here we report the application of a microarray, consisting of 198 oligonucleotide elements, to discriminate 17 unique environmental isolates of Enterococcus sp. based on the host source of the bacteria.

Materials and Methods

Bacterial Isolates

A collection of 51 Enterococcus sp. isolates originating from bovine, deer, gull, and human sources were provided by Dr. Shiao Wang (University of Southern Mississippi; Hattiesburg, MS). Details of the isolation and characterization of these strains have been described in detail elsewhere [29]. Isolates were routinely propagated in brain heart infusion liquid media (Becton Dickenson, San Jose, CA). High molecular weight genomic DNA for PCR analysis was obtained from each isolate using Qiagen’s DNeasy Tissue Kit (Qiagen, Valencia, CA).

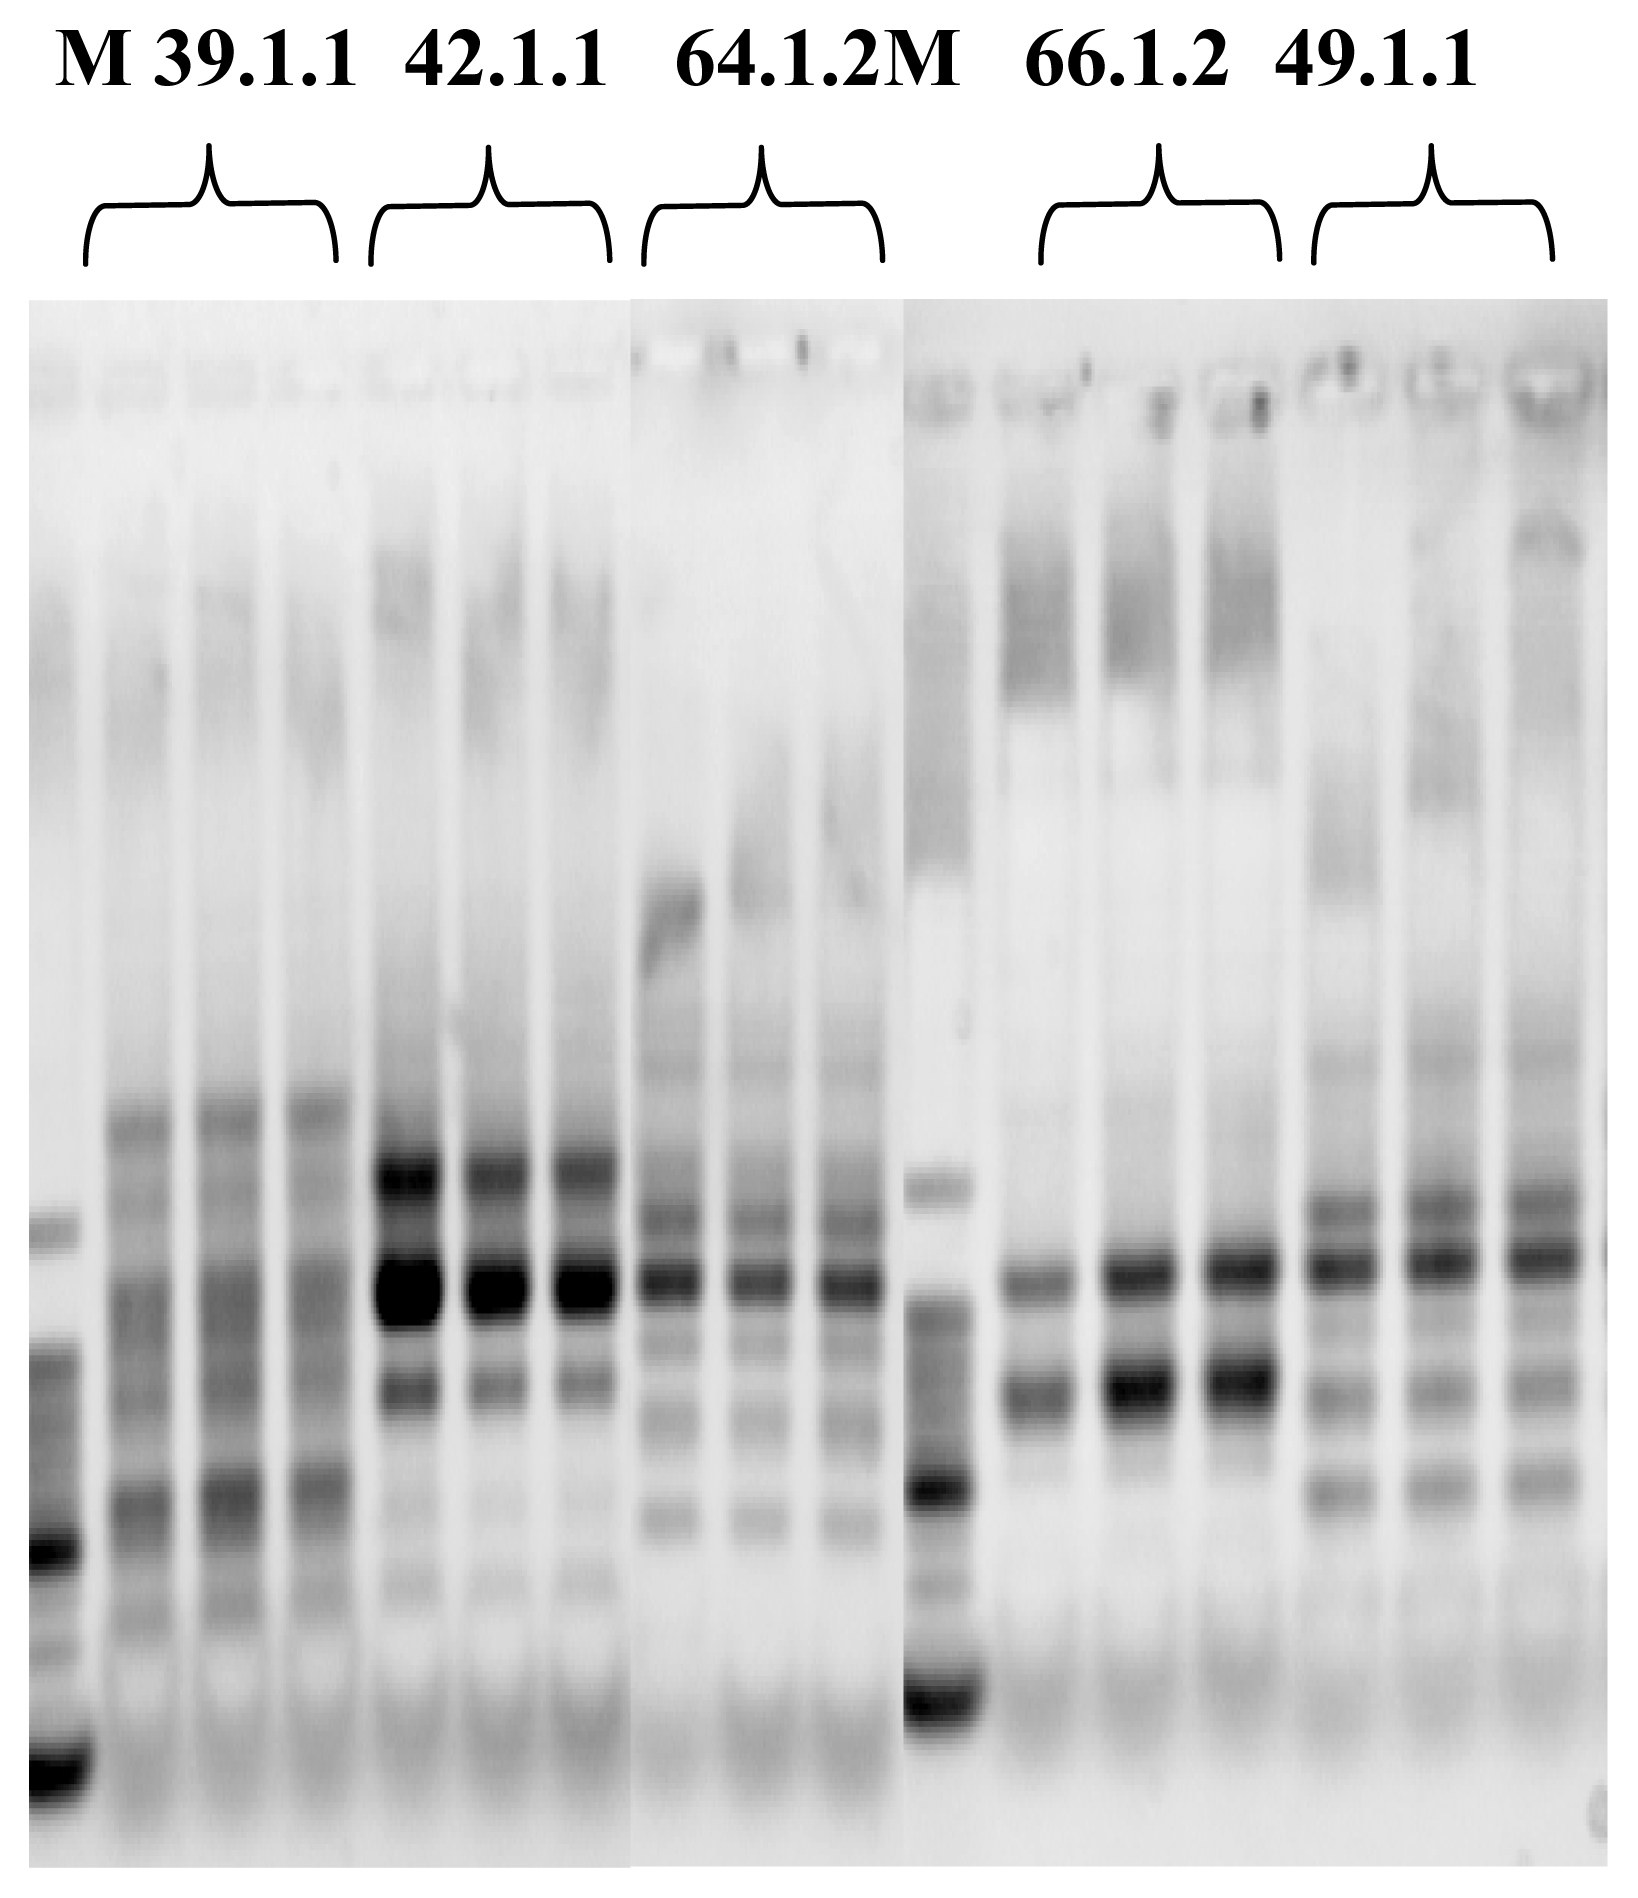
PCR Amplification and Labelling

PCR primer BOX A 1R 5′ CTA CGG CAA GGC GAC GCT GAC G 3′, was custom synthesized by Qiagen and targeted repetitive extragenic palindromic BOX sequences [19]. Primer BOX A 1R was used to amplify select portions of the Enterococcus sp. isolate genomes to be used as target DNAs for microarray analysis. All PCR reactions and their subsequent microarray analysis were carried out in triplicate. Final reaction conditions were as follows: 10mM Tris, pH 8.3, 50mM KCl2, 4.5mM MgCl2, 0.001 (w/v) gelatin, 0.2mM dNTP’s, 2μM BOX A 1R primer, and 5U Taq polymerase (Promega, Madison, WI) in a final reaction volume of 100μl. A total of 100ng of genomic DNA was used as template for each reaction. Amplification was carried out in a MJ Research Tetrad thermocycler (MJ Research, Inc., Waltham, MA) programmed as follows: initial step at 95°C for 2 min followed by 35 cycles of: 94°C for 3 sec, 92°C for 30 sec, 50°C for 60 sec, 65°C for 8 min and finally cooling to 4°C at the end of the last cycle. Ten microliter portions from each reaction were electrophoresed through a 1.0% agarose gel in 1x TAE (40mM Tris-Acetate, 1mM EDTA) running buffer and stained with Sybergold (Molecular Probes, Inc., Eugene, OR) for visualization to confirm amplification. The remaining portions of each amplification reaction were ethanol precipitated with sodium acetate [30] and the resulting air-dried DNA pellets were re-suspended in 20μl Millipore water.
PCR products were aminoallyl(aa)-labeled as described previously [31]. Briefly, 3.3μl (3μg/μl) of random hexamers (Invitrogen, Carlsbad, CA) were added to each of the re-suspended PCR products and the final volume brought up to 39μl. The sample was heated to 100°C for five minutes and immediately placed in an ice bath. Twenty units of DNA polymerase I Klenow fragment (New England BioLabs, Beverly MA), 5μl of EcoPol (Klenow) buffer (New England Biolabs), and 2μl of 3mM dNTP/aa-labeling mix [100mM each dNTP, 50 mM aa-dUTP (Ambion, Austin TX)] were added to the reaction and the reaction was incubated at 37°C overnight. The reaction was stopped by adding 5μl of 0.5M EDTA. Unincorporated aa-dUTPs and free amines were removed from each reaction using the QIA quick PCR purification (Qiagen) kit with the following modifications: PE wash buffer was replaced with a 5 mM KPO4, 80% ethanol solution and elution buffer was replaced with a 4mM KPO4 solution. Purified PCR templates were dried down in a vacuum centrifuge and resuspended in 4.5μl of 0.1M Na2CO3 buffer, pH 9.3. DNA samples were labeled with a Cy5 dye by adding 4.5μl of a Cy5 mono-Reactive Dye Pack solution (Amersham Biosciences, Piscataway, NJ) and allowing the reaction to proceed in the dark at room temperature for two hours. The reaction was stopped by the addition of 35μl of 100mM NaOAc. Free dye was removed from the samples by using the QIA quick PCR purification kit (Qiagen) according to the manufacture’s instructions. DNA samples were dried down and immediately processed for microarray analysis.

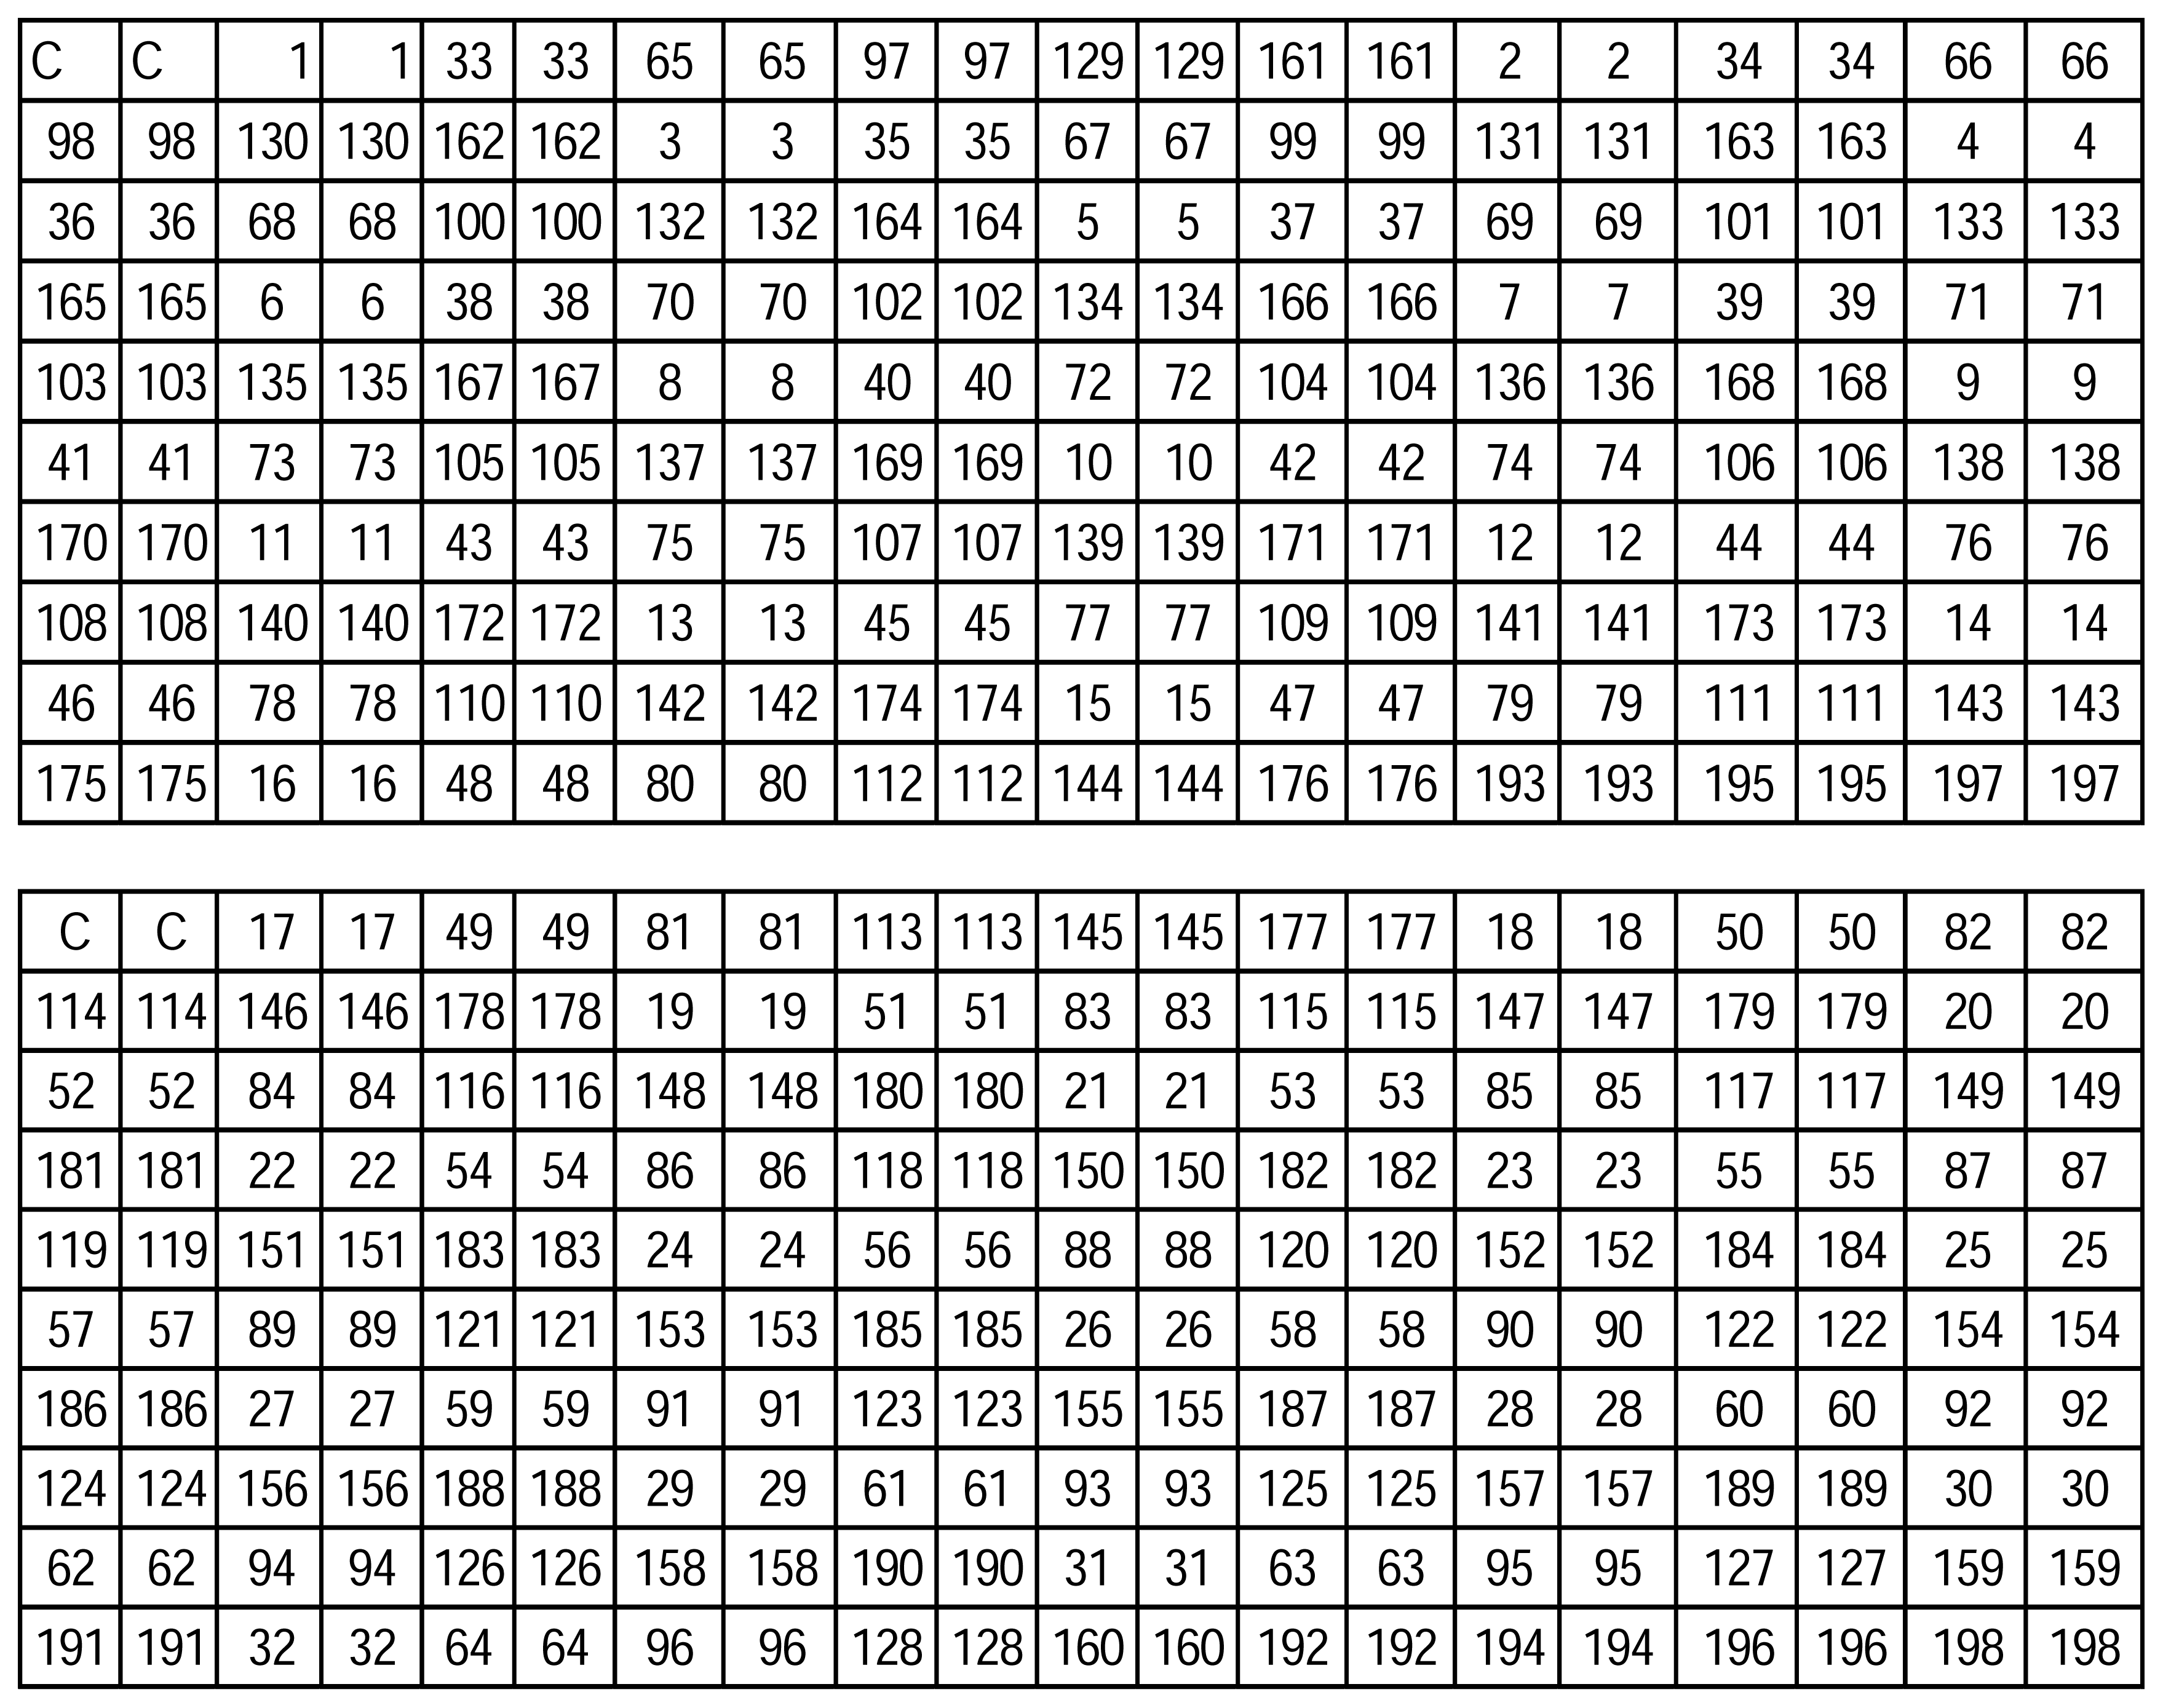
Microarray Oligonucleotide Probes and Fabrication

One hundred ninety eight 9mers (Table 1), with an amine-modification at the 5′ end, (Sigmagenosys, Woodlands, TX) were randomly selected from a list of 102,403 9mer sequences that conform to criteria described previously [28]. Briefly, 9mer sequences had GC contents between 44–55%, could not have: 1) four nucleotide (or higher) repeats, 2) inverted repeats three nucleotides (or higher), 3) dual-terminal inverted repeats of 3 nucleotides (or higher), and 4) single-terminal inverted repeats of three nucleotides or higher. In addition to these criteria, all 9mer sequence combinations that occurred in Enterococcus sp. rRNA genes present in GeneBank as of 5/03 were eliminated. A Cy3-labeled control oligonucleotide, 5′ TTG GCA GAA GCT ATG AAA CGA TAT GGG 3′, with an amine-modification at the 5′ end, was used as a positional reference and hybridization control.
Microarrays were fabricated on aldehyde-coated glass microscope slides (Telechem International, Inc., Sunnyvale, CA) using the BioRad VersArray ChipWriter (BioRad, Hercules, CA) equipped with SMP3 Stealth microspotting pins (Telechem Internation, Inc.). Prior to fabrication, amine-modified oligonucleotides were transferred to a 384-well plate (Whatman, Clifton, NJ) and diluted to a concentration of 80 μM in 50% dimethyl sulfoxide (DMSO). Probes were printed in duplicate, using a 2-pin configuration, at a relative humidity of 60%. The resulting grid pattern and corresponding oligonucleotide probe location is illustrated in Fig. 1. After printing, slides were baked for 45 minutes at 80°C, briefly washed with 0.2% SDS, and subsequently rinsed with reagent grade water. Free aldehyde groups were chemically blocked by soaking printed slides in a fresh NaBH4 solution [0.75g NaBH4 (Sigma, MO), 225 ml phosphate buffered saline (pH 7.0), 66.5ml 100% ethanol] for five minutes. Following chemical blocking, printed slides were momentarily dipped 3 times in 0.2% SDS, washed for one minute in reagent grade water, and individually spun dried in 50ml Falcon conical tubes (Fisher Scientific, MO) at 700rpm for 10 minutes in a tabletop centrifuge. Microarray substrates were stored at room temperature in a desiccator.

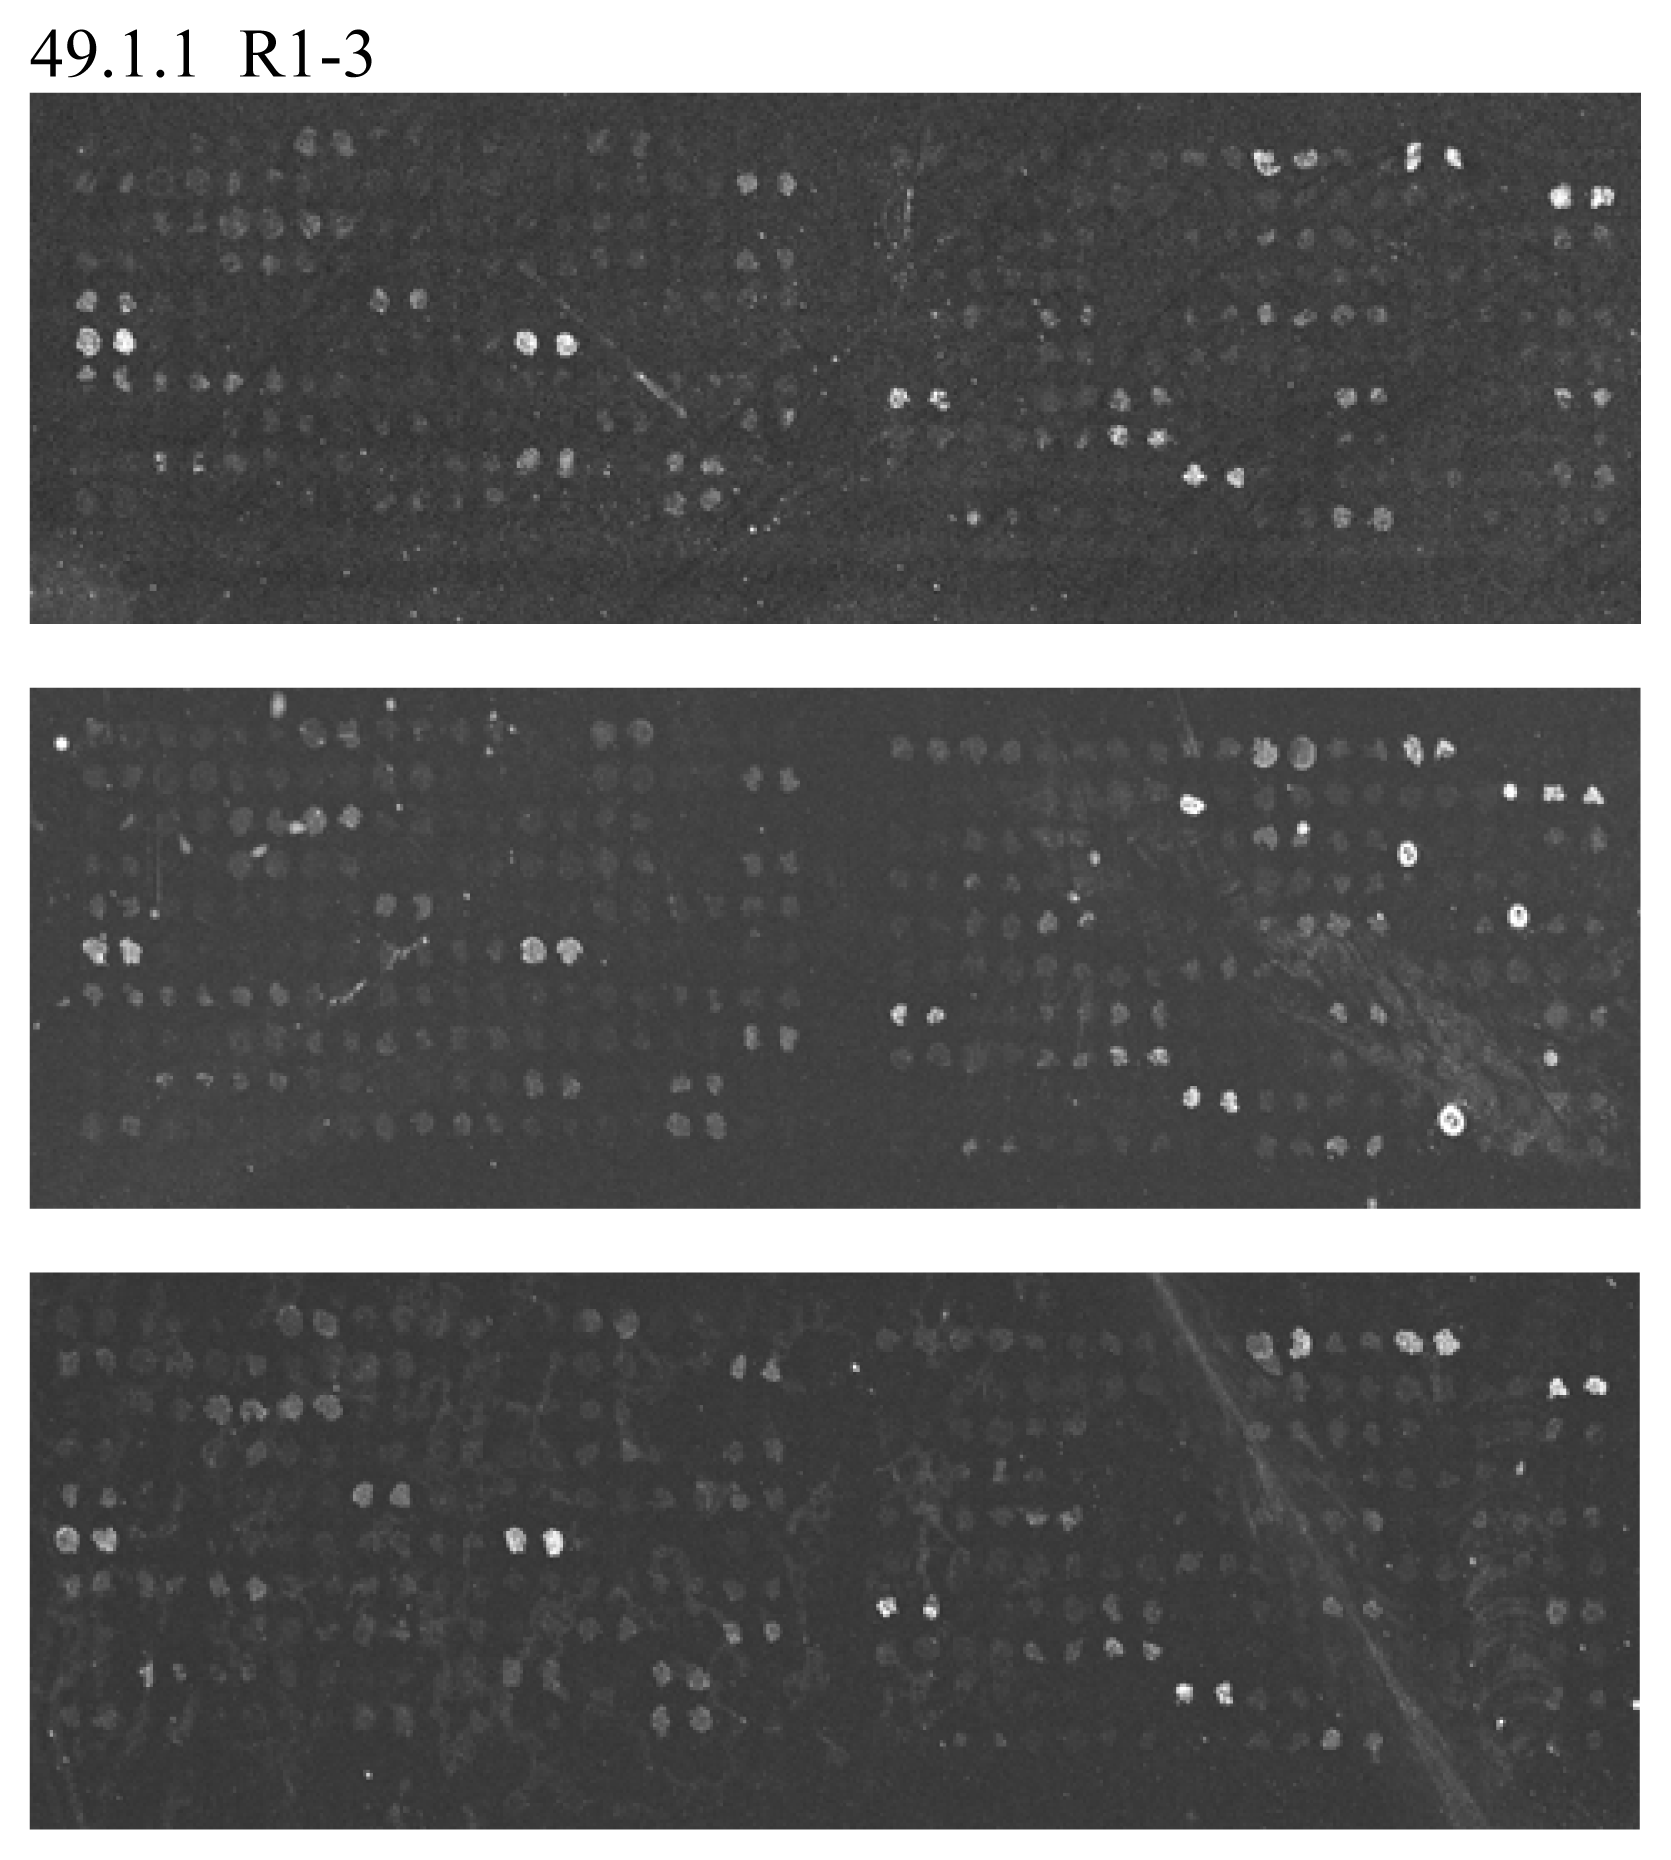
Microarray Hybridization

Prior to hybridization, printed slides were pre-hybridized in 0.1% SDS, 4X SSC (1X SSC, 0.15M NaCl, 0.015M trisodium citrate, pH 7.0), and 10mg/ml bovine serum albumin (BSA) in 50ml Falcon conical tubes at 40°C with slight agitation for 2 hours. Pre-hybridized slides were rinsed 5 times in reagent grade distilled water and chilled to 4°C on a solid metal platform. Cy5 aminoallyl-labelled DNA targets were resuspended in 15μl of 4X SSC, heated at 95°C for 5 min, and immediately placed on ice. The Cy3 labelled oligonucleotide, 5′CCC ATA TCG TTT CAT AGC TTC TGC CA 3′, was also included in the hybridization reaction (final concentration 0.6μM) as a control to hybridize with the control oligonucleotide attached to the microarray. Chilled hybridization reactions were pipetted on prechilled printed microarray slides, covered with array cover slips (PGC Scientifics, Gaitherburg, MD), and incubated overnight at 4°C as described previously [28]. Hybridized microarrays were gently rinsed in 4°C 4X SSC 5 times for 1 minute intervals followed by a final 30 second rinse in reagent grade water. Microarray slides were spun dried in 50 ml conical tubes as described above prior to scanning slides.

Image Analysis and Statistics

Processed microarray slides were scanned at 532nm and 635 nm using the VersArray Chipreader system (BioRad, Hercules, CA) configured at a 5μm resolution. Spot intensity data from the resulting 16-bit TIF images were initially extracted using the ArrayPro Analyzer software (Media Cybernetics, Silver Spring, MD). Background signal was determined locally for each spot using the “local corners” option. Individual spot intensities, minus local backgrounds, were normalized to total spot intensity for all of the spots on each micro array. The mean-normalized datasets were transformed by taking the logarithm of these values. An empirical data reduction process was employed (see Results) to identify which of the 198 probe spots had the most information (example: spots that were always “on” or “off” for all isolates would have no information for this dataset) and which of the spots that were too variable within the replicates of the same isolates. Principal Components Analyses (PCA) and cluster and classification analyses were run on the remaining dataset using Pirouette (Infometrix, Inc., Bothell, WA).

Results

Oligonucleotide Microarray Bacterial Source Tracking

Oligonucleotide microarrays were evaluated for their ability to resolve BOX PCR amplification products derived from environmental sources of Enterococcus sp. isolates originating from deer, bovine, gull, and human. Purified genomic DNA from Enterococcus sp. isolates was subjected to BOX PCR amplification and the resulting amplification products were visualized by agarose gel electrophoresis. The results of a typical experiment can be seen in Fig. 2, which represents the subset of samples originating from deer. Agar gel electrophoresis confirms amplification as well as consistency of the BOX PCR reaction. PCR products were fluorescently labelled with aminoallyl dUTP and Cy5 then resolved by hybridization to in house fabricated 9mer oligonucleotide microarrays (see Material & Methods). The results of a representative microarray experiment can be seen in Fig. 3, in which replicate BOX PCR reactions from Enterococcus sp. deer isolate 49.1.1 were hybridized to replicate oligonucleotide micro arrays. A histogram of fluorescent spot intensities indicates that these randomly selected nonamer intensities follow a lognormal distribution (data not shown). Of the 17 environmental isolates analysed, not all replicate microarrays were usable. For six of these isolates (4 human and 2 deer) a single microarray hybridization replicate, consisting of duplicate microarray spots, was available for analysis. For the remaining 11 isolates and their replicates, spots that exhibited extreme variability in normalized spot intensities among replicates within a specific source were identified and subsequently eliminated from analysis for all isolates. Normalized spot intensities with above median standard deviations > or = 0.7 within source-specific datasets (i.e. bovine, deer, etc.), were eliminated leaving 45 of the 200 probes. The remaining 45 probes were then used for analyzing all 17 isolates.

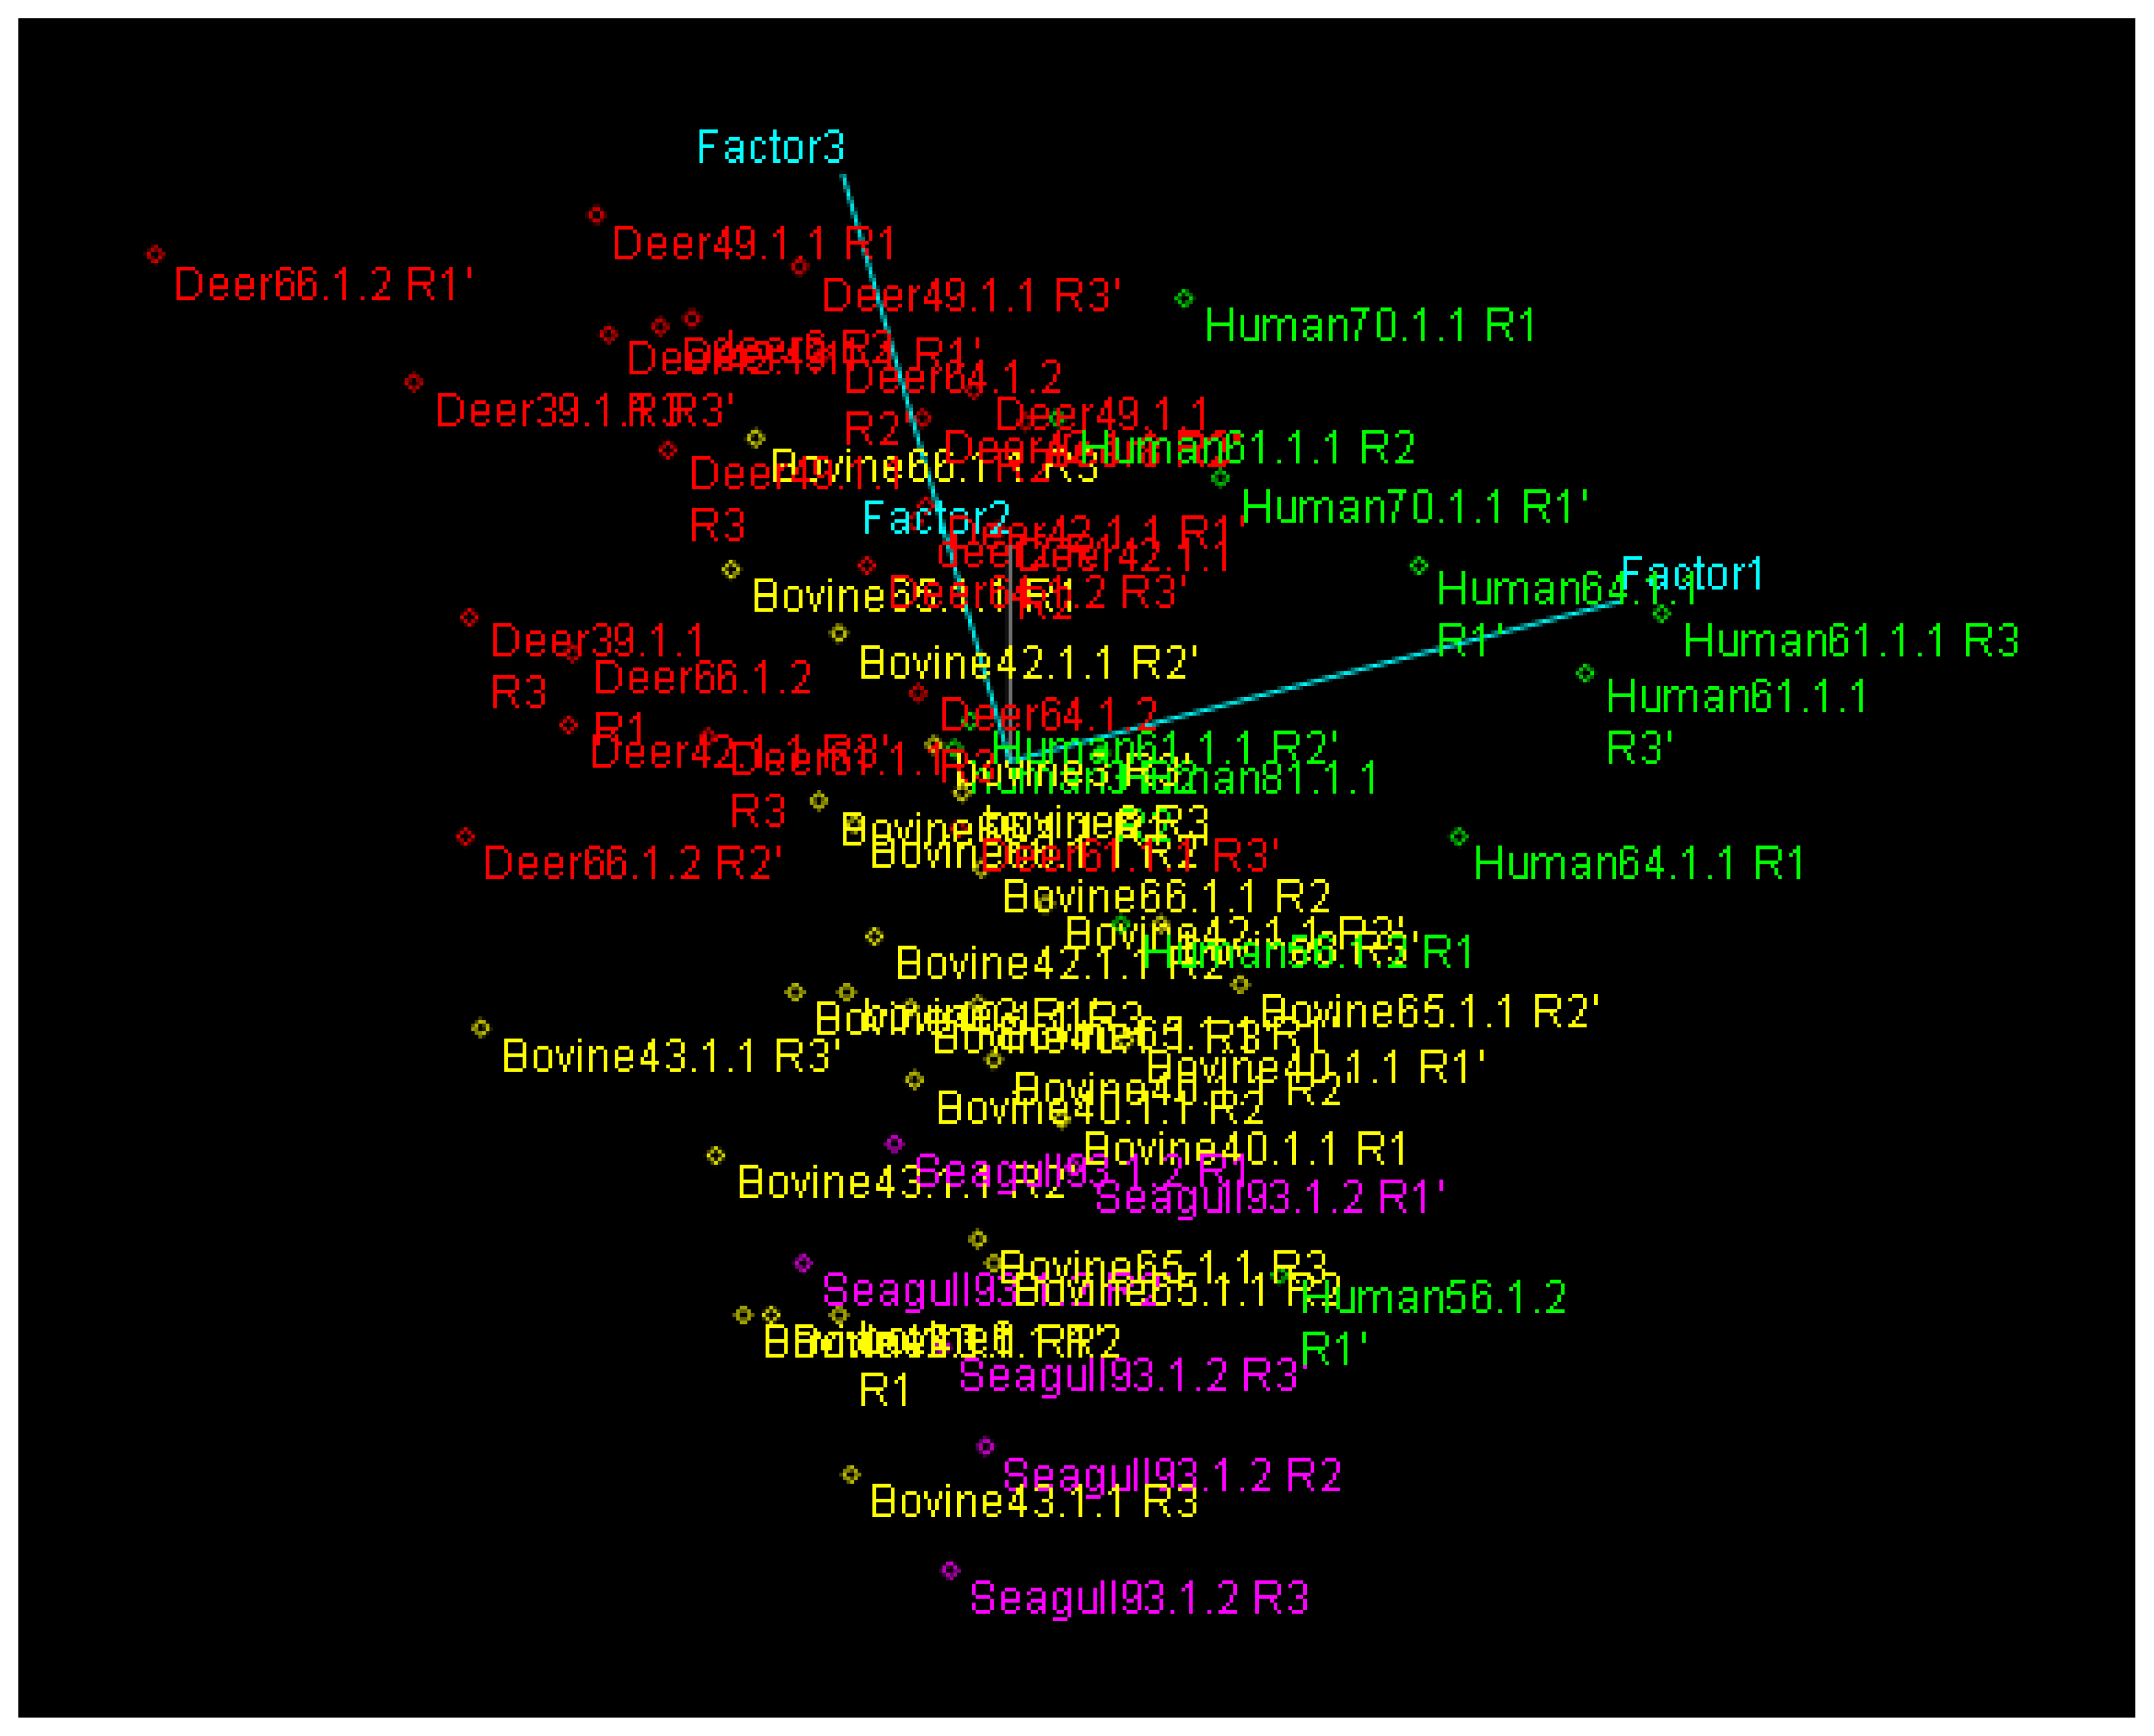
PCA and HCA Analysis

The dendrogram of a complete Euclidean distance Hierarchical Cluster Analysis (HCA) did not project good origin-specific clustering of the isolates. In particular, the bovine-origin replicates were spread among several clusters (example part of dendrogram Fig. 4). A K-Nearest Neighbour classification confirmed the HCA, misclassifying 8% of the deer, 16% of the human, and 50% of the gull isolates as bovine isolates. The PCA was visually superior at separating origin-specific clusters, even for as few as 3 factors (Fig. 5). A Soft Independent Modelling (SIM) classification confirmed the PCA, resulting in zero misclassifications using 5 factors for each class. Numerical descriptions of the SIM classification model for bovine-origin Enterococcus sp. are presented in Table II. These factors describe the multidimensional subspace within the PCA projection in which the various microarray source profiles exist. Factor numbers indicate the relative linear weights of each probe in each factor. For instance probes 2 and 16 have the highest weights for the most important factor, Factor 1, which accounts for 30% of the variability. Thus for this set of isolates, SIM classifications based on 5 factors for each class and 5 linear combinations of the 45 probes sufficed to distinguish the origins of Enterococcus sp. isolates.

Discussion

In an effort towards adapting new defensible methods for assessing and managing the risk posed by microbial pollution, we evaluated the utility of oligonucleotide microarrays for bacterial source tracking. Specifically, we evaluated the ability of oligonucleotide microarrays to visually discriminate 17 unique environmental isolates of Enterococcus sp. based on host origin, i.e. gull, bovine, deer, and human. As observed in an earlier study by Kingsley et al. [28], many of the microarray oligonucleotide probes exhibited high variations in fluorescent spot intensities within a series of replicates. A strong down selection for reproducible spot intensities within replicates produced a set of 45 probes, and this reduced set proved useful for classifying isolates by source. It should be reiterated that this data reduction was performed in order to improve reproducibility, and had the side effect of improving the classification fit. This is the opposite of the familiar problem of model over fitting, in which the addition of extra variables improves classification at the expense of robustness and reproducibility.
Following data reduction, a number of multivariate statistical analysis procedures are available for evaluating the relationships among microarray hybridization profiles. Previously, PCA was successfully used to visualize relationships among microarray hybridization profiles derived from closely related Xanthomonas pathovars [28]. In this study, PCA and HCA were compared for their ability to visually cluster microarray hybridization profiles based on the environmental source from which the Enterococcus sp. isolate originated. Classification of Enterococcus sp. isolates by source using a Soft Independent Modelling of class analogies consisting of 5 factors was more accurate than classification based on K-Nearest Neighbour calculations. This difference is apparent when comparing the PCA, which is a visualization of some of the SIM calculations, to the HCA, which is a visualization of some of the KNN calculations. The implication of these results for the application of random oligonucleotide microarrays for BST is that, given the reproducibility issues, factor-based variable selection such as in PCA and SIM greatly outperforms dendrogram-based similarity measures such as in HCA and KNN. Given any sample based strictly on the microarray intensity values, the SIM model outputs the best fitting class for that sample, with zero misclassifications for the dataset. Further optimization of source classifications may result from the application of information theory to detect patterns in microarray profiles. In particular, bacterial source tracking may benefit from several measures of classification utility, such as those based on mutual information that have been developed as part of information theory [32]. However, successful application of information theory for microarray analysis will be dependant upon accurately understanding, capturing, and modelling sources of variation in the microarray experimental process. Some of these sources of variation, such as PCR amplification and microarray fabrication have been described previously [27]. Once improved microarray experimental protocols and statistical methods have been developed, it will be possible to incorporate microarray technology into the growing toolbox of technologies that is rapidly defining bacterial source tracking. While there is currently no one best method that accomplishes the ambitious goal of source tracking as demonstrated in the latest study by Stoeckel et al. [33], it is likely that a combination of methods will lead to effective source tracking.
Figure 1. Configuration of the printed microarray spots and the physical location of the corresponding oligonucleotide probes as referenced in Table 1. Control oligonucleotide designated by C.
Ijerph 02 00175f1
Figure 2. BOX-PCR agarose gel fingerprints run in triplicate from Enterococcus sp. isolates originating from deer. A HindIII digested Lambda marker was included in the gel run as a size standard
Ijerph 02 00175f2
Figure 3. Oligonucleotide microarray replicate hybridization profiles resulting from hybridization with BOX-PCR amplification products from deer isolate 49.1.1.
Ijerph 02 00175f3
Figure 4. Hierarchical Cluster Analysis of normalized microarray spot intensities of replicates of 17 environmental isolates of Enterococcus sp. The dendrogram does not show good clustering by host origin at reasonable similarities. The bovine-origin replicates were most spread.
Ijerph 02 00175f4
Figure 5. Principal Components Analysis of normalized microarray spot intensities of replicates of 17 environmental isolates of Enterococcus sp., colored by host origin: deer is red, bovine is yellow, human is green, gull is purple. For this 3D view only the first 3 components can be plotted, but clustering is evident.
Ijerph 02 00175f5
Table 1. Microarray Oligonucleotide Probes
ID No.Sequences (5-3)
1AAATACCCG
2CAAATACCC
3AATTGCCCT
4GGGCCATTT
5GACGAGCTT
6AGCAGATAG
7CTTTCCAGG
8ATGACAGAC
9TGAGAGGCT
10GGTAGTGCT
11CATTGTCCG
12ATCTCTTGC
13CTACCAAGG
14AACACTACC
15CCATAATCC
16GAACTGGCA
17CAAATCTGG
18GCGATGTTG
19AGAGAAGCC
20TCAGCGCAT
21GCAACCAAA
22CTTGATTCC
23TACCCACTG
24TTACACCGC
25CTGCGATCA
26GAGCTGTCA
27TGGGCGTTT
28GGGCGTTTA
29CATCTGTCG
30AAGTAGCCC
31AATATGCGG
32GTACGGAGT
33TCTGCTATG
34CAAATGTCC
35AAATCTCGC
36AATTTCGGC
37ACTCTCCCT
38CCAAGTTCT
39GAAAGAGCA
40CCCTTTCCA
41ACCTATGCG
42TTGGGTTCG
43ATACCGATG
44TGCTTCACA
45ACGCTACGA
46TACTGTCGG
47GCTGCTACA
48TCCAACTAG
49CCGCAAAGT
50GATTAGCGC
51GGATAGCGA
52TATTGGTCG
53AAGCAGCAG
54CAGACACGA
55AAAGTGCCC
56CAATCGTTC
57AATCCGTAG
58CAAGAGGGT
59AATGGAACC
60CATATCCTC
61AACTTGCCG
62CATCTTGAC
63AAGACAGTG
64CACTACGCA
65AAGGGATGA
66CACGAATCC
67ATATCACGG
68CAGATGACC
69ATAGTCCAG
70CAGCAGATG
71ATTCACACC
72CAGGTGTGT
73ATTGGTGGG
74CTATACGCA
75ATCAGGGAA
76CTACACGCA
77ATCGAGCCT
78CTTATAGGG
79ATGTCAAGG
80CTTCCATAC
81ATGCCGGTT
82CTTGGAACC
83ATGGACACC
84CTCATAGGT
85ATGGGTACG
86CTCTGTTCC
87ACATGACAG
88CTCCTTTGC
89ACACACCAT
90CTCGATCAC
91ACAGTCTCA
92CTGAGTACA
93ACTAAGCGC
94CTGTAGACC
95ACTTAGCCA
96CTGCTACAC
97ACTTCGTCG
98CTGCTGTGT
99ACTCTCTCT
100CTGGCTTCT
101TGGCTACGT
102GGGCTGAAT
103TGGCTCGAA
104GGCCCATAT
105TGCGTACAT
106GGCTCAAGA
107TGCCCAAGA
108GGTTCTGTA
109TGCAGAACG
110GGTTTGTGT
111TGCAAGTTC
112GGTAGTTTC
113TGTCTATCG
114GGACCTAAC
115TGAGGATAG
116GGAAATCTG
117TGATGAGAC
118GCGATATTC
119GCCAATGTT
120TCGCCCTTA
121TCGTTATGG
122GCTTCCGTT
123TCCGAGACT
124GCTTGTGAT
125TCCGTCAAG
126GCTACCTTC
127TCCTTGGTT
128GCACTCTAA
129TCCATCGTG
130GCATGTAGG
131TCTCGTACC
132GTGGGCATT
133GCAAAGCCT
134TCTTCCTAC
135GTGCTGGAT
136TCTACCCAC
137GTGTAGAAC
138TCAGCATAG
139GTGAGGTTC
140TCAACCTTC
141GTCACGTTA
142TTGAGCTGA
143GTTTCGTGT
144TTCGCACTC
145GTTAGGGTG
146TTCTAGCGC
147GTATCGCTA
148TTAGCGTGC
149GTAACTGTC
150TTACCTGGC
151GAGGAGATA
152TAGCGAGTG
153GAGTTTCAG
154TAGTCGTCT
155GAGAGAAAC
156TAGCATAGG
157GACTCTACG
158TACGGTTCT
159GACAGTTCA
160TACCCAGTT
161GATGATACC
163GAAGGAAAG
164TAAGCCGCA
165GAACTAAGC
166AGGCTGTTC
167CGGTCAGAT
168AGGTAGGAA
169CGCCTATGT
170AGCCGTACA
171CGTGTTCTC
172AGCTATGCG
173CGTGGTTAT
174AGCAAGTGT
175CGTCTAACC
176AGTCTCAAG
177CGAAGTTTG
179CGACTGGAA
180AGTTACCCT
181CGAAACAGG
182AGAGTTCGA
183CCGTGGAAA
184CACAACTCT
185AACGAAACG
186AACACGCTT
187CATGAGGTT
188CATAGCGAA
189CAAACGAGG
190AAACACGTC
191CTGCTACGA
192ACTAGCGGT
193ACAACACTC
194CTATGTCGG
195CTATCAACC
196AACGATACC
197CAAACGGGA
198CTGTCACTG
5′ amine-modified 9mer oligonuceotide microarray probes and corresponding I.D. numbers
Table 2. The 5-factor oligonucleotide microarray SIM classification model for bovine-origin Enterococcus
probe I.D.#Factor1Factor2Factor3Factor4Factor5
10−0.0693−0.0124−0.17240.33650.1906
101−0.2427−0.01100.1314−0.0107−0.0573
103−0.0893−0.00510.16250.02740.0169
1090.0946−0.12030.0935−0.29960.2562
1100.19790.12210.02760.1051−0.0005
1160.19140.02070.19260.01590.1193
120−0.05180.00440.23880.18030.1916
129−0.0098−0.1774−0.20560.18910.0237
1350.2337−0.0282−0.01250.13490.1671
139−0.01590.1796−0.0037−0.04110.2386
143−0.0029−0.1737−0.0814−0.1052−0.2598
148−0.13570.02040.25100.12940.0086
1510.0471−0.0152−0.03630.39580.1300
152−0.0195−0.25080.15770.0328−0.1484
156−0.1935−0.05100.15170.0772−0.0967
160.2880−0.02790.04810.00900.0807
163−0.1135−0.14570.17070.2306−0.0090
164−0.06430.17560.1276−0.23730.1324
173−0.0276−0.0829−0.1689−0.13250.2091
1790.17520.13250.25030.02670.0454
183−0.1061−0.01860.17160.31820.1273
1880.0372−0.11360.2749−0.0896−0.1253
1970.11270.10550.13820.0709−0.2228
20.3161−0.1013−0.00280.0365−0.0345
230.01200.03860.1942−0.24570.0996
240.0043−0.18370.1502−0.0565−0.1489
270.04150.26240.04180.1381−0.0770
3−0.1492−0.10040.11420.0727−0.1953
31−0.1750−0.02220.1739−0.0174−0.0754
390.0871−0.26520.09020.19660.0277
42−0.0778−0.05900.1760−0.05170.2568
430.0425−0.2962−0.04940.12840.0829
510.2070−0.07610.08270.1584−0.0281
520.15030.2894−0.01440.0820−0.1347
54−0.13050.17390.05580.09270.2616
61−0.01340.15940.3046−0.00070.0549
630.2623−0.11790.03120.05170.1014
650.26540.16530.0571−0.0874−0.0411
670.1681−0.2348−0.0132−0.14480.1331
70.2416−0.20580.0358−0.0196−0.0125
72−0.04660.1237−0.32680.00420.1066
740.10580.29640.05850.1051−0.1957
76−0.0709−0.16060.0171−0.1116−0.1814
850.24140.00850.1413−0.0517−0.0178
97−0.1241−0.08900.1126−0.13210.3621

Acknowledgements

This work was funded by the Long-term Effects of Dredging Operations (LEDO) program at the U. S. Army Engineer Research and Development Center (ERDC). Permission was granted by the Chief of Engineers to publish this information.

References

  1. Natural Resource Defence Council (NRDC). Testing the Waters 2001; Natural Resources Defense Council: New York, NY, 2002. http://www.nrdc.org/water/oceans/ttw/titinx.asp.
  2. USEPA, Protocol for Developing Pathogen TMDLs; U. S. Environmental Protection Agency: Washington DC, EPA 841-R-00-00; 2001b.
  3. For list of impairment by state visit http://www.epa.gov/OWOW/tmdl/
  4. Mostaghimi, S.; Brannan, K. M.; Dillaha, T. A. Fecal Colifrom TMDL Development: Case Study and Ramifications. Water Resources Update 2002, 122(March 2002), 27–33. [Google Scholar]
  5. Term first used by Hagedorn and Wiggins at http://www.bsi.vt.edu/biol_4684/BST/BST.html
  6. Scott, T. M.; Rose, J. B.; Jenkins, T. M.; Farrah, S. R.; Lukasik, J. Microbial Source Tracking: Current Methodology and Future Directions. Appl. Environ. Microbiol 2002, 68, 5796–5803. [Google Scholar]
  7. Simpson, J. M.; Santo Domingo, J. W.; Reasoner, D. J. Microbial Source Tracking: State of the Science. Environ. Sci. Technol 36, 5279–5288.
  8. Harwood, V. J.; Whitlock, J.; Withington, V. Classification of antibiotic resistance patterns of indicator bacteria by discriminant analysis: use in predicting the source of fecal contamination in subtropical waters. Appl. Environ. Microbiol 2000, 66, 3698–3704. [Google Scholar]
  9. Wiggins, B. A. Discriminant analysis of antibiotic resistance patterns in fecal streptococci, a method to differentiate human and animal sources of fecal pollution in natural waters. Appl. Environ. Microbiol 1996, 62, 3997–4002. [Google Scholar]
  10. Wiggins, B. A.; Andrews, R. W.; Conway, R. A.; Corr, C. L.; Dobratz, E. J.; Dougherty, D. P.; Eppard, J. R.; Knupp, S. R.; Limjoco, M. C.; Mettenburg, J. M.; Rinehardt, J. M.; Sonsino, J.; Torrijos, R. L.; Zimmerman, M. E. Use of antibiotic resistance analysis to identify nonpoint sources of fecal pollution. Appl. Environ. Microbiol 1999, 65, 3483–3486. [Google Scholar]
  11. Hagedorn, C. S.; Robinson, S. L.; Filtz, J. R.; Grubbs, S. M.; Angier, T. A.; Reneau, R. B. Using antibiotic resistance patterns in the fecal streptococci to determine sources of fecal pollution in a rural Virginia watershed. Appl. Environ. Microbiol 1999, 65, 5522–5531. [Google Scholar]
  12. Hardwood, V. J. Lessons learned and questions unanswered from 5 years of Bacterial Source Tracking; Marriott Hotel and Conference Center: Irvine, CA, February 5 2002. [Google Scholar]
  13. Samadpour, M. Microbial Source Tracking: Principles and Practice. U. S. EPA Workshop on Microbial Source Tracking, Marriott Hotel and Conference Center, Irvine, CA, February 5; 2002. [Google Scholar]
  14. Carson, C. A.; Shear, B. L.; Ellersieck, M. R.; Asfaw, A. Identification of fecal Escherichia coli from humans and animals by ribotyping. Appl. Environ. Microbiol 2001, 67, 1503–1507. [Google Scholar]
  15. Hartel, P. G.; Summer, J. D.; Hill, J. L.; Collins, J. V.; Entry, J. A.; Segars, W. I. Geographic variability of Escherichia coli ribotypes from animals in Idaho and Georgia. J. Environ. Qual 2002, 31, 1273–1278. [Google Scholar]
  16. Parveen, S.; Portier, K. M.; Robinson, K.; Edmiston, L.; Tamplin, M. L. Discriminant analysis of ribotype profiles of Escherichia coli for differentiating human and nonhuman sources of fecal pollution. Appl. Environ. Microbiol 1999, 65, 3142–3147. [Google Scholar]
  17. Bernhard, A. E.; Field, K. G. A PCR assay to discriminate human and ruminant feces on the basis of host differences in Bacteroides-Prevotella genes encoding 16S rRNA. Appl. Environ. Microbiol 2000, 66, 4571–4574. [Google Scholar]
  18. Bernhard, A. E.; Field, K. G. Identification of nonpoint sources of fecal pollution in coastal waters by using host-specific 16S ribosomal DNA genetic markers from fecal anaerobes. Appl. Environ. Microbiol 2000, 66, 1587–1594. [Google Scholar]
  19. Dombek, P. E.; Johnson, L. K.; Zimmerley, S. T.; Sadowsky, M. J. Use of repetitive DNA sequences and the PCR to differentiate Escherichia coli isolates from human and animal sources. Appl. Environ. Microbiol 2000, 66, 2572–2577. [Google Scholar]
  20. Buchan, A.; Alber, M.; Hodson, R. E. Strain-specific differentiation of environmental Escherichia coli isolates via denaturing gradient gel electrophoresis (DGGE) analysis of the 16S–23S intergenic spacer region. FEMS. Microbiol. Ecol 2001, 35, 313–321. [Google Scholar]
  21. Farnleitner, A. H.; Kreuzinger, N.; Kavka, G. G.; Grillenberger, S.; Rath, J.; Mach, R. L. Simultaneous detection and differentiation of Escherichia coli populations from environmental freshwaters by means of sequence variations in a fragment of the beta-D-glucuronidase gene. Appl. Environ. Microbiol 2000, 66, 1340–1346. [Google Scholar]
  22. Kariuki, S.; Gilks, C.; Kimari, J.; Obanda, A.; Muyodi, J.; Waiyaki, P.; Hart, C. A. Genotype analysis of Escherichia coli strains isolated from children and chickens living in close contact. Appl. Environ. Microbiol 1999, 65, 472–476. [Google Scholar]
  23. Dicuonzo, G.; Gherardi, G.; Lorino, G.; Angeletti, S.; Battistoni, F.; Bertuccini, L.; Creti, R.; Di Rosa, R.; Venditti, M.; Baldassarri, L. Antibiotic resistance and genotypic characterization by PFGE of clinical and environmental isolates of enterococci. FEMS. Microbiol. Lett 2001, 201, 205–211. [Google Scholar]
  24. Parveen, S.; Hodge, N. C.; Stall, R. E.; Farrah, S. R.; Tamplin, M. L. Phenotypic and genotypic characterization of human and nonhuman. Escherichia coli. Water Res 2001, 35, 379–386. [Google Scholar]
  25. Guan, S.; Xu, R.; Chen, S.; Odumeru, J.; Gyles, C. Development of a procedure for discriminating among Escherichia coli isolates from animal and human sources. Appl. Environ. Microbiol 2002, 68, 2690–2698. [Google Scholar]
  26. Sharkey, F. H.; Banat, I.; Marchant, R. Detection and Quantification of gene expression in environmental bacteriology. Appl. Environ. Microbiol 2004, 70, 3795–3806. [Google Scholar]
  27. Willse, A.; Straub, T. M.; Wunschel, S. C.; Small, J. A.; Call, D. R.; Daly, D. S.; Handler, D. P. Quantitative oligonucleotide microarray fingerprinting of Salmonella enterica isolates. Nucleic Acids Res 2004, 32, 1848–1856. [Google Scholar]
  28. Kingsley, M. T.; Straub, T. M.; Call, D. R.; Daly, D. S.; Wunschel, S. C.; Chandler, D. P. Fingerprinting closely related xanthomonas pathovars with random nonamer oligonucleotide microarrays. Appl. Environ. Microbiol 2002, 68, 6361–6370. [Google Scholar]
  29. Hassan, W. M.; Wang, S. Y.; Ellender, R. D. Methods to increase the fidelity of rep-PCR fingerprint-based bacterial source tracking efforts. Appl. Environ. Microbiol.
  30. Sambrook, J.; Fritsch, E. F.; Maniatis, T. Molecularcloning: a laboratory manual, 2nd ed; Cold Spring Harbor Laboratory Press: Cold Spring Harbor, N.Y.
  31. Gilbert, J.; Hasseman, J.; Cline, R. Microbial genomic DNA aminoallyl labelling for microarrays. The Institute for Genomic Research Standard Operating Procedure #M009, ver 0.3. http://pfgrc.tigr.org/protocols.shtml.
  32. Butte, A. J.; Kohane, I. S. Mutual information relevance networks: functional genomic clustering using pairwise entropy measurements. Pac. Symp. Biocomput 2000, 418–429. [Google Scholar]
  33. Stoeckel, D. M.; Mathes, M. V.; Hyer, K. E.; Hagedorm, C.; Kator, H.; Lukasik, J.; O’Brien, T. L.; Fenger, T. W.; Samadpour, M.; Stickler, K. M.; Wiggens, B. A. Comparison of seven protocols to identify fecal contamination sources using. Escherichia coli. Environ. Sci. Technol 2004, 38, 6109–6117. [Google Scholar]

