Article

Conceptual Modeling for Adaptive Environmental Assessment and Management in the Barycz Valley, Lower Silesia, Poland

by
Piotr Magnuszewski
1,*,
Jan Sendzimir
2 and
Jakub Kronenberg
3
1
Institute of Physics, Wroclaw University of Technology, Wybrzeze Wyspianskiego 27, 50-370 Wroclaw, Poland
2
International Institute of Applied Systems Analysis, Schlossplatz 1, A-2361 Laxenburg, Austria
3
Dept of International Economic Relations, University of Lodz, POW 3/5, 90-255 Lodz, Poland
*
Author to whom correspondence should be addressed.
Int. J. Environ. Res. Public Health 2005, 2(2), 194-203; https://doi.org/10.3390/ijerph2005020001
Submission received: 10 January 2005 / Accepted: 10 April 2005 / Published: 14 August 2005

Abstract

:
The complexity of interactions in socio-ecological systems makes it very difficult to plan and implement policies successfully. Traditional environmental management and assessment techniques produce unsatisfactory results because they often ignore facets of system structure that underlie complexity: delays, feedbacks, and non-linearities. Assuming that causes are linked in a linear chain, they concentrate on technological developments (“hard path”) as the only solutions to environmental problems. Adaptive Management is recognized as a promising alternative approach directly addressing links between social and ecological systems and involving stakeholders in the analysis and decision process. This “soft path” requires special tools to facilitate collaboration between “experts” and stakeholders in analyzing complex situations and prioritizing policies and actions. We have applied conceptual modeling to increase communication, understanding and commitment in the project of seven NGOs “Sustainable Regional Development in the Odra Catchment”. The main goal was to help our NGO partners to facilitate their efforts related to developing sustainable policies and practices to respond to large-scale challenges (EU accession, global changes in climate and economy) to their natural, economic and socio-cultural heritages. Among the variety of sustainability issues explored by these NGOs, two (extensive agricultural practices and “green” local products) were examined by using Adaptive Management (AM) as a framework that would link analysis, discussion, research, actions and monitoring. Within the AM framework the project coordinators used tools of systems analysis (Mental Model Mapping) to facilitate discussions in which NGO professionals and local stakeholders could graphically diagram and study their understanding of what factors interacted and how they affect the region’s sustainability. These discussions produced larger-scale Regional Sustainability Models as well as more detailed sub-models of particular factors, processes, and feedback loops that appear critical to a sustainable future. The Regional Sustainability Model was used to identify a subset of key interacting factors (variables). For each variable, several sustainability indicators were suggested. The growing understanding and acceptance of the AM framework and systems analysis created a momentum both locally and within the region, which makes continued successful use of these indicators quite likely. In contrast to expert-driven projects that inject outside knowledge into a local context, this project established a broad basis for stakeholder-driven discussion that is articulated into goals, objectives, conceptual models, and indicators. The ability to learn and adapt in the AM framework increases the capacity to innovate and find policies and practices that enhance resilience and sustainability in a world in transition.

Introduction

The complexity of interactions in socio-ecological systems makes it very difficult to plan and implement policies successfully. One of the main reasons for this is the uncertainty emerging not only from complex interactions within different sectors (for example, academia, government, business), but also from the tangle of relations across ecological, economic and socio-political domains. The challenge to understand and manage complex systems emerges in a history of surprising reversals of initial policy success [1, 2]. At first, attempts to eliminate, and then to merely control disturbances (flood, fire, and pests) have often promoted larger and more profound disruptions. Stubborn resistance to most policy remedies has earned such problems the title of “wicked problems” [3], as if evil intention is a metaphor for how intractable, unknowable and uncooperative the world is. Blame for rising flood statistics or declining river valley economies cannot simply be pinned on “the usual suspects”: exogenous drivers or ignorant human actors or policies. Analysis of the underlying complexity continues to improve, but understanding, and more importantly the capacity to adapt, remains woefully behind the evolving reality. The move from the “hard” and narrow technical approach to a more adaptive and comprehensive “soft” path [4] requires not so much methods of analysis or management intervention, but their integration.
Coping with uncertainty requires the sustained capacity to learn and to flexibly manage. For thirty years a decision making process has been evolving to address the challenge of learning while managing. This process, Adaptive Environmental Assessment and Management (AEAM), also known as Adaptive Management (AM), offers a framework to integrate research, policy and local practice that has been developed over three decades of experimental applications to understand and manage crises of collapsed fisheries, agriculture, forestry and rangeland grazing [511]. AM increases adaptive capacity by shifting linear decision making processes (crisis - analysis - policy) to a cyclic learning process that iteratively integrates how we modify assessment, policy formulation, implementation and monitoring in order to track and manage change in the world (Figure 1).
The AM learning cycle usually starts with an Assessment phase wherein stakeholders explore a range of assumptions and ideas in order to formulate a suite of equally plausible hypotheses that provide separate predictions of why the problem in question occurs [8, 12]. Modeling can serve as a useful exercise for stakeholders participating in the AM process to bound the problem and examine the key variables and interactions they consider crucial to the dynamics of resilience and vulnerability in the system. Conceptual models facilitate discussion and comparison of different interpretations of the system’s structure. Such models allow participants to graphically analyze and discuss which variables are involved and how are they linked, including identification of reinforcing and balancing feedback loops and delays that affect system dynamics [1, 13]. Graphic tools such as diagrams and mental maps open the discussion of complex systems to include people who find verbal descriptions too complicated or too long and involved. Often a single map replaces pages of text required to describe all of the variables and their interactions.
Monitoring and Evaluation constitutes the link closing the AM cycle. Monitoring is usually done through defining and measuring different indicators. Indicators can be developed in a top-down expert driven way such that a uniform set of indicators is equally measured in different locations involved. Quite often, however, the impact is more academic than practical and does not lead to any meaningful change on the ground but only to comparing the indicators’ evolution over time. Alternatively, indicators can also be prepared as a means of facilitating local communities’ learning about sustainable development [1619]. This approach usually requires public or stakeholder participation in creating and using the indicator database [2028]. The level of participation can vary – from manipulative, wherein it is only pretence and the local stakeholders have no influence on the decision process, to self-mobilization, wherein local people initiate actions themselves. In the latter case, when people design and monitor their own indicators, they develop a better common trust and experience with which to interact with professionals and higher authorities [29, 30]. However benignly intended, the interference of “expert” external agencies can stifle the development of trust and cripple the long-term acceptance and implementation of innovative policies.
In this article, we describe the modified Adaptive Management Framework that we used in the Barycz Valley, first from the conceptual, and then the practical point of view.

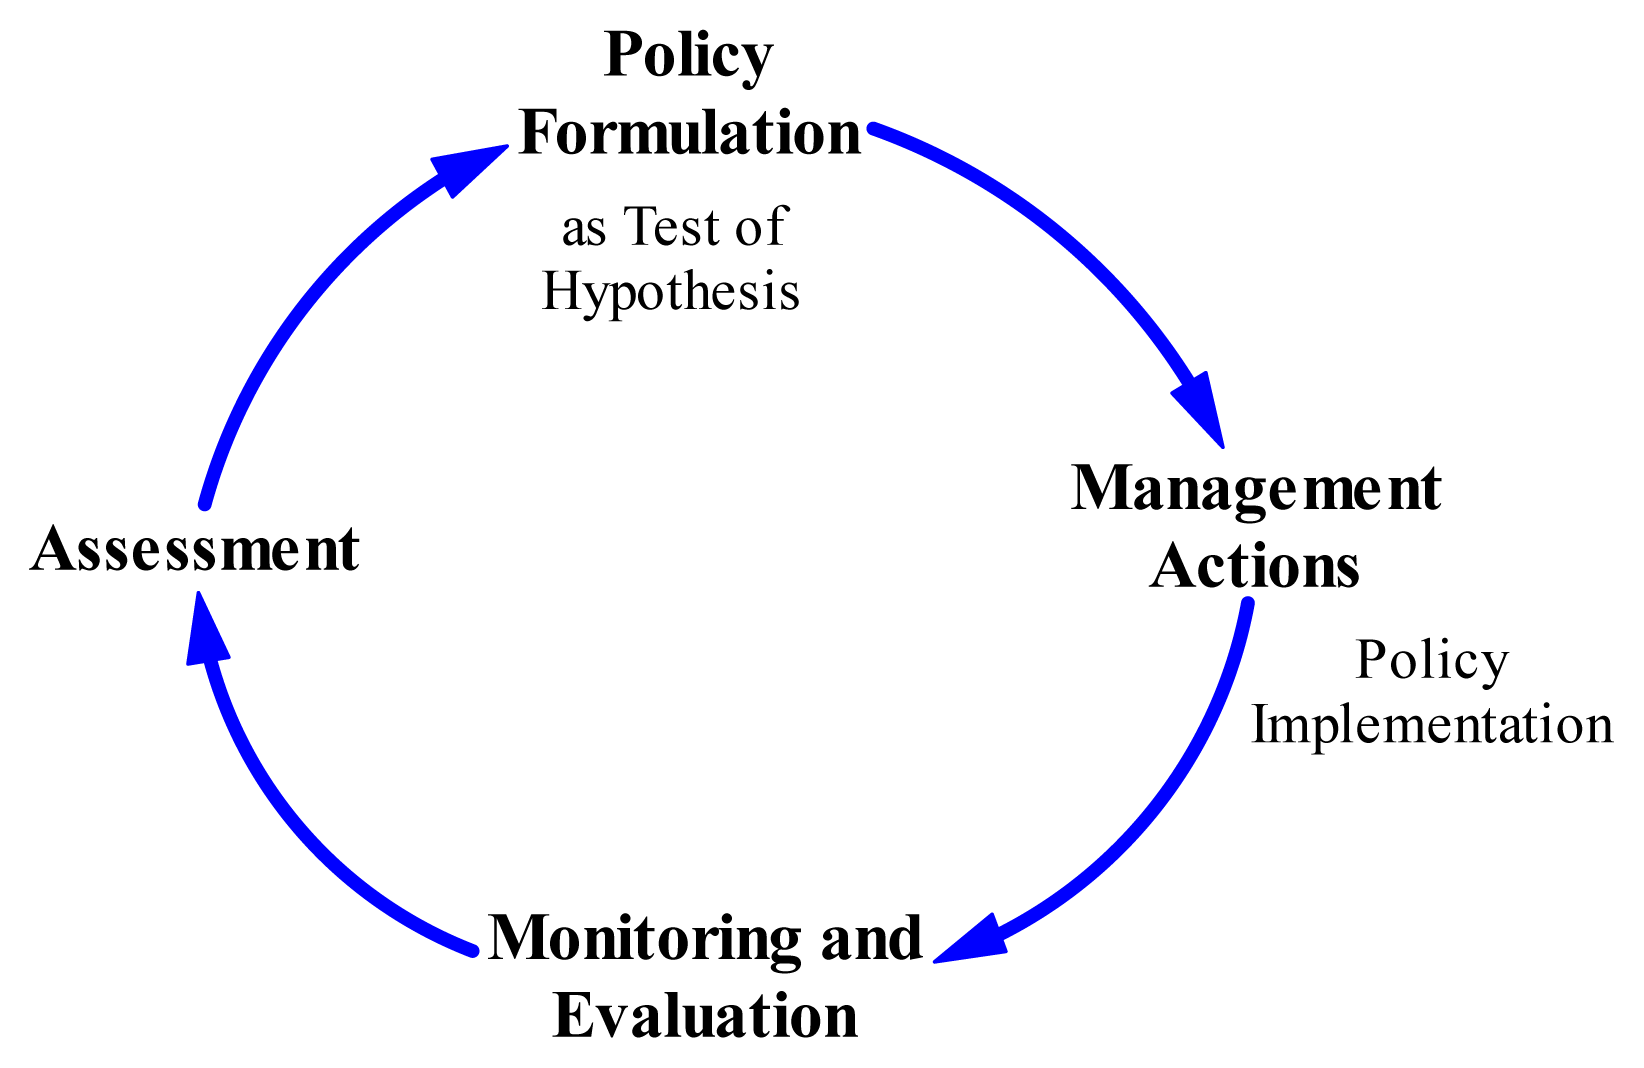
Adaptive Management Framework with Conceptual Modeling

In our approach we have adopted the Adaptive Management Framework (AMF) and enhanced it using advances in conceptual modeling and sustainability indicators practice (Figure 2). The framework can be classified as a “soft approach” in the following ways.
a)
An open, participatory and recursive process both for policy formulation and indicators selection is used instead of top-down control.
b)
Systems analysis including many feedbacks between sectors is performed, instead of narrow technical analysis.
c)
Conceptual, qualitative modeling is used instead of formal, quantitative modeling.
Conceptual systems thinking techniques have been developed as a reaction to the failure of quantitative systems analysis to cope with the so-called “messy” problems, where it was difficult to identify a clear goal to attain. Different methodologies have been developed to tackle these problems [3133]. Their usefulness has been verified in a variety of different contexts and applications [34]. The soft approach has made it easier to engage the client or the public in the process of group model building.
Bell and Morse [20] in their work on sustainability indicators suggested the usefulness of a participatory approach linked to the broader perspective of participatory learning using systems thinking. One of the most important conclusions of their work was that sustainability indicators have to be developed in an open and participatory way which helps the community directly learn about its performance and thereby improves the decision making process. The indicator sets are more flexible and adapted to the specific stakeholders’ needs. Moreover, the participative process makes any potential review and continual improvement of the indicators not only possible but also a desired part of the process.
There are however some drawbacks. The main problem they encountered with the soft approach was that it was not “easily reportable or demonstrable to auditing authorities” [21]. Another problem may arise when a team working on indicators feels the soft systems approach is not rigorous or professional enough (because it does not provide quantitative results).
We tried to avoid or mitigate these weaknesses in two ways. Firstly, we used a structured and recursive learning process within an AMF to identify and address errors in a transparent way. Secondly, the same framework allowed us to integrate different phases, using them to challenge and reinforce one another. For example, we meshed the phases of bounding and then measuring the problem by linking the results of the conceptual modeling phase with the process of defining indicators. As conceptual modeling provides the “big picture” of the problem and helps to overcome human information processing limitations, it also makes the process of indicators selection more rigorous and leads to more comprehensive results.
We have adapted the general AMF to suit the needs of the project (Figure 2). The modified framework consists of the following steps.

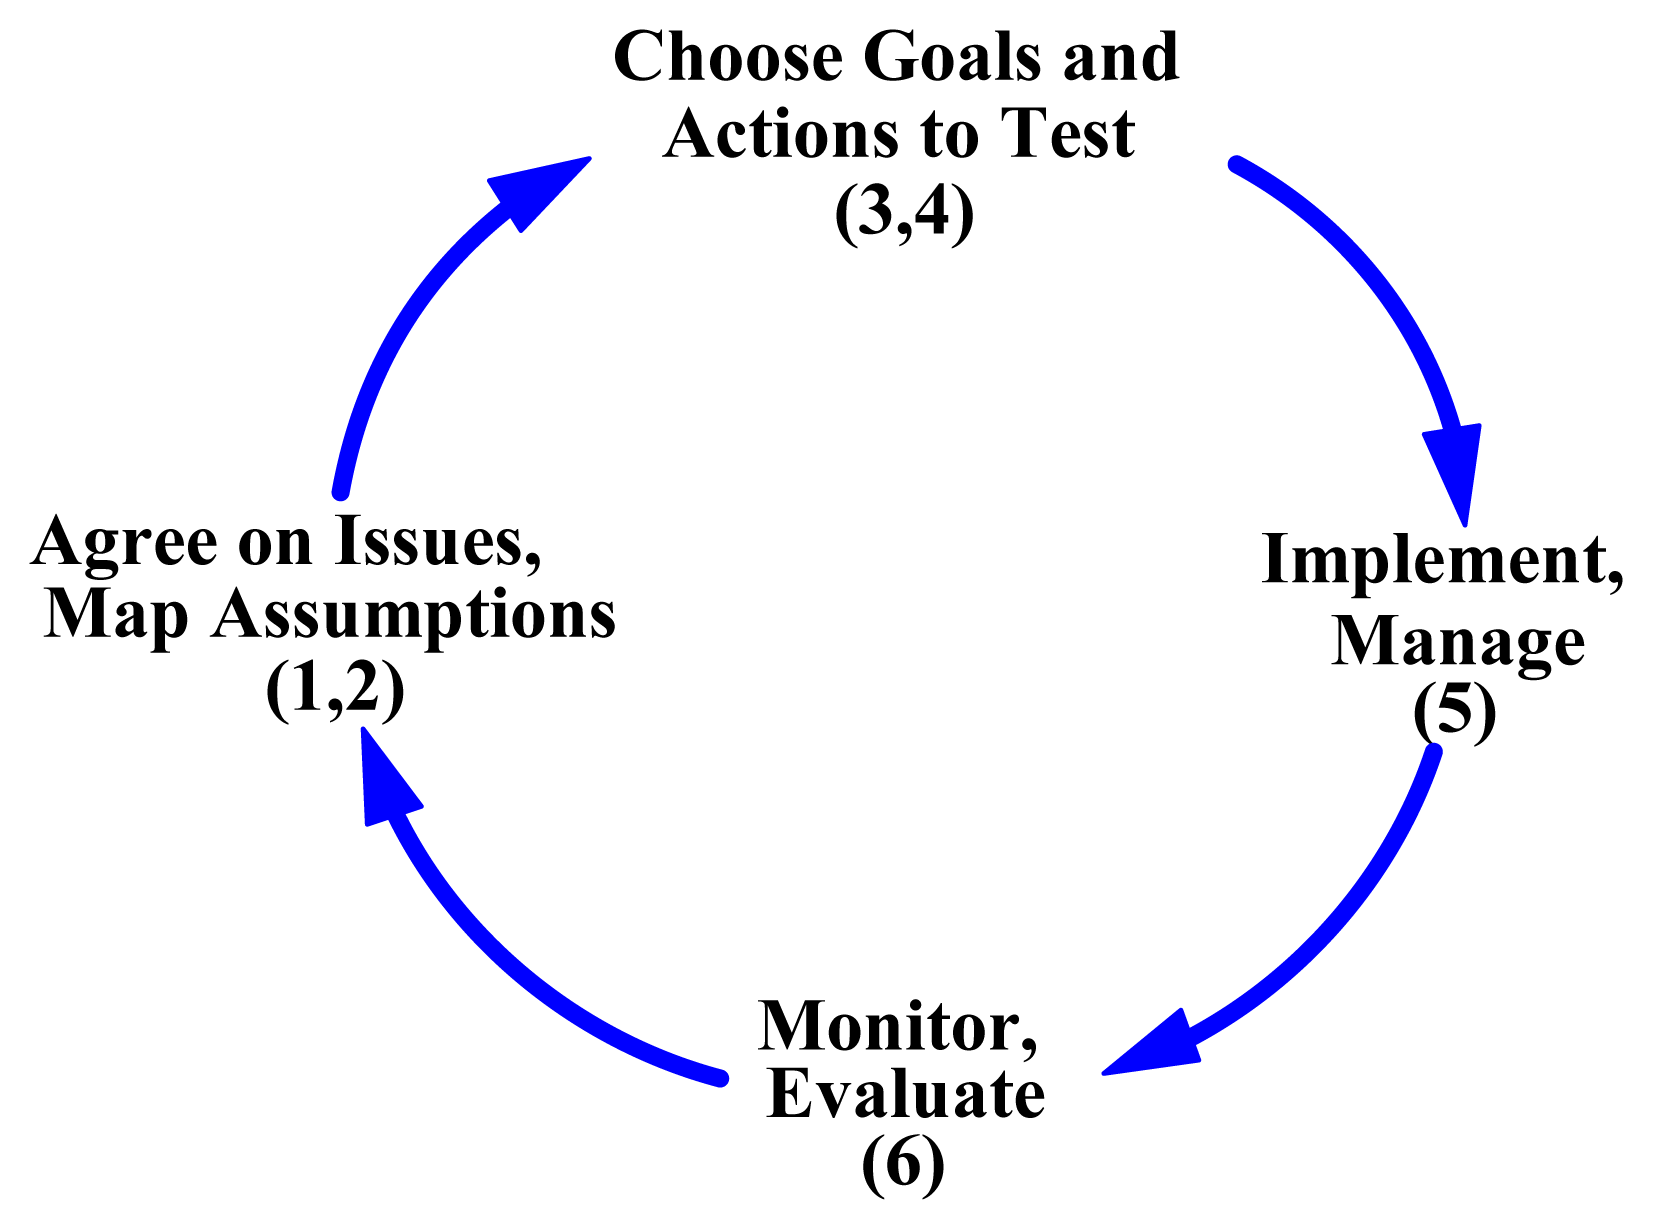
Agreeing on Issues and Objectives

In this first step the group identifies, discusses and agrees on the issues of most concern, such as crime, education and the environment. Conflicting opinions and uncertainty are used as valuable signals as to what areas need investigation most. Because Adaptive Management is designed to review and revisit every phase, it is not necessary to deal with every possible issue, but simply make a good start that unites participants in what they agree that they know, and what they understand that no one knows.

Mapping Assumptions

a)
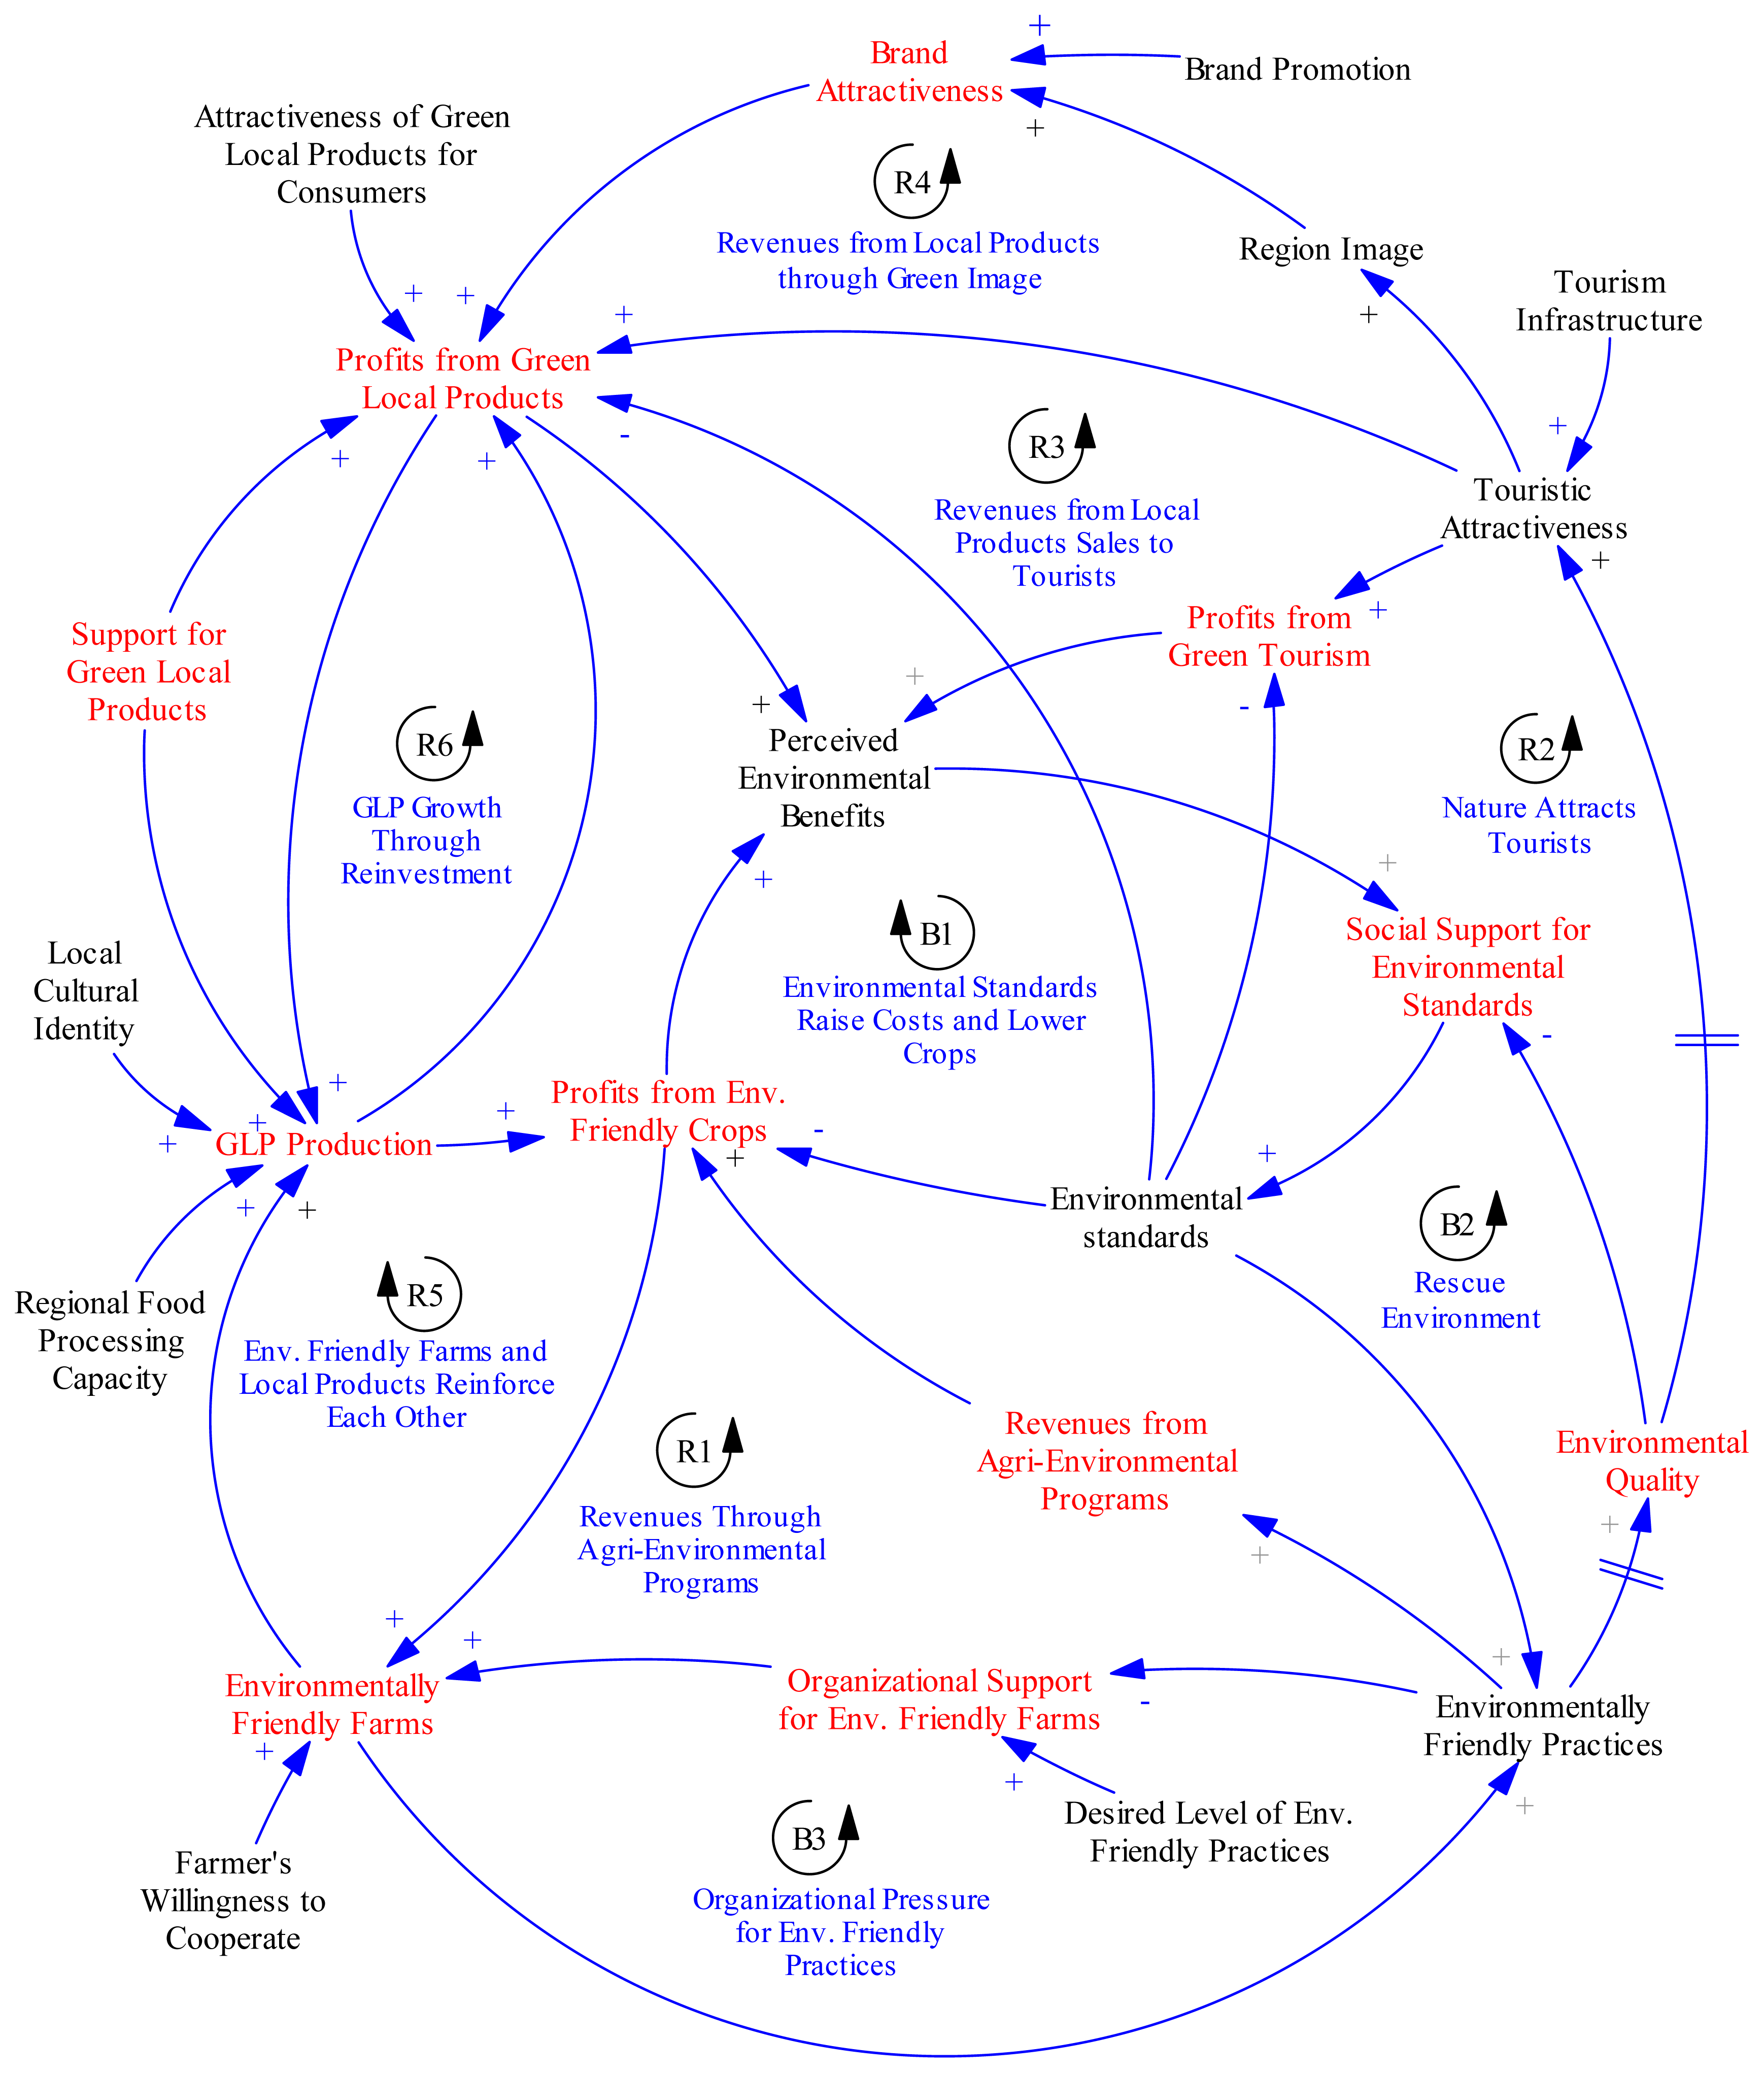
Identifying Variables and Interrelationships. Here conceptual modeling is used to map the underlying assumptions about the linkages and causality in the system. We have used the qualitative system dynamics methodology with causal loop diagrams as mapping tool.
b)
Assessing Major Uncertainties and Unknowns. Disagreements reveal gaps in understanding. Uncertainties are pondered to the point when they can be clearly stated as hypotheses.

Choosing Indicators

a)
Identifying Key Variables. Using the conceptual model developed in 2a, most important (key) variables are selected by considering the number of interactions and/or delays as well as employing a conservative rule that each feedback loop should be represented in the set of indicators by one of its variables.
b)
Deriving Indicators for Each Variable. Each key variable should be represented by at least one indicator. Often multiple indicators are needed to capture the range of values and qualities associated with a variable.
c)
Scoring Indicators with Three Sets of Criteria. The scoring process must be streamlined and simple enough to be easily understood and relatively rapid to accomplish. Criteria should also help one examine what makes an indicator useful and convincing. To meet these goals a set of three criteria was employed: importance (work group’s perspective), compellingness (stakeholders’ perspective) and measurability.
d)
Selecting a Final Set of Sustainability Indicators (based on cumulative scoring).

Defining Policies

Plausible competing policies are formulated (treated as hypotheses) aimed to achieve objectives chosen by stakeholders and to achieve targets identified in the process of defining indicators. Based on a common agreement regarding prioritization of needs, only a few policies are chosen (a subset that is small enough to be practically and thoroughly applied) for further implementation.

Implementation

Actions necessary to realize the chosen policies are planned and implemented.

Monitoring and Evaluation

Information is gathered to further review the appropriateness of the indicators chosen in 3. The output and impact of chosen policies are measured and evaluated as to whether action plans and management interventions have achieved the targets specified in policies.

Project in the Barycz Valley

General Setting

The Barycz River, with a total length of 133 km, is one of the largest tributaries of the Odra River, which in turn is the second largest river in Poland. A basin topography that combines a flat lower valley with steep slopes in the surrounding hills results in diversified habitats with a mixture of forests, meadows and ponds, which occur both in the form of large and small complexes. The total river valley covers an area of 2600 km2 and it is administratively divided among 17 local communities (municipalities). The hydrological system supports Europe’s biggest fishponds – the Milicz Ponds. Large migratory flocks of birds concentrate seasonally in the whole Barycz Valley. As many as 276 bird species (166 breeding) have been recorded in this area.
Changing political and economic conditions resulting in rising unemployment pose many threats to biodiversity in the Barycz Valley. The challenge is to preserve biodiversity and at the same time improve the local economy. To this end a broad coalition of NGOs active in this region has been established to explore a range of policies and practices to promote biodiversity and environmental quality in the Barycz Valley. The specific challenge arising from this is to help organize and integrate such a variety of organizations pursuing a diversity of different objectives and activities in a way that different projects individually contribute to progress toward sustainability.
Efforts to use external experts to inject knowledge into local situations may add valuable experience from similar situations elsewhere, but the full practicality of such information is seldom realized if it is paternalistically handed down to “clients”. Frustration over failures for local people to accept or utilize such expert knowledge, let alone innovate, has led to the deeper question - how to empower local professionals and stakeholders to better use their own experience to create their own policies and practices, to measure their own progress, and to continue to learn and innovate in this regard in order to adapt to a world of changing climate and economy? People thus empowered might be better prepared to adapt ideas and experience from abroad to their local reality, because they are capable of detecting failures and improving them. In short, they can learn by themselves and, once secure on the local level, can responsibly interact with higher levels in ways that will sustain development without violating their heritage. Our project was supposed to provide local professionals and other stakeholders with tools and methods that would help them solve these problems.

Project Execution

This project pursued the goal of establishing a framework for different NGOs to discuss their diversified visions and approaches and develop their own indicators and targets by which they could measure their progress toward sustainability. In this way they can share and enrich each other’s experience and continue to develop a common vision that unites actions in the region. Adaptive Management has been used as a general platform to link discussion and research during the whole project. It created the red thread through the steps of the project and helped participants to answer the question “where are we?” whenever they felt lost. Within our AMF, Conceptual Modeling has been used for mapping mental models of participants and stakeholders. Together with the project participants, we came up with an initial list of Sustainability Indicators to demonstrate to participants their use and potential effectiveness. The indicators can be improved in the ongoing process of formulation, measurement and revision.
The project proceeded in a series of workshops with NGOs. Local stakeholders and students occasionally joined the project group meetings and discussions. Professionals in local NGOs are good contributors to the start of an adaptive discussion framework, helping initially to absorb new ideas and methods, and subsequently to act as bridges of understanding to local stakeholders with whom they have established trust over the years. The NGOs were then responsible to pass the new knowledge on to the local people and thus, also involve them in the project. Direct involvement of stakeholders would make the project far more costly and time consuming.
At the beginning, a common language was established (with variables, and links between the variables, as its basic elements) and was used to develop mutual understanding shared by all participants. This graphic language enabled us to successfully join diverse participants’ experiences and backgrounds into a common model exploring regional sustainability issues. First, a list of potential variables was elicited. Secondly, the initial list was winnowed to narrow it down to a practical range (< 25) of key variables. Finally, we used causal loop diagramming [1, 14] as a discussion guide in linking variables and slowly developing a graphic image of the system structure. As the web of relations took shape, certain sections became more understandable as identification of reinforcing and balancing feedback loops reveals the system macrostructure. In this way, the vast and dense “thicket” of links was reduced to a smaller set of clusters of variables that tend to interact with each other. The group’s desire to focus on specific parts of the model often generated sub-model diagrams that clarified some of the causal details underlying the more aggregate variables and relations in the general model. Causal Loop Diagrams enabled us to elicit from the participants their underlying assumptions and mental models and to express them graphically in the form of a “map” containing key factors and processes in the region. The model functioned as the knowledge container; open and easily modifiable when new facts or ideas were provided or revealed during the process. In every discussion the model presented on the wall plainly showed the complex relations between nature and society in rural landscapes. This model proved to be easily understandable not only for the project participants but also for other local stakeholders and students.
In summary using the model disciplined the group discussions in a positive sense as follows.
a)
Differences (and agreements) in opinions were articulated much more precisely.
b)
Gaps in understanding were discovered more efficiently.

Regional Sustainability Model

The conceptual model of regional sustainability issues (Figure 3) was developed following the overall goal of the NGO participants in this project to analyze and measure how their projects contribute to improve or sustain the quality of the regional environment. It should be stressed that this model, created during the first cycle of AMF, contains mostly the assumptions of the NGO professionals about the analyzed system. These assumptions should be challenged and refined during consecutive cycles. The model contains four main parts: Environmental Quality, Environmentally Friendly Farms, Green Local Products and Green Tourism.
We assumed that Environmental Quality depends on the level (intensity and extent) of Environmentally Friendly Practices. In order to achieve the appropriate level of Environmentally Friendly Practices (EFP) we need to introduce Environmental Standards. In this top-level model the term “environmental standards” can represent both legally enforced regulations and/or standards voluntarily chosen by the producers to increase competitiveness. Success in establishing EFP depends on what Perceived Environmental Benefits are evident to the community in the region. All of these parts are heavily interconnected, and for each of them a detailed sub-model was developed. As an example, the Environmentally Friendly Farms sub-model is described in more detail in Appendix 1.
The final version of the model was used for choosing key variables, which constituted the first step to choosing sustainability indicators.

Sustainability Indicators

Based on our understanding of regional sustainability issues gained in developing the conceptual model, steps were taken to obtain the instruments for measuring progress – sustainability indicators. The regional sustainability model was the basis to identify the most important variables (marked in red color in Figure 4) and then derive sustainability indicators (see Table 1).

Conclusions

Systems concepts and methods, such as the analysis of mental models and causal loop diagrams, are impressive for their power to clarify complexity but can be intimidating when first encountered. While the outcome is a useful simplification, along the way one must face and digest far more complexity than when filtering the world through the lens of a single discipline. Systems science rigorously engages and integrates multiple disciplines and experiences, and it takes years of training and application to master. However, with the help of experienced systems scientists such methods can be practically employed by both professionals and lay people to develop regional sustainability strategies and indicators. For this to happen, much attention has to be paid to clarifying the basics, including the specific language of systems analysis, and to providing the participants with an opportunity to use the knowledge they acquire during exercises. Also, causal loop diagrams have to be discussed gradually, starting from a single loop and building the whole diagram around it.
Systems methods help people see what they normally do not consciously think about or discuss in an open forum: feedback loops with complex interactions and delays that create long and medium-term impacts. The transition to sustainability requires that stakeholders grasp the structure of systems. These methods help in that transition by exposing counter-intuitive links between natural, economic and social processes and by showing how delays distort our understanding of change. Stakeholders in the Barycz Valley approached by the NGOs directly participating in the project, as well as the NGO representatives, found these methods and ideas powerful in opening new ways to capture values, qualities and relationships related to the sustainability of their community and environment. They also felt that systems science methods were good complements to traditional verbal descriptions of sustainability. Briefly, stakeholder-driven processes that use graphical maps of sustainability engage a far wider group and build broader acceptance of novel ideas than do words alone.
Professionals in local NGOs are good contributors to the start of a discussion within the Adaptive Management Framework, helping initially to absorb new ideas and methods, and subsequently to act as bridges of understanding to local stakeholders with whom they have established trust over the years. Once an Adaptive Management Framework has established an open, trusting exploration of ideas among such professionals, the discussion can much more easily be extended to include (and be challenged to improve by) the experience of the wider community of concerned citizens.
Conceptual modeling involves parallel efforts to examine regional as well as local sets of processes associated with individual variables and/or feedback loops. These processes complement one another in improving the view at one scale by adding perspectives from other scales. The process of starting at a regional scale and then focusing down to specific questions led to a much-improved regional model applicable to a range of sustainability questions.
The essential point of the AMF is to use the insight gained in assessment to act, then monitor the impacts of action and then start the cycle again by using the results for reassessment. Collaborative re-assessment of policies and practices will require closer cooperation with local authorities, professionals, NGOs and concerned citizens in future projects, because such processes cannot be forcibly applied by administrative rulings. They must be understood and accepted by a majority of stakeholders such that an AMF process is voluntarily engaged by society. The engagement of NGO professionals is crucial for success because their work has established the trust that will bring local stakeholders into such a discussion and help them fully contribute to the discussion, to monitoring impacts and to subsequent reassessments and new actions. University education cannot teach how AMF should be applied and cannot create the basis of experience by which to advance its concepts and methods. Only through application in the real world can broad coalitions of lay people and professionals successfully learn how to use AMF and the project described in this article provides a good example of how this can be carried out. That wide stream of experience will provide the foundations to devise new concepts and methods through which AMF dialogues can evolve.
Figure 1. Adaptive management process as a structured learning cycle that iteratively links four phases: starting from assessment, through policy formulation to implementation, and monitoring used as an input for the assessment phase in the next cycle.
Ijerph 02 00194f1
Figure 2. Adaptive Management Framework used in the Barycz Valley. Conceptual Modeling was incorporated into Assessment phase (steps 1 and 2).
Ijerph 02 00194f2
Figure 3. Regional sustainability model with four main parts aggregated.
Ijerph 02 00194f3
Figure 4. Variables and causal links in the Environmentally Friendly Farms sub-model. Variables in red are the key variables, which were used to find sustainability indicators.
Ijerph 02 00194f4
Table 1. Key variables and indicators that describe them
Key VariablesIndicators
Environmental QualityBiodiversity – number of species
Water quality
Percentage of viable habitat (green area)
Environmentally Friendly Farms (EFF)Ratio EFF/Total (Number)
Ratio EFF/Total (Area)
Conversion rate
Revenues from Agri-Environmental ProgramsPercentage of maximum subsidy
Percentage of minimum yearly income
Green Local Product (GLP) ProductionSales revenues as percent of total sales per firm
Number of people employed
Number of firms
Profits from GLPTotal amount earned in region
Average profitability from GLP per firm
Profits from Environmentally Friendly CropsTotal amount earned in region
Average profitability from env. friendly crops per farm
Profits from Green Tourism (GT)Total amount earned from GT in region
Average profitability from GT per firm
Organizational Support for Environmentally Friendly FarmsHours of work on projects
Perceived support by farmers
Brand AttractivenessBrand awareness and acceptation
Support for Green Local ProductsHours of work on projects
Perceived support by green local producers
Social Support for Environmental StandardsPercentage of population that supports environmental standards

Acknowledgments

The research was realized within the project funded by DBU (Deutsche Bundesstiftung Umwelt) and WWF Germany: “Sustainable Regional Development in the Odra Catchment” (Grant Number: DBU AZ 18902). Collaborative research in the field requires generous commitments of time, experience and good will over long periods. In particular, we wish to thank Peter Torkler (WWF Germany), Dorota Chmielowiec (Lower Silesian Foundation for Sustainable Development) and Andrzej Ruszlewicz (Green Action) for sharing their rich knowledge of the region and its people. Their insightful comments and questions are at the heart of the understanding built by this project within the region.

Appendix 1 – Feedback Loops in Regional Sustainability Model

Regional Sustainability Model was developed using Causal Loop Diagrams. This qualitative system dynamics approach emphasizes the system structure described in terms of balancing and reinforcing feedback loops. Interactions between loops and shifting dominance provide the explanation for the complex system behavior. Here we describe one of the diagrams, Figure 4, which focuses on Environmentally Friendly Farms; however interactions with other sections of the model are also present.
When Environmental Quality deteriorates Social Support for Environmental Standards increases as people, seeing the poor state of the environment, are more eager to support some standards to improve it. This support enables the introduction of better Environmental Standards, which in turn raises the level of Environmentally Friendly Practices. After some time (delay) it leads to improvement of environmental quality. These relations create the balancing loop (B2 - Rescue Environment) which operates to keep Environmental Quality in a good state.
So far we have assumed that better Environmental Standards increase the level of Environmentally Friendly Practices. However, this is true only if we keep the number and area of Environmentally Friendly Farms unchanged. The immediate result of introducing new Environmental Standards may be the decrease of Profits from Environmentally Friendly Crops, which may discourage some farmers and decrease the number or area of Environmentally Friendly Farms. This shows that introducing new Environmental Standards can affect the level of Environmentally Friendly Practices in two different ways and one cannot be certain whether this level will raise or fall. In effect this may cause the loop B2 (Rescue Environment) not to operate in a desired way.
When Profits from Environmentally Friendly Crops go down Perceived Environmental Benefits (any benefits coming from environment perceived by community in the region) will also go down. This will lower Social Support for Environmental Standards and in turn will make more difficult to keep Environmental Standards which is our main tool for improving Environmental Quality. This describes another balancing loop (B1 - Environmental Standards Raise Costs and Lower Crops, as a consequence of lower productivity), which operates to keep Environmental Standards at low level. This loop describes the resistance, which environmental NGOs quite often encounter. The source of this resistance is the mental model, which states that good environment means poor economy. The further loops in our model show why this does not always have to be true, however in the short term it quite often happens this way.
The above analysis shows that in order to start the process of improving Environmental Quality through increasing the number of Environmentally Friendly Farms the impulse from outside is needed. Such an impulse can be provided through Organizational Support for Environmentally Friendly Farms. This in practice is mostly done by environmental NGOs but it can also be done by local or regional authorities or other institutions. Usually these stakeholders decide on the target – Desired Level of Environmentally Friendly Practices and then execute the pressure until a gap between the actual level of Environmentally Friendly Practices and Desired Level of Environmentally Friendly Practices disappears. This process creates another balancing loop (B3 - Organizational Pressure for Environmentally Friendly Practices), which is extremely important for achieving environmental goals. It is aimed to make the system operate without external support, which means that ultimately environmentally friendly farms should be economically self-sufficient. But in order to achieve it, there must be a certain period when sufficient support is provided to those farms. It should be emphasized that institutional support for creating environmentally friendly farms, as well as producing and promoting green local products and developing green tourism is one of the crucial factors of success in this process. Recent research on innovation implementation [15] shows that one of the main reasons for collapses of improvement initiatives is cutting the external support too early. The balancing loop B3 must operate for a sufficiently long time to enable the reinforcing loops, which amplify innovation, to operate in the right direction. The role of environmental NGOs (or other institutions) is to keep this process operating until critical thresholds are reached and reinforcing loops can amplify both economic and environmental goals at the same time.
The first reinforcing loop (R1 - Revenues through Agri-Environmental Programs) connects Environmentally Friendly Practices with Profits from Environmentally Friendly Crops. The Environmentally Friendly Farms become more profitable, which encourages other farmers to increase Environmental Standards and generates more Environmentally Friendly Practices which finally makes possible to obtain even more Revenues from Agri-Environmental Programs. It should also be noted that increasing Profits from Environmentally Friendly Crops makes it easier for people in the region to perceive environmental benefits, and raises Social Support for Environmental Standards. We have seen that short-term drop in Profits from Environmentally Friendly Crops is corrected through longer-term Revenues from Agri-Environmental Programs.
The other long-term process is connected with “green tourism” opportunities, which are only possible, when Environmental Quality is sufficiently good. Improving Environmental Quality influences Touristic Attractiveness of the region but after significant time delay. Raised Touristic Attractiveness makes possible to obtain additional Profits from Green Tourism, which raises Perceived Environmental Benefits. This process closes another reinforcing loop (R2 - Nature Attracts Tourists). It affects also the balancing loop B1 (Environmental Standards Raise Costs and Lower Crops) making easier to keep Environmental Standards.
Environmental Standards not only define the standards for farmers but also can be used to introduce the local brand for “Green Local Products” (GLP). If GLP Production brings profits the part of it can be reinvested to increase or diversify the production bringing even more Profits from Green Local Products. These links create the reinforcing loop R6 (GLP Growth through Reinvestment). Profits from Green Local Products raise Perceived Environmental Benefits so it also contributes to better environmental standards.
The relation between production and profits from green local products is obviously influenced by many factors such as: Attractiveness of Green Local Products to Consumers, external Support for Green Local Products, Regional Food Processing Capacity and Local Cultural Identity. Brand Attractiveness constitutes another important factor as the successful introduction of a brand may greatly help in marketing and sales of Green Local Products.
Environmentally Friendly Farms and Green Local Products are tightly connected. GLP Production is mainly based on crops from Environmentally Friendly Farms. Increased demand on crops from environmentally friendly farms leads to bigger Profits from Environmentally Friendly Crops. This makes being an “environmental farmer” more attractive and leads to the growth of Environmentally Friendly Farms. This process creates another reinforcing loop R5 (Environmentally Friendly Farms and Green Local Products Reinforce Each Other).
Green Local Products are also connected with tourism. Many Green Local Products will be sold through green tourism facilities. In this way Touristic Attractiveness affects Profits from Green Local Products. This link closes another reinforcing loop (R3 - Revenues from Local Products Sales to Tourists). Touristic Attractiveness also improves the Region Image, which makes the local brand much more recognized and attractive. These links close reinforcing loop R4 (Revenues from Local Products through Green Image).
To sum up, the balancing loop B1 operates in the short term hampering the introduction of Environmental Standards aimed to improve Environmental Quality. In the long term, reinforcing loops R1 to R6 make environmental benefits much more obvious for the community in the region. This means that introducing Environmental Standards is the process which requires patience – it is necessary to wait to overcome the initial negative economic effects. The model helps to understand that “environment or economy” is a false dichotomy if we look at the situation with sufficiently long time horizon.

References and Notes

  1. Sterman, J. Business Dynamics: Systems Thinking and Modeling for a Complex World; Irwin/McGraw-Hill: New York, 2000. [Google Scholar]
  2. Sterman, J. Syst. Dyn. Rev 2002, 18, 501–531.
  3. Rittel, H.; Webber, M. Policy Sciences 1973, 4, 155–159.
  4. Gleick, P. H. Science 2003, 302(5650), 1524–1528.
  5. Holling, C. S. (Ed.) Adaptive environmental assessment and management; John Wiley: New York, 1978.
  6. Walters, C. J. Adaptive Management of Renewable Resources; Macmillan Publishing: New York, 1986. [Google Scholar]
  7. Gunderson, L. H.; Holling, C. S.; Light, S. S. (Eds.) Barriers and Bridges to the Renewal of Ecosystems and Institutions; Columbia University Press: New York, 1995.
  8. Sendzimir, J.; Light, S.; Szymanowska, K. Environments 1999, 27(1), 115–136.
  9. Gunderson, L. H.; Holling, C. S. Panarchy: Understanding Transformations in Systems of Humans and Nature; Island Press: Washington, D.C, 2002. [Google Scholar]
  10. Light, S. S.; Blann, K. Adaptive management and the Kissimmee River restoration project unpublished manuscript. 2000.
  11. Walters, C.; Korman, J.; Stevens, L. E.; Gold, B. Conservation Ecology. 2000, 4, p. 1. [online] URL: http://www.consecol.org/Journal/vol4/iss2/art1/index.html.
  12. Sendzimir, J.; Balogh, P.; Vári, A. Modelling Biocomplexity in the Tisza River Basin within a Participatory Adaptive Framework. Proceedings iEMSs Conference, Osnabruck; 2004. [Google Scholar]
  13. Vennix, J. A. M. Syst. Dyn. Rev 1999, 15, 379–401.
  14. Senge, P. M. The Fifth Discipline: The Art & Practice of The Learning Organization; Currency Doubleday: New York, 1990. [Google Scholar]
  15. Repenning, N. Organization Science 2002, 13(2), 109–127.
  16. For a historical review of community indicators, see: Gahin, R.; Paterson, C. National Civic Review 2001, 90(4), 347–361.
  17. A lot of information about sustainability indicators is available in the internet and the good selection of websites was provided by: Hecht, J. E. Environment 2003, 45(1), 3–4.
  18. Besleme, K.; Mullin, M. National Civic Review 1997, 86(1), 43–52.
  19. Meppem, T.; Gill, R. Ecological Economics 1998, 26(2), 121–137.
  20. Bell, S.; Morse, S. Sustainability Indicators: Measuring the Immeasurable; Earthscan: London, 1999. [Google Scholar]
  21. Bell, S.; Morse, S. Sustainable Development 2004, 12, 1–14.
  22. King, C. A.; Gunton, J.; Freebairn, D.; Coutts, J.; Webb, I. Australian J. of Experimental Agriculture 2000, 40(4), 631–642.
  23. Woodhouse, P.; Howlett, D.; Rigby, D. A framework for research on sustainability indicators for agriculture and rural livelihoods. In Working Paper no. 2, Sustainability Indicators for Natural Resource Management and Policy; University of Manchester: Manchester, 2000. [Google Scholar]
  24. Bossel, H. Conservation Ecology. 2001, 5, p. 12. [online] URL: http://www.ecologyandsociety.org/vol5/iss2/art12/.
  25. Morse, S.; McNamara, N.; Acholo, M.; Okwoli, B. Sustainable Development 2000, 9, 1–15.
  26. Kelly, R.; Moles, R. J. of Environmental Planning and Management 2002, 45(6), 889–912.
  27. Reed, M. S.; Dougill, A. J. The Geographical J 2002, 168(3), 224–234.
  28. Freebairn, D. M.; King, C. A. Australian J. of Experimental Agriculture 2003, 43, 223–238.
  29. Pretty, J. Regenerating Agriculture: policies and practice for sustainability and self-reliance; Earthscan: London, 1995. [Google Scholar]
  30. Bell, S.; Morse, S. Local Environment 2001, 6(3), 291–309.
  31. Checkland, P. B.; Scholes, J. Soft Systems Methodology in Action; John Wiley: Chichester, UK, 1990. [Google Scholar]
  32. Flood, R.; Jackson, M. Creative Problem Solving; Wiley: London, 1991. [Google Scholar]
  33. Coyle, G. System Dynamics Review 2000, 16, 225–244.
  34. Mingers, J.; Rosenhead, J. European J. of Operational Research 2004, 152, 530–554.

