Article

The Seasonality of Fecal Coliform Bacteria Pollution and its Influence on Closures of Shellfish Harvesting Areas in Mississippi Sound

by
Paulinus Chigbu
1,*,
Scott Gordon
2 and
Paul B. Tchounwou
3
1
Department of Biology, Marine Science Program, Box 18540, Jackson State University, Jackson, MS 39217, USA
2
Mississippi Department of Marine Resources, Bayview Avenue, Biloxi, MS 39530, USA
3
Environmental Toxicology Research Laboratory, NIH – Center for Environmental Health, Jackson State University, Box 18540, Jackson, MS 39217, USA
*
Author to whom correspondence should be addressed.
Int. J. Environ. Res. Public Health 2005, 2(2), 362-373; https://doi.org/10.3390/ijerph2005020023
Submission received: 10 January 2005 / Accepted: 10 April 2005 / Published: 14 August 2005

Abstract

:
Runoff from agricultural lands and farm animal feedlots is one of the major sources of fecal coliforms in surface waters, and fecal coliform (FC) bacteria concentrations tend to vary with season because of seasonal variations in climatic factors. However, El Niño -Southern Oscillation (ENSO) events may affect the extent and patterns of seasonality in FC levels in coastal waters. Water quality monitoring data for shellfish management collected during El Niño (1990, 1992, 1997), and La Niña (1999, 2000) years were analyzed to evaluate the extent to which these events influenced Pearl River stage, and bacterial levels, water temperature, and salinity in the western part of Mississippi Sound. Models to predict FC levels in relation to various environmental factors were also developed. In 1990, 1992 and 1997, FC geometric mean counts peaked in late winter (January/February) reaching 120 MPN (February 1990), 165 MPN (January 1992), and 86 MPN (January 1997), and then decreased considerably during spring and summer (1.2 – 19 MPN). Thereafter, FC abundance increased slightly in fall and early winter (1.9 – 24 MPN). Fecal coliform abundance during the 2000 La Niña year was much lower (1.0 – 10.3 MPN) than in 1992 (1.2 – 165 MPN), and showed no seasonal pattern from January to August, perhaps due to the relative scarcity of rainfall in 2000. In 1995 (ENSO neutral year), peak geometric mean FC count (46 MPN) was lower than during El Niño years and occurred in early spring (March). The seasonal and between year variations in FC levels determined the number of days during which the conditionally approved shellfish growing area was opened for harvesting shellfish. For example, from January to April 1997, the area was not opened for shellfish harvesting, whereas in 2000, the number of days during which the area was opened ranged from 6 – 27 (January to April) to 24 – 26 (October to December). ENSO events thus influenced the extent and timing of the peak levels of fecal coliforms in Mississippi Sound. Models consisting of one or more of the variables: Pearl River stage, water temperature, and salinity were developed to predict FC concentrations in the Sound. The model parameter(s) explained 56 to 91% of the variations in FC counts. Management of shellfish in Mississippi Sound can be improved by utilizing information on the forecasted three to seven years occurrence of ENSO events. In addition, since Pearl River stage was the most important variable predicting FC concentration in the Sound, a study of the levels and sources of FC bacteria in the river, especially the middle and lower sections, is needed for developing a management plan for reducing FC bacteria pollution in the Sound.

Introduction

Monitoring of fecal coliform (FC) bacteria in surface waters is important in order to minimize, if not eliminate, human exposure to pathogenic bacteria via recreational water use and ingestion of contaminated shellfish. The levels of FC bacteria in coastal waters are influenced by many factors including seasonal variations in climatic factors such as precipitation and solar radiation [12], inter-annual variations in climate due to ENSO events [35], tidal movements [67], livestock management practices in a watershed [8], and seasonal patterns of recreational water use. Therefore, it may not be appropriate to generalize the peak period of fecal pollution in surface waters [910]. To better design water quality monitoring programs, develop models for predicting FC concentrations, and devise appropriate management plans for reducing FC bacteria pollution, it is important to understand the extent of seasonal variation in FC abundance and the factors influencing it.
The majority of shellfish harvested in the Mississippi Gulf coast waters occurs in the western part of Mississippi Sound, an area predominantly classified as conditionally approved for shellfish harvest. The quality of water in this area is influenced to a large extent by the Pearl River whose mean stage, and therefore discharge, varies seasonally [11], and inter-annually [5]. These seasonal differences are expected to affect FC levels, and to determine the number of days during which the conditionally approved shellfish harvesting waters are opened for shellfish harvesting. However, the extent of the seasonality of FC levels relative to environmental factors in the Mississippi Sound, and the degree to which ENSO events affect the seasonal patterns are not well documented.
The objectives of this study were to: (a) determine the extent to which FC bacteria levels vary with season in the western part of Mississippi Sound, (b) assess the extent to which seasonal variations in FC abundance could be predicted by Pearl River stage, water temperature and salinity, (c) evaluate whether ENSO events influence the extent and timing of peak FC bacteria levels, and (d) determine the extent to which seasonal variations in FC levels influence shellfish harvesting period in the conditionally approved shellfish growing areas.

Materials and Methods

Water quality monitoring data collected from 1990 to 2000 for shellfish management were analyzed to evaluate seasonal patterns in, and the influence of ENSO events on FC levels. Water temperature and salinity were measured, and samples for FC analysis were collected from a conditionally approved shellfish harvesting area located in the western part of Mississippi Sound. This area was chosen for investigation because it is directly influenced by the Pearl River due to its proximity to the river mouth. Data analyzed were based on monthly samples collected, and physico-chemical parameters measured at three to ten stations. A summary of the total number of samples examined during the study is presented in Table 1; a detailed description of the sampling procedure has been reported by Chigbu et al. [5]. Water samples were collected approximately one-half meter below the surface in inverted sterile bottles on the windward side of the boat. Samples were tightly sealed and transported upright in ice, with the ice below the neck of the bottles and not subject to contamination from the melting ice. Water temperature was measured with a Taylor dial thermometer, and salinity was recorded with a hand-held refractometer. Water samples were generally analyzed within six hours of collection at the U.S. FDA- certified University of Southern Mississippi, Gulf Coast Research Laboratory. FC levels were determined by the multiple-tube fermentation technique, and reported in terms of the Most Probable Number (MPN) of organisms present per 100 ml of sample [12]. Pearl River stage data for the USGS Station at Pearl River, Louisiana, were obtained from the USGS website. FC counts were compared among months, seasons, and years using an ANOVA following log transformations. Seasons were defined as: winter (December – February), spring (March – May), summer (June – August), and fall (September – November). Models describing relationships between FC abundance and one or more environmental factors (water temperature, salinity, Pearl River stage and rainfall) were developed using a stepwise multiple regression analysis.

Results

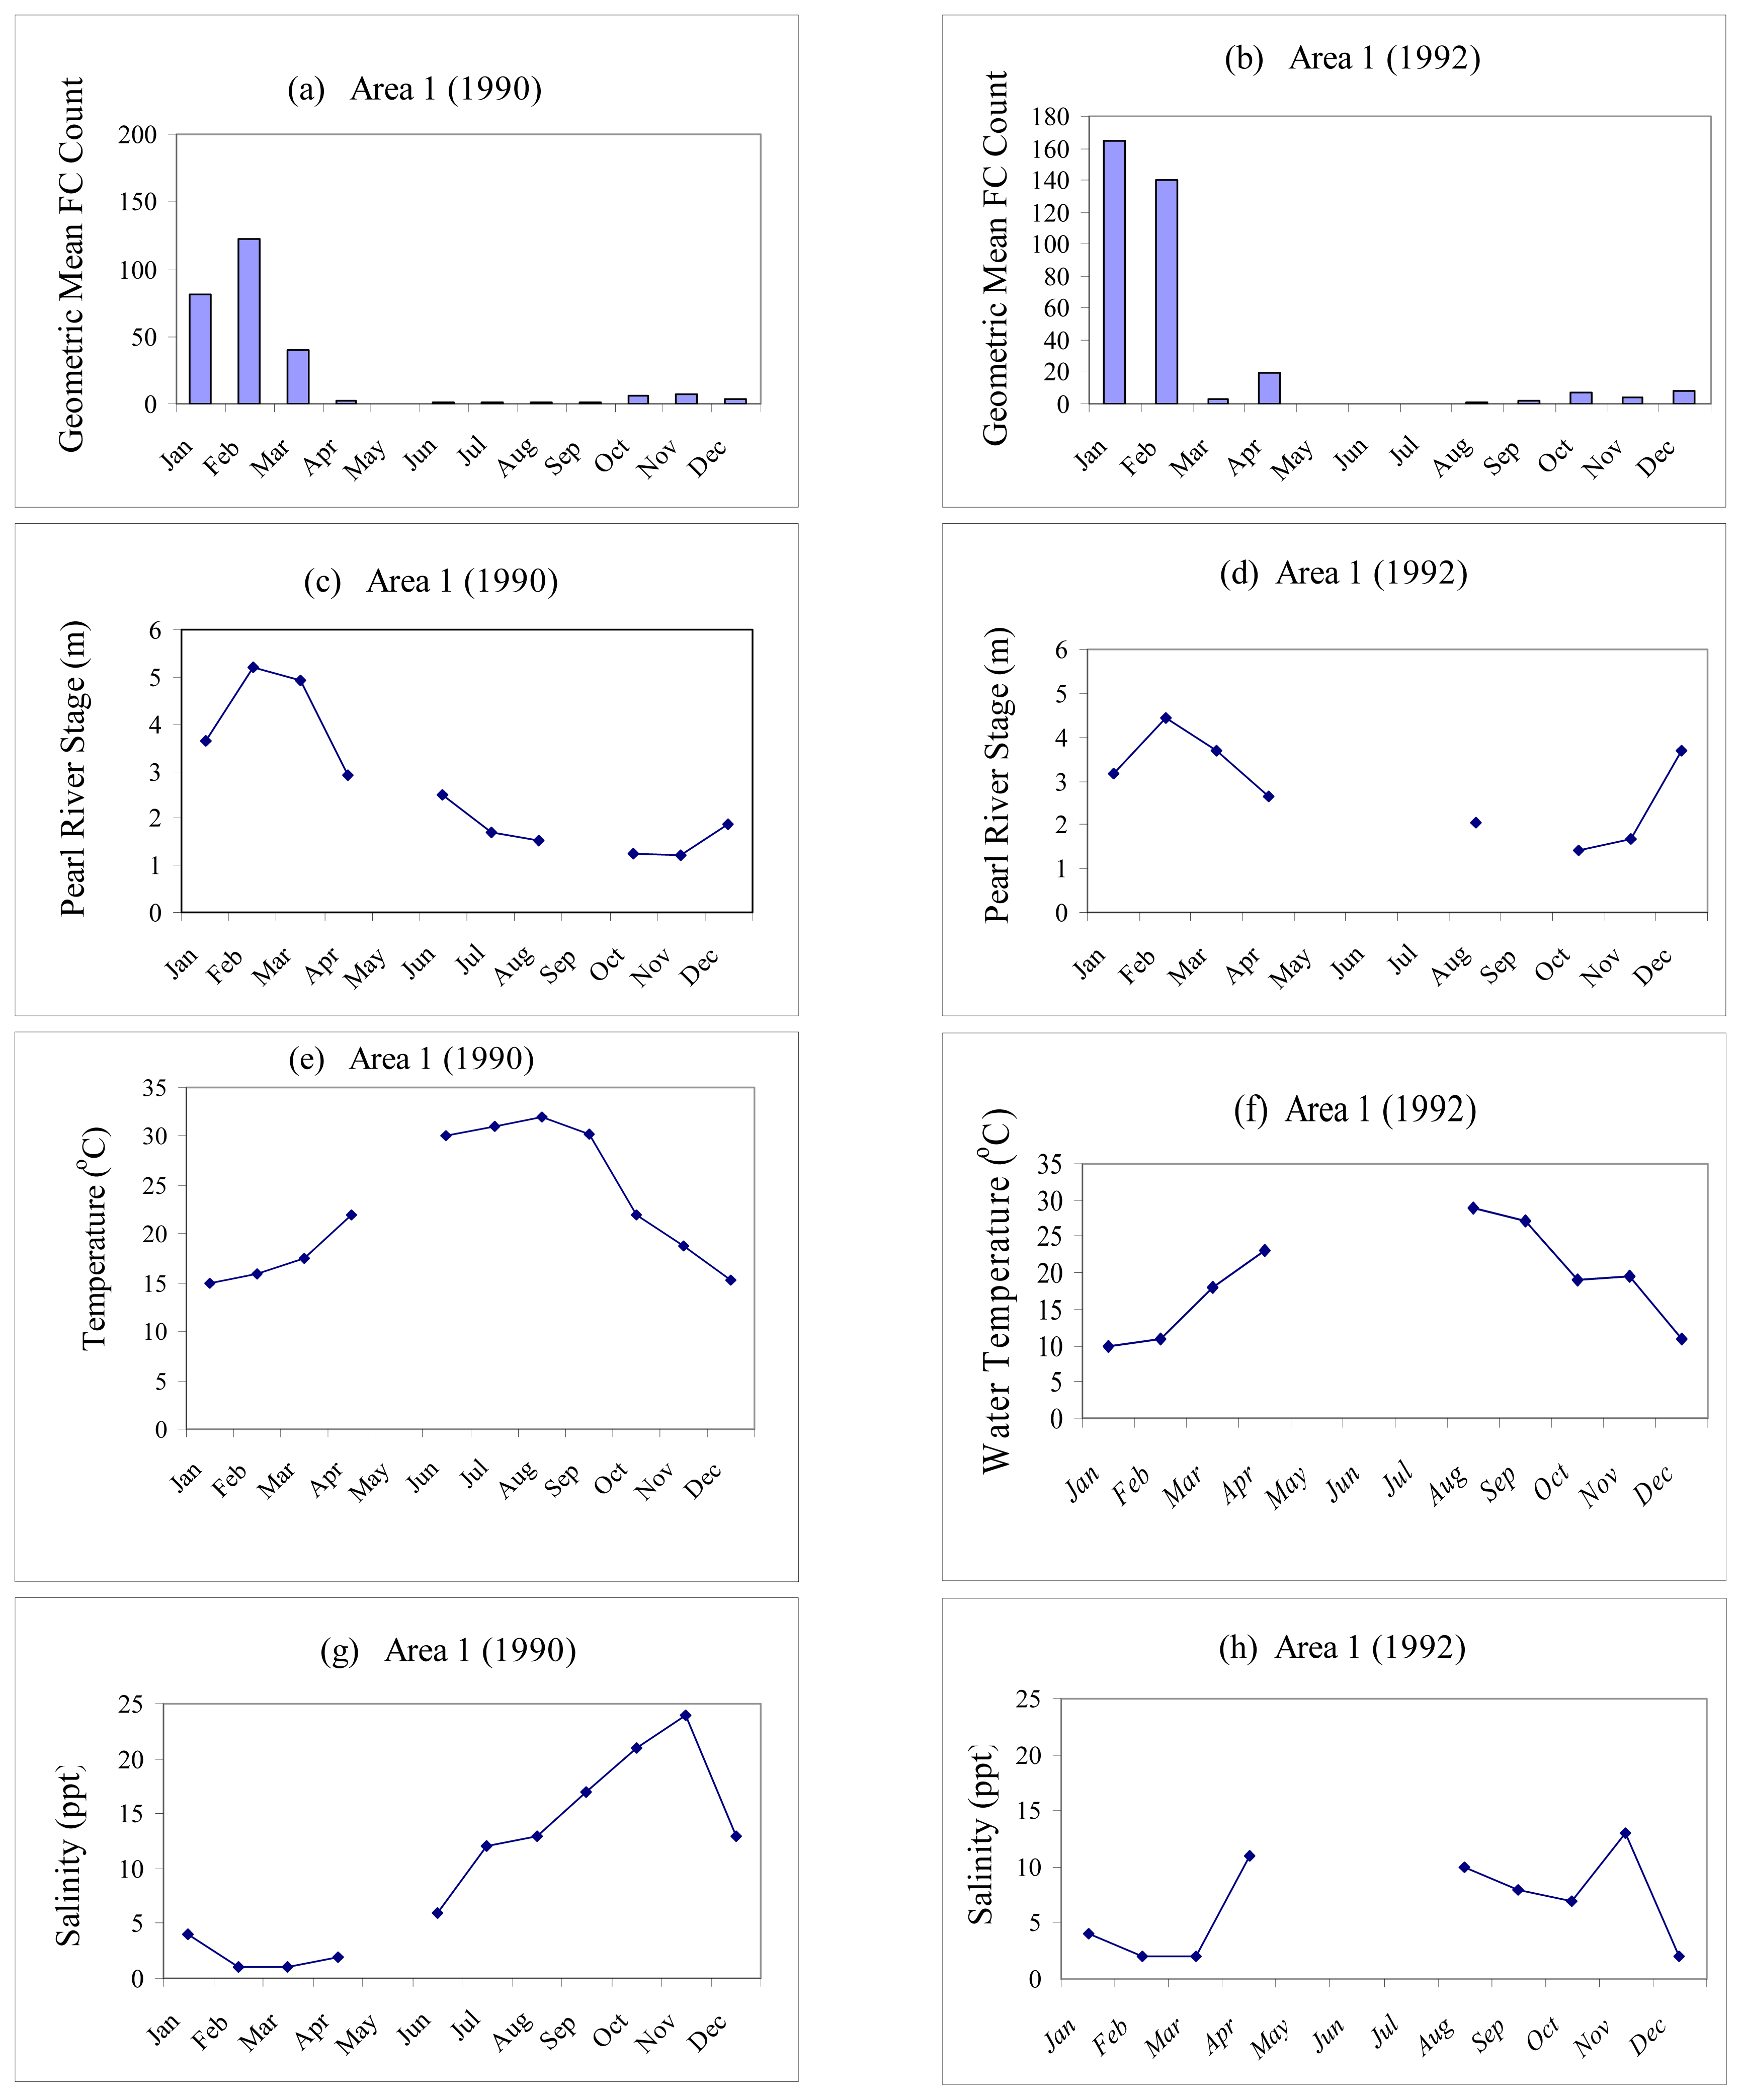
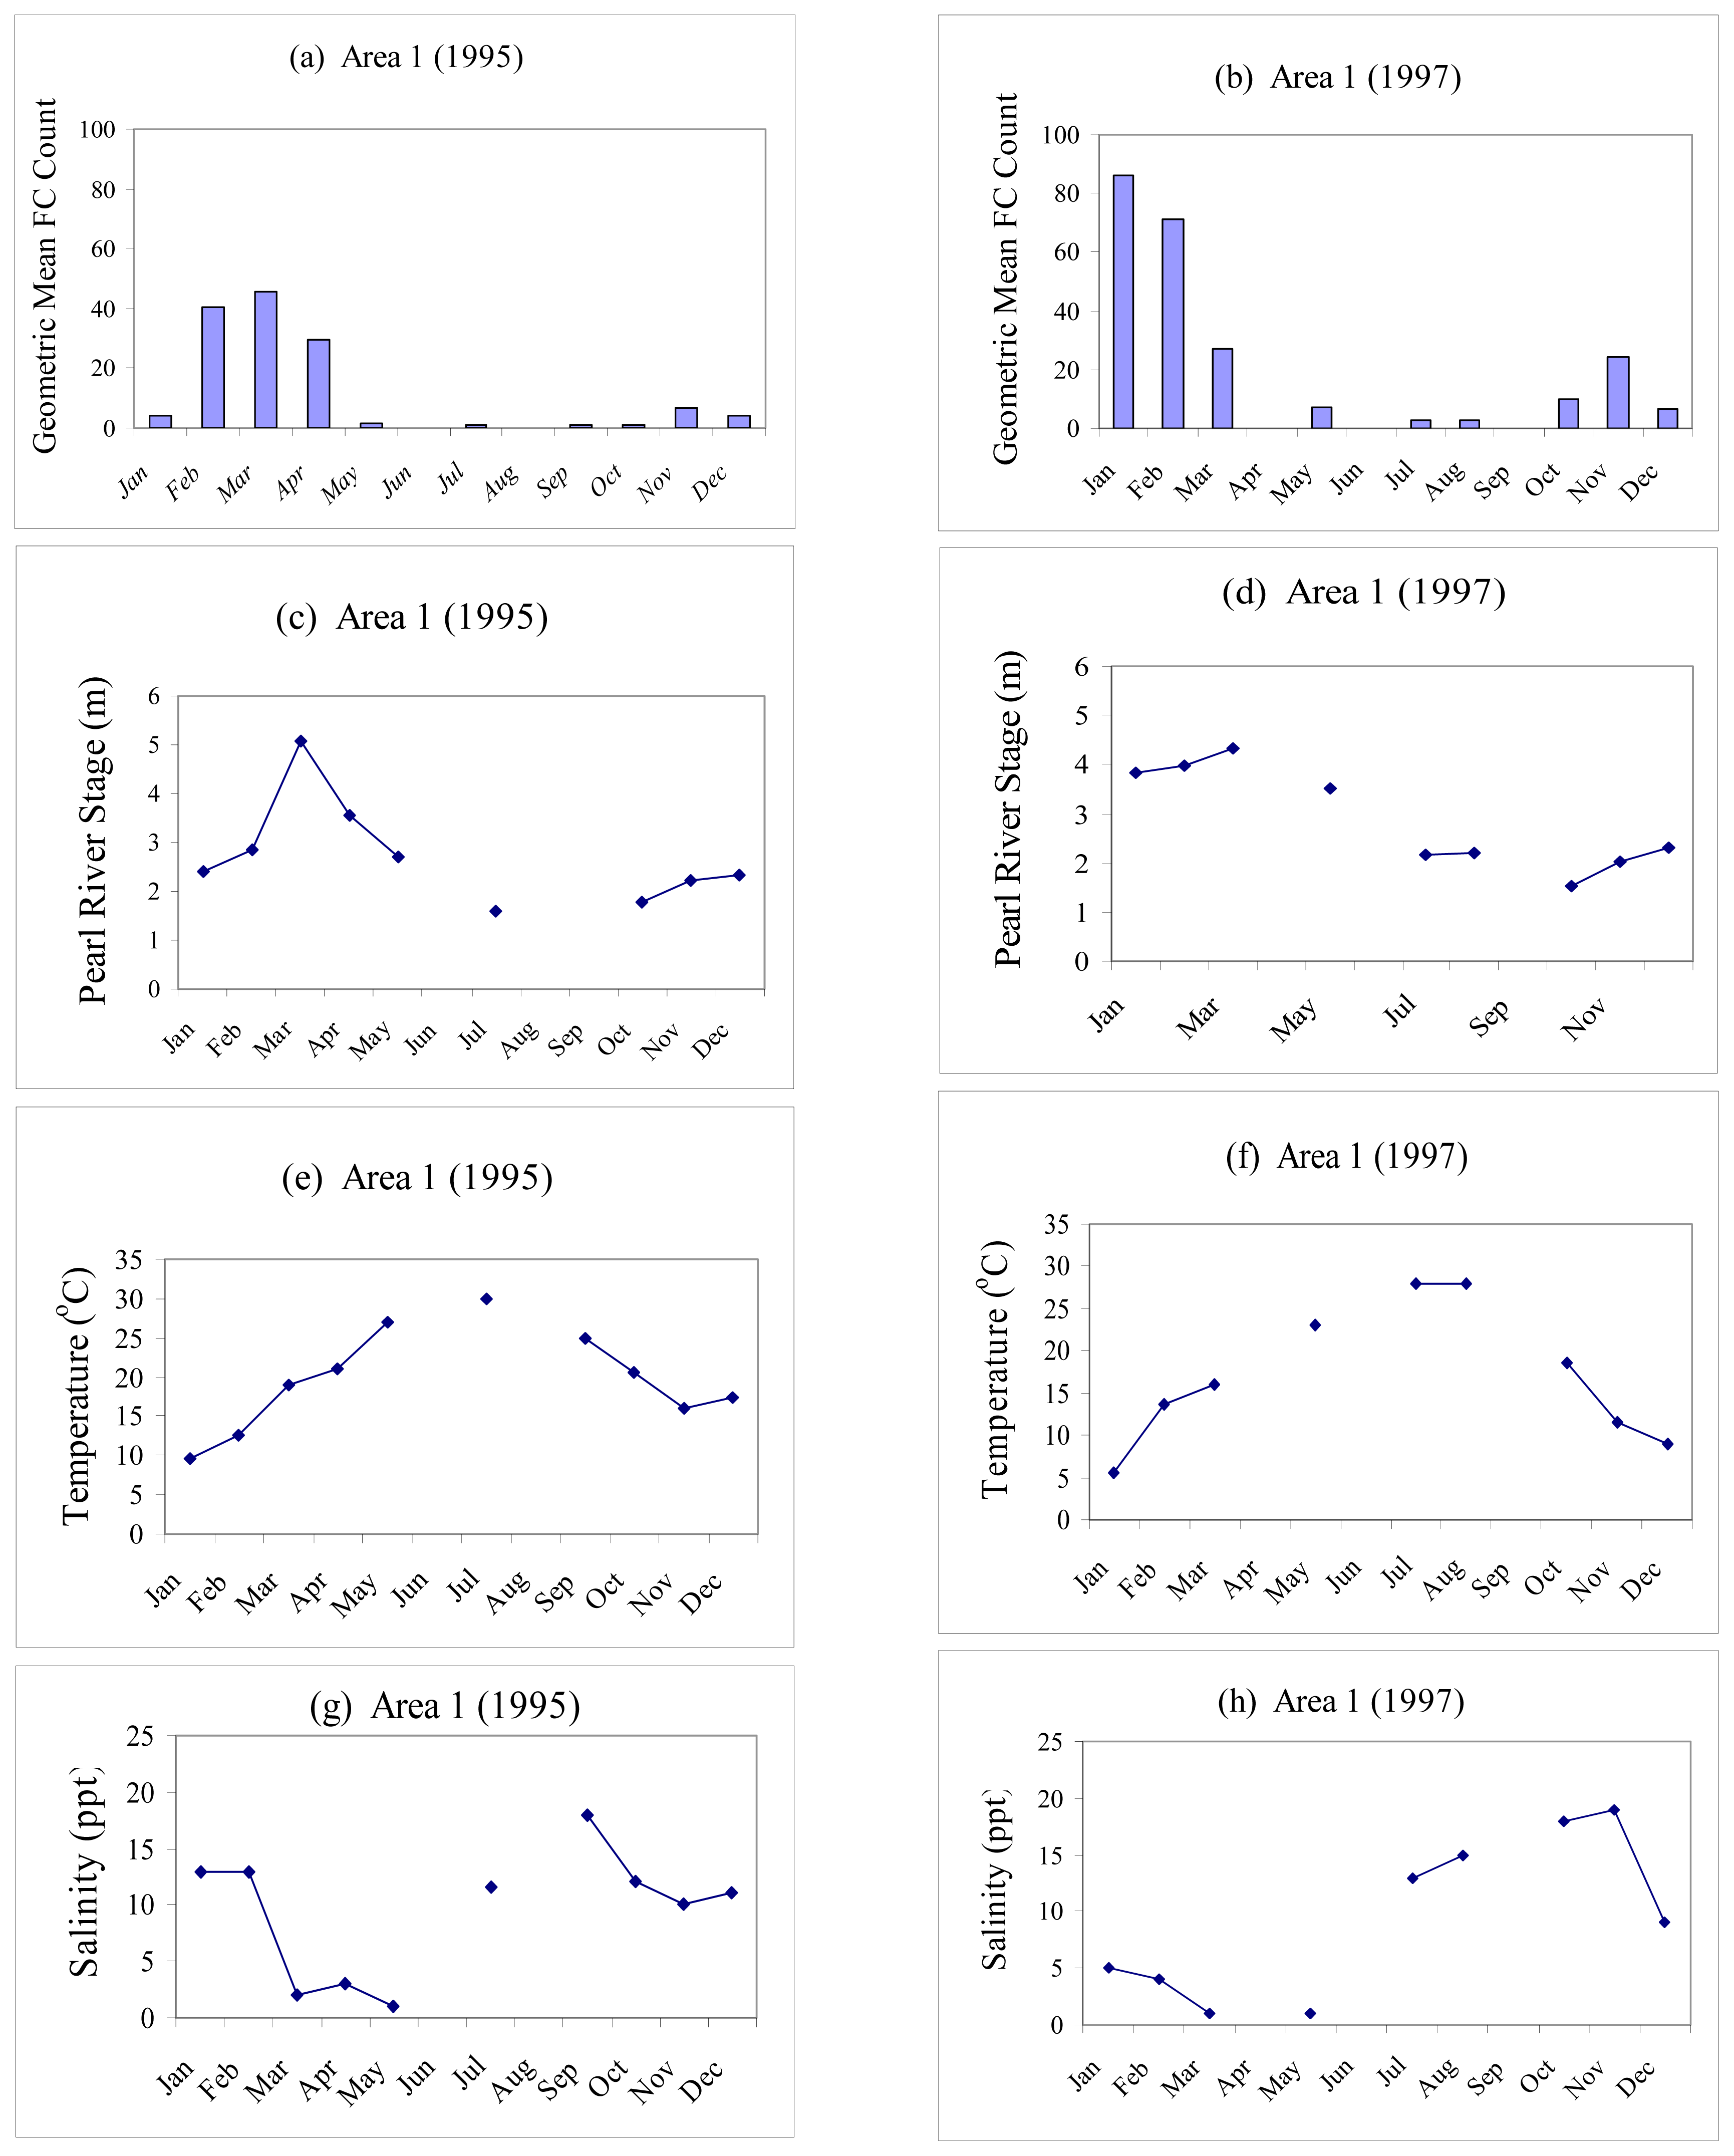
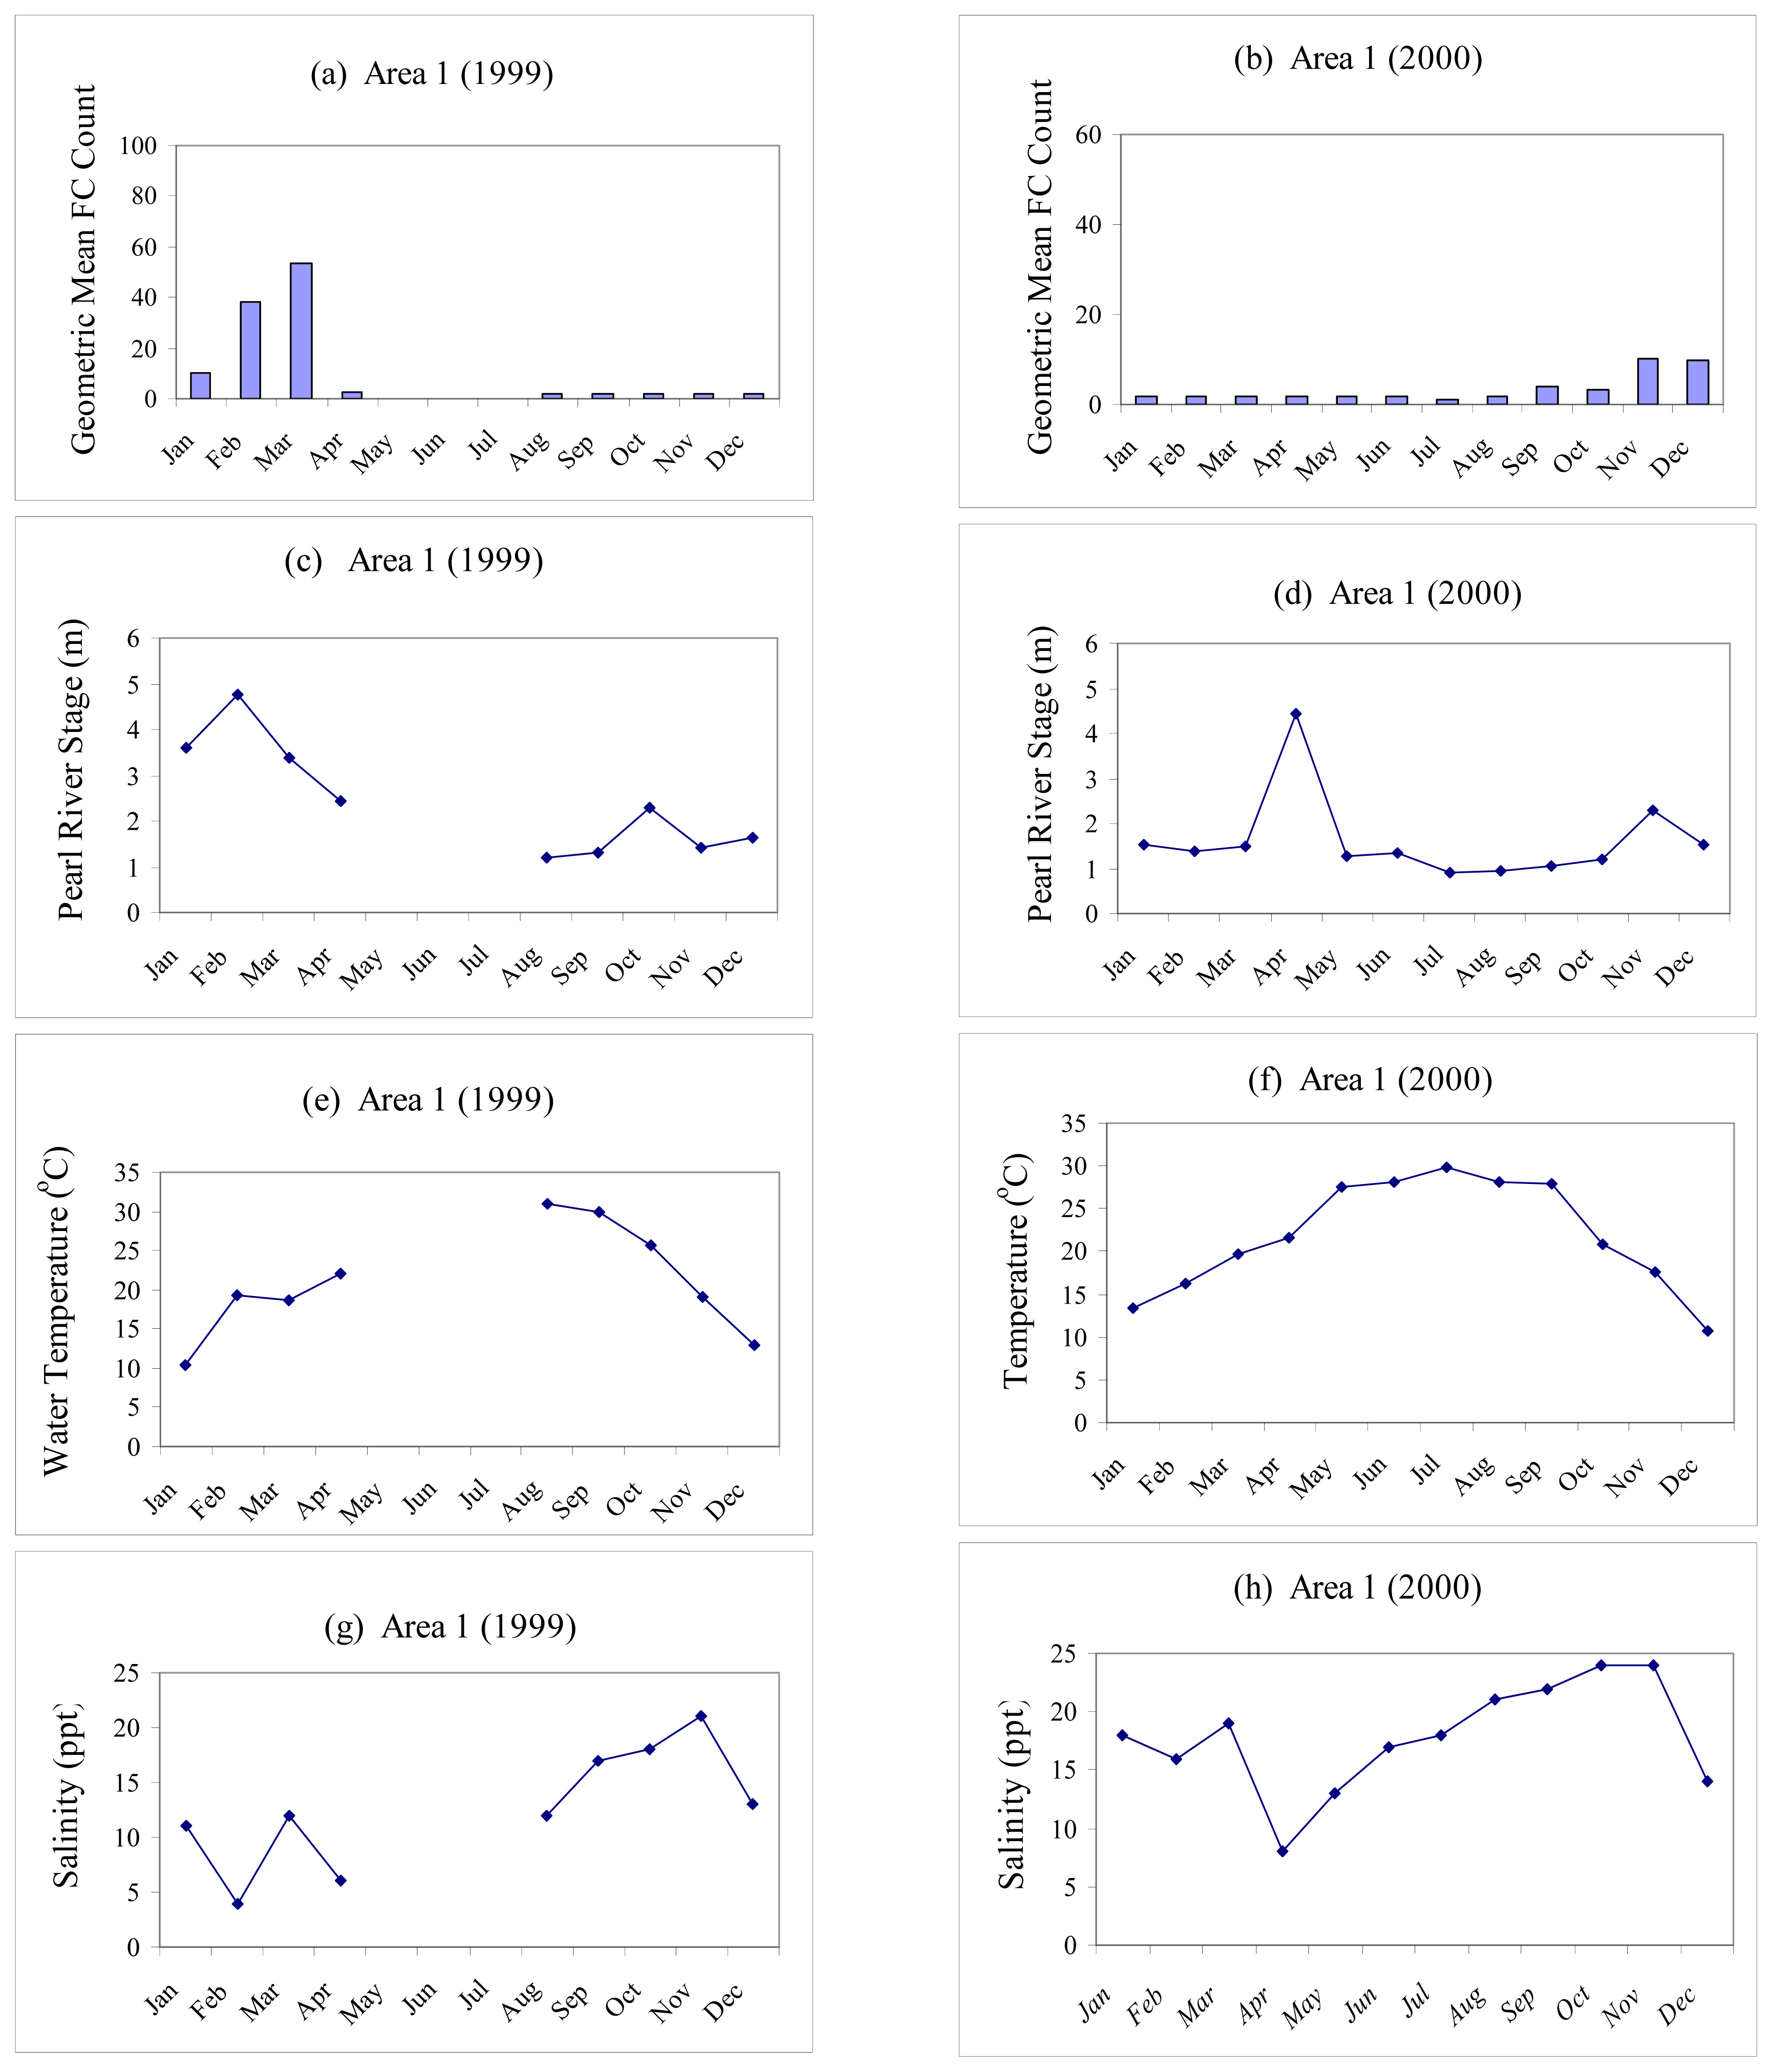
Seasonal Variations in Fecal Coliform Levels, Water Temperature, Salinity, and Pearl River Stage

Fecal coliform abundance showed clear seasonal patterns with major peaks in late winter/early spring and sometimes minor peaks in fall (Fig. 1a,b3a,b). During El Niño years (1990, 1992, 1997), FC abundance peaked earlier (January/February) than during ENSO neutral or La Niña years (1995, 1999, 2000) when a peak, if present, occurred in March. In general, FC levels were lower in late spring, summer and fall (< 25 MPN) than in late winter and early spring (< 2 – 162 MPN). When all yearly data were pooled, we observed significant differences in FC abundance among months (ANOVA, df=11,422; F-value = 23.97; p < 0.0001); geometric mean FC concentration was highest in January/February and lowest from June to September (Table 1). A similar pattern was observed when data were pooled by season; geometric mean FC numbers varied significantly among seasons (ANOVA, df = 3,430; F-value = 44.48; p < 0.0001) with the highest count occurring in winter (18.20), followed by spring (9.55), fall (4.47) and summer (1.58) as indicated by Fisher’s PLSD test, p < 0.003).
Peak geometric mean FC count in late winter/early spring was higher during El Niño years (Fig. 1b & 2b), e.g., 1992 (162 MPN) and 1997 (85 MPN) than in ENSO neutral (Fig. 2a) e.g., 1995 (45 MPN) or La Niña (Fig. 3b), e.g., 2000 (2 MPN) years. There was a significant difference among years in the mean log transformed FC counts obtained from January to April (ANOVA, p = 0.038, df = 5,17). The mean FC value in 2000 was lower than values recorded during other years (Fisher’s PLSD, p < 0.018). In January, February and March (1990, 1997), January, February and April (1992), and February, March and April (1995), the geometric mean FC counts exceeded the threshold level (14 MPN) above which the shellfish harvesting area must be closed. In 2000, the geometric mean FC counts were < 14 MPN during each of the months sampled (Fig. 3b).
As expected, Pearl River stage also varied seasonally; it generally increased from January (1.52 – 3.85m), peaked in February (4.45 – 5.21m), March (4.32 – 5.09m) or April (4.43m), and then declined to relatively low levels in summer (0.91 – 1.61m) and fall (1.23 – 1.54m) (Fig. 1c,d3c,d). Water temperature varied seasonally from 5.6 to 32°C with the highest values occurring in summer 1990 and lowest in winter 1997 (Fig. 1e,f3e,f). Salinity was lowest in winter/spring, ~1 – 8ppt, and generally highest in late fall, ~13 – 24ppt (Fig. 1g,h3g,h).

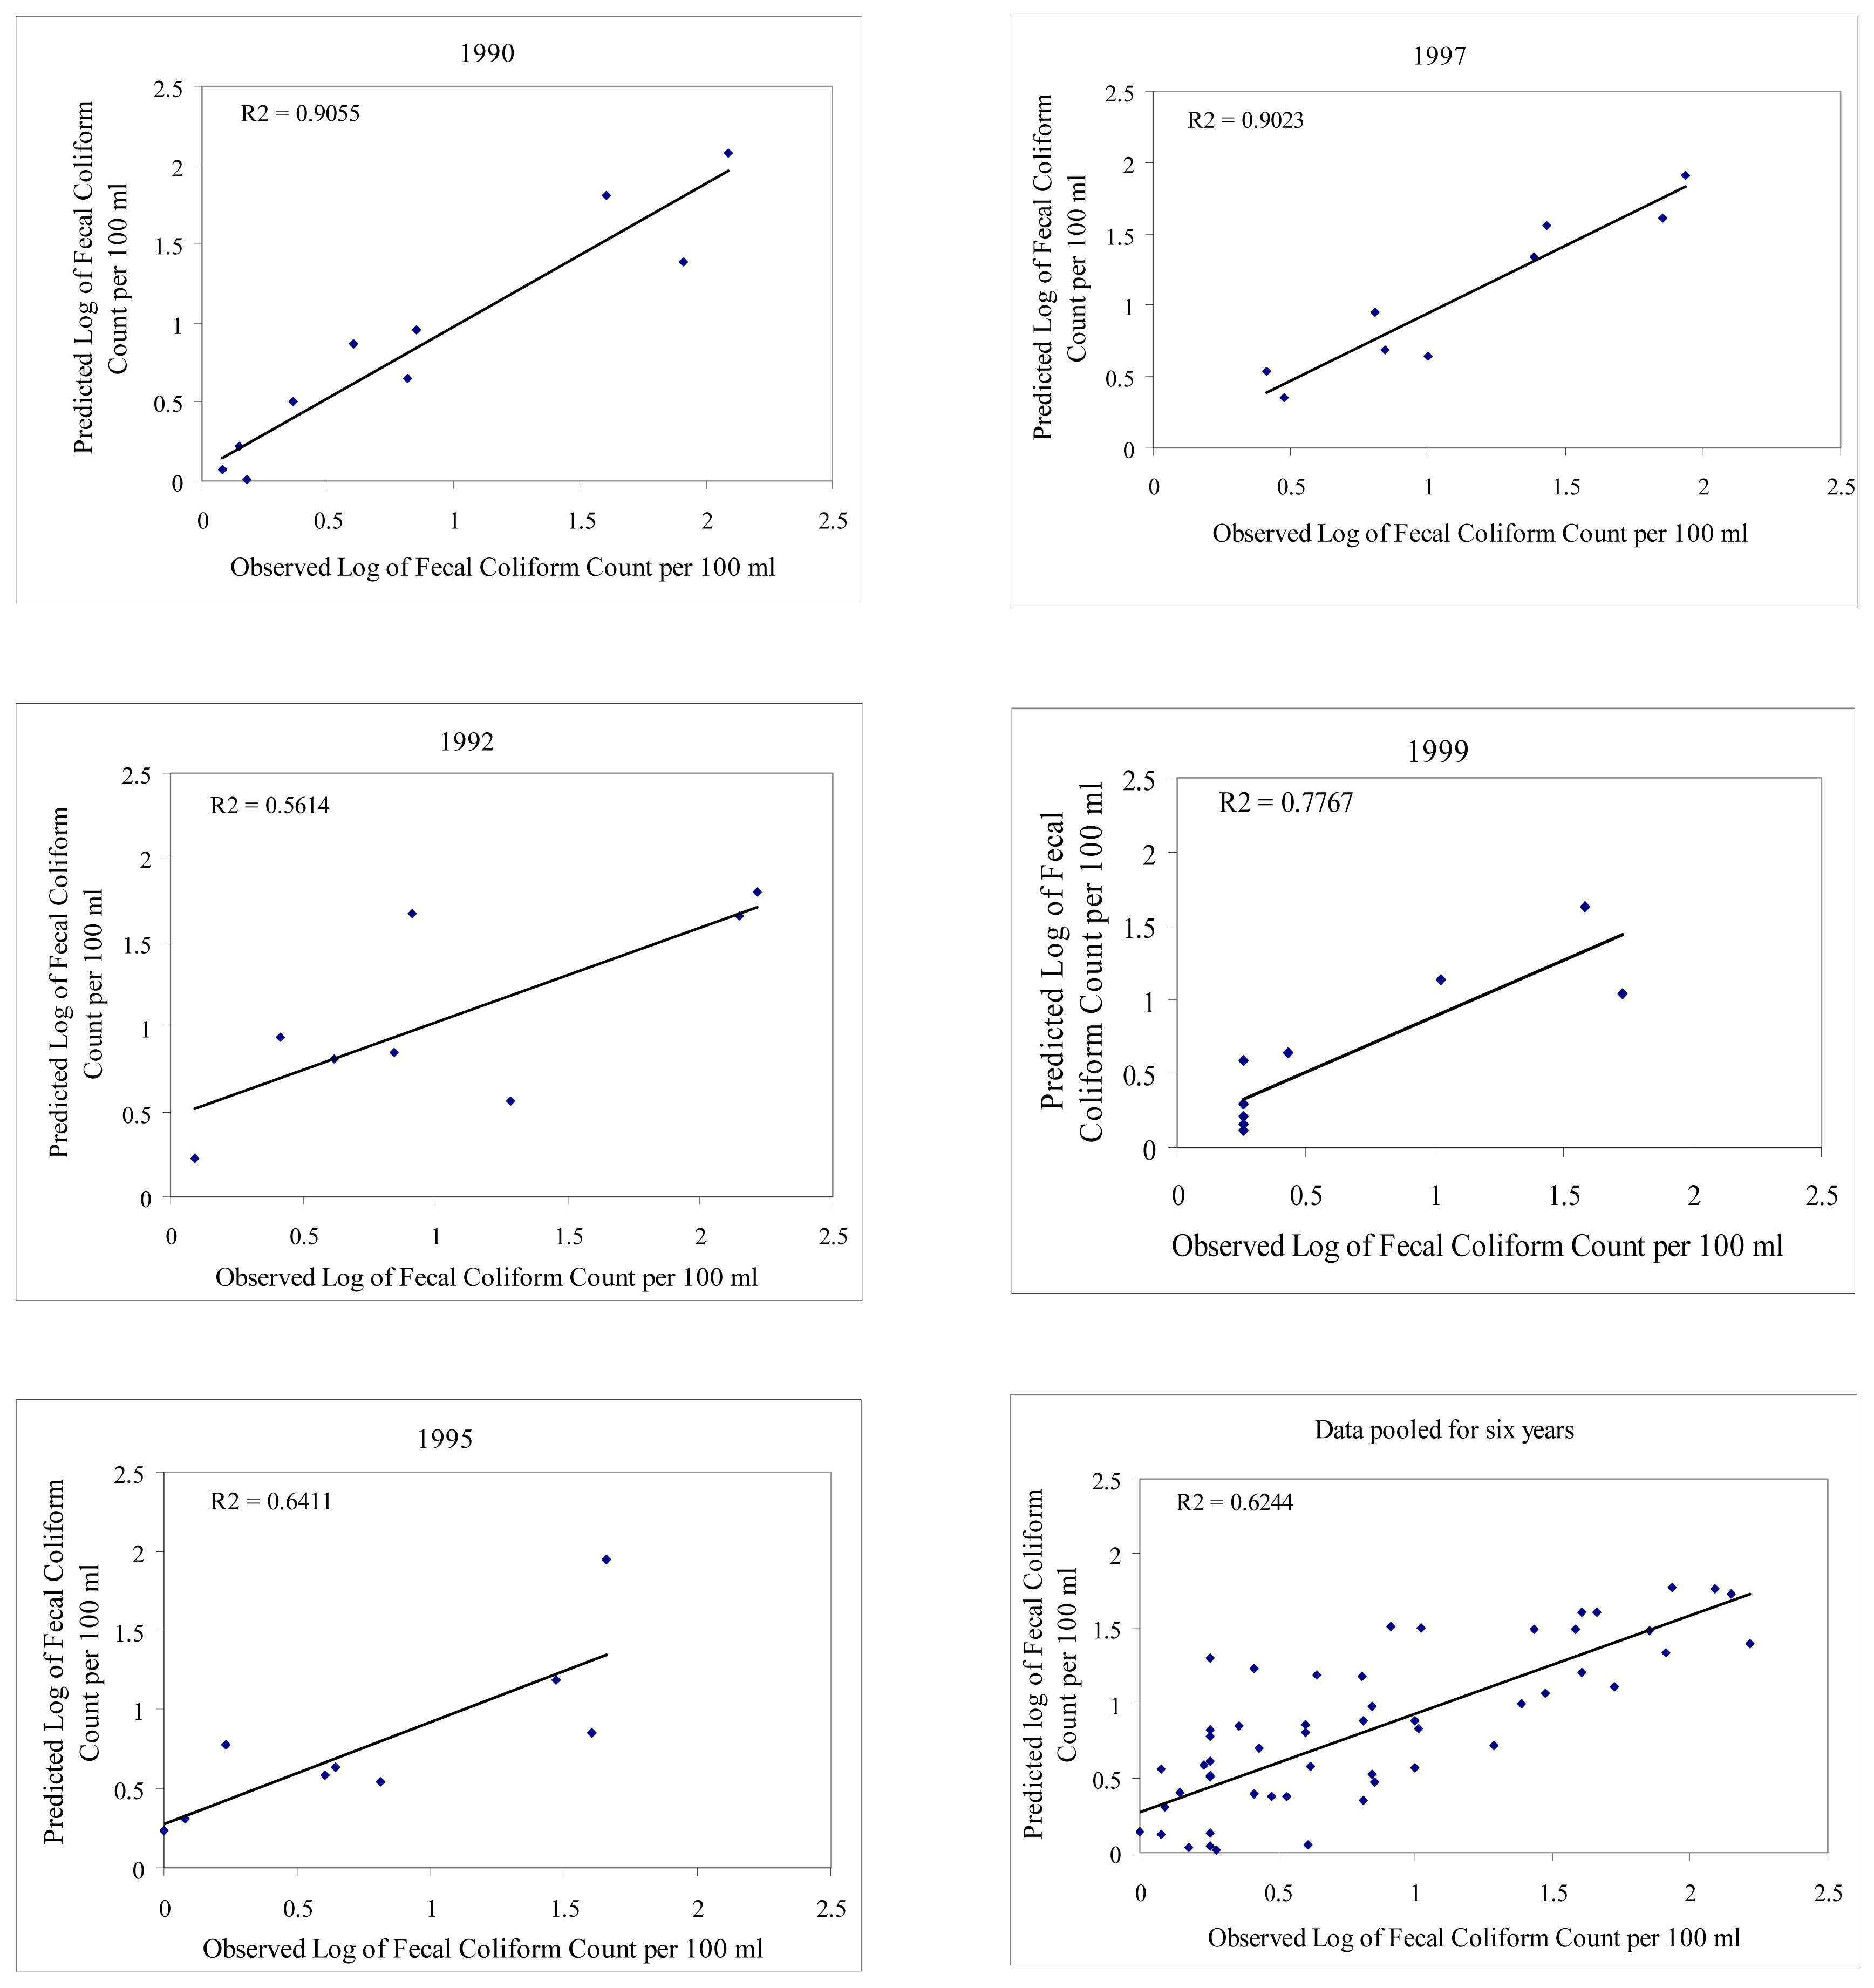
Relationships between Fecal Coliform Levels and Water Temperature, Salinity, and Pearl River Stage

The relationships between FC counts and the environmental variables are shown in Figures 4 & 5. Fecal coliform geometric mean counts were significantly related to Pearl River stage in 1990 (r2 = 0.65, p = 0.005, n = 10), 1995 (r2 = 0.71, p = 0.0021, n = 10), and 1999 (r2 = 0.77, p = 0.002, n = 9); relationships in 1992 (r2 = 0.27, p = 0.186, n = 8), 1997 (r2 = 0.41, p = 0.06, n = 9) and 2000 (r2 = 0.01, p = 0.746, n = 12) were poor (Fig. 4). Significant relationships were also observed between FC levels and water temperature in 1990 (r2 = 0.67, p = 0.038, n = 11), 1992 (r2 = 0.61, p = 0.017, n = 9), and 1997 (r2 = 0.49, p = 0.036, n = 9); relationships in 1995 (r2 = 0.08, p = 0.434, n = 10), 1999 (r2 = 0.03, p = 0.642, n = 9) and 2000 (r2 = 0.269, p = 0.084, n = 12) were poor (Fig. 5). It was only in 1990 that a significant relationship was obtained between FC levels and salinity (r2 = 0.44, p = 0.025, n = 11). A stepwise multiple regression analysis was conducted to select environmental factors that best predict FC concentrations in the Sound. The dependent variable in the model was log transformed FC concentration and independent variables were water temperature, Pearl River stage and salinity for each of the years, as well as for all years combined. The regression equations describing these relationships are presented below:
Log ( FC ) = 1.39 + 0.59 ( RS ) + 0.06 ( SAL ) - 2.04 Log ( WT ) , r 2 = 0.91 , p = 0.002             ( 1990 ) Log ( FC ) = 5.21 - 3.41 Log ( WT ) , r 2 = 0.56 , p = 0.032             ( 1992 ) Log ( FC ) = - 0.56 - 0.49 ( RS ) , r 2 = 0.64 , p = 0.009             ( 1995 ) Log ( FC ) = - 0.99 - 0.72 ( RS ) - 0.04 ( WT ) + 0.07 ( SAL ) , r 2 = 0.90 , p = 0.006             ( 1997 ) Log ( FC ) = - 0.40 + 0.43 ( RS ) , r 2 = 0.78 , p = 0.002             ( 1999 ) Log ( FC ) = 0.86 + 0.29 ( RS ) - 0.04 ( WT ) , r 2 = 0.62 , p < 0.0001             ( 1990 - 2000 )
where, FC = Fecal coliform counts per 100ml; RS = Pearl River stage (m); SAL = Salinity (ppt); WT = Water temperature (°C).
A comparison of the predicted and observed FC concentrations for each year and all years pooled is presented in Fig. 6. Pearl River stage was the most important factor influencing FC concentration each year except in 1992, when water temperature was the only important factor. In 1990 and 1997, river stage, salinity and water temperature combined explained about 90% of the variations in FC levels in the area which was higher than the percent contribution by each of the factors alone. In 1992, water temperature explained about 56% of the variations in FC abundance; inclusion of river stage and salinity in the model did not improve the relationship. In 1995 (ENSO neutral year) and 1999 (La Niña year), the stepwise regression procedure identified Pearl River stage as the most important variable, and it accounted for 64% and 78% respectively, of the variations in FC abundance. The concentrations of FC bacteria in 2000 were low (< 2 to ~10 MPN) and thus were not strongly related to any or all of the three measured environmental factors combined. When data for the six years were pooled, it was observed that variations in FC abundance were mainly due to Pearl River stage and water temperature (r2=0.62).

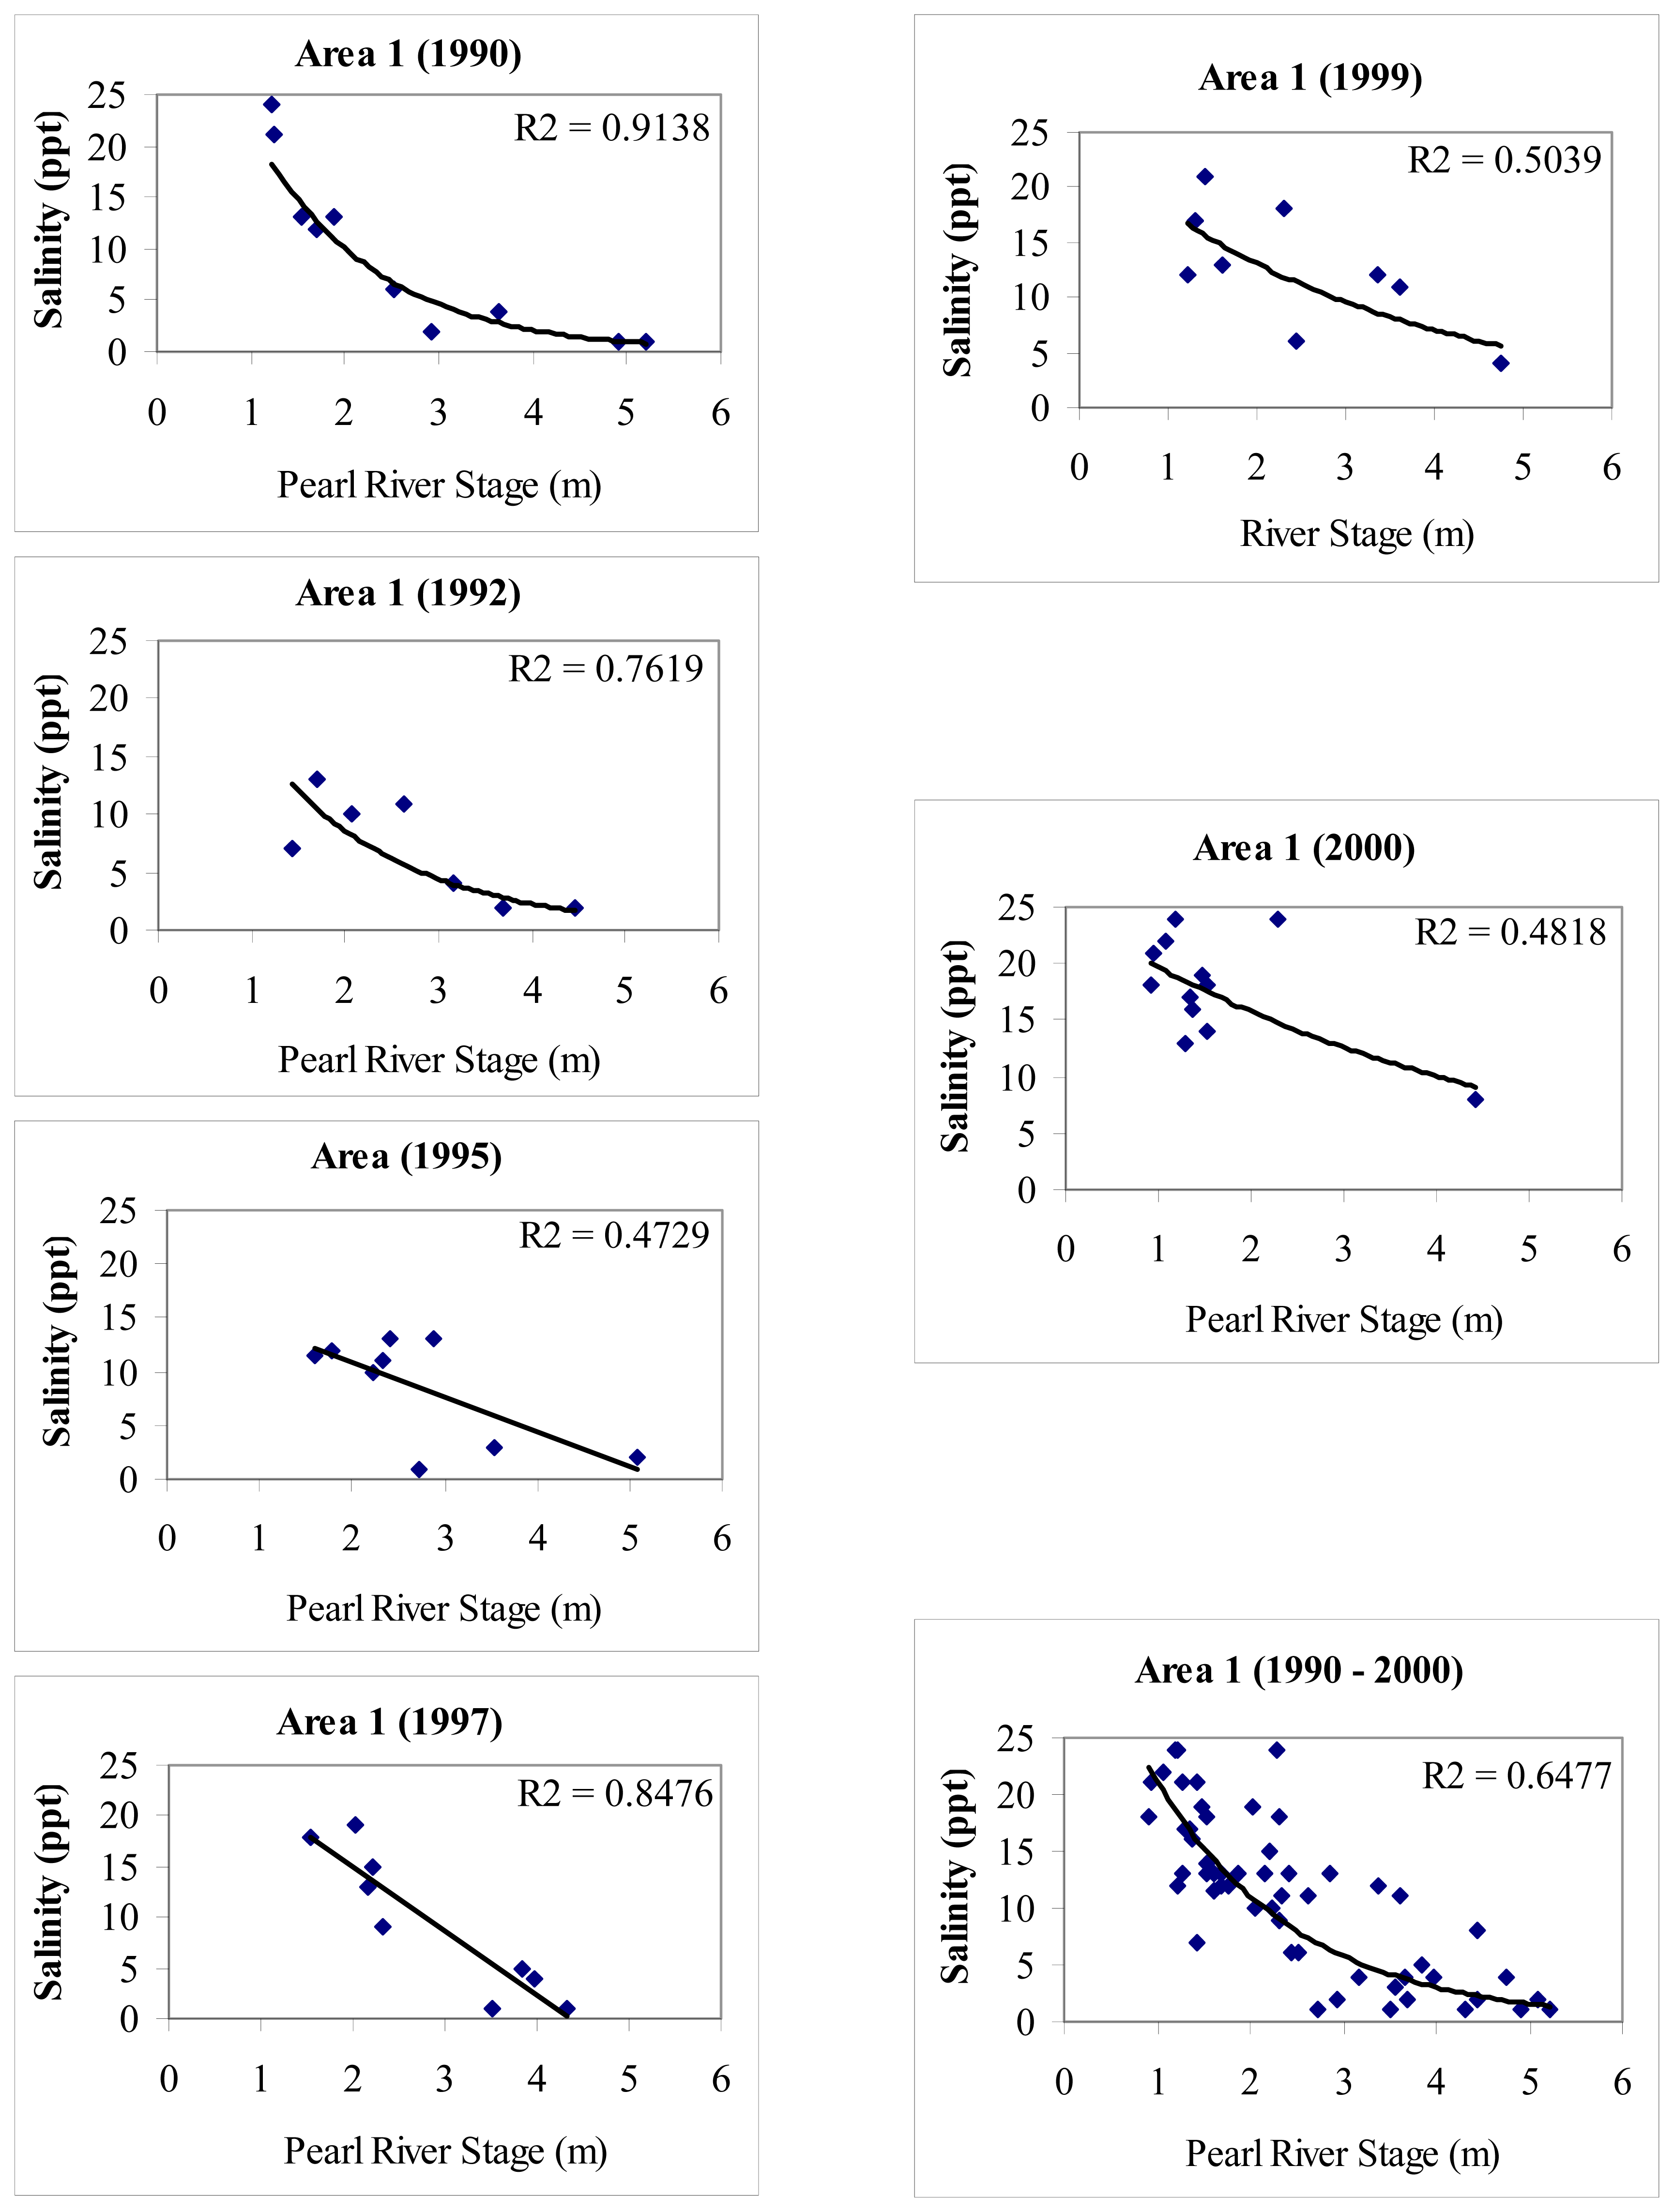
Relationship between Pearl River Stage and Salinity

Pearl River stage was the most important variable predicting salinity, and on average, explained about 65% of the variability in salinity (Fig. 7). A higher percentage of the variability in salinity was explained by river stage during El Niño years 1990 (91%), 1992 (76%), 1997 (85%) than during ENSO neutral, 1995 (47%) or La Niña years, 1999 (51%) and 2000 (48%).

Seasonal Patterns of Closure of the Shellfish Growing Area and its Relationship to ENSO Events

The shellfish-harvesting season in Mississippi is from October to April, with little or no harvesting occurring from May to September. From January to April 1997 the study area was not opened for shellfish harvesting because of high FC levels. During the same period in 1999, the maximum number of days that the area was opened was six (April), whereas from October to December 1999 the area was opened for at least 22 days (Fig. 8a). In 2000, the area was opened for harvesting for many days, ranging from 6 – 27 (January to April) to 24 – 26 (October to December).
Mean salinity (r2 = 0.62, p = 0.047, n = 14) and Pearl River stage (r2 = 0.80, p < 0.0001, n = 14) were correlated with the total number of days that the area was opened for harvesting shellfish each month (Fig. 8b,c). Pearl River stage < 3.05 m (10 ft) or mean salinity > 12 ppt appeared to be the best conditions that met the established geometric mean FC standard (≤ 14 MPN) required for the area to be opened each month for shellfish harvesting.

Discussion

Fecal coliform dynamics in coastal waters depends on the amount of bacterial loading from streams and rivers, water mixing and dispersion in receiving waters, and bacterial losses due to death and sedimentation. In the western part of Mississippi Sound, inter-annual variations in FC levels due to ENSO events are strongly correlated with Pearl River stage [5]. In a study of three streams in Virginia [8], it was observed that turbidity, water temperature, dissolved oxygen and pH explained 64 to 88% of the variations in FC abundance. The empirical models developed in this study showed that Pearl River stage, salinity and water temperature accounted for about 56 to 91% of the variations in FC concentrations. These models are useful, especially for making rapid predictions of FC abundance for shellfish management decisions pending the completion of bacteria analysis.
Pearl River drains a large area (23,000 km−2) of forested and developed land, and is one of the two major rivers flowing into the Sound. It is therefore, not surprising that it influences to a considerable extent the dynamics of FC bacteria and salinity in the western part of Mississippi Sound. A study of the levels and sources of FC bacteria in Pearl River during base flow and storm flow, especially in the middle and lower sections of the river is needed for developing a management plan for reducing the level of FC contamination in Mississippi Sound.
Following FC bacteria transport into the Sound via runoff, their loss rates from the water column depend on a multitude of factors such as nutrient availability, temperature, salinity, turbidity, degree of water mixing, solar radiation, predation and competition [1318]. However, temperature and solar radiation are considered the most important abiotic factors [1921] affecting FC death rates. For example, Xu et al. [21] found that temperature, solar radiation, and temperature and insolation combined, explained 31%, 78%, and 87% respectively, of coliform bacteria die-off coefficients in a lagoon on a French Island (Noirmountier) in the Atlantic Ocean. Burkhardt et al. [22] observed that sunlight and/or temperature accounted for up to 99% of the decrease in FC levels in estuarine waters of Alabama and Rhode Island. Inactivation rates of FC in the dark in sewage-polluted seawater were found to be higher during the summer (14 – 20°C) than during winter (8–10°C) months [23]. Furthermore, the disappearance rates of fecal coliforms in Mississippi Sound were found to be higher during the fall than in winter season [24], perhaps due to the seasonal variations in temperature and/or intensity of solar radiation. Thus seasonal variations in water temperature and/or intensity of solar radiation probably contributed to the relatively low levels of FC counts during the summer and fall seasons. This is in addition to predation by protozoans which has also been reported to be a major biotic factor influencing FC death rates. For example, in Seine River, France, predation by protozoans accounted for 47–99% of the mortality of FC bacteria [2526].
The seasonal and inter-annual patterns in the total number of days that the shellfish harvesting area was allowed to remain open reflected seasonal, as well as inter-annual patterns of climatic factors and the abundance of FC bacteria in the area. During the 1997 El Niño event, FC geometric mean level was elevated above 14 MPN from January to March, hence the area was closed to shellfish-harvesting during that period. Similarly, from January to April 1999 the area was opened for shellfish harvesting for not more than 6 days. In contrast, from fall 1999 to fall 2000 (La Niña years), FC counts were relatively low (< 14 MPN), hence the number of days that the area was opened for shellfish harvesting was generally high (6 to 27 days). It is plausible, therefore, to state that management of shellfish in Mississippi Sound can be improved by using information on the predicted occurrence of ENSO events every three to seven years.
Figure 1. Seasonal variations in the geometric mean fecal coliform abundance, Pearl River stage, water temperature and salinity in the western part of Mississippi Sound in 1990 and 1992. Fecal coliform data were not collected in May 1990 and from May to July 1992. No Pearl River stage data was available in May and September 1990, and May to July, and September 1992. No data were collected for water temperature and salinity in May 1990 and from May to July 1992.
Ijerph 02 00362f1
Figure 2. Seasonal variations in the geometric mean fecal coliform abundance, Pearl River stage, water temperature and salinity in the western part of Mississippi Sound in 1995 and 1997. No samples were collected for fecal coliforms (June & August), Pearl River stage (June, August & September), temperature (June & August), and salinity (June & August) in 1995. Samples were also not collected for fecal coliform counts, Pearl River stage, water temperature and salinity in April, June and September 1997.
Ijerph 02 00362f2
Figure 3. Seasonal variations in the geometric mean fecal coliform abundance, Pearl River stage, water temperature and salinity in the western part of Mississippi Sound in 1999 and 2000. No samples were collected for fecal coliforms, Pearl River stage, water temperature and salinity from May to July 1999.
Ijerph 02 00362f3
Figure 4. Relationship between the geometric mean fecal coliform count and Pearl River stage for various years.
Ijerph 02 00362f4
Figure 5. Relationship between the geometric mean fecal coliform count and water temperature for various years.
Ijerph 02 00362f5
Figure 6. Plot of the predicted log of fecal coliform counts against observed log of fecal coliform counts for various years.
Ijerph 02 00362f6
Figure 7. Plot of salinity against Pearl River stage for various years.
Ijerph 02 00362f7
Figure 8. Number of days during which shellfish harvesting area was open during various months in 1999 and 2000 (a), and relationships between number of days during which shellfish area was open and Pearl River stage (b), and salinity (c).
Ijerph 02 00362f8
Table 1. Monthly variation in geometric means of fecal coliform counts in area 1. Data were pooled for 1990, 1992, 1995, 1997, 1999, and 2000.
MonthnGeometric Mean
January3730.2 (a,c)*
February3550.1 (a)
March3520.4 (c)
April318.3 (b)
May203.1 (d,f)
June201.7 (d,e)
July241.2 (e)
August361.8 (d,e)
September431.9 (d,e)
October555.1 (b,f)
November498.3 (b)
December496.2 (b,f)
*Values with similar letters are not significantly different (Fisher PLSD test, p > 0.05)

Acknowledgements

This work is a result of research sponsored in part by the National Oceanic and Atmospheric Administration (NOAA-NESDIS), Department of Commerce under grant #: NA07WA0489, and in part by the NOAA-ECSC grant # NA17AE1626, Subcontract # 27-0629-017 to Jackson State University. The U.S. Government is authorized to produce and distribute reprints for Governmental purposes notwithstanding any copyright notation that may appear hereon. The views expressed herein are those of the authors and do not necessarily reflect the views of NOAA or its subagencies. We thank Dr. Abdul K. Mohamed (Dean, College of Science, Engineering and Technology) and Russ Beard (Chief Science Officer, NOAA-NCDDC, Stennis Space Center) for supporting the project.

References

  1. Lipp, E. K.; Kurz, R.; Vincent, R.; Rodriguez-Palacios, C.; Farrah, S.; Rose, J. B. The seasonal variability and weather effects on microbial fecal pollution and enteric pathogens in a subtropical estuary. Estuaries 2001, 24, 266–276. [Google Scholar]
  2. Whitlock, J. E.; Jones, D. T.; Harwood, V. J. Identification of the sources of fecal coliforms in an urban watershed using antibiotic resistance analysis. Water Research 2002, 36, 4273–4282. [Google Scholar]
  3. Lipp, E. K.; Schmidt, N.; Luther, M. E.; Rose, J. B. Determining the effects of El Niño-Southern Oscillation events on coastal water quality. Estuaries 2001, 24, 491–497. [Google Scholar]
  4. Interlandi, S. J.; Crockett, C. S. Recent water quality trends in the Schuylkill River, Pennsylvania, USA: a preliminary assessment of the relative influences of climate, river discharge and surburban development. Water Research 2003, 37, 1737–1748. [Google Scholar]
  5. Chigbu, P.; Gordon, S.; Strange, T. Inter-annual variations in fecal coliform levels in Mississippi Sound. Water Research 2004, 38, 4341–4352. [Google Scholar]
  6. Mallin, M. A.; Esham, E. C.; Williams, K. E.; Nearhoof, J. E. Tidal stage variability of fecal coliform and chlorophyll a concentrations in coastal creeks. Marine Pollution Bulletin 1999, 38(5), 414–422. [Google Scholar]
  7. Boehm, A. B.; Grant, S. B.; Kim, J. H.; Mowbray, S. L.; McGee, C. D.; Clark, C. D.; Foley, D. M.; Wellman, D. E. Decadal and shorter period variability of surf zone water quality at Huntington Beach, California. Environmental Science and Technology 2002, 36(18), 3885–3892. [Google Scholar]
  8. Hyer, K. E.; Moyer, D. L. Patterns and sources of fecal coliform bacteria in three streams in Virginia, 1999–2000. In Water-Resources Investigations Report 03-4115; U.S. Department of the Interior, U.S. Geological Survey, 2003. [Google Scholar]
  9. Wright, R. C. The seasonality of bacterial quality of water in a tropical developing country (Sierra Leone). Journal of Hygiene 1986, 96, 75–82. [Google Scholar]
  10. Blum, D.; Huttly, S. A.; Okoro, J.; Akujobi, C.; Kirkwood, B. R.; Feachem. The bacteriological quality of traditional water sources in north-eastern Imo State, Nigeria. Epidemiology and Infection 1987, 99, 429–437. [Google Scholar]
  11. Orlando, S. P., Jr.; Rozas, L. P.; Ward, G. H.; Klein, C. J. Salinity characteristics of Gulf of Mexico Estuaries; Silver Spring, MD; NOAA, Office of Ocean Resources Conservation and Assessment, 1993; p. 209. [Google Scholar]
  12. APHA, Standard methods for the examination of water and wastewaterAmerican Public Health Association: Washington, D.C, 20th edition; 1998.
  13. Faust, M. A.; Aotaky, A. E.; Hargadon, M. T. Effect of physical parameters on the in situ survival of Escherichia coli MC-6 in an estuarine environment. Applied Microbiology 1975, 30, 800–806. [Google Scholar]
  14. Flint, K. P. The long-term survival of Escherichia coli in river water. J. l of Applied Bacteriology 1987, 63, 261–270. [Google Scholar]
  15. Hood, M. A.; Ness, G. E. Survival of Vibrio cholerae and Escherichia coli in estuarine waters and sediments. Applied Environmental Microbiology 1982, 43, 578–584. [Google Scholar]
  16. Verstraete, W.; Voets, J. P. Comparative study of E. coli survival in two aquatic ecosystems. Water Research 1976, 10, 129–136. [Google Scholar]
  17. Auer, M. T.; Niehaus, S. L. Modeling faecal coliform bacteria-1. Field and laboratory determination of loss kinetics. Water Research 1993, 27, 693–701. [Google Scholar]
  18. Mancini, J. L. Numerical estimates of coliform mortality rates under various conditions. J. of Water Pollution Control Federation 1978, 50, 2477–2484. [Google Scholar]
  19. Esham, E. C.; Sizemore, R. K. Evaluation of two techniques: mFC and mTEC for determining distributions of fecal pollution in small, North Carolina tidal creeks. Water, Air, and Soil Pollution 1998, 106(1/2), 179–197. [Google Scholar]
  20. Kagalou, I.; Tsimarakis, G.; Bezirtzoglou, E. Interrelationships between bacterial and chemical variations in Lake Pamvotis – Greece. Microbial Ecology in Health and Disease 2002, 14(1), 37–41. [Google Scholar]
  21. Xu, P.; Brissaud, F.; Fazio, A. Non-steady-state modelling of fecal coliform removal in deep tertiary lagoons. Water Research 2002, 36, 3074–3082. [Google Scholar]
  22. Burkhardt, W., III.; Calci, K. R.; Watkins, W. D.; Rippey, S. R.; Chirtel, S. J. Inactivation of indicator microorganisms in estuarine waters. Water Research 2000, 34(8), 2207–2214. [Google Scholar]
  23. Sinton, L. W.; Finlay, R. K.; Lynch, P. A. Sunlight inactivation of fecal bacteriophages and bacteria in sewage-polluted seawater. Applied and Environmental Microbiology 1999, 65(8), 3605–3613. [Google Scholar]
  24. Chigbu, P.; Gordon, S.; Strange, T. Fecal coliform bacteria disappearance rates in a north-central Gulf of Mexico estuary. Estuarine, Coastal and Shelf Science 2005, in press. [Google Scholar]
  25. George, I.; Petit, M.; Theate, C.; Servais, P. Distribution of coliforms in the Seine River and Estuary (France) studied by rapid enzymatic methods and plate counts. Estuaries 2001, 24, 994–1002. [Google Scholar]
  26. Menon, P.; Billen, G.; Servais, P. Mortality rates of autochthonous and fecal bacteria in natural aquatic ecosystems. Water Research 2003, 37(17), 4151–4158. [Google Scholar]

