Assessment of the Petrochemical Industry Pollution on the Skikda Bay, Algeria

Abstract
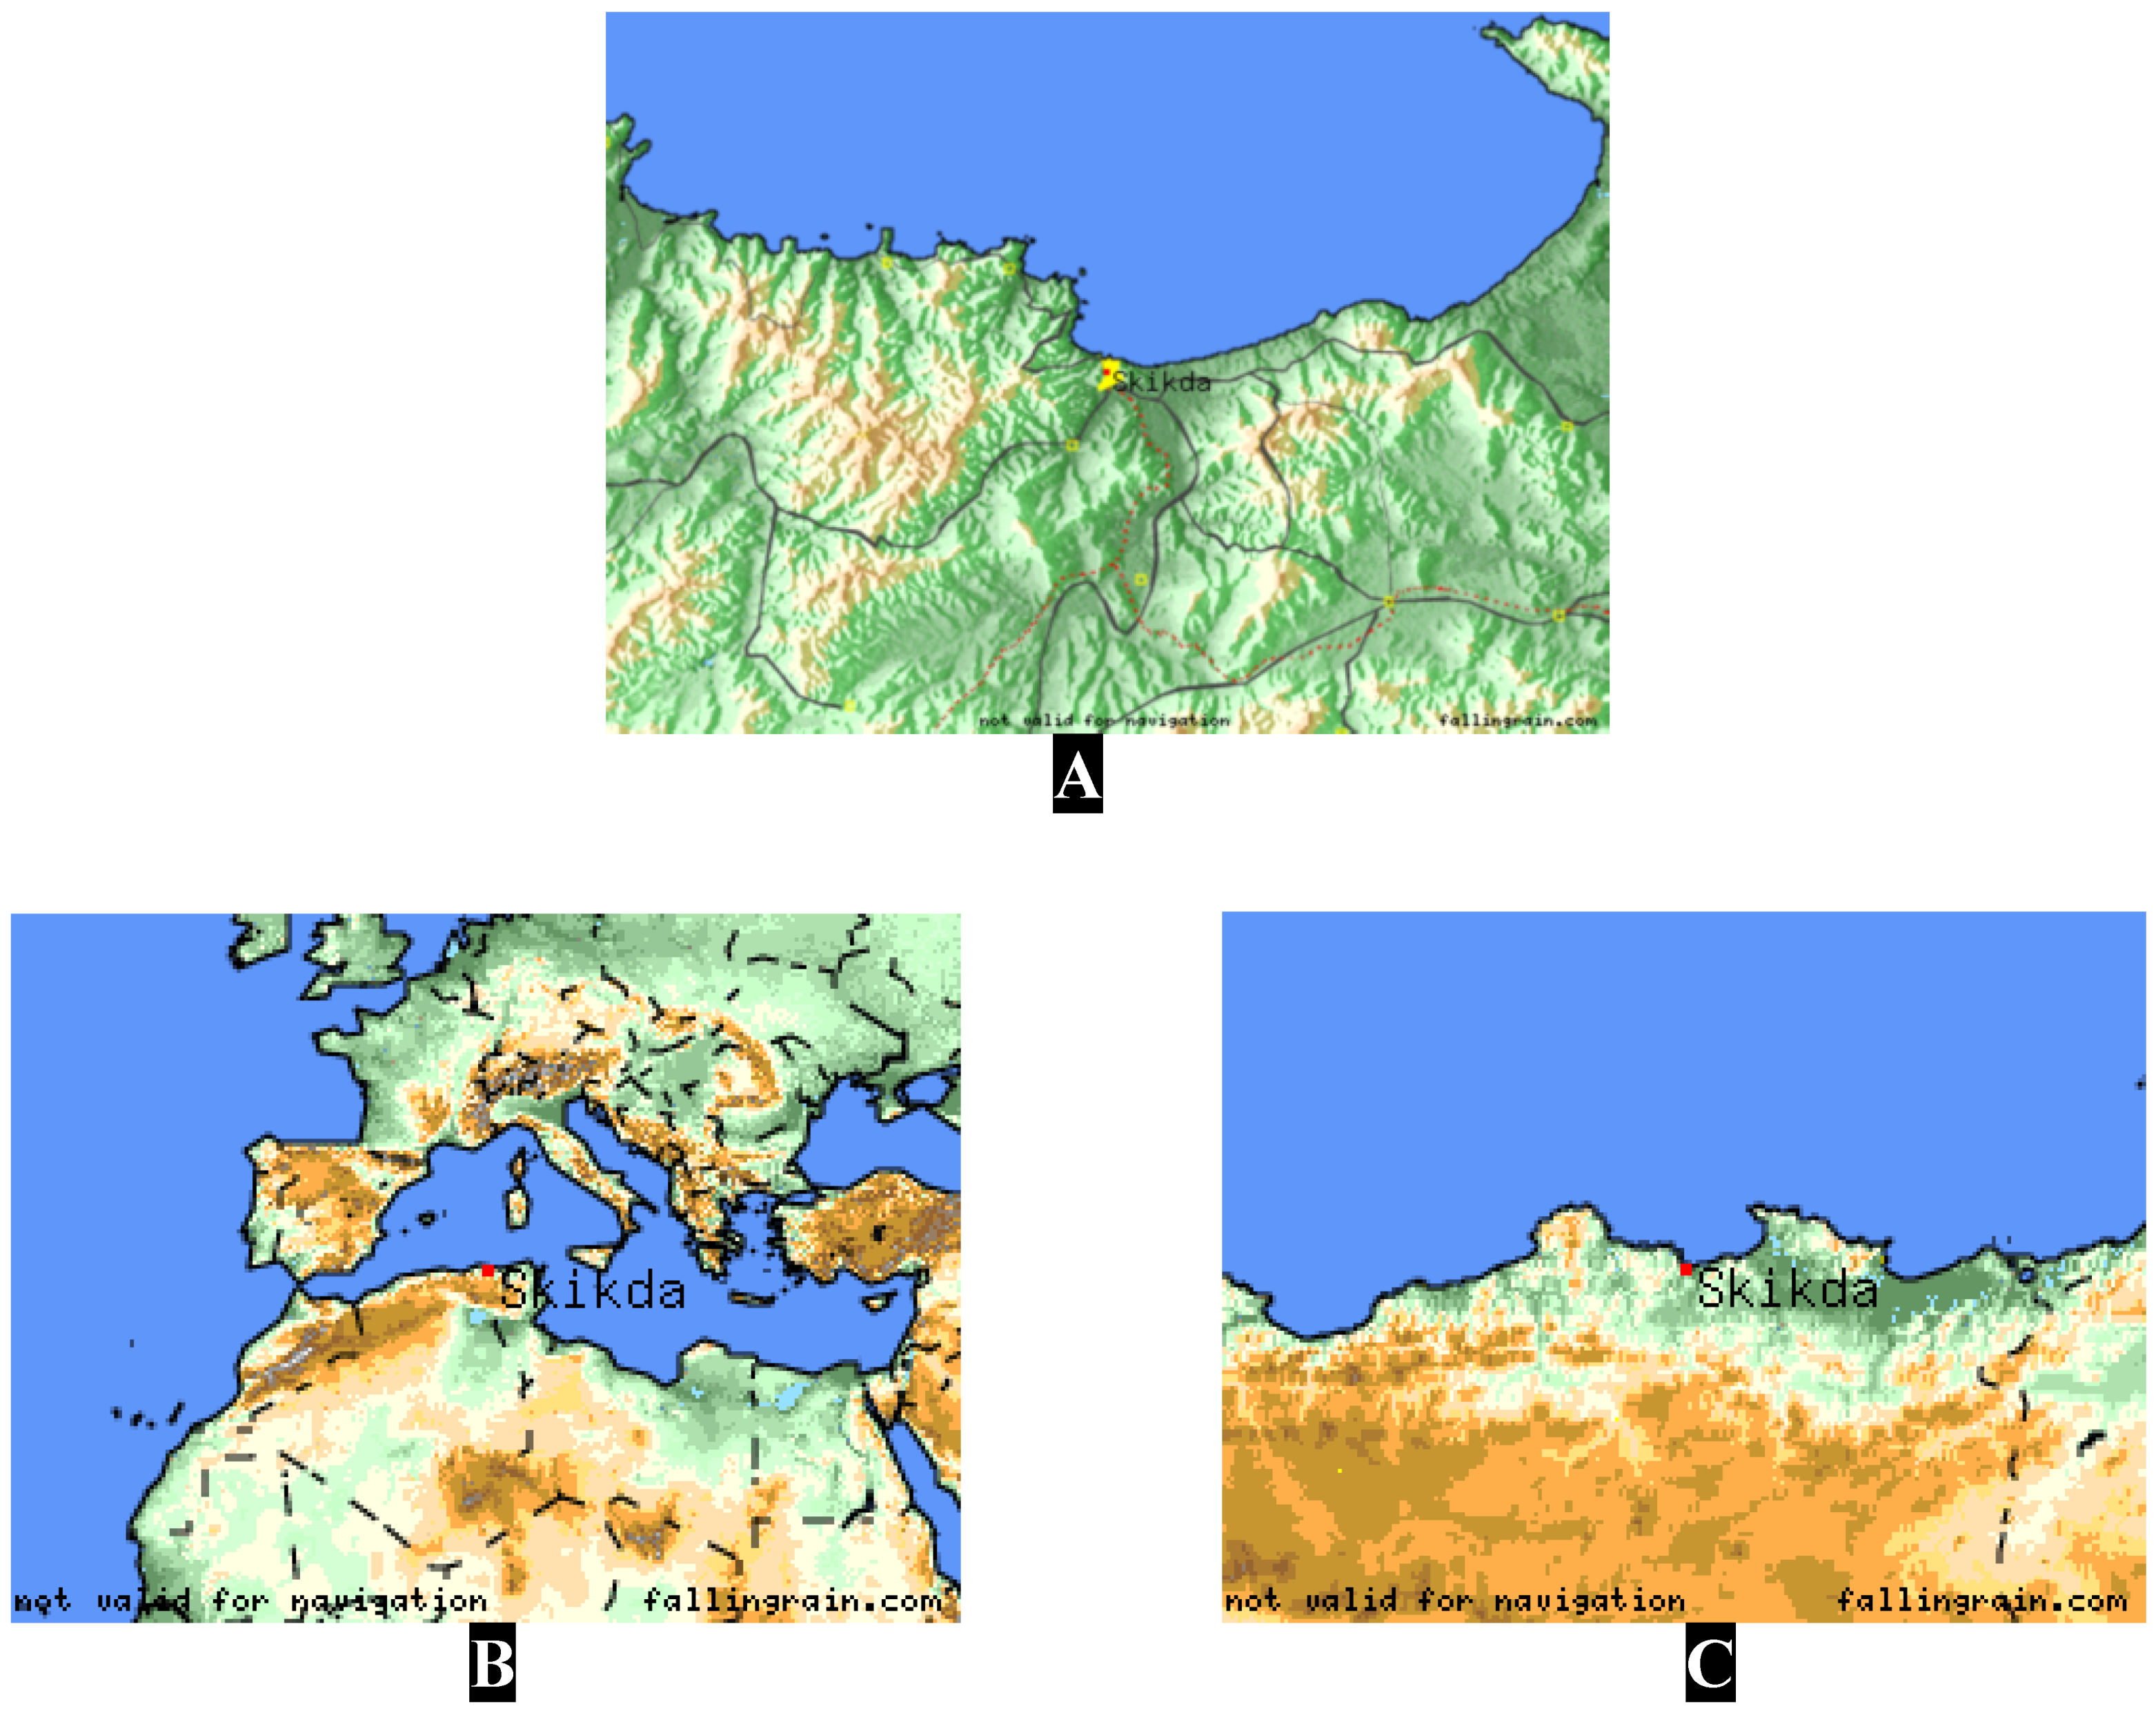
:Introduction
Materials and Methods
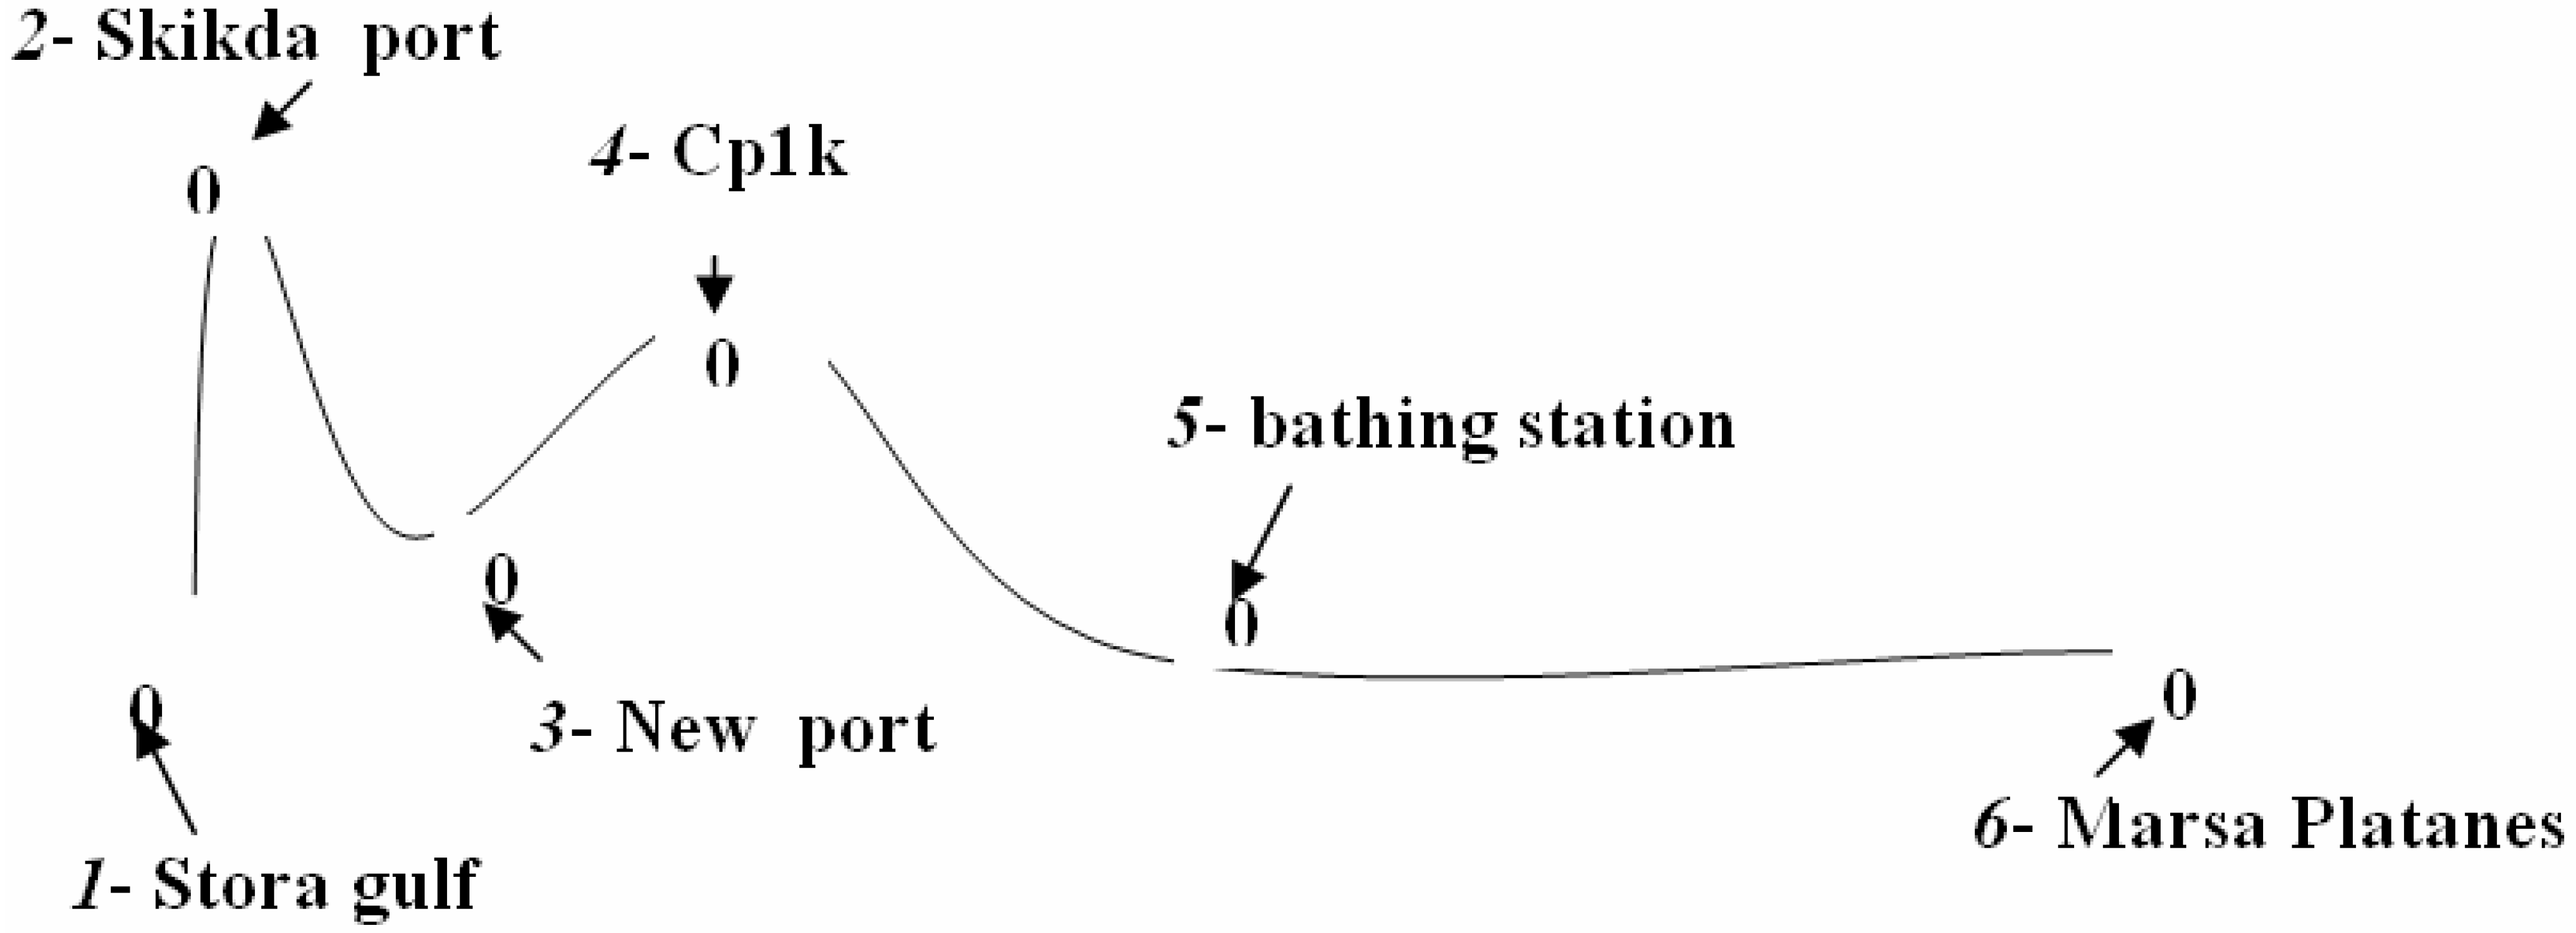
Sampling
Samples Conservation


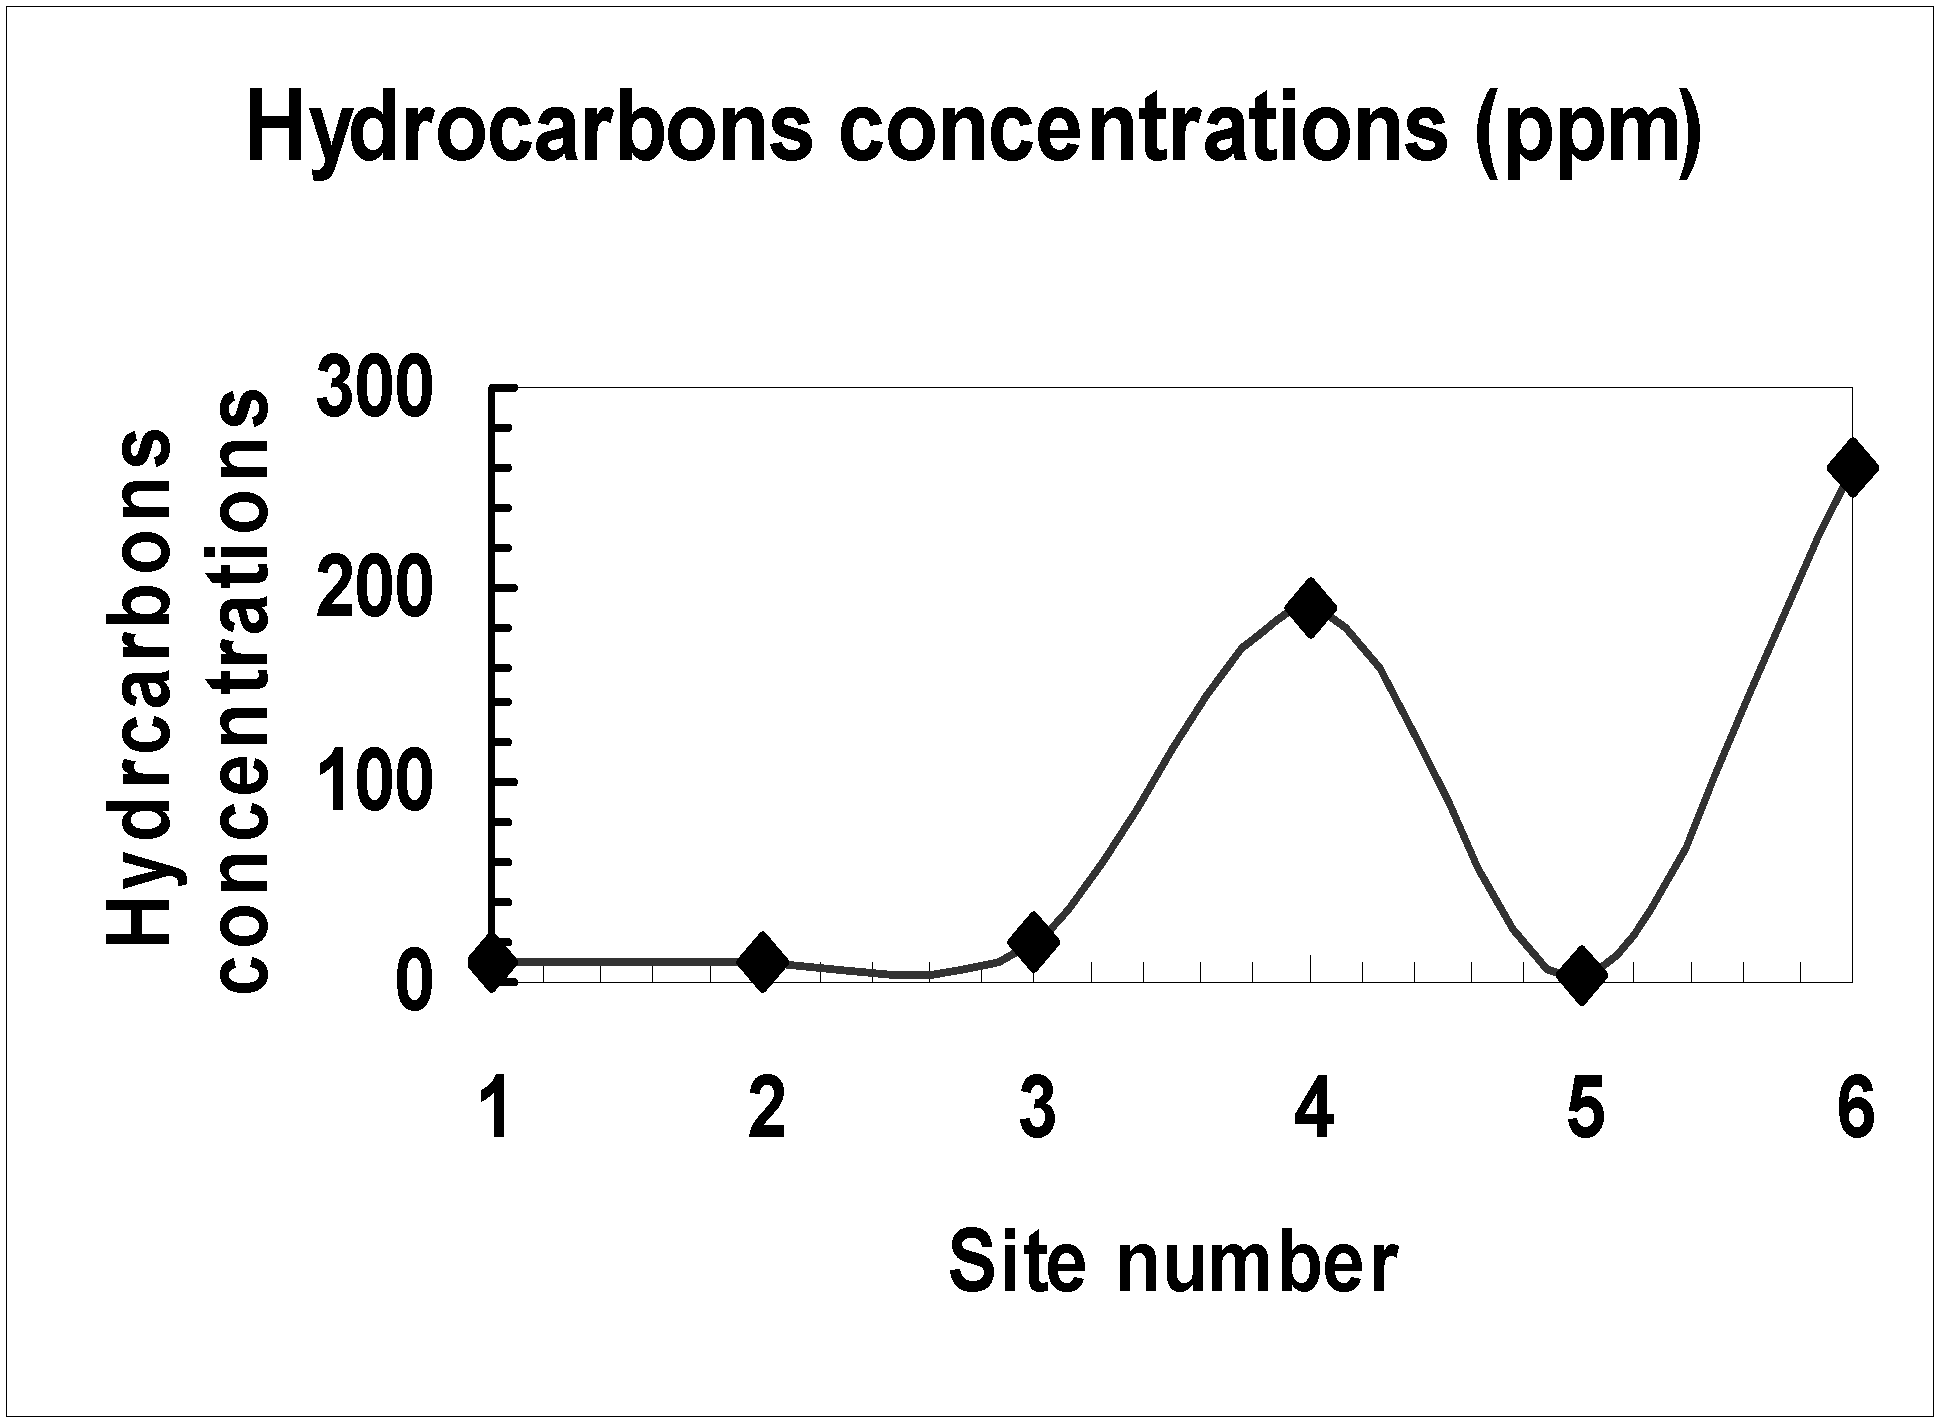
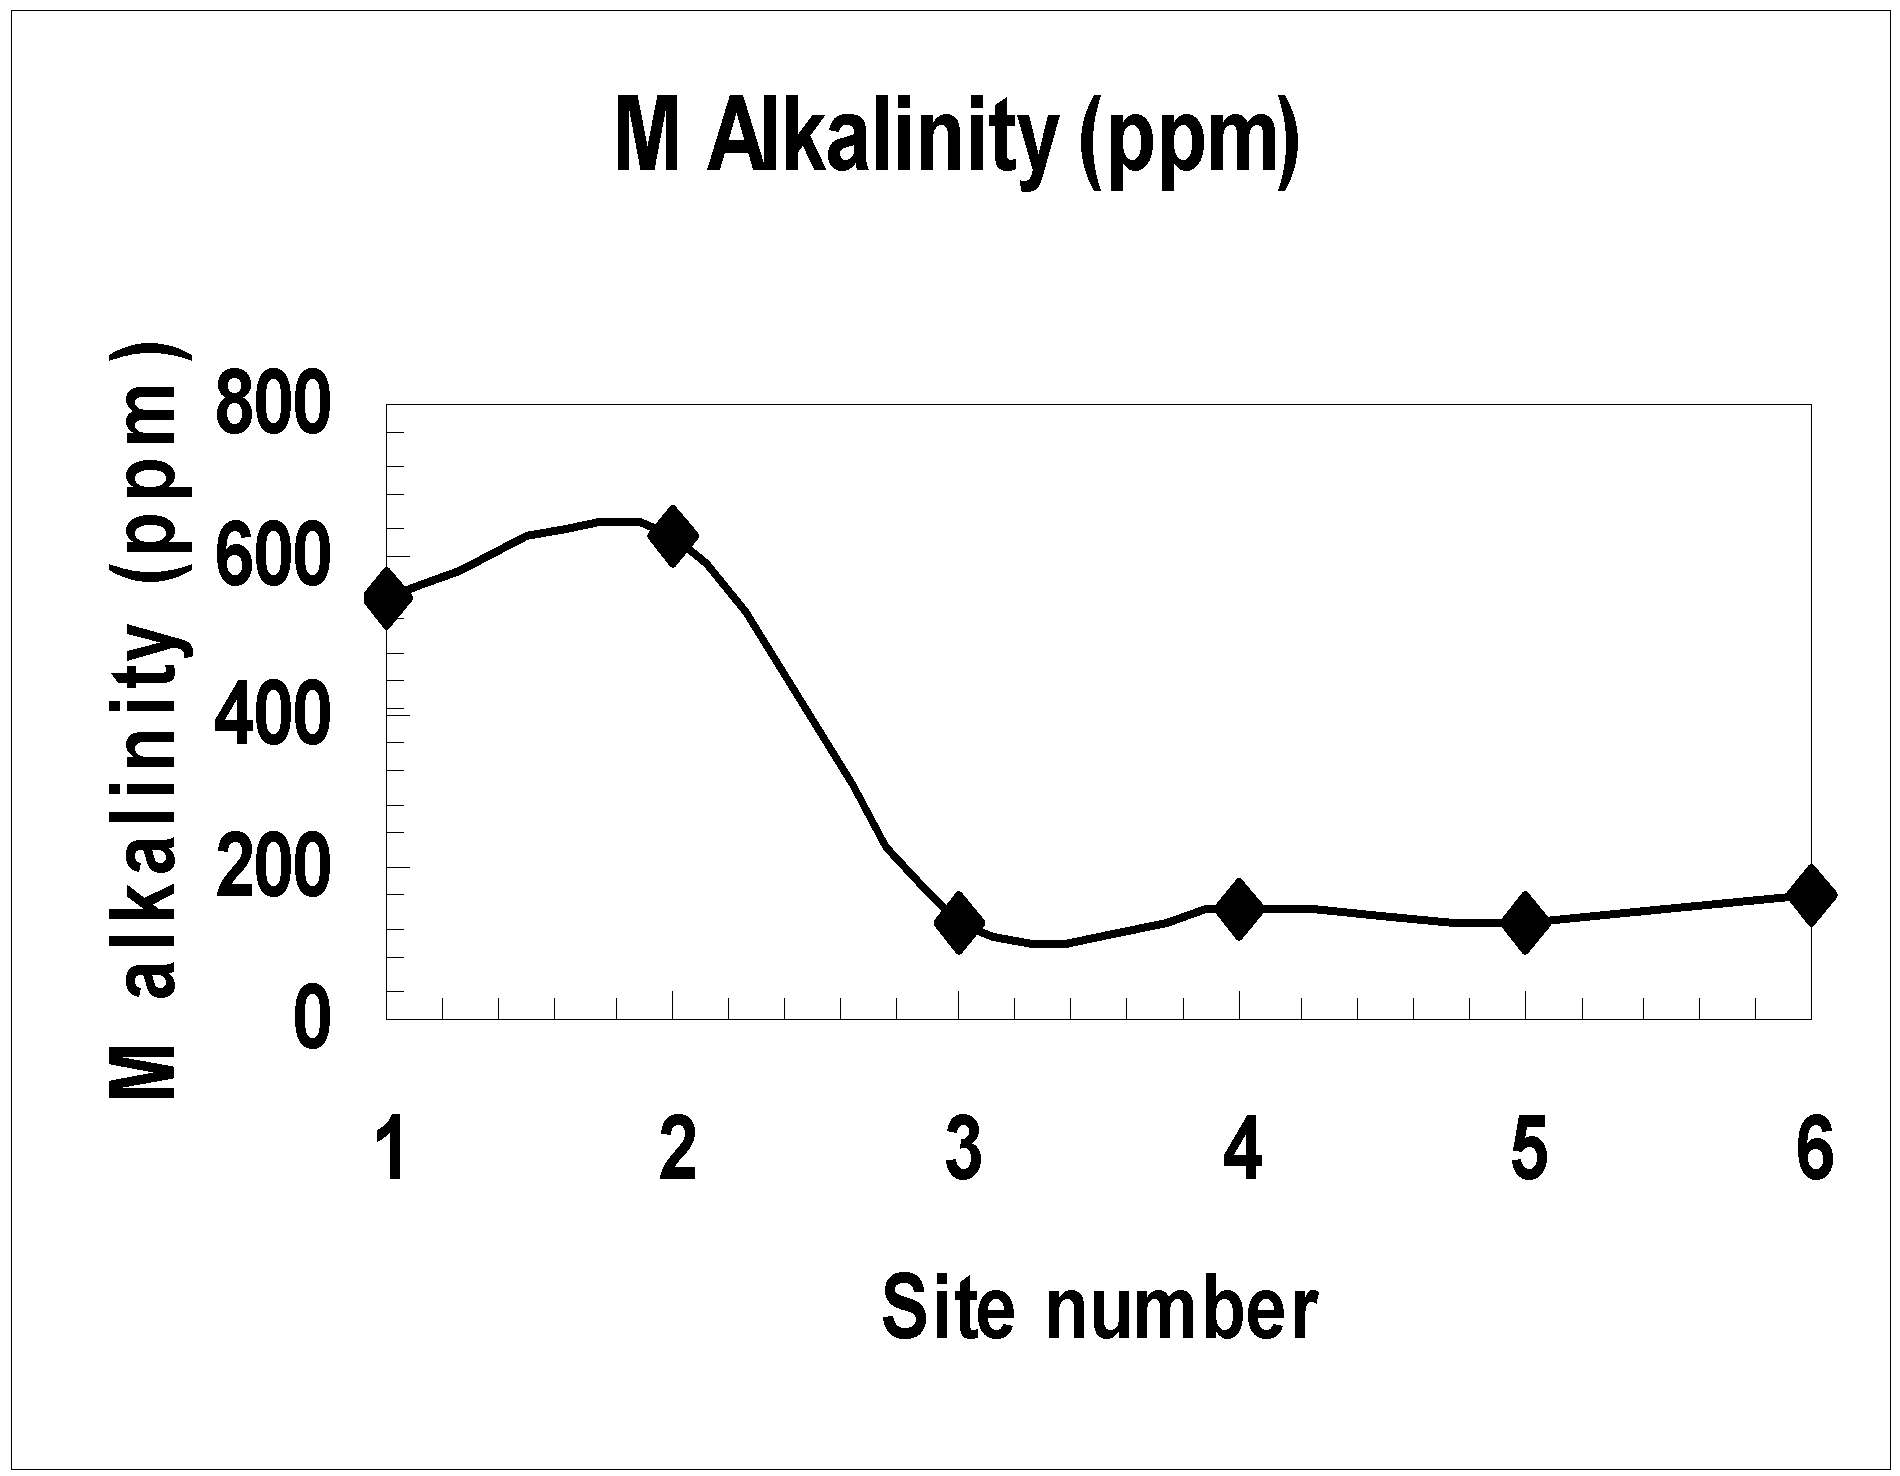
| Site | 1 | 2 | 3 | 4 | 5 | 6 | Clean water |
|---|---|---|---|---|---|---|---|
| Hydrocarbons | 10 | 10 | 19 | 188 | 2 | 260 | 10-2 * |
| CO2 | 104 | 103 | 1340 | 1200 | 700 | 1400 | N/A |
| AT | <0.5 | <0.5 | 22 | 12.5 | 10 | 30 | N/A |
| CAT | 550 | 625 | 123 | 147.5 | 122.5 | 165 | 50* |
| Cl- | 2492.1 | 2279.1 | 3227.6 | 3582.6 | >24000 | 3339.1 | 250 *, ** |
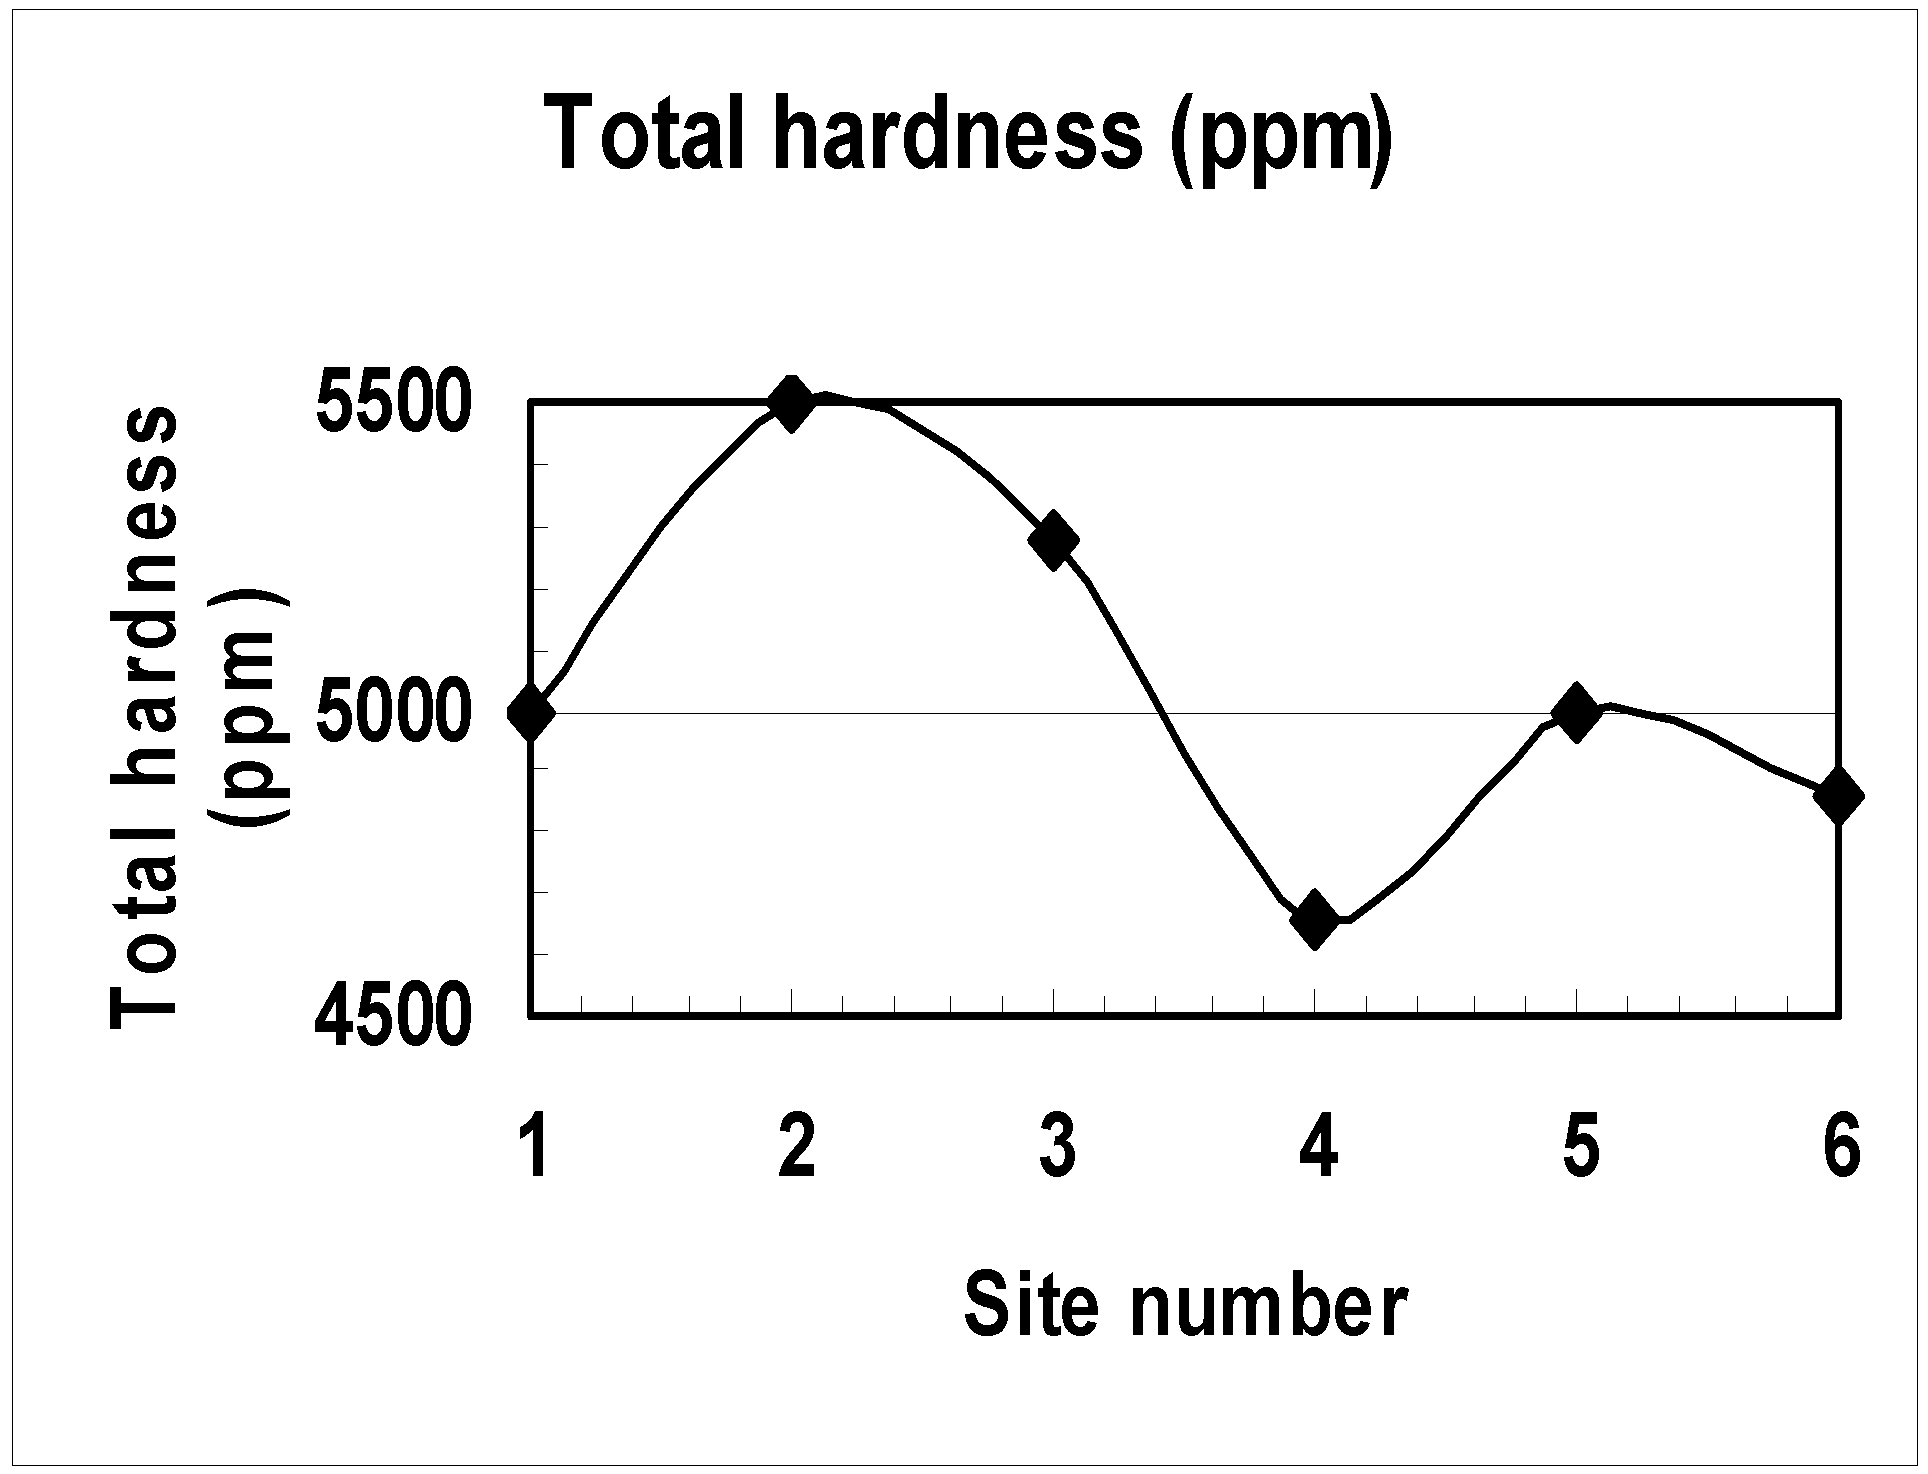
| Total hardness | 5000 | 5500 | 5280 | 4660 | 5000 | 4860 | 50* |
| PO4-3 | 0.010 | 0.014 | <0.02 | <0.02 | <0.02 | <0.02 | Total (0.64) |
| pH | 8.7 | 8.7 | 8.5 | 8.8 | 8.0 | 8.9 | 6.5-8.5 * |
| T/ C | 28 | 28 | 26 | 28 | 26 | 28 | 25 * |
| Conductivity(µS.cm-1) | >104 | >104 | >104 | >104 | >104 | >104 | 180-1000* (20°C) |
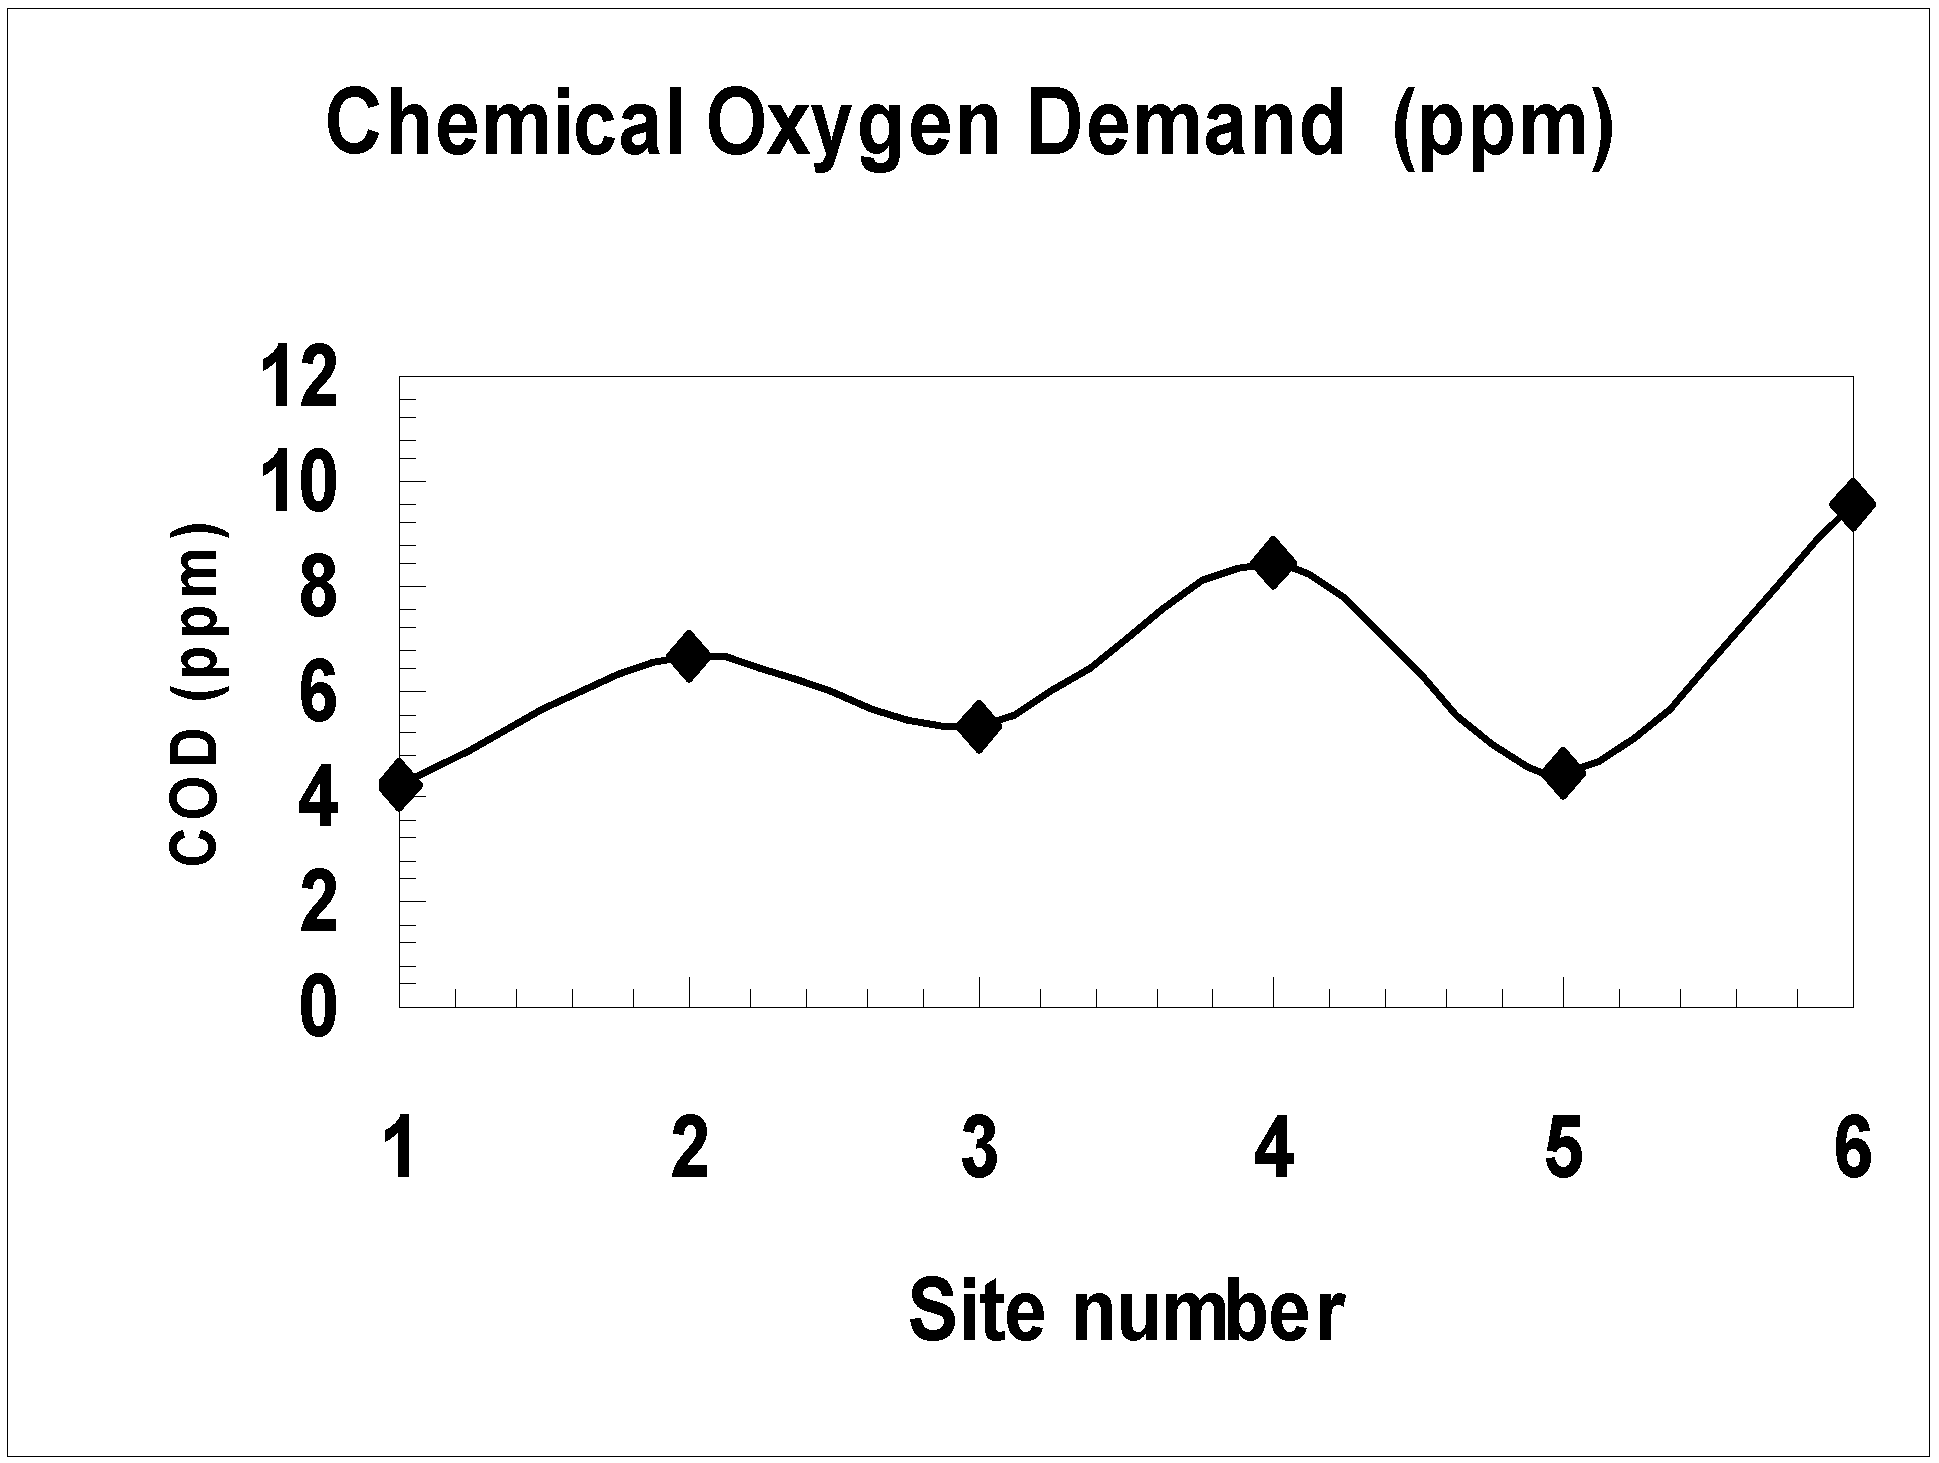
| COD | 4.24 | 6.72 | 5.36 | 8.4 | 4.5 | 9.6 | N/A |
Methods of Analysis
Gravimetric Method
- (1)
- Pour a known volume (100 ml) of the sample to be analyzed into a phial.
- (2)
- Add few drops of methyl orange and 0.2 ml of 50% HCl in order to acidify the sample.
- (3)
- Add chloroform (best solvent for extraction of organic phases) to a half of the sample volume.
- (4)
- Strongly agitate the phial with letting the gas escaping from it and then let the whole decant for a sufficient time. We can see the appearance of two phases, we take of the upper phase, then filtrate this latter with a paper filter containing sodium anhydride Na2SO4 in order to eliminate all traces of humidity.

Chromatographic Method (CGP)

Evaluation Method of CO2 Quantity


Determination of Alkalinity Rate

Total Hardness Determination

Calcium and Magnesium Determination

Concentration of Chlorides
Concentration of Phosphates
Concentration of Organic Substances


Results and Discussion
References
- Braga, C. E. Diagnostico das Condiçoes Hidrogeologicas da Area Industrial Activa da Petroflex. S. A. Internal Report, Petroflex Ind. e. Com. S. A.. 2001, 1–78. [Google Scholar]
- Andrade, M. L.; Reyzabal, M. L.; Marcet, P.; Montero, J. M. Industrial Impact on Marsh Soils at the Bahia Blanca Ria. J. Envir. Quality 2001, 31, 532–538. [Google Scholar]
- Cardoso da Silva, G., Jr.; Carlos, E.; de Carvalho Lange, I. Hydrogeology of study of mangrove area around Guanabara bay, Rio de Janeiro, Brazil, Unuaro do Instito de Geociencias. UFRJ 2003, 26, 92–100. [Google Scholar]
- Fusey, P.; Oudot, J. Note sur l’accélération de la biodégradation d’un pétrole brut par des bactéries. Mater. U. Organ. 1973, 8, 158–163. [Google Scholar]
- Fusey, P.; Oudot, J. Comparaison de deux méthodes d’évaluation de la biodégradation des hydrocarbures in vitro. Mater. U. Organ. 1976, 4, 241–251. [Google Scholar]
- Fusey, P.; Lampin, M. F.; Oudot, J. Recherche sur l’élimination des hydrocarbures par voie biologique. Mater. U. Organ. 1981, 2, 109–147. [Google Scholar]
- Braithwaite, A.; Smith, F. J. Chromatographic methods. 4th ed. Chapman and Hall: London, 1985. [Google Scholar]
- McNair, H. M.; Bonelli, E. J. Basic gas chromatography, Walnut Creek, Calif. Varian Aerograph 1978. [Google Scholar]
- Azoulay, E.; Colin, M.; Dubreuil, J.; Dou, H.; Mille, G.; Giusti, G. Relationship between hydrocarbons and bacterial activity in Mediterranean sédiments. 2eme Colloque de microbiologie marine 1982, 13, 119–142. [Google Scholar]
- Boutefnouchet, N.; Bouzerna, N. Biodegradation of Hydrocarbon by micro-organism. to be submitted to 18 ICCE. 4-8 August 2004; Istanbul, Turkey. [Google Scholar]
- Directive du Conseil du 15 Juillet 1980, Relative à la qualité des eaux destinées à la consommation humaine N 80/779/CEE.
© 2005 MDPI. All rights reserved.
Share and Cite
Nafissa, B.; Bouzerna, N.; Chettibi, H. Assessment of the Petrochemical Industry Pollution on the Skikda Bay, Algeria. Int. J. Environ. Res. Public Health 2005, 2, 463-468. https://doi.org/10.3390/ijerph2005030011
Nafissa B, Bouzerna N, Chettibi H. Assessment of the Petrochemical Industry Pollution on the Skikda Bay, Algeria. International Journal of Environmental Research and Public Health. 2005; 2(3):463-468. https://doi.org/10.3390/ijerph2005030011
Chicago/Turabian StyleNafissa, Boutefnouchet, Noureddine Bouzerna, and Houria Chettibi. 2005. "Assessment of the Petrochemical Industry Pollution on the Skikda Bay, Algeria" International Journal of Environmental Research and Public Health 2, no. 3: 463-468. https://doi.org/10.3390/ijerph2005030011