Molecular Modeling Studies of the Binding Characteristics of Phosphates to Sevelamer Hydrochloride – Assessing a Novel Technique to Reduce Phosphates Contamination

Abstract
:Introduction
Methods
Experimental Methods (Swelling Measurements)
Computational Methods
Molecular Dynamics
Vacuum System
Solvated System
Monte Carlo
Determining the Shell Volume
Generating Random Numbers
Determining the Ratio
Determining the Volume of the Molecule
Results
Discussion


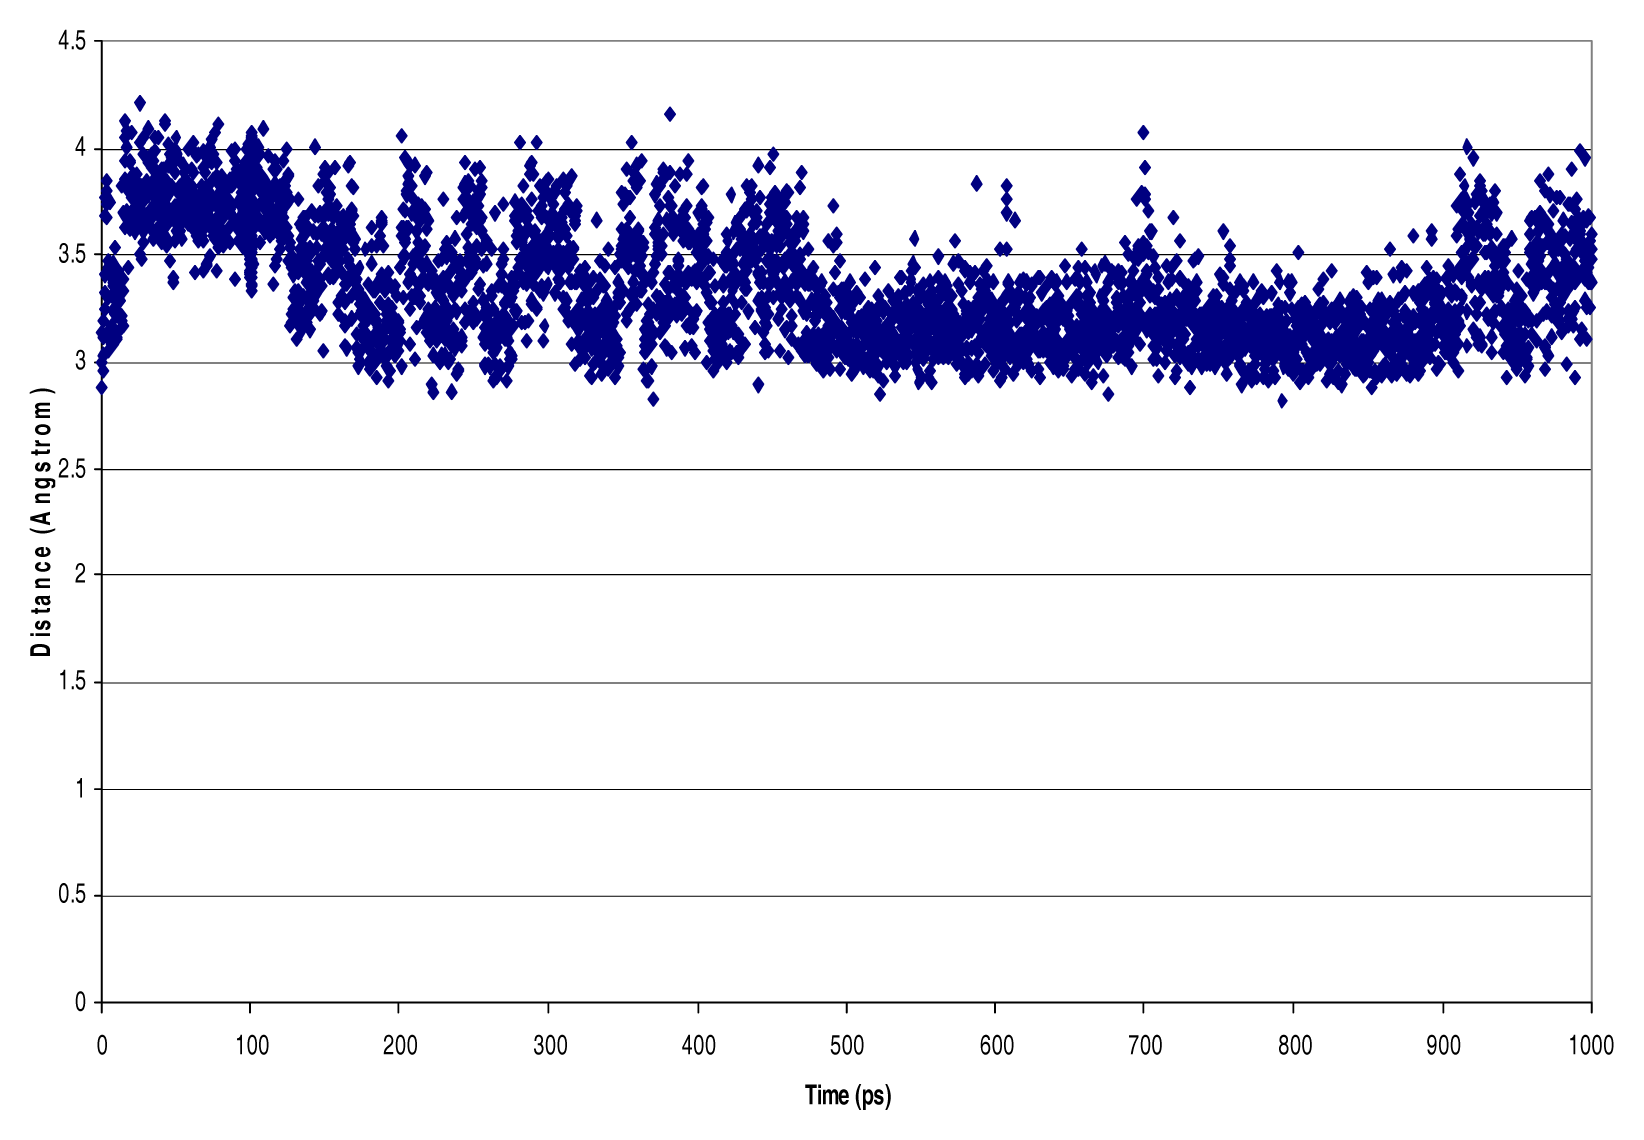
| NVT Ensemble 4 PO4 dielectric=1 debye InterAtomic Distances [Nitrogen - Phosphorous, Phosphorous - Phosphorous, Hydrogen - Chlorine] (Å) | ||||
|---|---|---|---|---|
| Atom Types and ID Number | Mean | Standard Deviation | High | Low |
| N126-P237 | 3.35 | 0.28 | 4.21 | 2.82 |
| N39-P237 | 3.16 | 0.18 | 4.02 | 2.76 |
| N89-P237 | 3.66 | 0.19 | 4.27 | 2.96 |
| N30-P237 | 3.35 | 0.14 | 3.81 | 2.92 |
| N81-P237 | 3.13 | 0.12 | 3.73 | 2.69 |
| N204-P237 | 4.33 | 0.68 | 6.00 | 3.34 |
| N102-P2421 | 3.15 | 0.11 | 3.63 | 2.79 |
| N204-P242 | 3.36 | 0.16 | 4.00 | 2.78 |
| N165-P242 | 4.10 | 0.17 | 5.32 | 3.49 |
| N89-P226 | 3.44 | 0.42 | 5.12 | 2.86 |
| N165-P226 | 3.08 | 0.09 | 3.51 | 2.79 |
| N188-P226 | 3.19 | 0.13 | 4.03 | 2.81 |
| N139-P226 | 5.84 | 1.03 | 7.01 | 2.97 |
| N201-P216 | 3.03 | 0.14 | 3.82 | 2.71 |
| N16-P216 | 3.29 | 0.23 | 4.56 | 2.82 |
| N65-P216 | 3.18 | 0.17 | 4.30 | 2.74 |
| P237-P216 | 6.21 | 0.53 | 7.04 | 4.12 |
| P226-P242 | 5.90 | 4.09 | 0.19 | 4.88 |
| Cl106-H143 | 3.19 | 0.13 | 4.03 | 2.81 |
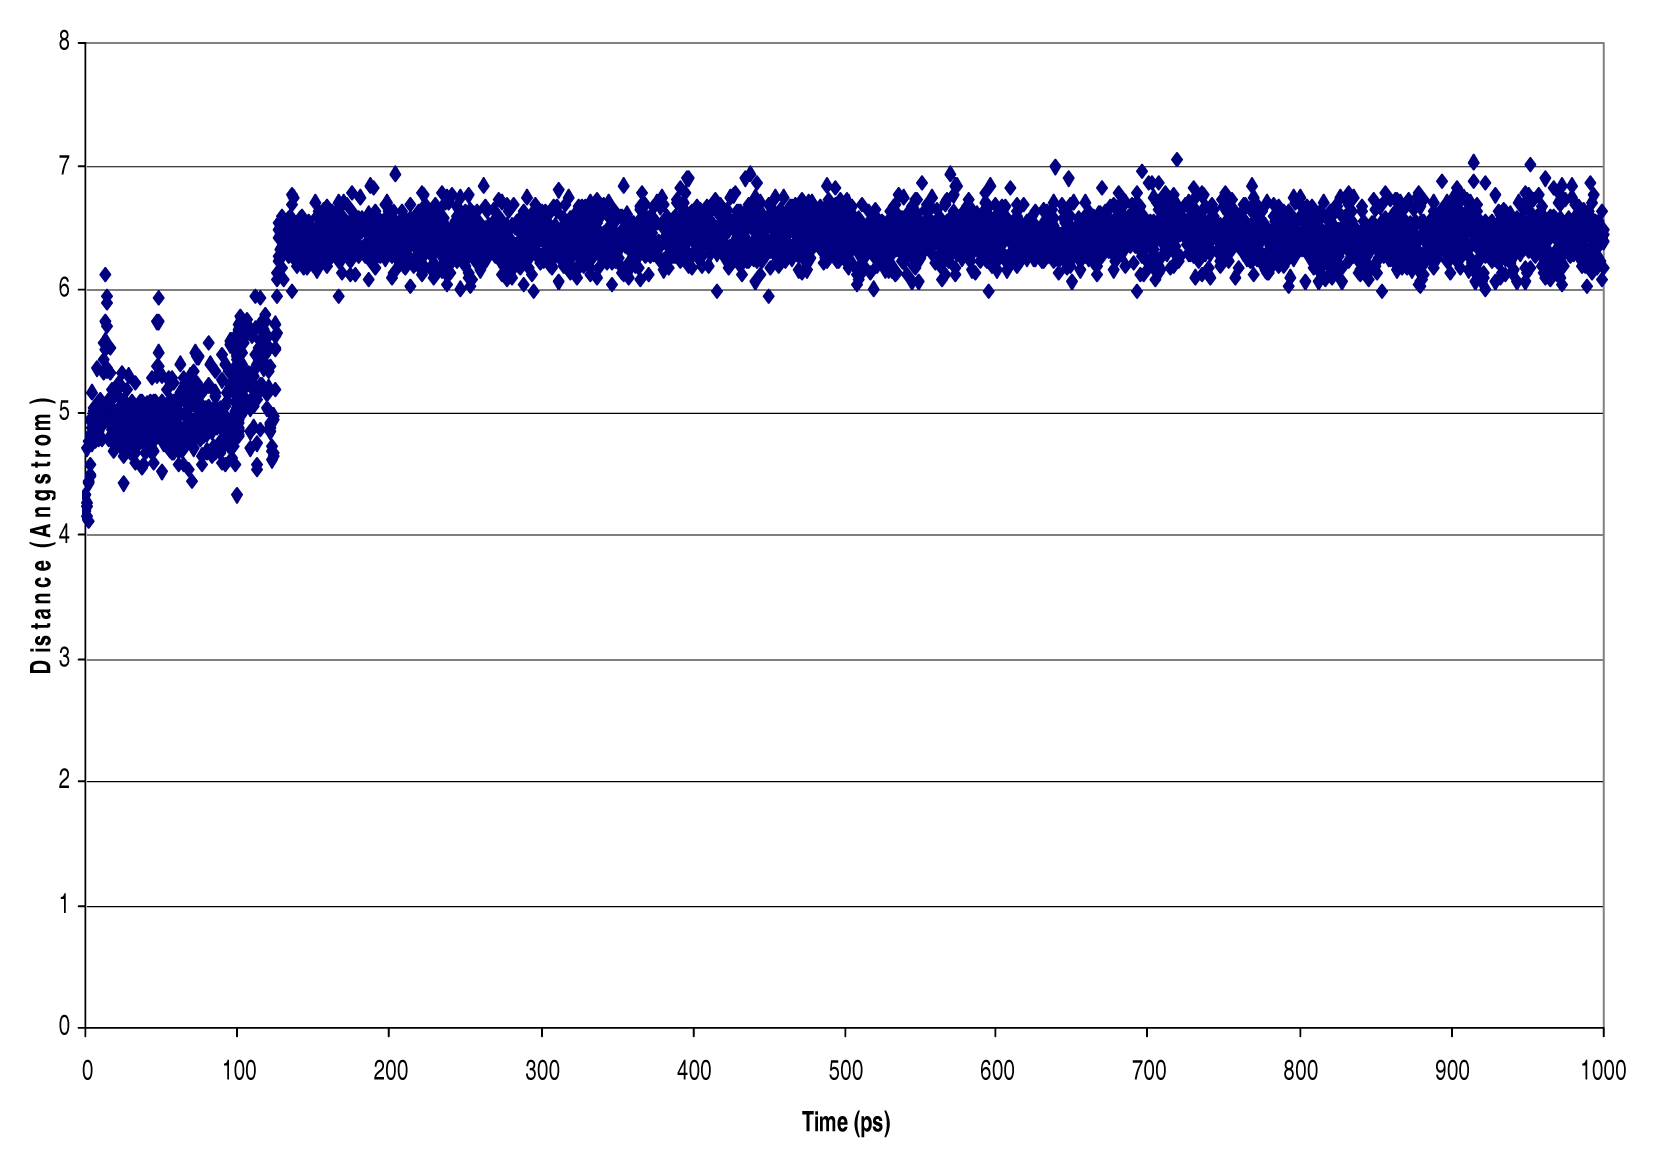
| NVT Ensemble 4 PO4 dielectric=1 debye InterAtomic Distances [Nitrogen - Phosphorous, Phosphorous - Phosphorous, Hydrogen - Chlorine] (Å) | ||||
|---|---|---|---|---|
| Atom Types and ID Number | Mean | Standard Deviation | High | Low |
| N16-P223 | 10.22 | 2.23 | 21.41 | 6.72 |
| N131-P228 | 4.52 | 0.97 | 9.28 | 3.19 |
| N84-P228 | 4.59 | 1.06 | 9.40 | 3.37 |
| N96-P228 | 5.55 | 0.78 | 8.45 | 3.70 |
| N144-P228 | 9.19 | 1.04 | 13.67 | 4.06 |
| N155-P228 | 10.48 | 1.42 | 14.61 | 4.54 |
| N77-P228 | 7.82 | 0.89 | 12.33 | 6.01 |
| N77-P202 | 4.69 | 1.59 | 10.59 | 3.03 |
| N177-P202 | 5.66 | 2.28 | 12.81 | 3.19 |
| N62-P202 | 8.52 | 4.84 | 20.28 | 3.24 |
| N155-P202 | 5.92 | 2.70 | 14.42 | 3.39 |
| N119-P202 | 12.44 | 1.99 | 15.98 | 4.73 |
| N77-P223 | 6.40 | 3.49 | 20.10 | 3.15 |
| N119-P223 | 9.88 | 3.78 | 21.27 | 3.36 |
| N29-P212 | 4.99 | 1.12 | 11.35 | 3.42 |
| N37-P212 | 4.76 | 1.17 | 12.46 | 3.32 |
| P223-P212 | 9.80 | 2.77 | 18.99 | 5.73 |
| N77-P212 | 4.91 | 0.74 | 8.18 | 3.26 |
| N29-P223 | 8.00 | 3.72 | 17.18 | 3.40 |
| P228-P202 | 9.41 | 1.66 | 12.27 | 4.16 |
| P223-P228 | 8.47 | 1.96 | 17.60 | 4.91 |
Acknowledgements
References
- Foy, R. H.; Withers, P. J. A. The Contribution of Agricultural Phosphorus to Eutrophication, 365 Ed ed; Department of Agriculture for Northern Ireland: Belfast, UK; In Fertiliser Society1995; pp. 1–32. [Google Scholar]
- Kunoh, M.; Niwa, K.; Nakamoto, N.; Fukuwari, T. Condensed-Phosphate Imprinted Resins. Suikankyou Gakkaishi 1997, 20, 338. [Google Scholar]
- Nakasone, H.; Ozaki, M.; Kuroda, H. Advancement of nitrogen removal of the contact aeration system by the aeration tank preface system. Suikankyou, Gakkaishi 1997, 20, 665. [Google Scholar]
- Fujiwara, I.; Maeda, M.; Takagi, M. Condensed-Phosphate Imprinted Resins Prepared by a Surface Template Polymerization Method. Analytical Sciences 2002, 16, 407–412. [Google Scholar]
- Rosenbaum, D.; Holmes-Farley, S.; Mandeville, W.; Pitruzello, M.; Goldberg, D. Effect of Rena-Gel, A Non-absorbable, Cross-linked, Polymeric Phosphate Binder, on Urinary Phosphorus Excretion in Rats. Nephrol Dial Transplant 1997, 12, 961–964. [Google Scholar]
- Goldberg, D.; Dillon, M.; Slatopolsky, E.; Garrett, B.; Gray, J.; Marbury, T.; Weinberg, M.; Wombolt, D.; Burke, S. Effect of RenaGel®, a non-absorbed, calcium- and aluminium-free phosphate binder, on serum phosphorus, calcium, and intact parathyroid hormone in end-stage renal disease patients. Nephrol. Dial. Transplant 1997, 12(8), 1640–44. [Google Scholar]
- Chertow, G.; Burke, S.; Lazarus, J.; Stenzel, K.; Wombolt, D.; Bonventre, J.; Slatopolsky, E. Poly[allylamine hydrochloride] (Renagel): A noncalcemic Phosphate Binder for the Treatment of Hyperphosphatemia in Chronic Renal Failure. Am J. Kidney Dis 1997, 29, 66–67. [Google Scholar]
- Burke, S. K.; Goldberg, D.; Lazarus, J. RenaGel, A Novel Calcium- and Aluminum-free Phosphate Binder, Inhibits Phosphate Absorption in Normal Volunteers. Nephrol. Dial. Transplant 1997, 12, 1640–1644. [Google Scholar]
- Leach, A. Molecular Modelling: Principles and Applications; Pearson Education Limited: Edinburgh Gate, Harlow, England, 1996. [Google Scholar]
- Berendsen, H. J. C. Treatment of long-range forces in molecular dynamics. In Molecular Dynamics and Protein Structure; Hermans, J., Ed.; Western Springs, IL; Polycrystal Book Service, 1985; pp. 18–22. [Google Scholar]
- Olaj, O. F.; Petrik, T.; Zifferer, G. Monte Carlo Simulations of Symmetric Polymer Blends 2, Chain Properties in Interface Regions. J. Chem. Phys 1998, 108, 8226. [Google Scholar]
- SYBYL 6.9; Tripos Inc: 1699 Hanley Road, St. Louis, Missouri, 63144, USA, 2003.
- Gasteigner, J.; Marsili, M. A New Model for Calculating Atomic Charges in Molecules. Tetrahedron Lett 1978, 3181–3184. [Google Scholar]
© 2006 MDPI. All rights reserved.
Share and Cite
Parker, R.; Odukale, A.A.; Fisher, D.; Batich, C.; Ross, E.; Edwards, J. Molecular Modeling Studies of the Binding Characteristics of Phosphates to Sevelamer Hydrochloride – Assessing a Novel Technique to Reduce Phosphates Contamination. Int. J. Environ. Res. Public Health 2006, 3, 202-208. https://doi.org/10.3390/ijerph2006030024
Parker R, Odukale AA, Fisher D, Batich C, Ross E, Edwards J. Molecular Modeling Studies of the Binding Characteristics of Phosphates to Sevelamer Hydrochloride – Assessing a Novel Technique to Reduce Phosphates Contamination. International Journal of Environmental Research and Public Health. 2006; 3(2):202-208. https://doi.org/10.3390/ijerph2006030024
Chicago/Turabian StyleParker, R., A. A. Odukale, D. Fisher, C. Batich, E. Ross, and J. Edwards. 2006. "Molecular Modeling Studies of the Binding Characteristics of Phosphates to Sevelamer Hydrochloride – Assessing a Novel Technique to Reduce Phosphates Contamination" International Journal of Environmental Research and Public Health 3, no. 2: 202-208. https://doi.org/10.3390/ijerph2006030024