Introduction
Nigeria is located in West Africa and has variable terrain. The climate ranges from equatorial in the south to tropical in the centre and arid in the north. Climatic variations influence the vegetations, ranging from mangrove swamps in the south, tropical rainforest in the centre, savannah in the north and sahel savannah in the north - east. The annual rainfall varies from 4000 mm in the south and 250 mm in the north with a national average of 1180 mm [
1]. Geological reports gave rock types as Precambrian basement in the southwest, south-east and north-central. The rocks include gneisses, schists, migmatites, pegmatite, charnockitic and quartz-schist [
2–
4].
Groundwater is an important water resource in both the urban and rural areas of Nigeria but in the cities, pipe-borne water is also available. Rural dwellers rely basically on hand-dug wells for potable water supply as the streams usually dry up in dry season. These resources are under threat from pollution either from human life style manifested by the low level of hygiene practiced in the developing nations [
5–
7]. Environmental health involves all the factors, circumstances and conditions in the environment or surroundings of humans that can influence health and well being. The neglect of rural areas in most developing countries in terms of basic infrastructures such as pipe-borne water and sanitation facilities, expose the villagers to a variety of health related problems such as water – borne diseases [
8].
In this study, the levels of some physical, chemical, biochemical and microbial water quality parameters in hand-dug wells located in the residential areas and in the vicinities of municipal waste dumpsites and defecation sites in Igbora, a rural settlement, southwest Nigeria, were assessed. The effects of seasonal variation and proximity to pollution sources (municipal waste dumps and defecation sites) on the concentrations of the parameters were also evaluated.
Materials and Methods
Study Area
The study area, Igbora, is found in Oyo state, southwest Nigeria, situated on longitude 7.5°N and latitude 3.25°N and has derived savanna vegetation, described with Precambrian crystalline basement complex rocks. The dominant rocks constitute suites of gneisses and quartzite [
1]. The major climatic seasons are wet or rainy season, which begins in March or April, and ends in October and the dry season, which begins in November and ends in March or April.
Sample Collection
Water samples were procured from twelve hand-dug wells, whose depths varied from 4 to 12 m, located in the vicinities of municipal solid-waste dumpsites open - air defecation sites, twice a month for period of three months in the dry season and another period of three months in the wet season. Water quality parameters analyzed in accordance to standard methods of [
9] were pH, temperature, conductivity, total solids (TS), total suspended solids (TSS), total dissolved solids (TDS), turbidity, nitrate (NO
3−), sulphate (SO
42−), phosphate (PO
43−), copper (Cu), lead (Pb), cadmium (Cd), dissolved oxygen (DO), chemical oxygen demand (COD), biochemical oxygen demand (BOD), fecal coliform (FC) and total coliform (TC) counts.
Quality Assurance Procedures
Special precautions taken for quality assurance were as follows; all reagents were of analytical grade, purchased from Aldrich Chemical Company, England and samples for metal analysis were preserved with 3 ml concentrated HNO3 per liter in the field. Samples used for determination of metals, physical properties, SO42− and NO3− were collected in plastic bottles and those for the determination of DO, COD, BOD and PO43− were collected in specialized glasswares. Samples for DO were treated at the site with 2 ml of manganous sulphate and 2 ml alkaline-iodide-azide solution. Precautions were taken to avoid the trapping of atmospheric oxygen. Quality control measures for pollutants, especially toxic metals include reagent and blank analyses, spiked sample recovery determinations and multiplicity of samples (increased sample population size, n = 12 for each determination).
Samples for COD, NO3−, SO42− and PO43− were refrigerated and analyzed within 24 hours. All plastics and glass wares utilized were pre-washed with detergent water solution, rinsed with tap water and soaked for 48 h in 50% HNO3, then rinsed thoroughly with distilled-deionized water. They were then air-dried in a dust free environment. All containers for bacteriological analysis, in addition to the previous treatments, were sterilized in an autoclave at 121°C for 15 minutes. The plastic bottles were not capped to avoid distortion.
Data Analysis
Analysis of variance (ANOVA) and Pearson correlation were performed on the data using SPSS 10.0 for Windows for significant variations and inter-element relationships. Results were presented as the mean ± standard error.
Results
The mean values for the water quality parameters are presented in
Tables 1 and
6. In some cases, high values of standard errors were obtained especially for TSS, PO
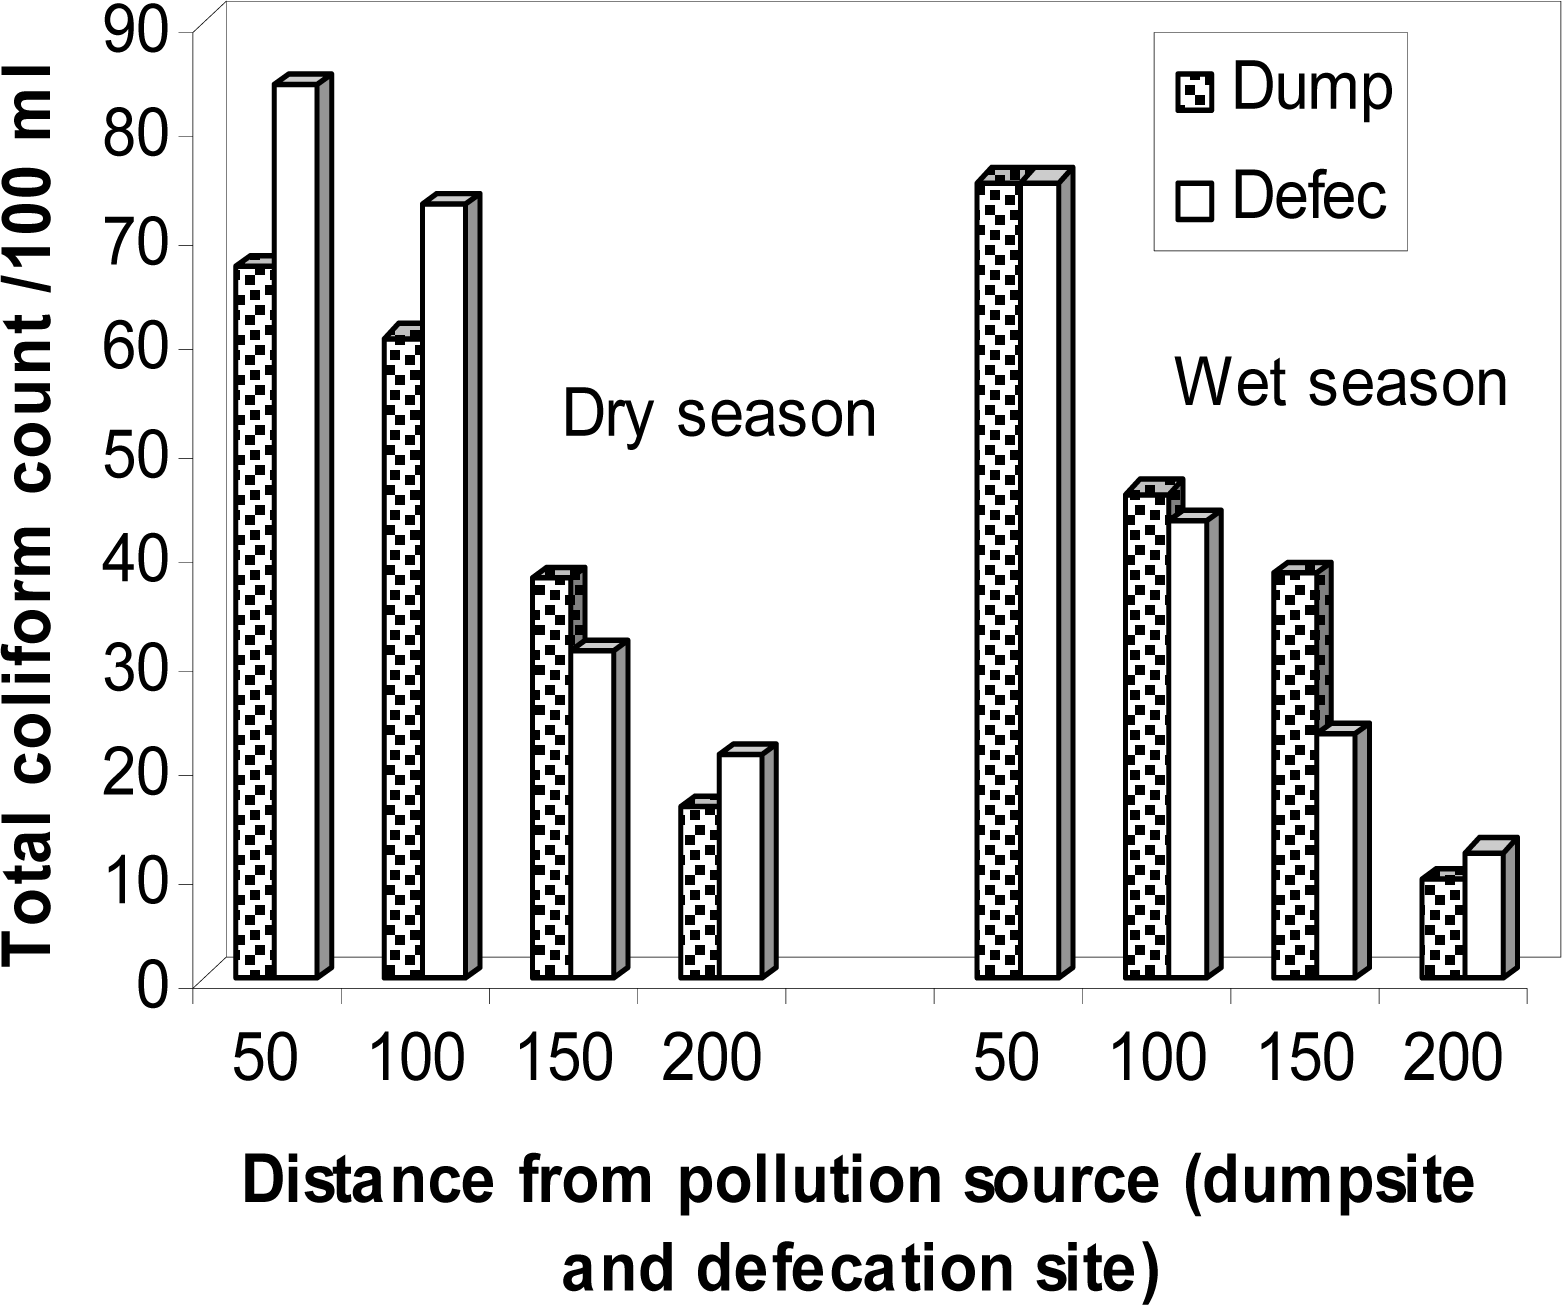
43−, BOD and COD. These were attributed to the fact that the wells were unprotected, most times without lids and concrete linings. In addition, the wells were all public utilities. They varied with seasonal change and distance from pollution source. The type of waste (municipal solid wastes or excreta) affected parameter concentration. Seasonal variation from dry to rainy periods increased the concentrations of Cu, Pb, fecal coliform, total coliform, BOD, COD, electrical conductivity, total dissolved solids in most cases.
The effect of distance from pollution sources was much more defined for fecal and total coliform counts. They decreased with increasing distance from waste dumps irrespective of the season (
Fig.1).
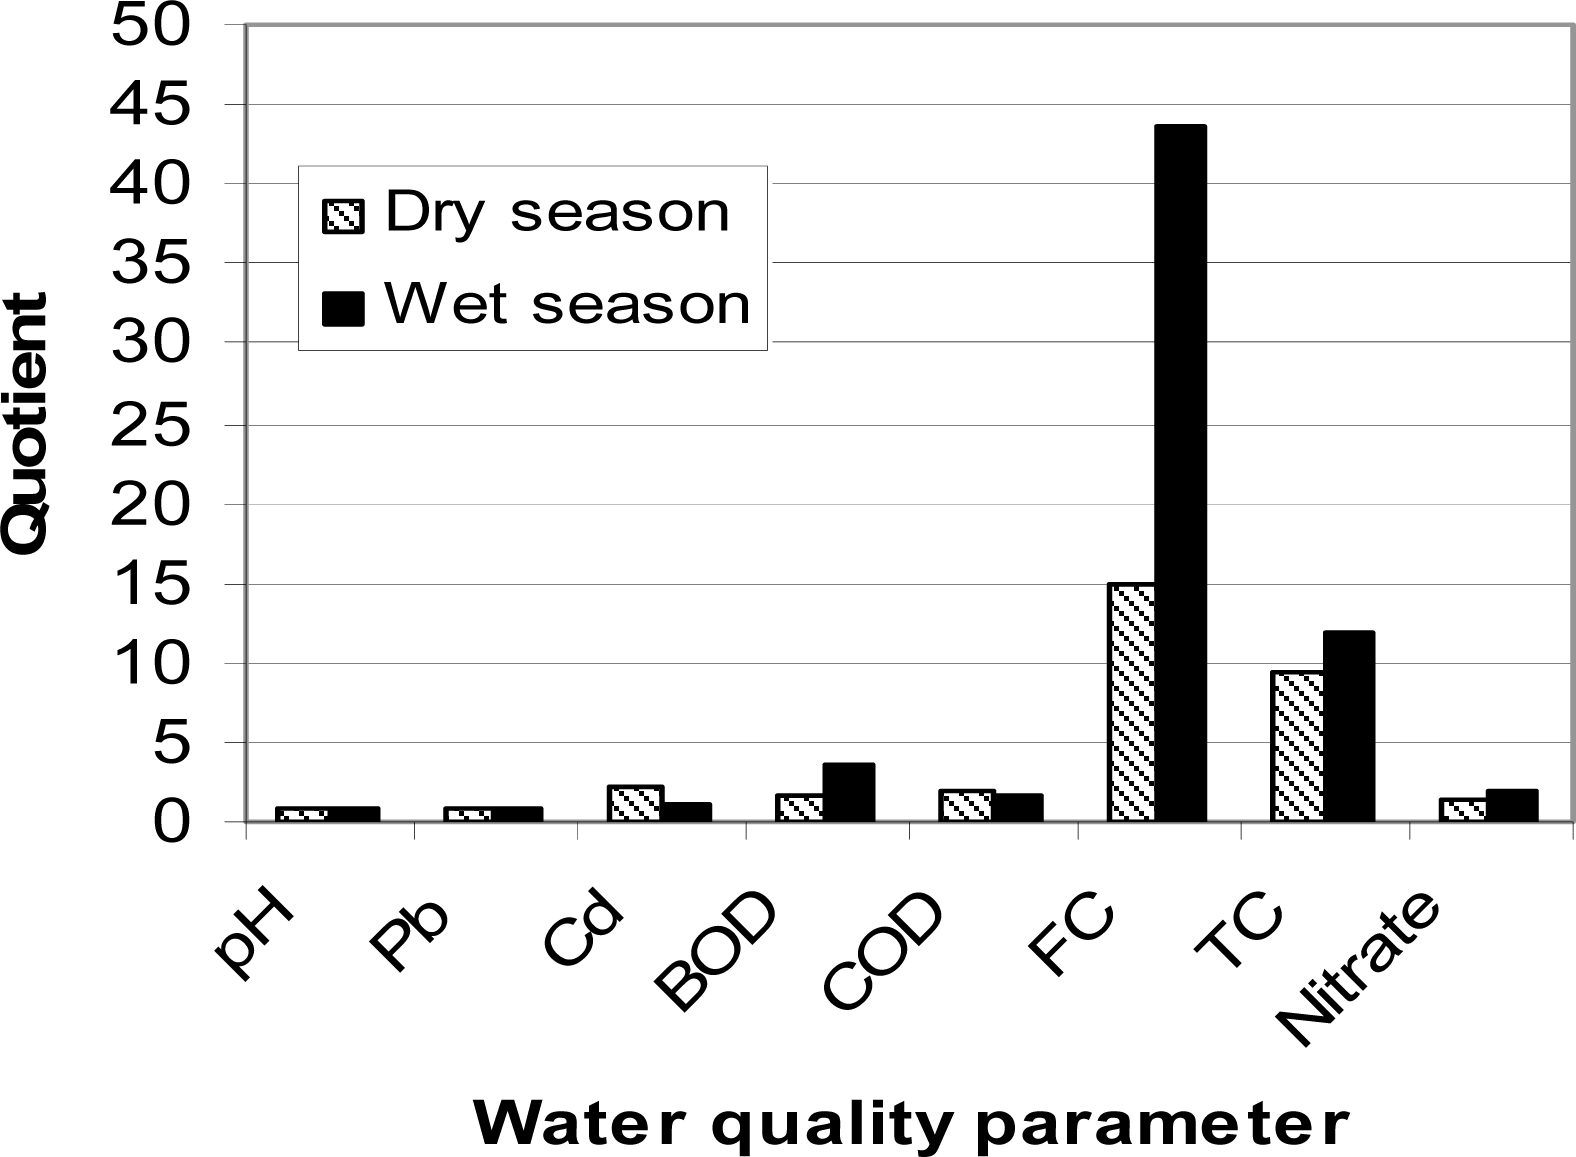
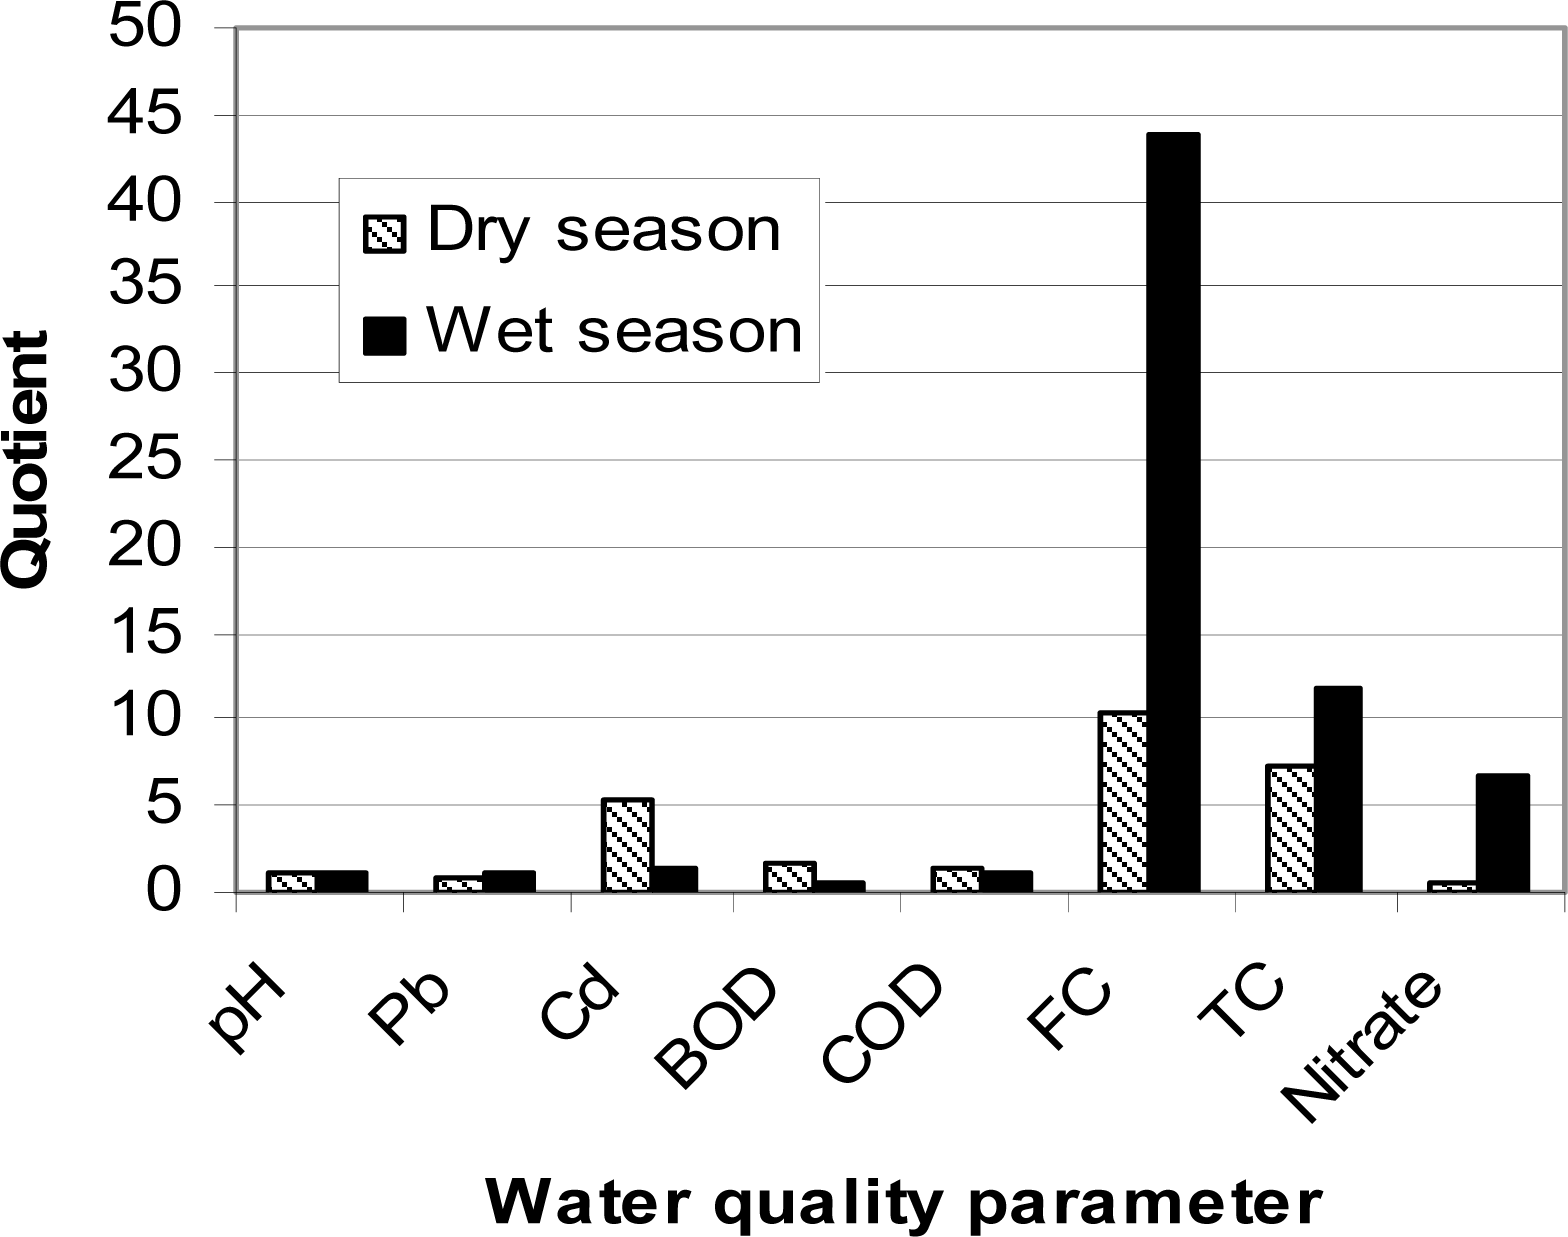
As shown in
Figs. 2 and
3, wells near pollution sources gave higher fecal and total coliform counts as well as Cd, BOD, COD relative to those in the residential quarters. Their quotient factors ranged from 1.0 to 44.
A comparative evaluation of wells near dumpsites (I) and those near defecation sites (II) revealed that in the dry season, conductivity, total solids and PO43− concentrations were higher in (I) than in (II). Fecal and total coliform counts were higher in the wells near defecation sites than those near dumpsites from 50 to 100 m. Conversely, from 150 to 200 m the trend reversed. In the wet season, conductivity levels were also higher at the dumpsites than at defecation sites. At 50 m from pollution source, equal concentrations of fecal and total coliform counts were obtained but beyond 50 m, variable patterns were recorded.
Inter- Element Correlation
Positive and negative Pearson correlation coefficients were obtained among the water quality parameters. Due to lack of space, the tabulated results were not presented. Results showed that the parameters influenced each other. For instance, significant coefficients (p ≤ 0.05) were obtained between turbidity and NO3− (r = + 0.70), turbidity and Cu (r = + 0.70) at the dumpsite (dry season). There were direct associations between conductivity and TDS, TS, TS, PO43−, SO43−, Pb, Cd, FC and TC, significant among them were the correlations between conductivity and TDS (r = + 0.67), conductivity and TS (r = + 0.87). Similarly, useful correlations were obtained for the water quality parameters in the wells near defecation sites and residential areas in the two seasons (dry and wet).
Discussion
Study revealed that Pb, Cd, FC and TC exceeded the guidelines established by World Health Organization [
10] for potable water. Nitrate and turbidity levels exceeded the limits in some cases where the values were respectively above 10 mg/L and 5.0 NTU but sulphates, phosphates and solids were completely within the acceptable range. Related works conducted in other parts of the country showed elevated concentrations of some water pollutants [
11–
14].
Sangodoyin and Agbawhe [
15] detected pollutant concentrations in shallow groundwaters affected by leachates from Abattoir in Ibadan area in southwest Nigeria up to 250 m from pollution source. Asubiojo et al [
12] found concentrations of toxic metals in the range of 0.06 to 1.1μg/l for Cd, 0.23 to 54 μg /l for Cu and 0.61 to 14 μg/l for Pb in boreholes and dug wells. Elevated metal concentrations (Cd and Pb) in this study were attributed to anthropogenic influence such as small-scale entrepreneur activities, which include open-air solid waste combustion, sawmills, wood works, quarrying, gas stations and auto-repair workshops[
11,
16–
19].
Higher trace metal concentrations in the wet season implied increased soil metal burden from atmospheric deposit of air-borne particulates by wet precipitation and subsequent rainwater run-off of waste materials. Metal levels could also be traced to dissociation from bedrocks through which the well water flows [
11]. Cu enters water system through mineral dissolution and industrial effluents. The absence of major industries in the study areas could have reduced Cu levels below the recommended limit.
Results showed that the well water samples gave pH values useful for drinking, domestic and agricultural purposes except for wells ≤ 50 m from defecation sites [
20]. The higher values of water pH for wells in the vicinity of waste dumpsites relative to the residential areas with quotient coefficients of 1.08 (dry season) and 1.04 (wet season) was attributed to the release of carbon dioxide, ammonia and methane during decomposition of the waste materials, which percolate through the aquifer to the groundwater via leachates [
21]. The reduced pH of water samples from wells located close to the defecation sites relative to residential areas with quotients of 0.78 (dry season) and 0.83 (wet season) was attributed to sulphur and amino acid compounds from human and animal excreta. In addition, the organic matter could have depleted oxygen resulting in a negative redox potential [
13,
22].
Turbidity stems from the reduction of transparency due to the presence of particulate matters such as clay, silt, finely divided organic matter, plankton or other microscopic organisms. The colloidal materials provide adsorption sites for chemicals that may be harmful to health or cause undesirable tastes or odours. High turbidity levels are therefore associated with poor water quality. Conductivity indicates the presence of dissolved solids and contaminants especially electrolytes but does not give information about specific chemical. Most drinking waters have conductivity measurement below 2000 μS/cm but the recommended value is ≈ 250 μS/cm [
10]. The conductivity levels of the water samples from wells in the vicinities of the dumpsites, defecation sites and residential areas were greater than 200 μS/cm, indicating the presence of electrolytes confirmed by the presence of the cations (Pb
2+, Cu
2+and Cd
2+) and anions (SO
42−, NO
3−, PO
43−) and results also showed that the solids and sulphates in the wells are within the WHO recommended value of 1000 mg/L, hence, could be utilized in fisheries project and agricultural activities [
23,
24]. Levels of sulphate above 600 mg/L act as purgative in humans [
25,
26].
Nitrate concentration above the recommended value of 10 mg/L is dangerous to pregnant women and poses a serious health threat to infants less than three to six months of age because of its ability to cause methaemoglobinaemia or blue baby syndrome in which blood loses its ability to carry sufficient oxygen [
27–
29]. Malomo et al [
30] reported nitrate concentrations up to 124 mg/L and nitrite up to 1.2 mg/L in shallow groundwater near pollution source in southwest Nigeria. These concentrations were unusually high. The common concentrations are a little above 10 mg/L for NO
3− and 0.06 mg/L for NO
2− as reported by previous investigators [
6,
11,
12]. Traces of phosphates increase the tendency of troublesome algae to grow in the water and their presence in the study area may be traced to agricultural activities [
5].
Threshold for DO is 5.0 mg/L for drinking water and should be more than 5 mg/L for agricultural purposes [
31]. Very low DO may result in anaerobic conditions that cause bad odors. Results revealed that that the well water quality with respect DO (3.0 to 5.06 mg/L) is not suitable for agricultural and fisheries project but high enough not to cause anaerobic conditions in drinking water. COD and BOD are indices of organic pollution. A COD of less than 1.0 mg/L is assumed not to be caused by anthropogenic influence.
Drinking water supply should not exceed COD of 2.5 mg/L and potable water of COD content greater than 7.5 mg/L is regarded as poor [
32]. High COD interferes with oxygen transfer to the soil, thus affecting plant growth. Drinking water sources should have BOD less than 3 mg/L. If this value is exceeded, coagulation and rapid sand-filtration processes conventional water treatment will be adversely affected. For environmental conservation, BOD is set at less than 10 mg/L to prevent odour caused by the anaerobic decomposition of organic matter and water with BOD
5 less than 4 mg/L is of good quality and levels greater than 10 mg/L are polluted as reported by Environment Canada [
33].
Coliform populations are indicators for pathogenic organisms. They should not be found in drinking water but are usually present in surface water, soil and feces of humans and animals. Human waste contaminant in water causes water-borne diseases such as diarrhea, typhoid and hepatitis [
22,
25]. High coliform populations in all the water samples are an indication of poor sanitary conditions in the community. Inadequate and unhygienic handling of solid-wastes in the rural area could have generated high concentration of microbial organisms. High coliform counts appear to be characteristic of rural ground water quality in Nigeria, consistent with the works of other investigators who worked on bacteriological and chemical characteristics of rural water supplies in other parts of the country [
12,
34–
40].
Conclusions
The following conclusions were drawn from study; all the pollutants were detected up to 200 m from pollution source. Proximity to the wastes sites and change in season from dry to wet period influenced the concentrations of the water quality parameters. Most of the hand-dug well water samples in the vicinities of pollution source and those in the residential areas contained Pb, Cd, and coliform levels (FC and TC) above the WHO stipulated limits for potable water. Overwhelming high coliform pollution index of up to 40 for wells near pollution sources relative to those in the residential areas were computed The high coliform index, increased metal levels and organic loads of the water samples were indices of pollution from leachates, seepages and run offs of the polluted environment where these wells were located. Based on the results, the groundwater resource, without standard treatment is unfit for drinking and domestic uses.
It is recommended that increased and continued combined environmental interventions, through public health education by community based health workers, awareness and sensitization campaigns be carried out for improved household and community sanitation in rural areas in the developing countries. Wells located within 50 meters from pollution source should be abandoned and future wells should be constructed beyond 250 meters from pollution source. Adequate solid waste disposal method should be adopted, phasing out open dumpsites to safeguard public health from water borne diseases.


