Introduction
Background Information
Environmental change continues at an alarming proportion in the Southeast region of the United States [1, 2, 3, 4]. The current pace of environmental decline in the region in the form of high rates of land cover change, deforestation, decline in quality and quantity of water bodies and the proliferation of human settlements and pollution have been glaringly felt along the surrounding ecology within the Savannah River basin of Georgia [
5]. Generally, the South East region known for its large reserves of natural resources produces 40% of US agricultural crops and ranks high as a major wood producing area accounting for 50% of timber delivery in the US [
3]. Before the European presence, the region had vast areas of upland forests, grasslands, and wetlands covering almost, 30% of the region [
6]. This seemed to have changed during the 1990s when the region’s remaining wetlands, shrank to about 16% of the total land areas [
7].
With the pace at which water demands has started surpassing the available water resources due to increasing needs by competing users, various indicators of environmental change are now abundant in the South East. Notable ecological change indicators such as poor air quality, land use changes and urbanization contributing to environmental health problems and climatic variability have now emerged as key concerns for cities. In addition to these trends, much of the most remarkable land use changes in the country occurred around the South East coastal and metropolitan areas with ensuing vast network of urbanized areas reflecting the pressure of human settlements and population growth along coastal areas. The South East Sunbelt area also stands as a rapidly growing region with a population increase of 32% between 1979 and 1990. Much of the growth occurred in coastal counties which grew by 41% from the year 2000 through 2005 [
3]. Such extraordinary growth rates in the south east over the last three decades has also been leading to serious social-economic debates due to the linkages of the growth patterns with the impacts of environmental change such as sea level rise, storm surges and extreme events [
4,
8]. At the same time, the number of farms in the region dropped to 80% between 1930 and 1997 while the urban population grew [
3].
Turning to environmental change in the study area, Georgia ranks ninth in wetlands acreage, and fifth in the conservation of wetlands in the country. During the middle of the 1970s, Georgia contained about 5,298,000 acres of wetlands, after having transformed close to 146,000 acres in the 1950s and about 1.5 million acres during the 1780s. Approximately 80 to 90% of these transformations occurred as conversions to other forms of land use. Most of the changes experienced in the area were on freshwater wetlands along the coastal plain of the state. Chatham Coliform, Fish The large conversions of wetlands during the last 15 years, in the state occurred because of high demands for agro- forest products, population growth, and urbanization along the Piedmont, Mountains and within the coast [
9].
Figure 1.1.
Spatial Distribution of Ground Water
Pollution Susceptibility in the Study Area
Figure 1.1.
Spatial Distribution of Ground Water
Pollution Susceptibility in the Study Area
In the Savannah area of the Region, there are a several environmental problems confronting the city of Savannah. The two major concerns in the area consist of the threats to groundwater water quality, which is presented, in the southeastern and coastal portion of the map in
Figure 1.1 and the effect of storm water runoff and septic tank leachate on the tidal marsh. While in the area, the Floridan aquifer serves as a major supplier of water to Chatham County, the surge in industrial and residential development has created increased pumping and a reduction of the piezometric pressure coupled with saltwater intrusion into the Aquifer. In Chatham County where tidal marshes and open saltwater constitutes 43 percent of the total land, during the periods of 1990 through 2000, about 18,900 acres were converted to development. The capacity of the marsh to absorb and treat pollutants and runoffs appears further compounded by upstream discharges and septic tank leachate. The Subsurface discharge of contaminants from which septic tank drain fields in Chatham and upstream counties causes impairment of water quality in the region as shown in
Table 1.1 [
9].
Table 1.1.
Impaired waters listed within Chatham County
in 2004
Table 1.1.
Impaired waters listed within Chatham County
in 2004
| Water
Body
Name | Water
Body
Type | Watershed
Name | Location | Listed
Impairments |
|---|
| Casey
Canal* | Stream/
Creek/
River | Ogeecchee
Coastal | Chatham
County | Dissolved
Oxygen, Fecal
Coliform, Fish
consumption
guidance
Dieldrin |
| Hayners
Creek* | Stream/
Creek/
River | Ogeecchee
Coastal | Chatham
County | Dissolved
Oxygen, Fecal
Coliform, Fish
consumption
guidance |
| Little
Ogeechee
River* | Stream/
Creek/
River | Ogeecchee
Coastal | Chatham
County | Fecal
Coliform |
| Savannah
Harbor | Estuary | Lower
Savannah | HWY 17
to South
Channel | Dissolved
Oxygen |
Past harbor development along the Savannah port involving channelization have caused the loss of 53% (3,200 acres) of the wildlife refugees along the tidal freshwater marsh. If not closely monitored, the current deepening could destroy 40% of the remaining tidal freshwater marsh. In fact, the proposed harbor deepening would also demand additional wildlife refuge lands for the proposed channel enlargement. Before 1977, the Savannah River provided refuge to some of the most important striped bass population in the State of Georgia. Due to previous harbor development, production of stripped bass eggs in the Savannah River estuary fell by 95% region [
10]. Additionally, the management of the 310 square mile Savannah River site owned by the United States Department of Energy (DOE) has also emerged as a source of environmental problem. The concern stems from inability of the US DOE to produce credible records on the quantity of nuclear waste disposed at the site. In the area, farmland operations have also fallen drastically in Chatham County along the Savannah River basin as a result development activities [
5].In the face of these threats, the need for geospatial analysis of environmental changes is of paramount importance in the area [
11].
Apart from the threats of environmental change, the approach towards mitigation remains enormous. The efforts consist of a moratorium and the reassessment of current frameworks in the conservation of ecologically sensitive resources such as marshes and wetlands. This involves a need to monitor new forms of development in areas prone to high growth. Another approach embody the development of standards that preserve natural resources and coastal barrier Islands, endangered species, open space and conservation areas as well as the continuous protection of water resources and planning on a watershed level and evaluation of the costs environmental change [9, 12-15].
With the proposed mitigation measures in place, other notable concerns pertaining to environmental health assessment in the area revolves around limited access to data, lack of adequate attention to human pressures on the ecosystem, inaction towards environmental protection and the meager assessment of change using geospatial information systems. These systems offer capabilities for ensuring the collection, management, storage and processing of spatial information in the analysis of environmental change. In the last several years, Geographic Information System (GIS) and Remote Sensing have found widespread applications in the analysis of environmental change in different geographic areas [16, 17, 18]. GIS refers to a system for capturing, storing, analyzing and managing data and associated attributes that are spatially referenced to the earth. It is an information system built in a computer environment with capabilities for editing and displaying spatially referenced data. On the other hand, remote sensing refers to the acquisition of information on an object through a recording device that is not in physical or intimate contact with the object. In an applied setting, remote sensing is the utilization at a distance of data or information not visibly nearby [19, 20].
While many see the process as very lengthy, it should not stop us from using latest advances in geospatial information systems technologies of GIS and remote sensing as valuable tools for change detection during the assessment of stressed ecosystems in the Savannah river basin. The Southeast region where the study area is located as mentioned before is prone to environmental change impacts such as hurricanes and droughts that affect communities [1, 3]. For a region that is becoming highly vulnerable to environmental uncertainties, using geospatial information technologies in quickening impact detection provides countless opportunities in the development of effective response mechanisms capable of minimizing the emerging environmental impacts in the planning process. Accordingly, there exists a body of work in the literature by Merem and Twumasi outlining the use of different sets of geospatial technologies in the assessment of human activities in stressed environments [21, 20].
Organization and Objectives
The paper uses geospatial information systems technology and descriptive statistics in the assessment of environmental change along the Savannah River of Georgia. In line with the aims and of the paper, emphasis is on the issues, factors and remedies to the problems. The paper is divided in five sections, the first part consists of the background and the methods, the second section covers the results of the data analysis on environmental change. Section three presents the factors fuelling environmental change while the fourth section contains the remedies and initiatives to contain the problems. The fifth section highlights the discussion, recommendations and future lines of action. The paper has four objectives. The first aim is to design geospatial tools for environmental change assessment. The second objective involves the desire to update the literature while the third objective strives to identify environmental change issues with a focus on Georgia and the South East. The fourth objective is to develop methods for tracking change in order to inform decision-making.
Background and Methods
Study Area
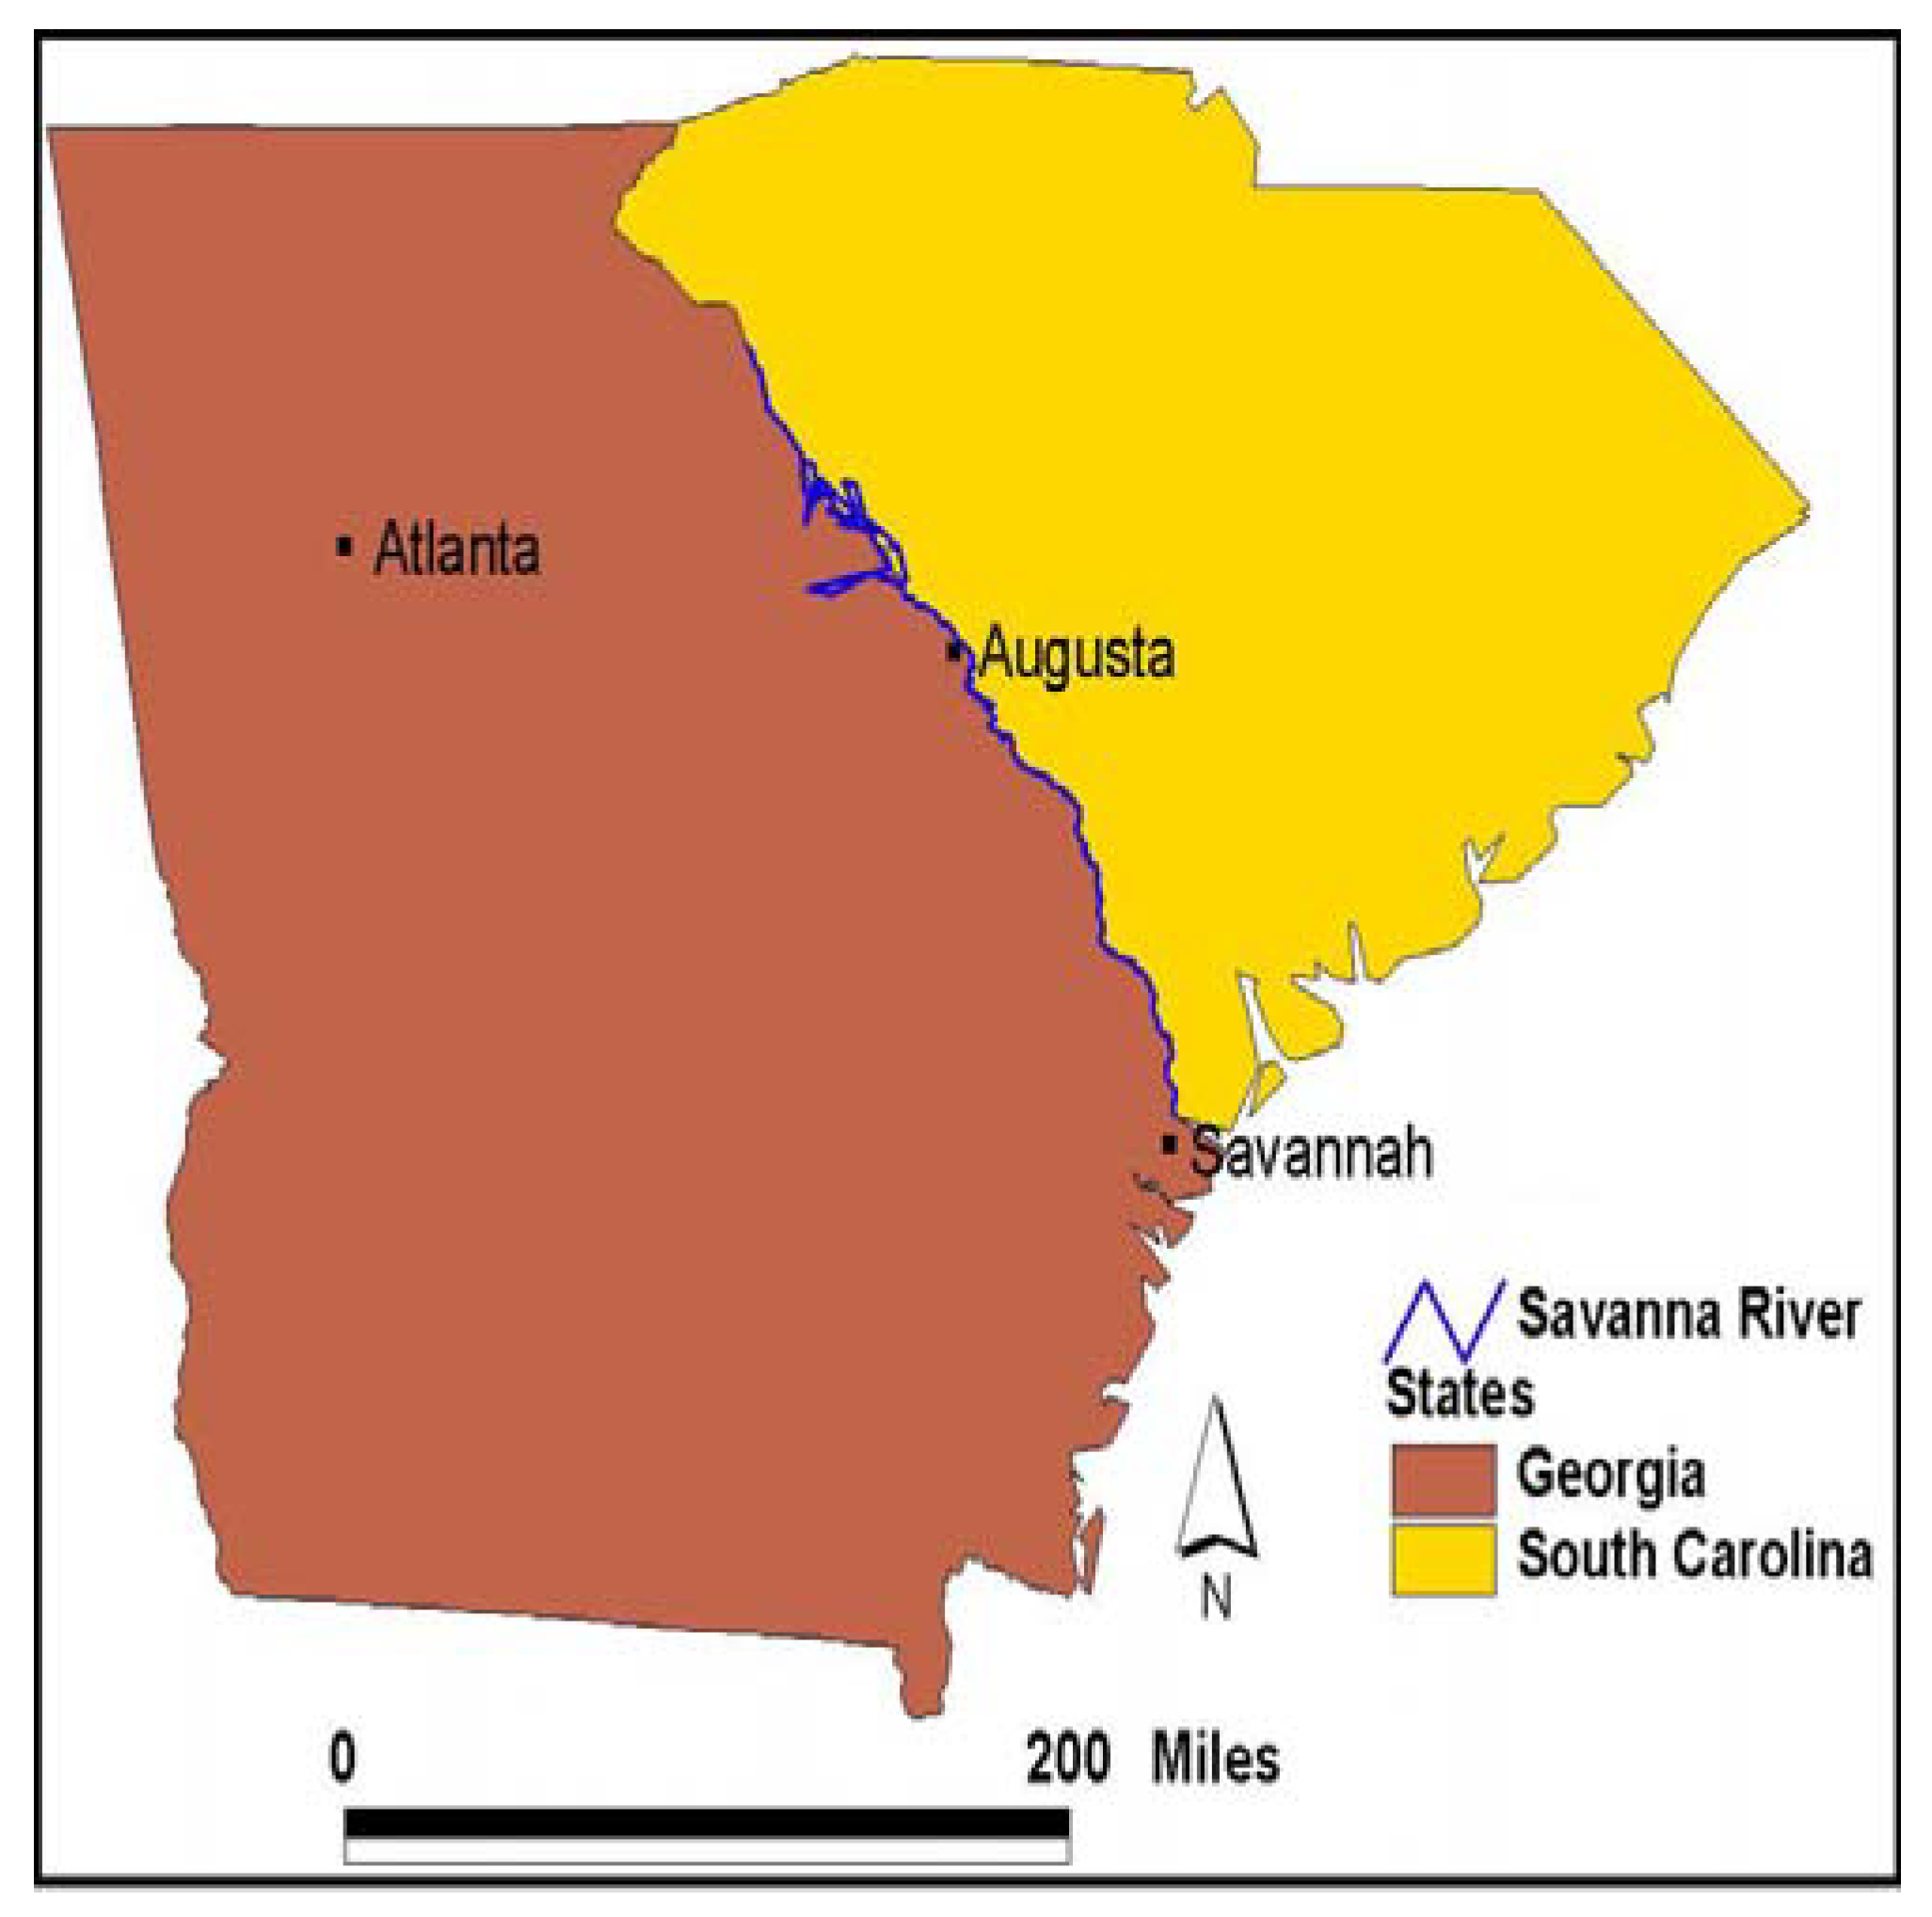
The Savannah River shown in
Figure 1.2 is situated along the boundary between Georgia and South Carolina, and is shared with North and South Carolina. It is the most widely used surface water source in the Savannah River basin. The basin has a population of over 523,000 people and about 5,000,000 inhabitants in Georgia obtain their drinking water from the Savanna River [9, 22, 23].
Figure 1.2.
Map of the study area
Figure 1.2.
Map of the study area
The basin stretches through an area measuring about 10,577 square miles of which 175 square miles are in southwestern North Carolina, 4,581 square miles in western South Carolina, and the other 5,821 square miles in eastern Georgia. The Savannah River basin on the Georgia side includes partly or all of 27 Georgia counties, however only 10 are exclusively within the basin and 9 others have small fraction (less that 20 percent) of their land within the basin. Above all, only about 18 counties are with visible jurisdictional powers in the basin [
22]. Some of these counties are the partly listed in tables 1.2 – 3.3.
Table 1.2.
Georgia counties in the Savannah River basin
Table 1.2.
Georgia counties in the Savannah River basin
| Counties within the entire basin | Counties partially within the basin | Counties with less than 20% of area within the basin |
|---|
| Banks,
Columbia
Elbert,
Franklin | Burke,
Effingham,
Madison | Chatham, Clark,
Glascock, |
| Hart, Lincoln,
McDuffie,
Richmond | Oglethorpe,
Rabun, Screven | Green Habersham,
Jackson |
| Stephens,
Wilkes | Taliaferro,
Warren | Jefferson, Jenkins,
Towns |
Table 2.1.
Harvested cropland in selected counties of the Savannah River basin
Table 2.1.
Harvested cropland in selected counties of the Savannah River basin
| Counties | 1992 (acres) | 1997 (acres) | 2002 (acres) | % of Change 1997-2002 |
|---|
| Banks | 5,355 | 6,151 | 7,343 | 19.38 |
| Chatham | 978 | 947 | 727 | -23.23 |
| Columbia | 3,046 | 2,349 | 1,860 | -20.82 |
| Effingham | 11,044 | 18,891 | 11,976 | -36.60 |
| Elbert | 12,364 | 13,136 | 12,794 | -2.60 |
| Habersham | 5,024 | 6,567 | 6,246 | -4.89 |
| Hart | 15,545 | 16,919 | 16,439 | -2.84 |
| Jefferson | 56,182 | 62,528 | 51,660 | -17.38 |
| Jenkins | 30,901 | 32,247 | 27,057 | -16.09 |
| McDuffie | 5,816 | 6,880 | 6,888 | 0.12 |
| Madison | 10,712 | 13,947 | 12,672 | -9.14 |
| Screven | 58,602 | 69,679 | 54,320 | -22.04 |
| Stephens | 2,174 | 4,052 | 3,820 | -5.73 |
| Warren | 5,281 | 3,471 | 5,567 | 60.39 |
| Wilkes | 12,580 | 11,480 | 12,195 | 6.23 |
| Richmond | 6,201 | 7,462 | 2,541 | -65.95 |
| Total | 241,805 | 276,706 | 234,105 | 15.3 |
Table 2.
2: Number of farms in selected counties of the Savannah River basin
Table 2.
2: Number of farms in selected counties of the Savannah River basin
| Counties | 1987 | 1992 | 1997 | 2002 | % of Change 1997-2002 |
|---|
| Banks | 477 | 469 | 535 | 614 | 14.77 |
| Chatham | 51 | 40 | 50 | 58 | 16.00 |
| Columbia | 187 | 154 | 229 | 196 | -14.41 |
| Effingham | 202 | 182 | 244 | 206 | -15.57 |
| Elbert | 331 | 314 | 386 | 438 | 13.47 |
| Habersham | 452 | 455 | 499 | 517 | 3.61 |
| Hart | 507 | 452 | 570 | 567 | -0.53 |
| Jefferson | 339 | 295 | 406 | 388 | -4.43 |
| Jenkins | 208 | 178 | 297 | 240 | -19.19 |
| McDuffie | 186 | 211 | 276 | 296 | 7.25 |
| Madison | 593 | 605 | 764 | 763 | -0.13 |
| Screven | 304 | 282 | 384 | 347 | -9.64 |
| Stephens | 198 | 172 | 234 | 238 | 1.71 |
| Warren | 146 | 136 | 158 | 165 | 4.43 |
| Wilkes | 331 | 319 | 353 | 349 | -1.13 |
| Richmond | 130 | 113 | 133 | 140 | 5.26 |
| Total | 4642 | 4377 | 5518 | 5522 | 0.07 |
Table 2.3.
Land in farms in selected counties of the
Savannah River basin
Table 2.3.
Land in farms in selected counties of the
Savannah River basin
| Counties | 1992 (acres) | 1997 (acres) | 2002 (acres) | % of Change 1997-2002 |
|---|
| Banks | 49,397 | 51,232 | 57,723 | 12.67 |
| Chatham | 8,518 | 9,393 | 9,080 | -3.33 |
| Columbia | 26,984 | 33,721 | 23,296 | -30.92 |
| Effingham | 43,775 | 54,072 | 53,196 | -1.62 |
| Elbert | 54,233 | 60,462 | 63,429 | 4.91 |
| Habersham | 36,074 | 34,914 | 38,526 | 10.35 |
| Hart | 58,529 | 63,496 | 65,352 | 2.92 |
| Jefferson | 136,082 | 146,466 | 137,217 | -6.31 |
| Jenkins | 77,532 | 96,410 | 94,632 | -1.84 |
| McDuffie | 33,785 | 44,410 | 46,774 | 5.32 |
| Madison | 61,757 | 76,135 | 76,458 | 0.42 |
| Screven | 138,803 | 172,920 | 184,170 | 6.51 |
| Stephens | 15,521 | 20,981 | 19,527 | -6.93 |
| Warren | 47,000 | 46,699 | 47,992 | 2.77 |
| Wilkes | 93,078 | 96,961 | 99,218 | 2.33 |
| Richmond | 15,974 | 15,919 | 12,439 | -21.86 |
| Total | 897,042 | 1,024,191 | 1,029,029 | 0.47 |
Table 2.4.
Environmental indicators in selected counties
of the Savannah River basin
Table 2.4.
Environmental indicators in selected counties
of the Savannah River basin
| Counties | 2004 Toxic chemical releases pounds | 2004 Toxic chemical releases, number of facilities | 2006 Hazardous waste sites number | 2000 Water withdrawals (Totals million gallon per day) |
|---|
| Banks | 0 | 2 | 1 | 2.19 |
| Chatham | 7,084,636 | 30 | 20 | 215.79 |
| Columbia | 721,626 | 8 | 0 | 16.76 |
| Effingham | 2,016,493 | 4 | 0 | 149.15 |
| Elbert | 89,117 | 1 | 0 | 3.06 |
| Habersham | 47,068 | 2 | 0 | 7.59 |
| Hart | 29,232 | 2 | 0 | 4.09 |
| Jefferson | 13 | 1 | 1 | 26.81 |
| Jenkins | 20,245 | 1 | 0 | 6.78 |
| McDuffie | 258,423 | 4 | 2 | 5.24 |
| Madison | 203 | 1 | 0 | 2.87 |
| Screven | 2,646 | 2 | 0 | 25.38 |
| Stephens | 77,032 | 8 | 1 | 3.75 |
| Warren | 42,764 | 2 | 0 | 2.36 |
| Wilkes | 0 | 2 | 1 | 2.54 |
| Richmond | 10,937,866 | 29 | 20 | 218.39 |
| Total | 21327364 | 99 | 46 | 692.75 |
Table 3.1.
Population change in selected counties of the Savannah River basin
Table 3.1.
Population change in selected counties of the Savannah River basin
| Counties | Total % Change 1980-1990 | Total % Change 1990-2000 | Total % Change, 2000-2005 | Total % Change 2000-2010 Trend Projection |
|---|
| Banks | 18.5 | 39.9 | 11.3 | 24.4 |
| Chatham | 7.2 | 7.0 | 2.6 | 5.6 |
| Columbia | 64.6 | 35.2 | 16.3 | 30.1 |
| Effingham | 40.2 | 46.1 | 25.0 | 43.6 |
| Elbert | 1.0 | 8.2 | 1.4 | 4.4 |
| Habersham | 10.4 | 30.0 | 10.3 | 21.3 |
| Hart | 6.1 | 16.7 | 4.5 | 10.6 |
| Jefferson | -5.4 | -0.8 | -2.0 | -2.8 |
| Jenkins | -6.7 | 4.0 | 1.8 | 3.7 |
| McDuffie | 8.5 | 5.5 | 2.4 | 4.9 |
| Madison | 18.6 | 22.2 | 6.1 | 13.9 |
| Screven | -1.4 | 11.1 | 0.4 | 3.8 |
| Stephens | 7.7 | 8.5 | -1.5 | 0.6 |
| Warren | -7.7 | 4.2 | -3.7 | -3.6 |
| Wilkes | -3.2 | 0.8 | -2.2 | -2.5 |
| Richmond | 4.5 | 5.3 | -2.0 | -1.2 |
Table 3.
2: Population trends in selected counties of the Savannah River basin
Table 3.
2: Population trends in selected counties of the Savannah River basin
| Counties | Total Population |
|---|
| 1970 | 1980 | 1990 | 2000 |
|---|
| Banks | 6833 | 8702 | 10308 | 14422 |
| Chatham | 187767 | 202226 | 216774 | 232048 |
| Columbia | 22327 | 40118 | 66031 | 89288 |
| Effingham | 13632 | 18327 | 25687 | 37535 |
| Elbert | 17262 | 18758 | 18949 | 20511 |
| Habersham | 20691 | 25020 | 27622 | 35902 |
| Hart | 15814 | 18585 | 19712 | 22997 |
| Jefferson | 17174 | 18403 | 17408 | 17266 |
| Jenkins | 8332 | 8841 | 8247 | 8575 |
| McDuffie | 15276 | 18546 | 20119 | 21231 |
| Madison | 13517 | 17747 | 21050 | 25730 |
| Screven | 12591 | 14043 | 13842 | 15374 |
| Stephens | 20331 | 21763 | 23436 | 25435 |
| Warren | 6669 | 6583 | 6078 | 6336 |
| Wilkes | 10184 | 10951 | 10597 | 10687 |
| Richmond | 162437 | 181629 | 189719 | 199775 |
| Total | 550837 | 630242 | 695579 | 783112 |
Table 3.
3: Building permits in selected counties of the Savannah River basin
Table 3.
3: Building permits in selected counties of the Savannah River basin
| Counties | Building Permits Residential Units | % of Change 2002-2005 |
|---|
| 2002 | 2003 | 2004 | 2005 |
|---|
| Banks | 122 | 109 | 139 | 143 | 17.2 |
| Chatham | 1787 | 1500 | 1752 | 2490 | 39.3 |
| Columbia | 1489 | 1431 | 1650 | 1794 | 20.4 |
| Effingham | 515 | 584 | 831 | 957 | 85.8 |
| Elbert | 16 | 2 | 4 | 122 | 662.5 |
| Habersham | 422 | 505 | 441 | 444 | 5.2 |
| Hart | 12 | 13 | 165 | 238 | 1888.5 |
| Jefferson | 34 | 27 | 40 | 31 | 8.8 |
| Jenkins | 8 | 7 | 12 | 13 | 62.5 |
| McDuffie | 75 | 74 | 71 | 49 | 34.6 |
| Madison | 153 | 138 | 167 | 224 | 46.4 |
| Screven | 45 | 1 | 53 | 42 | 6.6 |
| Stephens | 80 | 77 | 85 | 111 | 38.7 |
| Warren | 1 | 1 | 1 | 1 | 00 |
| Wilkes | 40 | 25 | 21 | 35 | 12.5 |
| Richmond | 914 | 888 | 831 | 693 | 24.1 |
| Total | 5713 | 5,382 | 6,263 | 7,387 | 29.3 |
The Savannah River Basin spans through three ecoregions namely the Blue Ridge, Piedmont and coastal plain that support a diverse mix of terrestrial and aquatic habitats. The basin provides habitats to a sizable number of federally and state protected species. Of the 18 federally listed species in the Savannah River basin, about five of them are classified as federally threatened while the rest 13 are grouped as federally endangered. Among the 55 species on the basin grouped as state listed, about 20 are threatened, 21 are endangered while another 10 are considered rare [
22]. In the Savannah River basin, where agriculture consists of a varied mixture of animal operations and commodity production, the overall farmland area of nearly 797,183 acres has been falling since 1982. Almost, 75 percent of the farmland is for pasture while the other 25 percent is used for cultivating such crops as cotton, peanuts, wheat, and sorghum. Because of the large-scale concentration of livestock and poultry operations in the Savannah River, poultry production is quite strong in the counties of Banks, Franklin, Hart, Madison, Oglethorpe and Stephens. Of these counties, Banks, Franklin and Madison are ranked among the top ten poultry producing counties in Georgia. Apart from agriculture, Forestry is also a major part of the economy within the basin. In the entire state output for the forestry industry in the 1997 fiscal year rose by
$19.5 billion dollars with over 177,000 people employed in the sector. The current population trend in the area has been on the rise and there are indications that by the year 2050, this will rise by 60 percent to 900,000 people [
9].
Methods Used
This paper stresses a mix scale approach involving the use of descriptive statistics and geospatial technologies of Geographic Information Systems and remote sensing in processing data provided through government sources and data bases from other organizations. The raw spatial data and satellite images used in the research were obtained through the United States National Aeronautical and Space Administration (NASA) and other organizations.
Step 1: Data Acquisition
The first step involves identification of the variables needed to assess environmental change at the regional level. The variables consist of socioeconomic and environmental data, including amount of harvested cropland, human settlements, number of farms, land in farms, forests, vegetation, water bodies, quantity of pollutants, population, hazardous waste sites, building permits (See
Table 1 and
Table 3). This process continued with the design of data matrices for the variables covering the various periods from 1990s and 2000 and beyond. In addition, to the design stage, access to databases and abstracts that are presently available within the Federal and state sources in Georgia such as Chatham-Savannah Metropolitan Planning Commission and Georgia Statistics System housed in the University of Georgia and the United States National Aeronautical and Space Agency (NASA) and host of other organizations helped facilitate the search process. The spatial data was acquired from the University of Maryland free online images covering the Savannah River basin area of Georgia for the separate periods of the 1990s through 2000s.
Step 2: Geo Spatial Data Acquisition and Processing
For the Savannah area of Georgia, multi-seasonal images were obtained for the study. The images that were assembled for Savannah region include Landsat Multispectral (MSS), Thematic Mapper (TM) and Enhanced Thematic Mapper (ETM+) data pair of 3 October 2001 and 27 September 1990. The path and rows of the scenes used in the spatial coverage were: (17, 37), (16, 38) and (18, 36). All the images were processed using ERDAS IMAGINE 8.7 image processing software. The images for Savannah were imported into ERDAS as a single band using ERDAS native file format GEOTIFF. All the bands for the region were then later grouped together by employing ERDAS Layer Stack modules. This was followed by geometric correction of the images to remove, haze, scan-lines and speckles. The scenes were later mosaicked using ERDAS Mosaic Tool. Image matching techniques was applied on all the images in order to achieve uniform color on all them. A linear stretch enhancement technique was performed on all the images, and later subset using Erdas Area of Interest Tool (AOI) to emphasize the study area. The spatial data was later geo-linked to allow for the subset of both images to the study area. Finally, false-color composite images was performed using bands 4, 3, and 2 where band 4 represents red, band 3 green, and band 2 blue. This band combination makes vegetation appear as shades of red, brighter reds indicating more healthy growing vegetation. Water bodies appear blue. Finally, the output images was visually compared with the Environmental Protection Agency (EPA) output images (
Figure 2.3, Figure 2.4 and Figure 2.5) in the area to see the change across time and space.
Environmental Change Analysis
This portion of the paper presents the results of the environmental change analysis on the study area with a focus on the assessment of change and analysis of the environmental change indicators.
Geospatial Assessment of Change
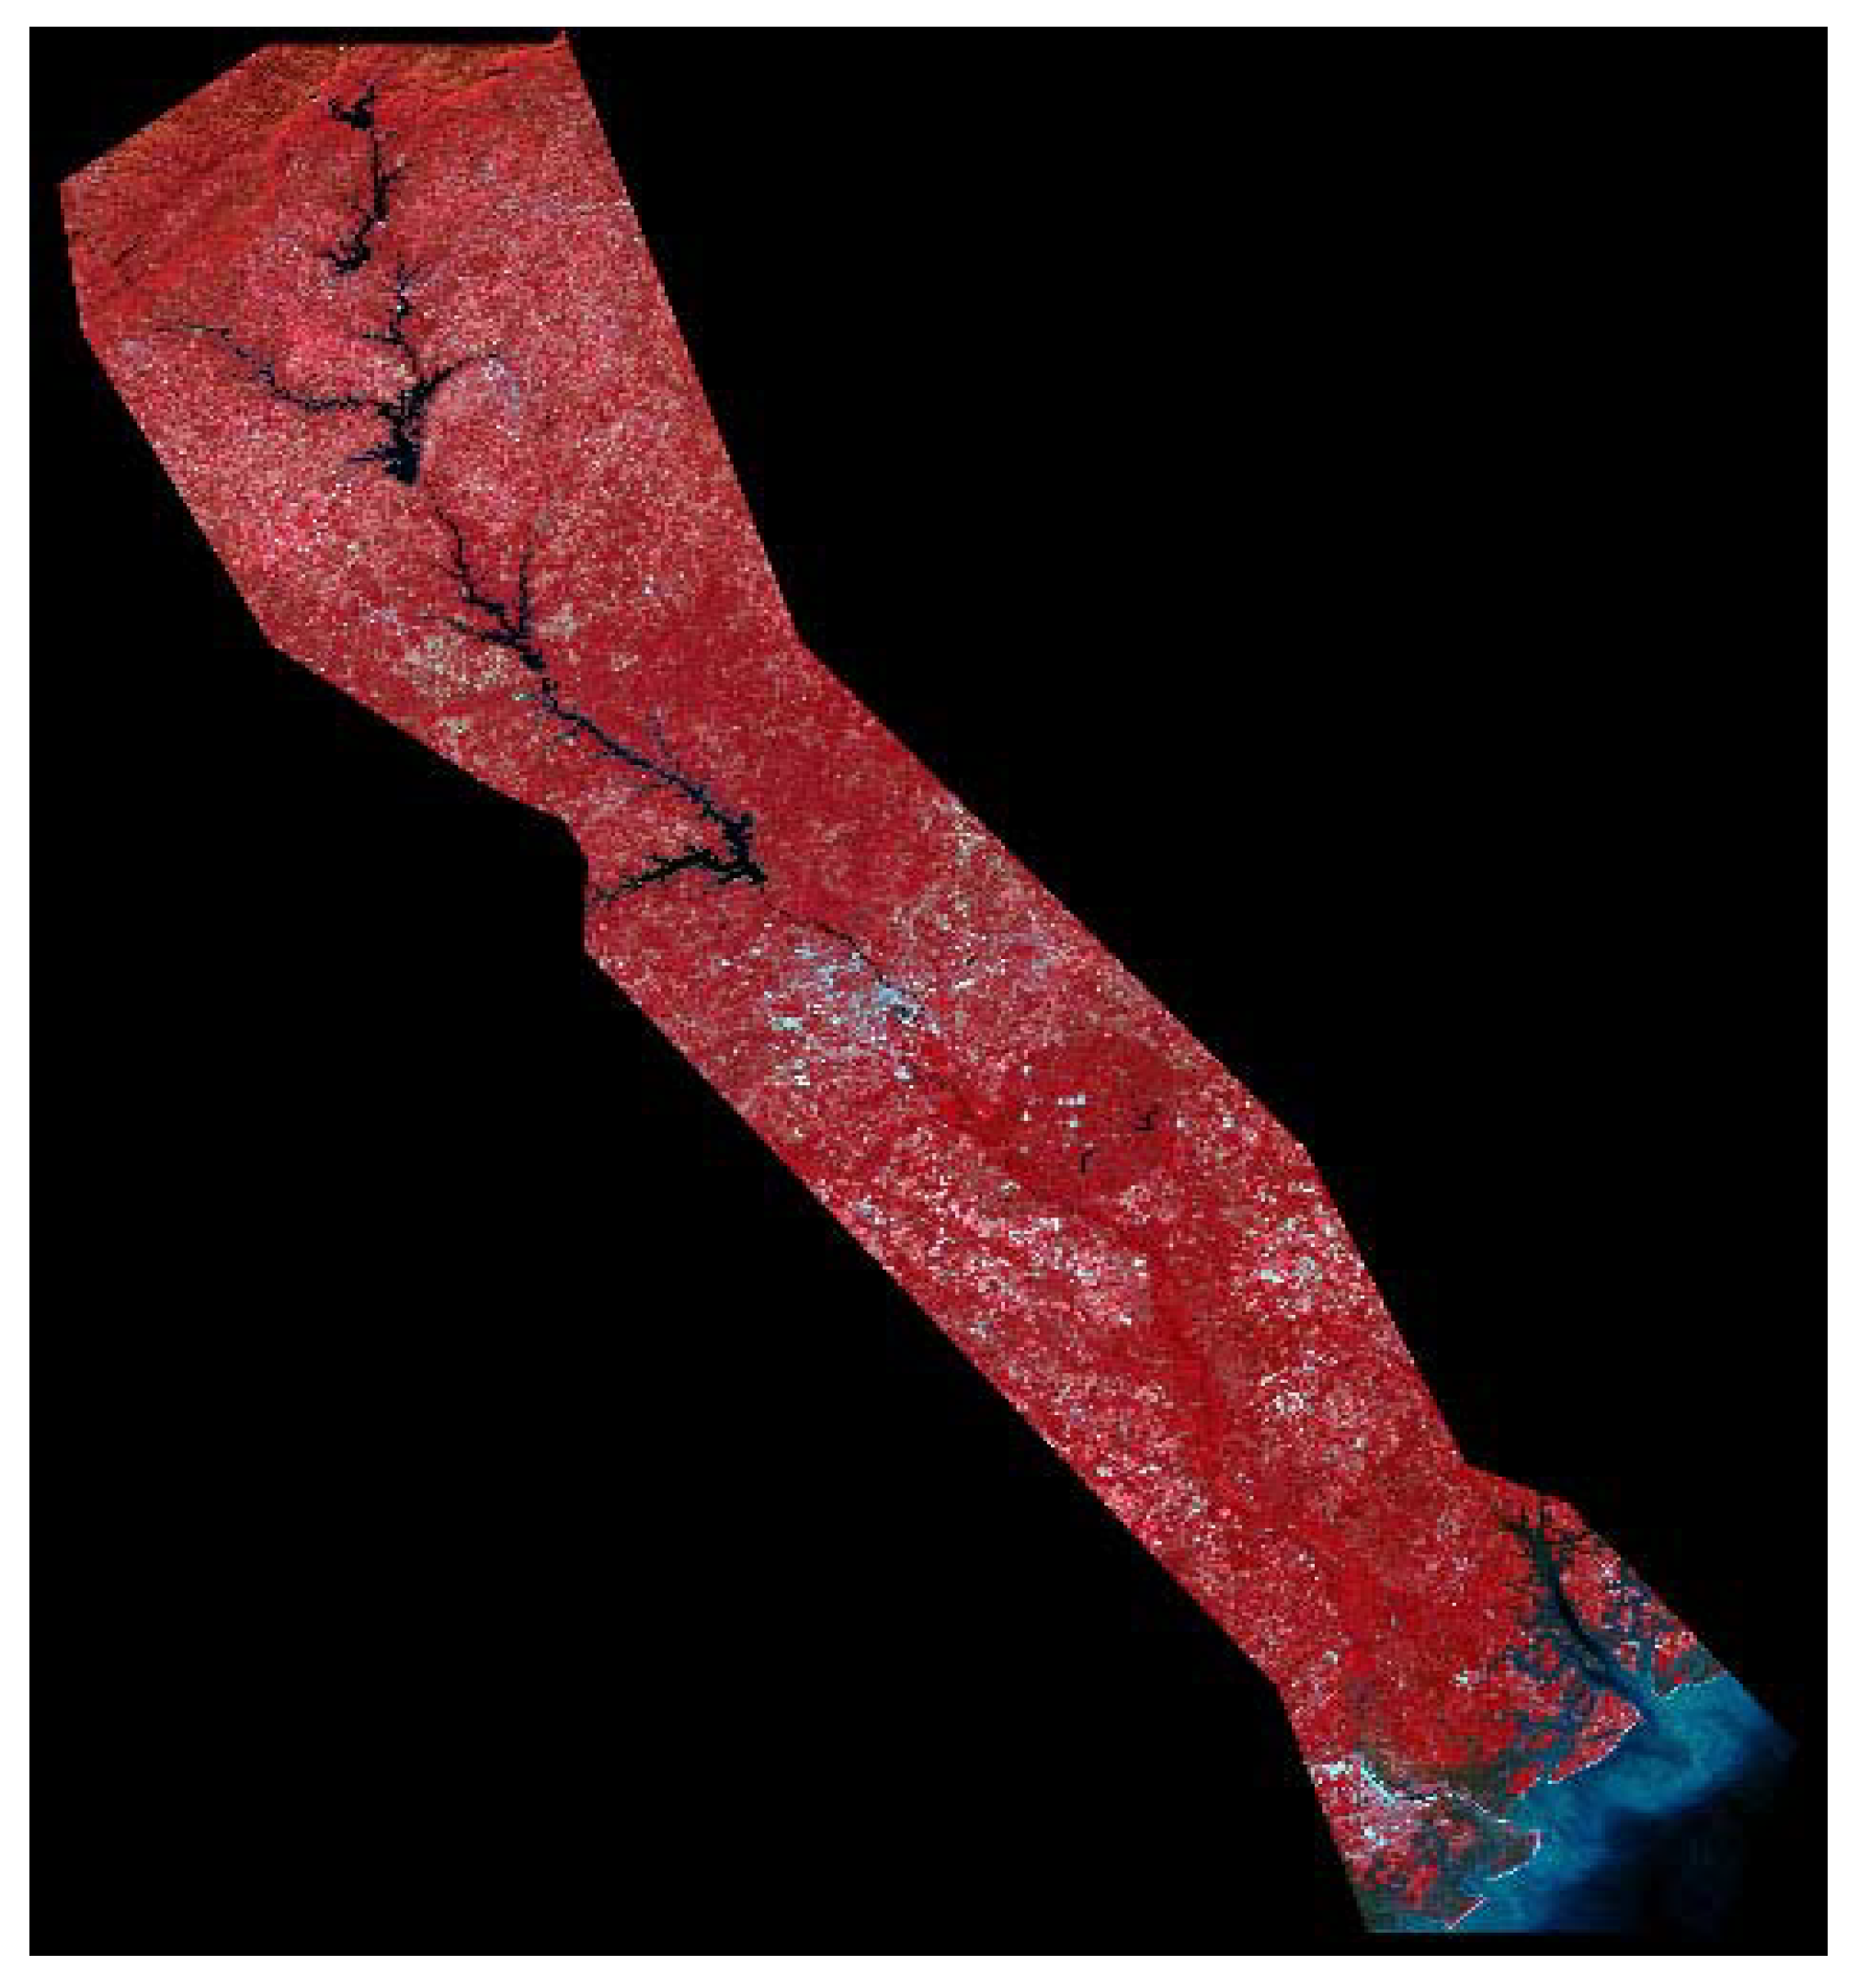
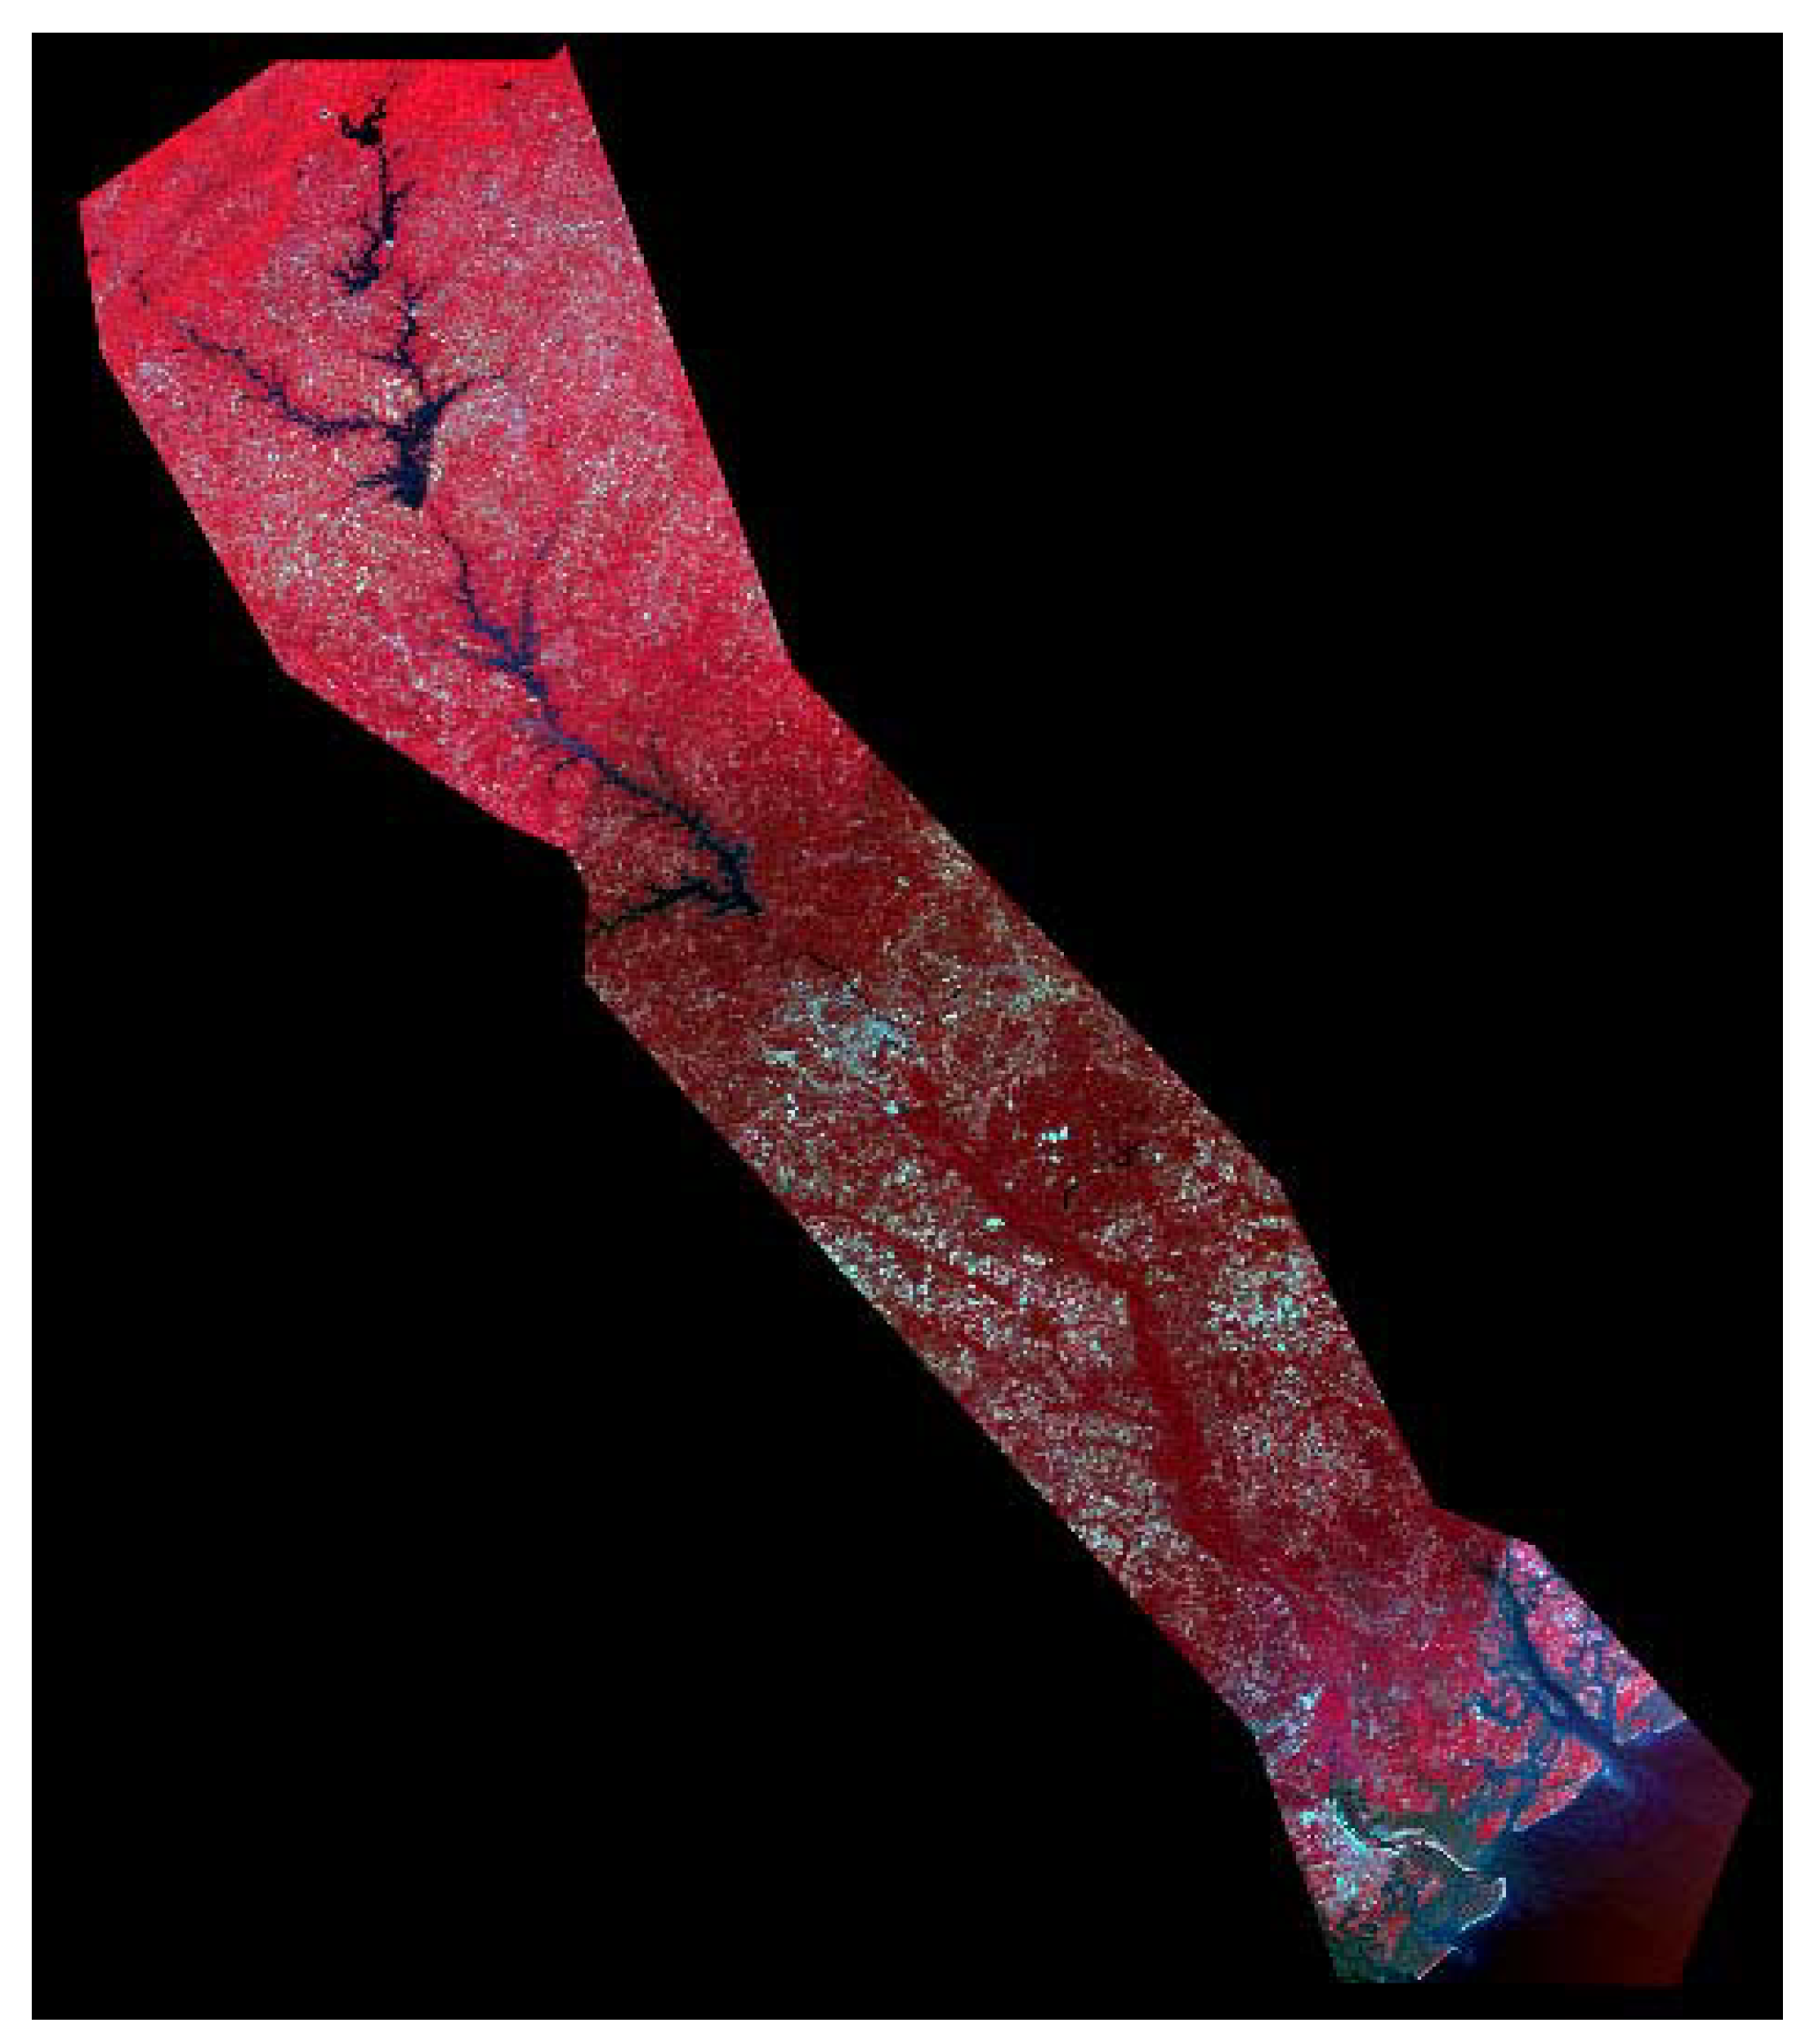
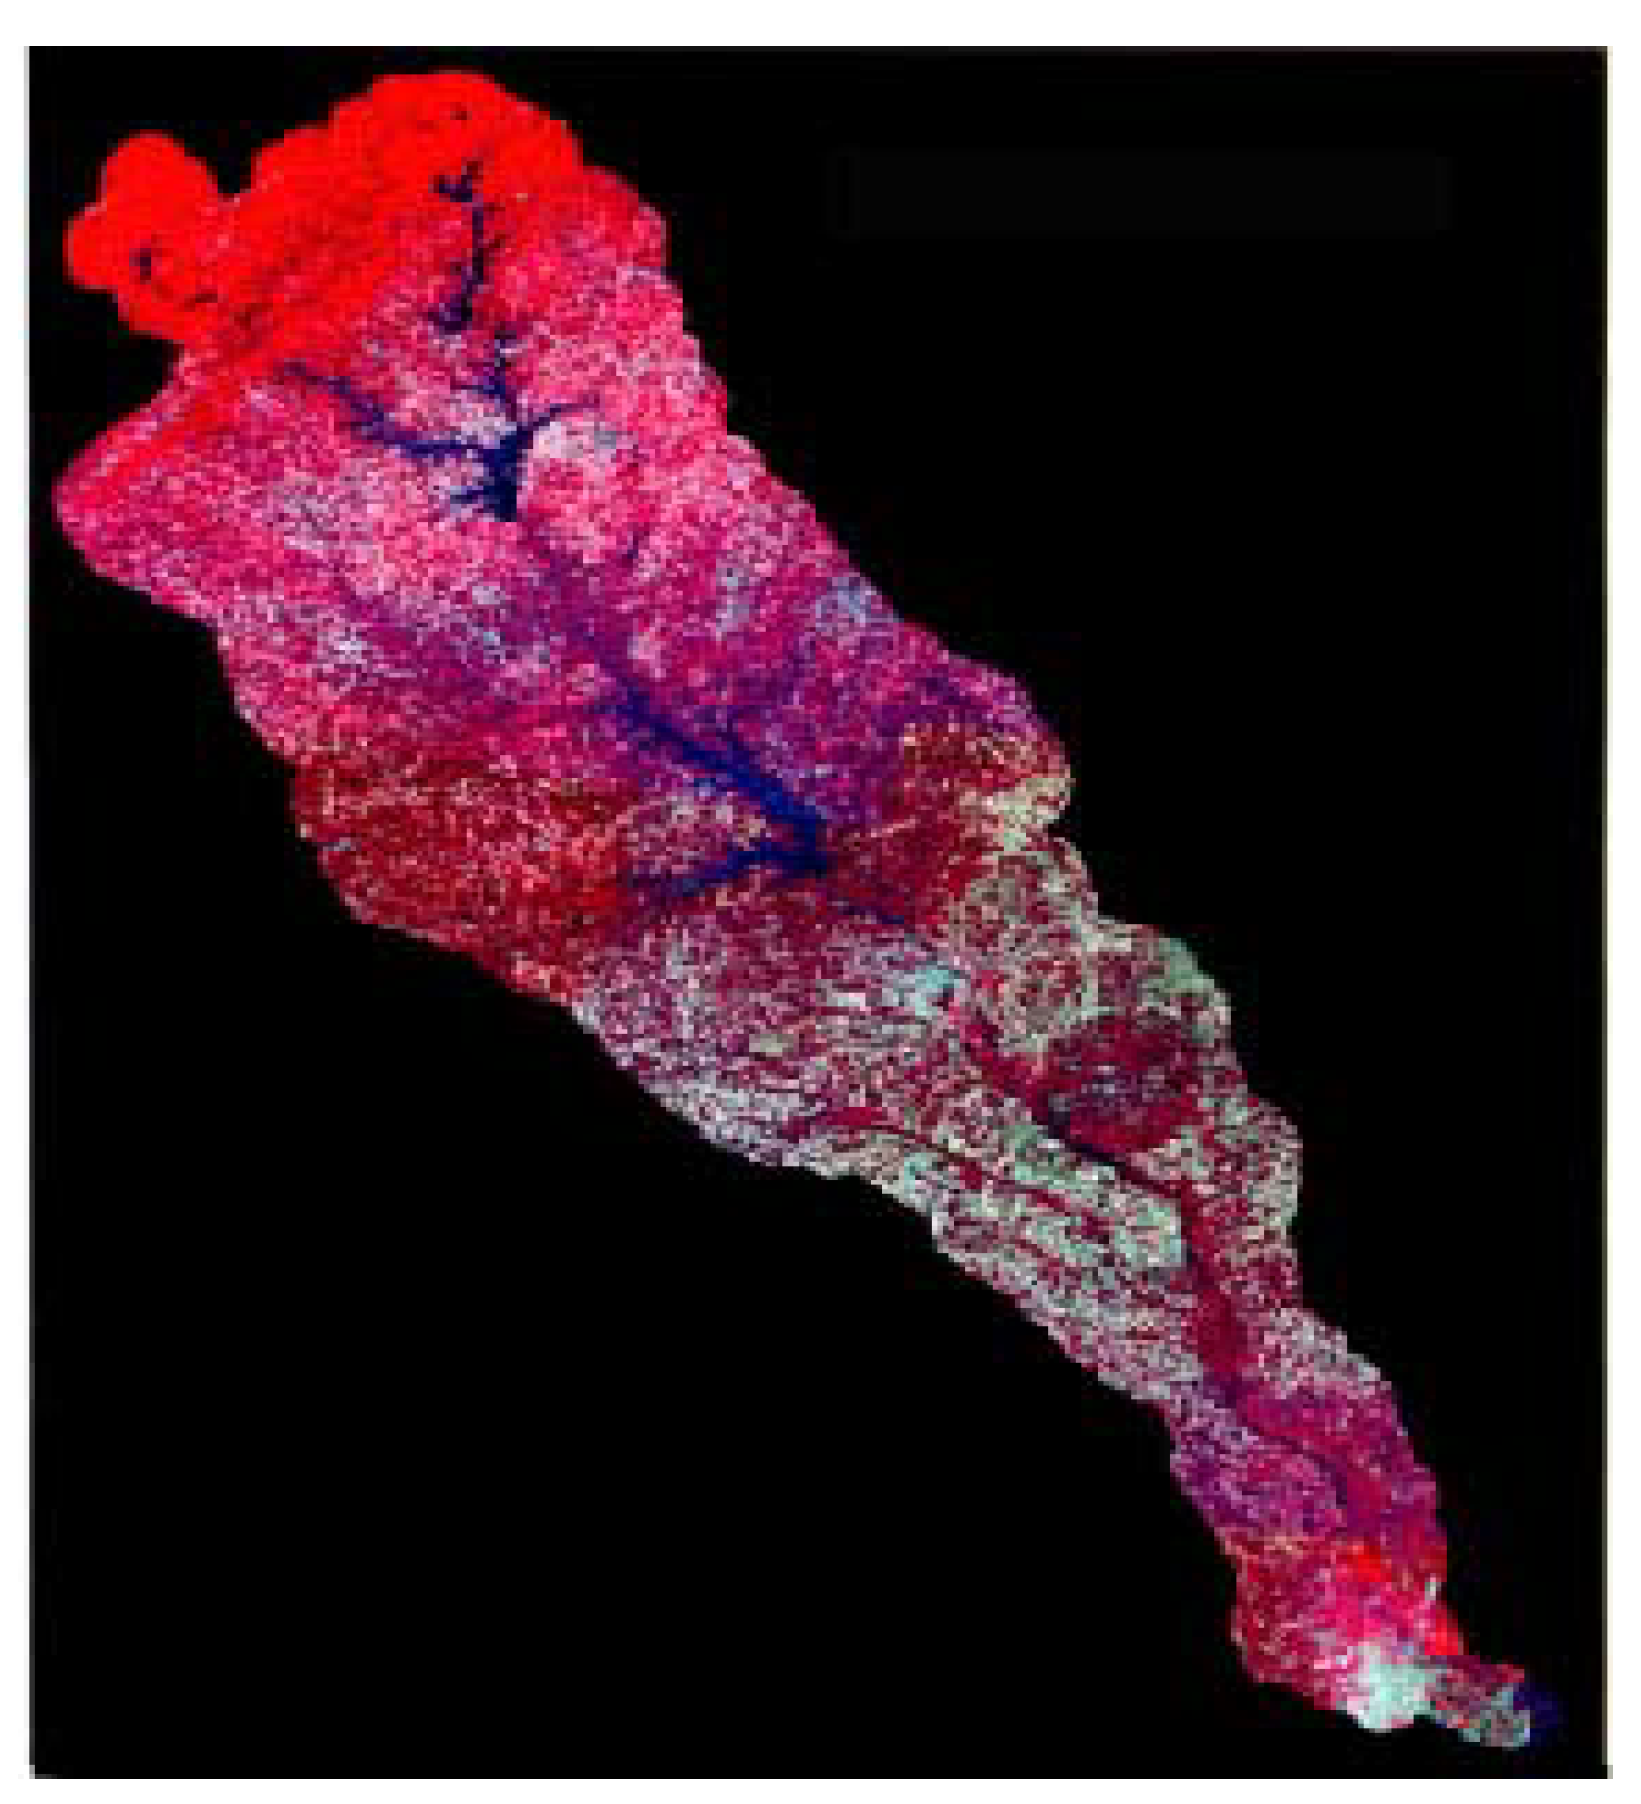
Results of the false-color composite bands of Landsat TM and ETM+ data of the study area for 27 September, 1990 and 3 October, 2001 are shown in
Figure 2.1 and Figure 2.2. Visual comparisons of these two-output images show vigorous vegetation growth along the Savanna River valley in the 1990 image compared to 2001 image. This sudden drop off in vegetation growth comes from pressures mounted by human activities within the built environment in the basin.
Figure 2.1.
September 27, 1990 false color composite
image of TM bands 432 of the Savanna River
Figure 2.1.
September 27, 1990 false color composite
image of TM bands 432 of the Savanna River
Figure 2.2.
October 3, 2001 false color composite image
of ETM+ bands 432 of the Savanna River
Figure 2.2.
October 3, 2001 false color composite image
of ETM+ bands 432 of the Savanna River
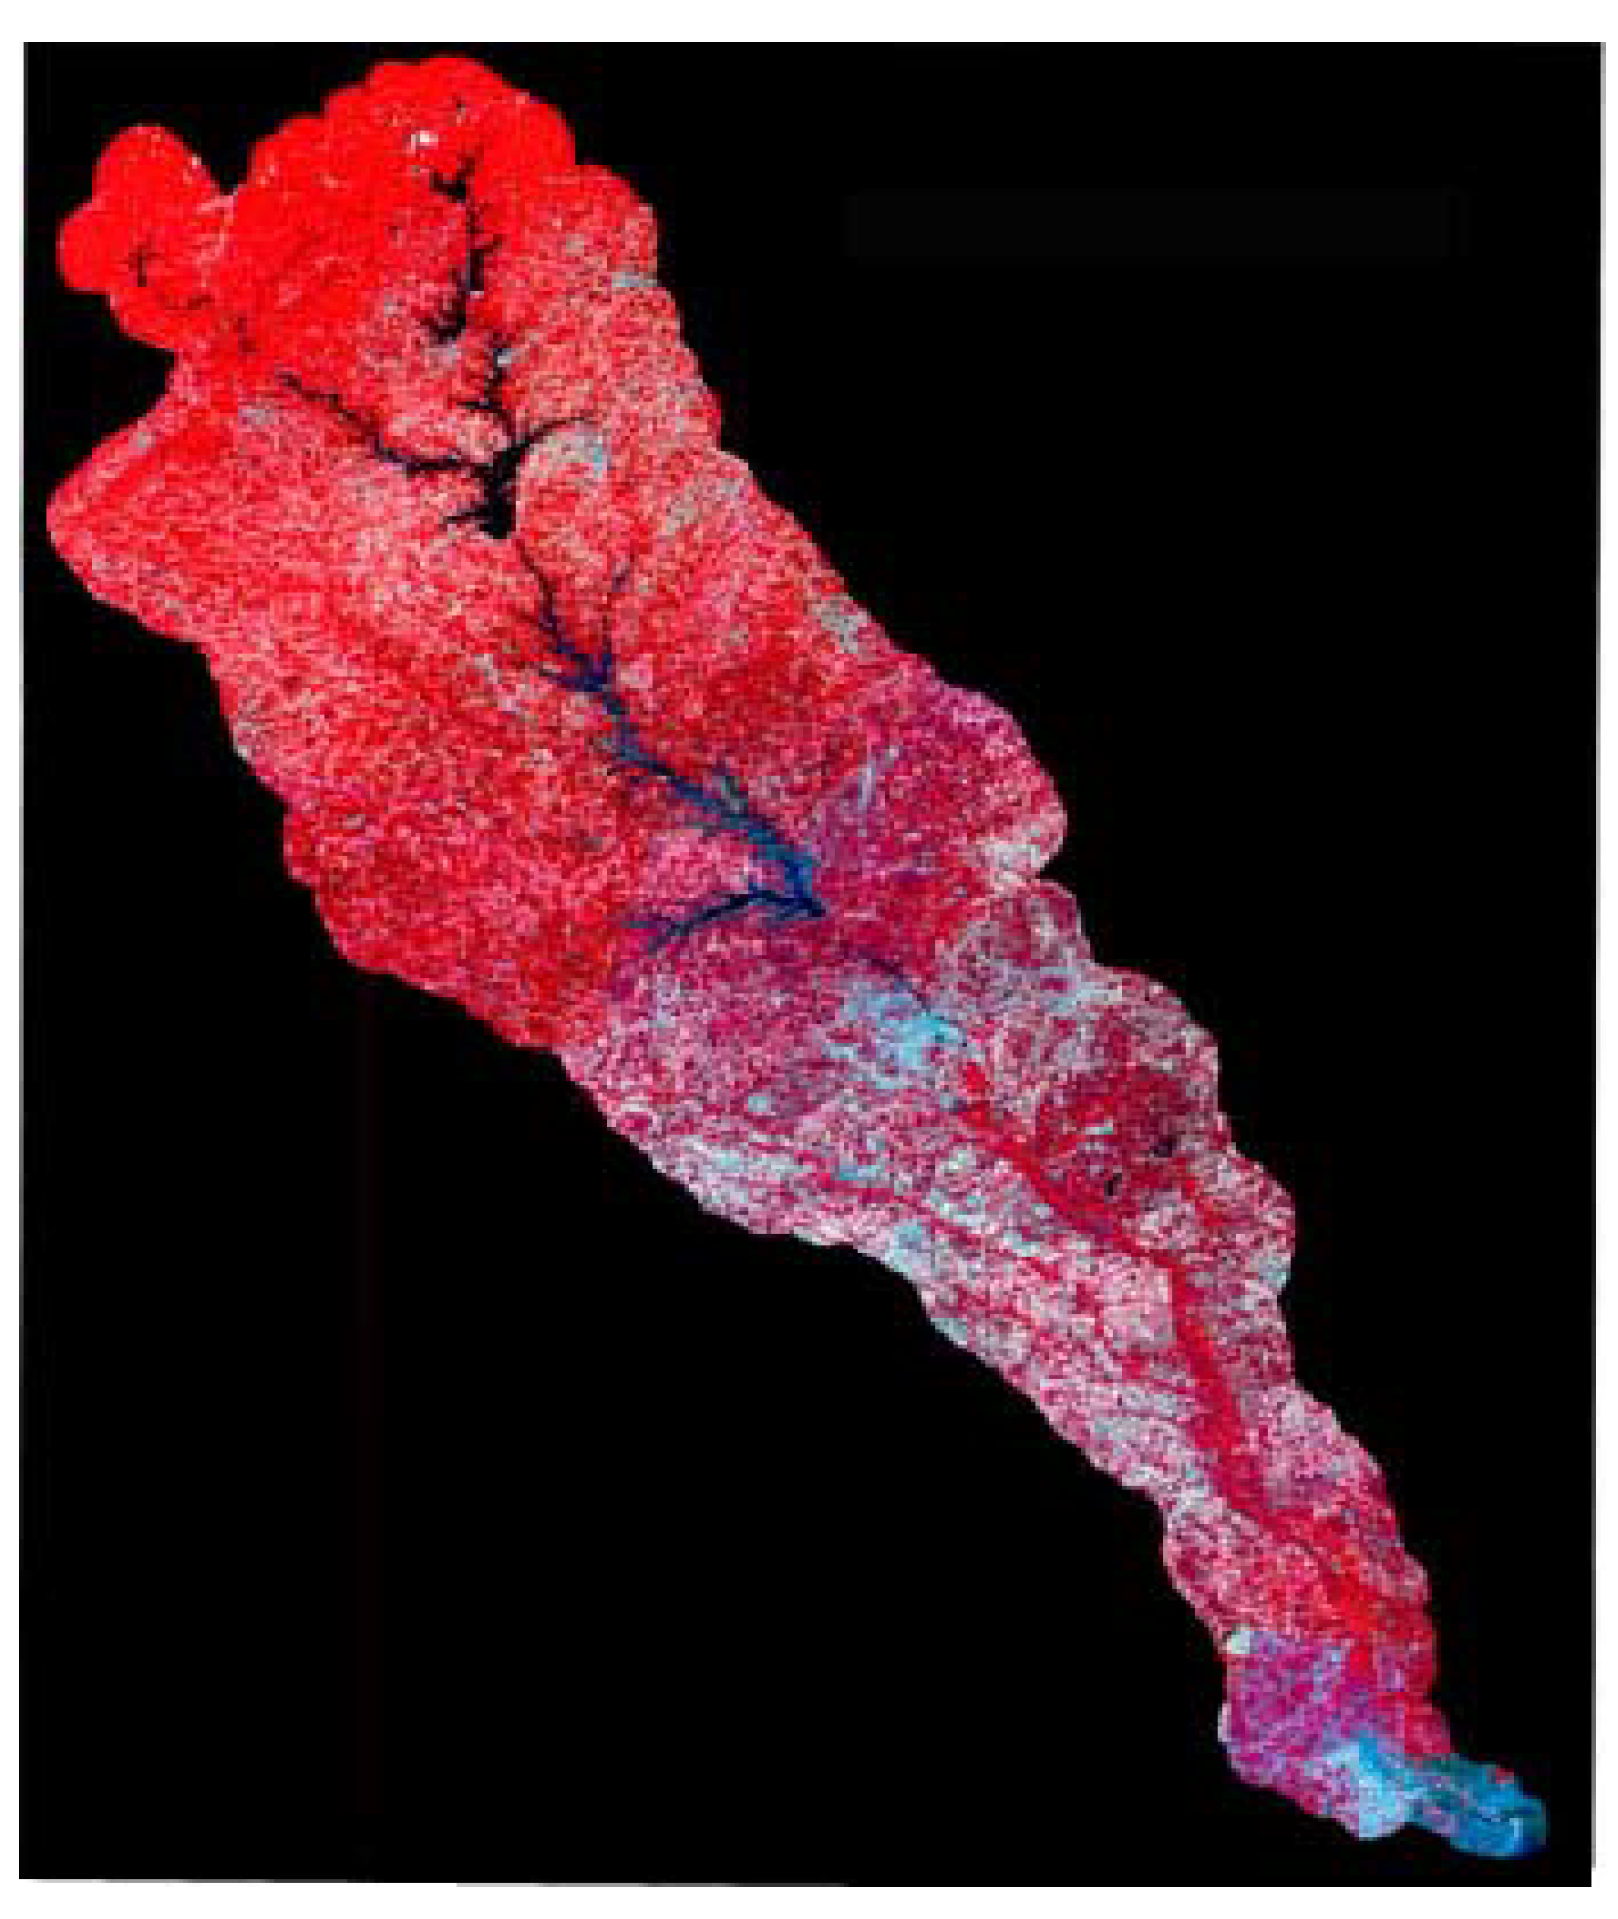
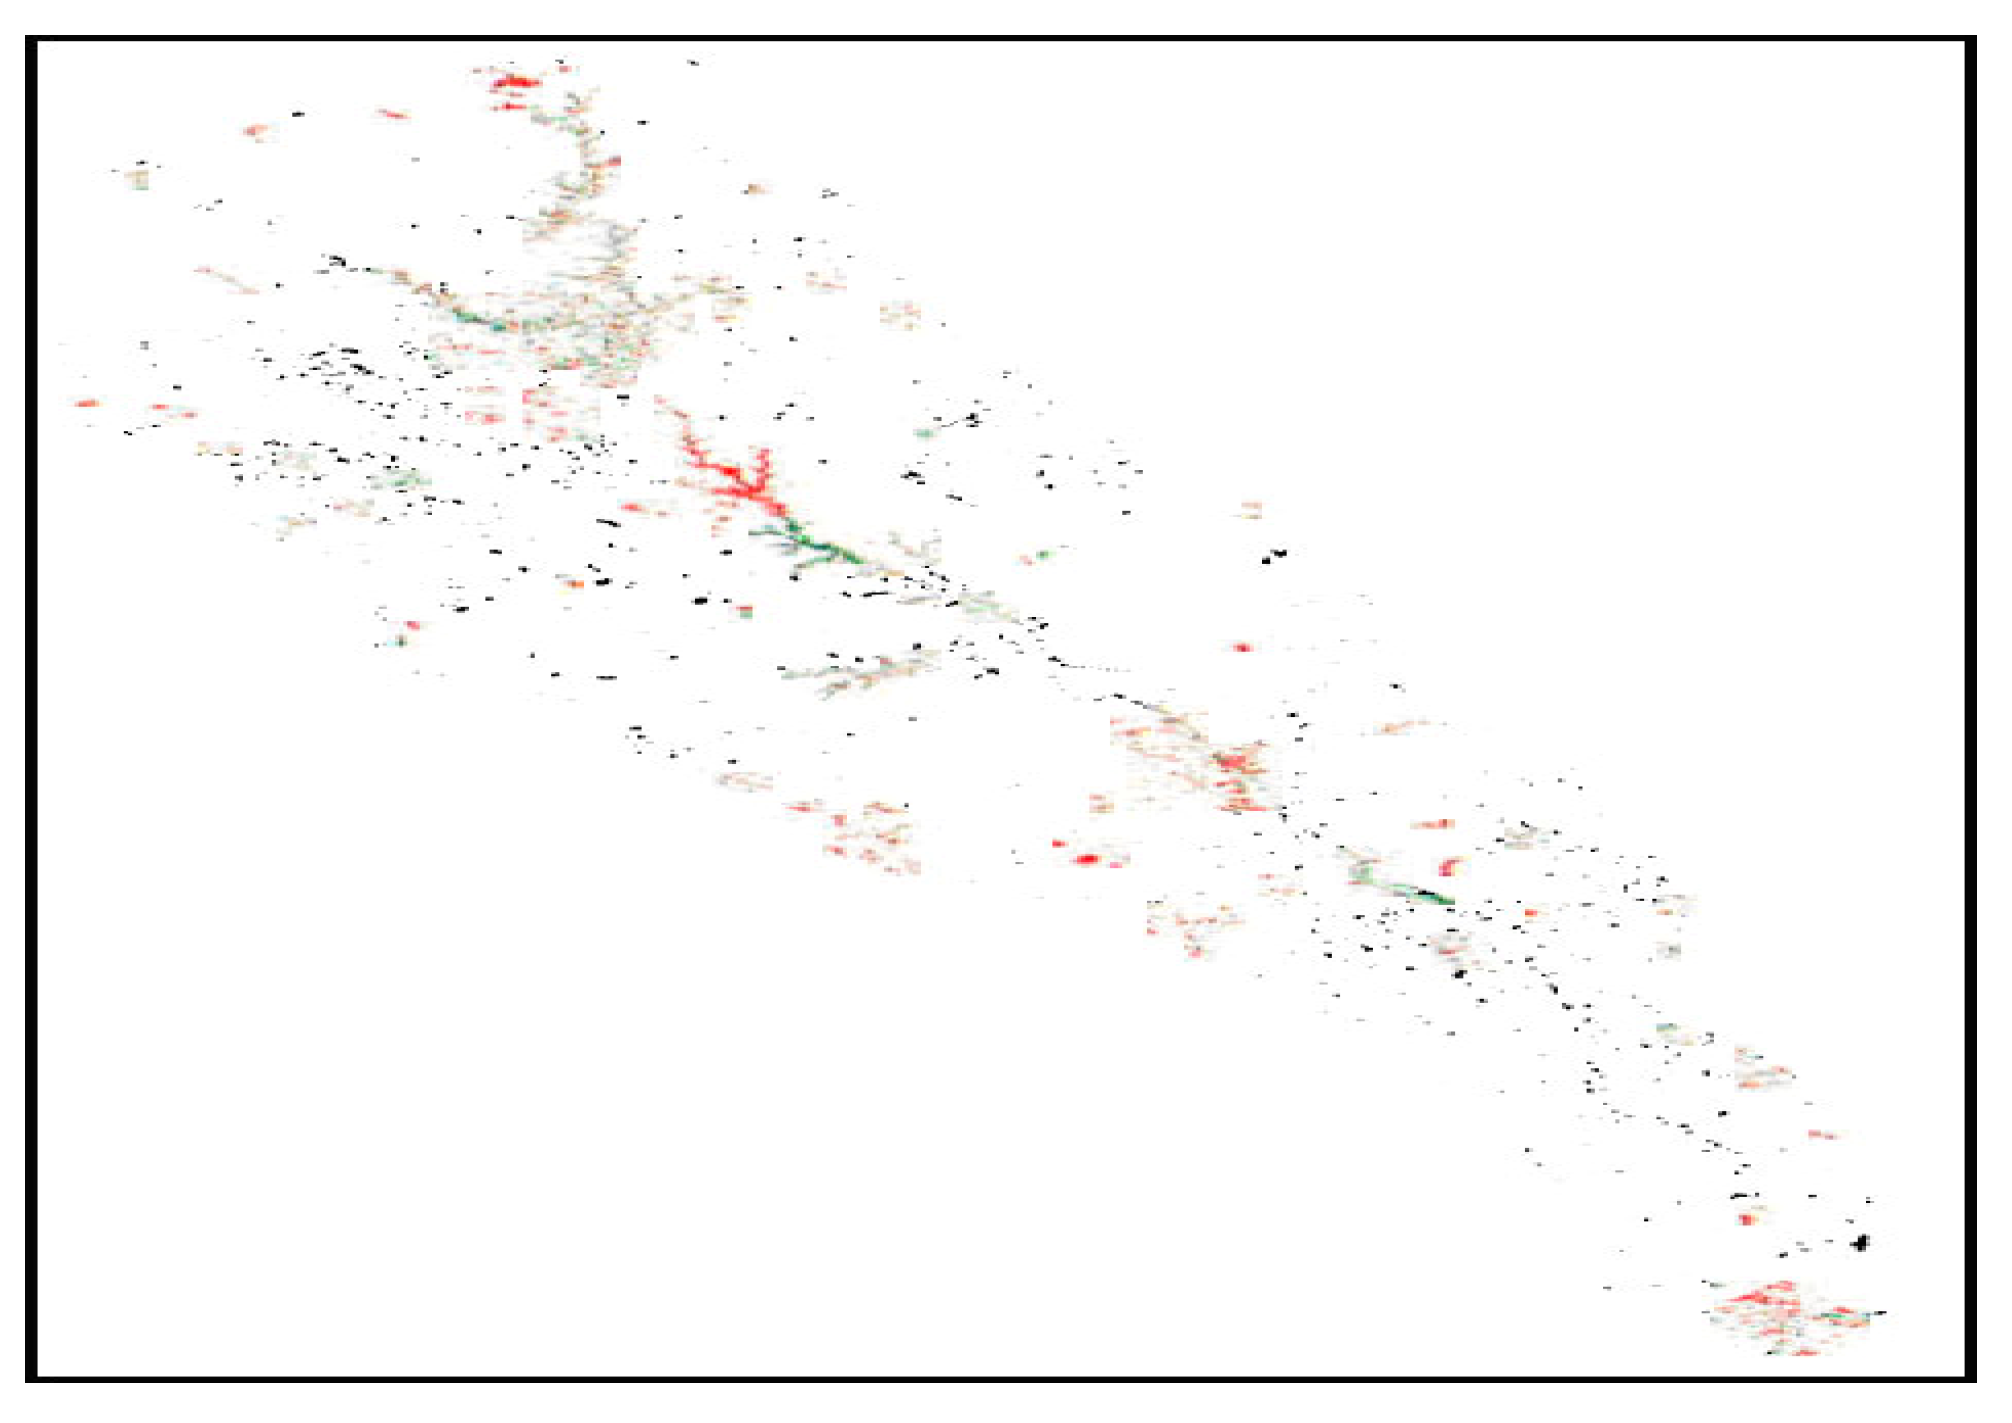
A similar trend was found in the EPA data in the area using Landsat MSS and TM data shown in
Figure 2.3 and 2.4. Using similar visual comparison and Normalized Difference Vegetation Index (NDVI) methods, EPA data shows that losses in vegetation growth far out-striped the gains along the banks of the Savanna River during the period of 1970s and 1990s (
Figures 2.3-2.5 ).
Figure 2.3.
1990s Savanna River
Figure 2.3.
1990s Savanna River
Figure 2.4.
1970s Savanna River
Figure 2.4.
1970s Savanna River
Figure 2.5.
Savanna River 1990s – 1970s NDVI Change.
Gains in vegetation are shown in green and losses in red Change Assessment for Other Environmental Resources
Figure 2.5.
Savanna River 1990s – 1970s NDVI Change.
Gains in vegetation are shown in green and losses in red Change Assessment for Other Environmental Resources
In
Table 2.1, note that the size of harvested cropland was more pronounced in three counties of Jefferson, Jenkins, and Screven in the study area than the other areas in the different periods under analysis. The results show also that in the initial periods of 1992 through 1977 most counties made some gains while in 1997 to 2002 the majority posted significant losses. From the data, 12, counties representing about 75 percent of the entire area between 1992 through 1997 period all made substantial gains. Much of the losses occurred in just 4 counties that represent 25% of the areas under analysis. From the table, see that the trend in the county of Banks stayed stable just as in 1992 and 1997 all through 2002 while some counties that made gains in 1992 through 1997 ended up with loses from 1997 to the 2002 period. The study area’s harvested cropland area went from 276,706 acres to 234,105 acres at the same period. This figure represents an overall loss of 42,601 acres at a rate of at -15.3%. In the study area, 12 out of 16 counties representing 75 percent experienced a major decline between 1997-2002 with the exception of the counties of Banks, McDuffie, Warren and Wilken. See also that the counties of Chatham, Columbia, Effingham, Jefferson, Jenkins, Screven and Richmond all had double- digit losses in the size of harvested cropland within the study area. The changes for Richmond (7,462 acres in 1997 to 2,541 in 2002) at a rate of 65.95 appeared much higher than the other counties in the study area. For Chatham County, the harvested cropland area changed from 957 to 727 acres at a rate of -23.23 percent while the value for Columbia went from 2345 acres to 1860 at the rate of 20.82 %. With about 18,891 acres of cropland in 1997, the county of Effingham dropped further to 11.976 acres in 2002 at a rate of 36.60. The losses for Jenkins and McDuffie all stayed at 16% and over.
For the number of farms in
Table 2.2, from 1987 to 2002, the counties of Banks, Hart and Madison had more farms than the others did. On the percentage of change that occurred, the counties appeared evenly split. Further, along the years, about eight out of eight counties experienced gains between 1997 through 2002 while the others posted losses. In the study area, there were also significant losses in the numbers of available farms among the three major agricultural counties (Jefferson, Jenkins, and Screven) known for faming. The breakdown of the extent of loses among the counties shows the county of Jenkins with the biggest loss in double digits of -19.1 percent. Screven County finished with a loss of 9.64 percent. The entire area showed a miniscule gain of 0.07 percent. In terms of land in farms in
Table 2.3, the absolute numbers among the counties appeared somewhat similar to harvested cropland areas with the nearby counties of Jefferson, Jenkins, Screven, along with Wilkes having more land when compared to the others. Considering that 7 of the 16 counties in the area have been losing land areas for farming, Columbia county emerged with far more losses of -30.92 % overall. This level of land loss surpassed the figures for the counties of Jefferson at -6.31, Jenkins with -1.64, Screven just under 6.51% and Wilkes at 2.53%.
Environmental Indicators of Change
Regarding the environmental indicators of change, the analysis shows that larger amount of toxic chemicals released in the area as presented in the
Table 2.4 were more evident in five counties. The counties consist of Richmond County, Chatham, Effingham, McDuffie and Columbia. Of the total of 21,327,364 pounds of toxic chemicals released into the atmosphere in the area in 2004, about 10,937,866 came from the Richmond area while Chatham accounted for 7,084,636, Effingham emitted close to 2,018,493 pounds of the chemicals. Other sources include the 721,626 pounds from Columbia and 258,423 from McDuffie. The other group of six counties had emission levels estimated in tens of thousands pounds. In terms of facilities responsible for the toxic emissions and dumps sites in the study area, Chatman and Richmond counties led the study area in the category. While both counties contained 30 to 29 facilities respectively out of 99 sites operating in the area, they also accounted for 40 of the 46 hazardous wastes in the area as of 2006. On water trends in the region, in the fiscal year 2002, the daily withdrawal of water were also quite extensive in, the county of Chatham which used about 215.79 million gallons while the counties of Richmond and Effingham used 218.39 and 149.15 million gallons respectively. The quantities withdrawn by these counties exceeded the amount for the other counties in the same period.
Factors Responsible For Environmental Change
The scale of environmental change in the study area can be attributed to several factors. These factors range from demography to policy defects.
Demography
Timing populations the world over not only rely on access to natural resources, but natural environments such as the Savannah river and its surrounding ecology as the analysis shows continues to serve as a sink and a major life support system. To some extent, the growing population of the area presented in
Table 3.1 is associated with the current environmental change in several ways. During the decades of the 1980s through 1990s when only 5 counties experienced population loss, a cycle of rapid growth ensued in the area from 1990 to 2000 while ecological change remained rampant in the area. Although, the growth trend softened again in 2000 through 2005 as five counties experienced declines in population while others grew, but with projected drops in population just for four counties out of all the 16 in 2000-2010, the overall trend continues to point to a phenomenal growth pattern with implications for the fragile natural environment. Furthermore, the total population in the area shown in
Table 3.2, within the ten-year intervals of 1970, 1980, 1990 and 2000 and the projected population of 2010 reflect a substantial rise likely to fragment an already disturbed environment. In such a setting, the pressure from a growing population in the study area puts enormous strain on the area’s environmental resources such as water, air, agricultural land and forestry [9, 24]. See Tables 3.4-3.5 for information on population trends and projections in the study location and adjoining areas.
Housing and Infrastructure Development
The long-term housing projections shown in table indicate that 36.537 new housing units will be constructed in Chatham County by 2030, an increase of 36 percent from 2000 level. About 10,033 of these units or 27% are expected in the city of Savannah, 11,385 at 32 percent will be in the other incorporated areas of Chatham County, and 15,119 or 41 percent in the unincorporated areas. The raw materials and the design process for housing and infrastructure development of that magnitude for the public put enormous strain on environmental resources. These projects require the fragmentation of natural process in the search for energy supply, provision of sewer lines and waste treatment plants when meeting the needs of communities. The impacts of housing boom and infrastructure on forested areas, farmland and marshes render the environment more vulnerable to disasters especially in hazard prone coastal areas such as the study area. The role of housing and infrastructure development in environmental change seems apparent with the rise in building permits. As an indicator of change, see that the Port Wentworth continued at 6263 in 2004 and 7384 for the year 2005. In all the years shown in the table, the permits requested in the county of Chatham and Columbia exceeded those of the other counties with the year 2005 being the period with more requests. In 2004, the permits for Chatham and Columbia were 1752 and 1650 respectively. In 2005, the numbers climbed to 2490 and 1754 for both counties. The percentage of change in 2002 to 2005, points to a decline in 5 counties, while the figures grew in 10 other areas in the same period. These trends can impair the quality of the environment [9, 24].
Table 3.
4: Population Growth of Chatham County and Municipalities
Table 3.
4: Population Growth of Chatham County and Municipalities
| Municipality | 1980 | 1990 | 2000 | Percent Growth |
|---|
| 1980-1990 | 1990-2000 |
|---|
| Bloomingdale | 2,246 | 2,634 | 2,665 | 17.3 | 1.2 |
| Garden City | 9,095 | 10,537 | 11,289 | 15.6 | 7.1 |
| Pooler | 2,826 | 5,240 | 6,239 | 85.4 | 19.1 |
| Port | | | | | |
| Wentworth | 5,488 | 3,923 | 3,276 | -28.5 | -18.7 |
| Savannah | 142,095 | 137,173 | 131,510 | -3.5 | -4.1 |
| Thunderbolt | 2,635 | 2,756 | 2,340 | 4.6 | -15.1 |
| Tybee Island | 2,433 | 2,827 | 3,392 | 16.2 | 20 |
| Unincorporated | 34,945 | 51,718 | 71,200 | 48 | 37.7 |
| Vernoburg | 70 | 135 | 138 | 92.9 | 2.2 |
| Chatham County | 201,833 | 216,945 | 232,050 | 7.5 | 7.0 |
Table 3.
5: Population Projections: Municipalities In Chatham County
Table 3.
5: Population Projections: Municipalities In Chatham County
| Municipality | 2005 | 2006 | 2007 | 2008 | 2009 | 2010 | 2015 | 2020 | 2030 |
|---|
| Bloomingdale | 3,328 | 3,448 | 3,559 | 3,680 | 3,801 | 3,910 | 4,486 | 5,040 | 6,095 |
| Garden City | 11,130 | 11,293 | 11,460 | 11,613 | 11,784 | 11,944 | 112,727 | 13,481 | 14,912 |
| Pooler | 7,476 | 7,732 | 7,979 | 8,225 | 8,462 | 8,707 | 9,914 | 11,080 | 12,314 |
| Port Wentworth | 4,481 | 4,717 | 4,965 | 5,200 | 5,428 | 5,665 | 6,802 | 7,912 | 10,029 |
| Savannah | 135,4224 | 135,983 | 136,514 | 137,049 | 137,550 | 138,109 | 140,634 | 143,002 | 144,625 |
| Thunderbolt | 2,244 | 2,244 | 2,247 | 2,247 | 2,250 | 2,249 | 2,254 | 2,260 | 2,266 |
| Tybee Island | 3,472 | 3,488 | 3,505 | 3,516 | 3,534 | 3,549 | 3,619 | 3,686 | 3,692 |
| Unincorporated | 75,541 | 76,557 | 77,555 | 78,521 | 79,482 | 80,442 | 85,202 | 89,752 | 93,908 |
| Vernoburg | 141 | 143 | 145 | 145 | 147 | 146 | 149 | 154 | 161 |
| Total | 243,237 | 245,605 | 247,929 | 250,199 | 252,437 | 254,726 | 265,793 | 276,373 | 288,006 |
Policy Defects
The existing policy frameworks in the area of land use and regulations and pollution mitigation have not done enough to remedy the situation. Regarding the policy implications of waste pollution, the concern is that policy makers on the federal side do not have a reliable long-term plan for preventing radioactive waste stored at the nuclear weapons plant near Aiken, South Carolina from contaminating the Savannah River. The waste dumping and poor management at the Savannah River Site, along with a failure to implement a sound cleanup plan raises the threats of surface water pollution on the site and the risks of ground water contamination in nearby areas. Because the Department of Energy (DOE) lacks a reliable inventory on contaminants stored on the site, critics argue that the DOE’s long-term plan to manage the waste remains flawed [
5].
Data Limitations and Technology
Other notable concerns pertaining to environmental health assessment in the area revolves around the limited access to technology and data infrastructure for the assessment of change. Under these limitations, the acquisition of geospatial technology and increased use of spatial and statistical information devices becomes a challenge for policy makers who are not acquainted with the fundamentals let alone grasp the operations of such tools. In the absence of access to such information, it becomes difficult to develop appropriate mitigation mechanism for understanding and responding to the threats posed by environmental change.
Economic and Growth Impacts /Pressures
Chatham County in the Savannah basin area is the most urbanized and populous counties along the 200-mile coastal zone stretching across Charleston, South Carolina and Jacksonville Florida. It stands as an economic hub and public sector center with global network for commerce around the five county bi-state regions with potentials for overstretching the carrying capacity of the environment. With an estimated annual growth rate of 2 % per year in the last 10 years for the region and the fact that the projected pace of growth for the area has been estimated to exceed the current levels. Supporting such a continued population growth in the region as shown in
Table 3.4 is bound to live indelible mark or footprint on the surrounding ecology of the basin. Such an accelerated growth geared at meeting the rising needs of commerce in the region does exert enormous strain on the areas’ environmental resources [
9].
Remedies and Efforts
Several efforts have been made to address the nature of environmental change ravaging the study area. This section of the paper focuses on the efforts made to remedy some of the environmental problems facing the study area over the years.
Regional Workshop on Climate Change
Series of workshops focusing on the effects of change on the regional environment and economy were organized in the region as part of the moves to remedy the problems. Part of the regional workshops includes the one on climate variability and water resource management in the South Eastern United states held at Vanderbilt University in Nashville, Tennessee. The workshop had the joint support of the National Aeronautics and Space Administration (NASA), National Oceanic and Atmospheric Administration (NOAA) and the US Geological Survey (USGS). The workshop examined high priority regional environmental issues such as the impact of climate variability on different sectors of the economy with some emphasis on water resources in some southeastern states including Georgia (NASA 2003). Elsewhere, the Southern region National Ecological Observatory Network (NEON) through its own workshop highlighted several priorities in the South East under six general environmental categories in order to establish the appropriate interdisciplinary research framework for analyzing the complex ecological and environmental issues confronting the South East [
1].
Natural Resources Management Program
To curb the menace of environmental change, the Georgia Department of natural resources and other state entities have been providing assistance to the counties and cities in a number of areas associated with natural resources management. For its own part, the Georgia Department of natural resources offered assistance in the areas of water conservation, environmental protection and wildlife preservation. For an example, when one of the cities submitted a proposal for two years in the month of October 2001 and 2002. The Georgia department of natural resources provided some assistance for projects involving the development and implementation of a natural resource management program that would assist with preserving natural resources within the city. Part of the effort centered on capacity building on sustainable land development activities through a public education program that encourages improved water quality and natural resource protection. Another effort also involves GIS assistance to local governments and agencies for meeting part V of the environmental standards in Georgia’s planning act. In a similar vein, the Chatham county and Savannah metropolitan planning commission requested participation from the public and ecosystem based strategy in order to help identify significant natural areas in need of protection [25, 26)
Landscape Assessment
The Scientists form the US Environmental Protection Agency (EPA) has been quite active in addressing land related problems linked to environmental change. In the EPA’s Region 4, Science and Ecosystem support division, sought help from the landscape ecology group of the US EPA national, office of Research and Development (ORD), National Exposure Research Laboratory, Environmental Sciences Division ESD. In the process, they undertook a landscape assessment of the Savannah River basin as an extension of a continuing Regional Environmental Monitoring and Assessment Program (REMAP) demonstration project. The scope of work provided through Region 4 drew heavily from scientific knowledge and change detection techniques in assessing present stream conditions in the Savannah River Basin with Landscape variables that may be fuelling the embers of change. The various indicators covered in the assessment includes land cover types and agriculture around nine USGS 8 digit hydrological unit codes [
23]
Monitoring
The state of Georgia assesses water quality through a threshold that categorizes the resource along use and quality standard for both surface and ground water. Under the system, the state’s waters are classified for several uses including fishing, recreation and drinking. Assessing the quality of water using such a comprehensive monitoring benchmark provides a framework for gauging if water bodies are within or below permissible standards. The monitoring consists of physical, chemical, and biological measurements. Under surface, water assessment, the program targets surface water and fish tissue for toxic substances and point source effluent discharges. The program also monitors for environmental conditions of major lakes and water quality compliance within facilities. The state’s ground water program consists of precise studies on ground water issues and the evaluation of ground water quality by sampling public drinking water wells and ground water on facilities under regulation. Because the law requires the state to put waters not meeting quality standards and those not supporting the designated use on the Federal Clean Water Act 305 b list. The gathering of water quality information through the monitoring program not only helps verify conformity with water quality standards, but it provides support on designated uses and identification of waters with impairments [
14].
Discussions
The paper has briefly identified the extent and nature of environmental change convulsing the South East portion of the United States during the last several decades along the surrounding ecology within the Savannah River basin of Georgia. The results not only reveal that Savannah river basin side of Georgia seems to be experiencing environmental change as a result of several decades of relentless pressure induced by anthropocentric activities and host of other socio-economic factors. The pace of ecological change showed some variations across time and space. Generally, the results point to a decline in water bodies, vegetation, and increase in population, loss of harvested cropland, farms and increasing threats to the environmental systems of the region.
Notwithstanding, the fact that some counties had more harvested cropland in the study area in absolute term than the others had in the different periods under analysis. There were significant changes in the regions’ environmental resources in the form of mixed gains and declines for cropland, number of farms, and land in farms available between the periods of 1992 through 2002. Because of the critical implications of changing numbers of farms, size of harvested cropland and land in crops to the ecological and natural resources profile of the study area under aegis of environmental change. It is safe to note that there were visible changes in the environmental resources of the area most notably, amount of harvested cropland, number of farms and land in farms from 1992 to 2002. The changes in harvested cropland within the counties showed some gains were made in 75 percent of the areas while 25 percent of the areas posted losses from 1992 to 1997. Other evidence of change involving the number of farms from 1997 to 2002 indicates the counties were even with eight out of sixteen counties experiencing gains from 1997 to 2002 while the other eight posted losses. Severe losses occurred in the three major agricultural counties of Jefferson, Jenkins, and Screven known for farming. Among the large farm counties, Jenkins accounted for the largest decline
Regarding the other indicators of change, of great concern from the results is the pace at which toxics are being discharged in the atmosphere and the number of toxic release facilities scattered along the study area as shown in
Table 2.4. Accordingly, there seem to be a major concentration of toxic pollutants in the study area with much of that rampant in five counties. In 2004 fiscal year alone, 85% of the pollutants originated from two counties of Richmond and Chatham. The breakdown shows Richmond releasing 52.8% of the pollutants and the other 33.2 % from Chatham, at the same time both counties accounted for 60% of facilities releasing toxic pollutants and 86% of hazardous waste facilities in 2006 in the study area.
The continuous loss in environmental resources from harvested cropland areas to land in farms reflects the prevailing practices in the area devoid of best management practices and good stewardship of the environment. The loss of vegetation, land cover and other resources amounts to loss of income and future access to these resources. The use of chemicals and pesticides in farming activities in the area threaten the quality of the environment. With the widespread emission of pollutants and the presence of hazardous waste sites, the areas fragile coastal ecosystem not only remains vulnerable to lethal impacts of air borne pollutions and particulate emissions, but the quality of the natural environment is also at risk. From a hydro-geological standpoint, the presence of hazardous waste facilities constitutes a major threat to an area already coping with high levels of ground water pollution due to saltwater intrusion. The trend remains further compounded by the growing demographic changes taking place in the form of population change in the area and the proliferation of economic and growth factors. All these problems have links with policy defects and current gaps in technology access. Failure to design the appropriate response mechanisms to tackle the problems may quicken the erosion of an already overburdened ecological threshold of the study area.
The result not only points to rising environmental change and variability, but it shows that in spite of the methodological gaps embedded in change assessment. The adoption of geospatial information technologies can be quite useful for decision-makers in assessing the extent of human induced environmental change in the Georgia side of the Southeast. This is important as the authorities in the Savannah basin area and the State of Georgia embark on remedies for correcting the threats of environmental change convulsing the area. Under this setting, the practical use of a mix scale approach involving the application of geo-spatial technologies of GIS and remote sensing in gauging the extent of environmental variability in the study area embodies an update to the literature on ecological change of Savannah River Basin. Considering the meager efforts to address the growing incidence of change along the basin, geospatial technology has viable importance in mapping the contours of environmental variability ravaging the South East and the study area. The effort here constitutes an effective framework for managing fragile coastal areas of the south east through geospatial information systems.
Recommendation and Conclusion
To address some of the problems of environmental change identified in the paper six recommendations are hereby presented.
Environmental Inventory
Better compilation of data is indispensable for managing changes along coastal ecosystems such as the Savannah River basin and for improved understanding of the carrying capacities of the environment. Environmental inventory are needed so that managers can better understand the scale of impacts and formulate the appropriate mitigation measures. For better use, the data should be merged with socio-economic and climate variables in order to improve our understanding and ability to communicate the potential impacts. While the approach relies on bio- geographical data, it must stress the linkages between environmental change and anthropocentric factors.
New Technology
In areas of land cover, land use and agricultural land, a need exists to develop new technological capabilities such as change predictions using remotely sensed data and ecological modeling from a multidisciplinary approach. This should include researchers, government agencies, farmers and others in the private sector. As part of approach, there is also a need to explore the transfer and communication of relevant information on environmental change over a full spectrum of temporal and spatial scales to users through pilot programs.
Federal Policy
The South East region where the study area is located has been projected as the fastest growing in the country with unprecedented environmental uncertainties , yet natural resources managers in the area are not fully equipped with the right policy infrastructure for coping with the problems. In these circumstances, public managers are not well prepared to deal with extreme climatic events nor do they have enough information needed to mitigate most environmental changes that accumulated over the decades. Accordingly, there is a need to develop a federal policy guided with the right instruments to enable resources managers implement environmental change mitigation programs in order to minimize pressure on all ready fragile ecological systems.
Education
Since the part towards the remedies to change encountered in the study area transcends education, there are opportunities for the educational community to contribute to the environmental change research agenda. To prepare teachers and students for environmental change implementation strategies, the academic community should make provisions towards the application of scientific tools in preparedness of coastal communities for environmental uncertainties. From an educational perspective, the most important segment is to promote the objective adoption and expansion of existing topics stressing environmental change in a way that can benefit those in environmental planning and data interpretation.
Conclusions
This paper has presented geospatial information assessment of environmental change along the Savannah River basin in the southeast state of Georgia. The paper offered a brief synopsis of issues in the literature fuelling the growing incidence of ecological change in the area. This was followed by a profile of the study area and the description of the methods for analyzing the data sets on environmental change, factors, and the mitigations efforts using remote sensing and GIS based approach. Notwithstanding the gravity of the trends in the region and the growing data gaps, the area is becoming highly vulnerable to environmental uncertainties. Using geospatial information technologies in quickening impact detection provides countless opportunities in the development of effective response mechanisms capable of minimizing the emerging environmental impacts in the planning process in the area. The results not only reveal that Savannah river basin side of Georgia seems to be experiencing environmental change as a result of several decades of relentless pressure induced by anthropocentric activities and host of other socio-economic factors. The pace of ecological change showed some variations across time and space. Generally, the results shows a decline in vegetation cover as the index analysis revealed; as well as an increase in human settlement and population, loss of harvested cropland and number of farms with gross implications on ecosystem quality in the region.
Notwithstanding, the methodological gaps embedded in change assessment, the adoption of geospatial information technologies can be quite useful for decision- makers in assessing the extent of human induced environmental change in the Georgia side of the Southeast. This is important as the authorities in the Savannah basin area and the State of Georgia embark on remedies for addressing the problem. Regarding the other indicators of change, the key concern from the results stems from the pace at which toxic pollutants were being released into the region’s atmosphere. Accordingly, there seem to be a major concentration of toxic pollutants in the study area with much of it quite rampant in five counties. The growing number of these toxic release facilities in the study area is not only threatening, but they are fatal enough to damage the natural environment. The continuous loss in environmental resources from harvested cropland areas to land in farms reflects practices heavily skewed towards limited best management practices, unsustainable land use and poor stewardship of the environment.
The implication of such environmental trend is that the decrease in land cover and other resources amount to loss of income and denial of future access to these resources to communities in the study area. The intensity of farming activities based on nutrient applications also threatens the quality of the environment. With the widespread emission of pollutants and the presence of hazardous waste sites in the region, the area’s fragile coastal ecosystem not only remains vulnerable to lethal impacts of air borne pollutions and particulate emissions, but the quality of the natural environment remains vulnerable. To deal with these problems six recommendations ranging from the design of environmental inventory to policy were presented as remedies. Finally, it is evident that the adoption of geospatial information technologies can be quite useful for decision-makers in assessing the extent of human induced environmental change in the Georgia side of the Southeast. The result not only points to environmental decline, but it shows that in spite of the methodological gaps embedded in change assessment, geospatial information systems remain indispensable tools for change analysis.


