Article

Characterization of Pollen Dispersion in the Neighborhood of Tokyo, Japan in the Spring of 2005 and 2006

by
Yoshinaga Ishibashi
1,
Hideki Ohno
1,
Shuji Oh-ishi
2,
Takeshi Matsuoka
2,
Takako Kizaki
1 and
Kunio Yoshizumi
3,*
1
Department of Molecular Predictive Medicine and Sport Science, Kyorin University, School of Medicine, 6-20-2 Shinkawa, Mitaka, Tokyo 181-8611, Japan
2
Fifth Department of Internal Medicine, Tokyo Medical University Kasumigaura Hospital, 3-20-1 Chuou, Ami, Inashiki, Ibarki, 300-0395, Japan
3
Faculty of Human Ecology, Kyoritsu Women’s University, 2-2-1 Hitotsubashi, Chiyoda-ku, Tokyo 101-8433, Japan
*
Author to whom correspondence should be addressed.
Int. J. Environ. Res. Public Health 2008, 5(1), 76-85; https://doi.org/10.3390/ijerph5020076
Submission received: 18 January 2008 / Accepted: 21 March 2008 / Published: 30 March 2008

Abstract

:
The behavior of Japanese cedar (Cryptomeria japonica) and Japanese cypress (Chamaecyparis obtusa) pollens in an urban area was examined through the measurements of the dispersion characteristics at the various sampling locations in both outdoor and indoor environments. Airborne pollens were counted continuously for three months during the Japanese cedar pollen and Japanese cypress seasons in 2005 and 2006 by the use of Durham’s pollen trap method in and around Tokyo, Japan. The dispersion of pollens at the rooftop of Kyoritsu Women’s University was observed to be at extremely high levels in 2005 compared with previously reported results during the past two decades. As for Japanese cedar pollen, the maximum level was observed as 440 counts cm-2 day-1 on 18 March 2005. Japanese cypress pollen dispersed in that area in the latter period was compared with the Japanese cedar pollen dispersions. The maximum dispersion level was observed to be 351 counts cm-2 day-1 on 7 April 2005. Total accumulated dispersions of Japanese cedar and Japanese cypress pollens were 5,552 and 1,552 counts cm-2 for the three months (Feb., Mar. and Apr.) in 2005, respectively. However, the dispersion of both pollens in 2006 was very low. The total accumulated dispersions of Japanese cedar and Japanese cypress pollens were 421 and 98 counts cm-2 for three months (Feb., Mar. and Apr.) in 2006, respectively. Moreover, the pollen deposition on a walking person in an urban area showed that the pollen counts on feet were observed to be extremely high compared with the ones on the shoulder, back and legs. These findings suggested that pollen fell on the surface of the paved road at first, rebounded to the ambient air and was deposited on the residents again. Furthermore, the regional distribution of the total pollen dispersion in the South Kanto area was characterized on 15-16 March 2005 and on 14-15 March 2006. Although the pollen levels in 2005 were much higher than in 2006, it was commonly observed that higher pollen counts existed in the outlying areas. That is, the pollen counts in an urban area were confirmed to be at a lower level. As for the indoor dispersion of pollens, two cases were evaluated. At the lobby of the main building of Kyoritsu Women’s University, the averaged ratio of the indoor to the outdoor pollen count is 4.1%. Another case was at the hospital building of a medical school. The pollen dispersion in the indoor environment was also observed to be low. It was concluded that the indoor pollen would be mainly carried from the outer environment by the movement of air.

Introduction

Trees and grasses belong to the most important allergen sources, both because of their worldwide distribution and because of their heavy pollen production. The importance of plant pollen as a potent allergen source has been recognized for the past about one hundred years through the examination of the relationship between pollen exposure and allergic symptoms [1, 2]. Most of the important plant pollen allergens have been produced as recombinant allergens for diagnostic and therapeutic purposes. Allergic reactions in easily accessible organs (skin, nose, eyes) are caused by direct contact with intact pollen grains and the subsequent elution of soluble allergens [3,4,5,6,7].
Japanese cedar (Cryptomeria japonica) pollinosis is the most common form of hay fever in Japan in the early spring and has remarkably increased since the 1970s [8, 9]. Epidemiological studies on the pollinosis have been done in Japan so for [10,11,12,13,14,15,16,17]. These symptoms, which occur seasonally each year, are typical features of allergic rhinitis, such as sneezing, excessive nasal secretion, nasal congestion and conjunctival itching. Two major allergens in Japanese cedar pollen were isolated and identified as Cry j 1 and Cry j 2 [18,19,20]. Most of the patients with Cryptomeria japonica pollinosis have both high IgE titers and T-cell reactivity against Cry j 1 and Cry j 2, indicating that both allergens are important as disease associated allergens [21,22,23,24,25,26,27,28,29,30,31]. In addition, Japanese cypress (Chamaecyparis obtusa) pollen is also responsible for respiratory allergies seen in the spring in Japan. A major allergen was reported from Japanese cypress pollen as Cha o 1 [32,33,34].
The number of patients with symptoms of allergen sensitization of pollens has recently increased year by year in Japan. It is suggested, according to previous studies [35,36,37,38,39,40,41,42,43], that environmental pollution factors such as particulate matter, especially diesel smoke, and NOx are associated with the development of the disease. Cedar pollinosis is thought to be produced by genetic interaction, exposure to plant pollens and other environmental factors. Attention should be paid bioaerosols including pollen and fungus spores in their relationship with the effect of ambient particulate matter on human morbidity and mortality [6, 44].
Airborne pollens were widely monitored and evaluated previously in many countries [45,46,47,48,49,50,51,52]. However, comprehensive reports on pollen behaviors covering both indoor and outdoor environments during a heavy dispersion season have not been so well documented.
The main objective of this research is to clarify the behavior of pollen dispersion in and around an urban area by the measurement of the dispersion characteristics at the various sampled locations both in outdoor and indoor environments. It will be shown that these data contribute to the understanding of the risk factor associated with pollen with potentially significant health consequences on our living circumstances. In this study, to better understand atmospheric pollen transport, airborne pollen was counted continuously for three months (Feb., Mar. and Apr.) during Japanese cedar and Japanese cypress pollination seasons in 2005 and 2006, using the Durham pollen trap [54] in and around Tokyo, Japan.

Materials and Methods

Pollen Collection and Counting

Pollens which were suspended in ambient air in both outdoor and indoor environments were collected by the use of Durham’s method [54]. A vaseline-coated glass slide was set at an appropriate horizontal position to detect fallen pollen and prevent its rebounding by its sticky surface. The trapped pollen was dyed by methyl violet dissolved in gelatin-glycerin solution. A cover glass of 1.8 cm by 1.8 cm was set on it and the number of dyed pollen was counted in that area by an optical microscope. The measurement was presented as the number of pollen per square centimeters on the slide.
Durham’s method is one of the passive sampling methodologies which have the specific advantages of low cost, ease of handling, no noise emission and no need of a power supply. This device can be installed at many sites at indoor/outdoor facilities, by which simultaneous measurement would be feasible.

Sampling Sites

Figure 1 shows the location of pollen sampling sites selected in this study. The continuous behavior of pollen in an outdoor environment was monitored on a 24 hour basis at the rooftop of the 15-storey main building of Kyoritsu Women’s University which is about 40 meters high from the ground level and located in the central part of Tokyo metropolitan area in Japan. A vaseline-coated glass slide was set under a round shelter with a diameter of 23 cm to prevent the influence of direct ambient air movement and rainwater. The measurement was done in two durations, February to April 2005, and 2006, because pollen would then be prevailing in Japan.
Area wide measurements in the outdoor environment were also on a 24 hour basis with the help of volunteers on 15-16 March 2005 and 14-15 March 2006 in the South Kanto area which is located in and around Tokyo, Japan. In those cases, a vaseline-coated glass slide was set at an appropriate site outside of each volunteer’s house without the round shelter.
Moreover, the pollen behavior along the roadside was evaluated. A woman equipped with the vaseline-coated glass slides on her body walked on the road for two hours in daytime and the trapped pollen there was counted in the way as previously mentioned above. The experiments were done at an area around Kyoritsu Women’s University on 7 and 8 April 2005.
As for the indoor environment, two cases were evaluated. The indoor dispersion of pollens was continuously monitored at the lobby of the main building of Kyoritsu Women’s University for one month in March 2005. The pollen measurement was also conducted in a hospital building in Kasumigaura of Ibaraki Prefecture, Japan. The vaseline-coated glass slides were placed in many sites in the hospital without a shelter. The two terms in 11-13 April, 2005 on a 48 hour basis and in 13-14 April 2005 on a 24 hour basis were examined.

Results and Discussion

Characteristics of Pollen Dispersion in the Urban Outdoor Environment

Figure 2 shows photo images of Japanese cedar (Cryptomeria japonica) pollen and Japanese cypress (Chamaecyparis obtusa) pollen by an optical microscope. The morphological features of Japanese cedar are as follows: Round shape, diameter of about 30 µm, big papilla of pollen cell, and inner component located near the papilla. On the other hand, in the case of Japanese cypress, they are as follows: Round shape, diameter of 20- 30 µm, very small (sometimes invisible) papilla, and inner component existing at the center part like a star shape. Then it is possible to distinguish them from other pollens and suspended particulate matters.
Figure 3 shows the pollen dispersion characteristics of Japanese cedar and Japanese cypress measured on the rooftop of the main building of Kyoritsu Women’s University in 2005. The location is one of the typical urban areas in Tokyo, Japan. Moreover, the sampling site was enough high from the ground level to avoid disturbance in the sampling from the neighboring buildings. It was reported that the difference of pollen counts between ground level and the rooftop was very small [16]. Therefore, our data could be considered as an index of the pollen count inhaled by residents.
The data is shown on the basis of pollen counts per one square cm per 24 hours according to Durham’s method [54]. The Burkard sampler was often used in previous research works [1, 4, 6, 39] because the data can be obtained in pollen counts per air volume although it requires a power source and higher cost. It was confirmed that there was a significant correlation between the Durham’s and Burkard samplers in the other study [16].
The measurement was started in 1 February in 2005. The first detection of cedar pollen was conducted on 3 February as 0.9 counts cm-2 day-1. Then the levels were as low as less than about 10-25 counts cm-2 day-1 continued until early in March. However, the number of 54 counts cm-2 day-1 was suddenly observed on 7 March. The high level of more than 50 counts cm-2 day-1 had continued since then until 10 April with some exceptionally low level days, which is top severe warning level of 4 ranks for pollen risk designated by Bureau of Welfare and Health Care of the Tokyo Metropolitan Government. The maximum level was observed as 440 counts cm-2 day-1 on 18 March 2005.
The year of 2005 was concluded to be exceptional for the pollen dispersion with extremely high levels compared with the monitoring results in the past two decades conducted by Bureau of Welfare and Health Care of the Tokyo Metropolitan Government [55].
However, Japanese cypress pollen dispersed in the area in the latter period compared with Japanese cedar. The first depression was observed on 15 March 2005 as a level of 0.6 counts cm-2 day-1. The heavy pollen dispersion more than 10 began on 1 April, 2005. The maximum dispersion level in this season was observed to be 351 counts cm-2 day-1 on 7 April 2005. In addition, the dispersion of Japanese cypress showed a cyclic pattern that was at a high for 4-5 days and at a low for 3-4 days in the dispersion. This feature is different from the one in Japanese cedar dispersion. The warning level of Japanese cypress pollen risk was not proposed by the Bureau of Welfare and Health Care, Tokyo Metropolitan Government. Total accumulated dispersions of Japanese cedar and Japanese cypress pollens were 5,552 and 1,552 counts cm-2 for three months (Feb., Mar. and Apr.) in 2005, respectively.
Clinical studies have shown that many patients with pollinosis in Japan have specific IgE antibodies not only to Cryptomeria japonica but also to Chamaecyparis obtuse. Sensitization to the two pollens may occur independently or alternately. On the other hand, a cross reactivity may exist between the two so that sensitization to one would confer sensitization to the other. Many clinicians think that the latter situation may be the case and the findings regarding competitive inhibition between Cryptomeria japonica and Chamaecyparis obtusa support this view [32].
The characterizations mentioned above are thought to be basically important as predictive information. If a reliable prediction system is supplied, we will be able to prevent exposure and symptoms, such as with temporary life style changes or medication.
Figure 4 shows the dispersion characteristics of Japanese cedar and Japanese cypress measured on the rooftop of the main building of Kyoritsu Women’s University in 2006, similarly to Figure 2. In Figure 3, the scale of pollen count is shown to be reduced by a factor of 1/10. It is easily noticeable that the dispersion of both pollens in 2006 was very low compared with the ones in 2005. However, the starting date as for Japanese cedar was observed to have been even earlier, beginning from 2 February 2006. The feature of Japanese cedar dispersion in 2006 can be summarized to be lower in count and longer in duration compared with the one in 2005. The dispersion lasted for almost two months in 2006 although only for about one month in 2005.
Japanese cypress showed the following behavioral characteristics: The reduction of pollen dispersion numbers is more distinguishable to a greater extent compared with Japanese cedar. The duration of pollination was extended longer although the maximum level has also been reduced greatly at 11 counts cm-2 day-1.
Total accumulated dispersions of Japanese cedar and Japanese cypress pollens were 421 and 98 counts cm-2 for three months (Feb., Mar. and Apr.) in 2006, respectively. In conclusion, pollen levels were lowered by a factor of 1/13.2 for Japanese cedar and by a factor of 1/15.8 for Japanese cypress when comparing 2005 and 2006.
The plant situation has changed according to the social and economic situation. Japanese cedar is distributed all over Japan except in Hokkaido, the northern part of the Japan archipelago, and Okinawa, in the Ryukyus, south of Japan’s main islands. After World War II, during which many trees in Japan were greatly destroyed, the Japanese Government encouraged the planting of Japanese cedar on all the barren mountains in Japan to use the timber for building houses and for preventing flooding due to the overflow of rivers. Therefore, forests of Japanese cedar have been spread widely in Japan. As for Japanese cypress, the general situation is similar. However, as its planting requires more severe conditions, the number of planted Japanese cypress trees has been relatively limited in Japan.
Plant flowering has changed depending on the plants’ growth stage. Now these trees have aged well to produce a large amount of pollens. However, the demand for these trees as timber has greatly decreased because the prices of imported lumbers are lower than the ones in Japanese domestic production. As a result, they have not been cut down on a commercial basis and they continue to greatly disperse their pollens every spring.
In addition, another factor may also be important. The degree of the increase of pollens is thought to be influenced by the mass of the flower sprouts produced which is related to the summer temperature of the previous year. The temperatures in 2004 and 2005 were relatively high and low, respectively. High pollen concentrations are associated with those factors. These conditions of aged trees and meteorological factors discussed above are concluded to have caused the heavy pollen dispersion in 2005.

Pollen Deposition while Walking on a Roadside

Table 1 shows the pollen deposition by walking along sidewalks in a central urban area for two hours. The measurements were made by the attachment of sticky slide glasses on the human body parts of the shoulder, back, legs and feet. Regarding the one on the shoulder, this device was attached horizontally. Slide glasses on other points were attached vertically to a standing volunteer. The trials were made on 7 April 2005 under severe pollen dispersion and 8 April 2005 under moderate pollen dispersion.
It was shown that the pollen count on the shoulder was higher than the ones on the back and legs probably due to its horizontal position. However, the pollen counts on the feet were observed to be extremely high by a factor of about 4.1 compared with the averaged ones on the back and legs in a severe pollen dispersion condition. On 8 April 2005, similar results were observed although the levels of pollen counts were reduced due to the measurement of moderate pollen dispersion. The data on the feet was also very high by a factor of about 5.0.
These findings suggested that the pollen which fell on the surface of the paved road would rebound to the ambient air by wind movement. That is, there is some possibility that the road would be a secondary pollen source. The pollen will deposit on the residents not only by falling from the upper ambient air but also by bounding off from the paved road. Re-dispersion would be influenced by weather conditions such as humidity and wind speed. It will occur more greatly on a dry day.
It is concluded that the frequent sweeping of roads may reduce the burden of pollen dispersion in urban areas.

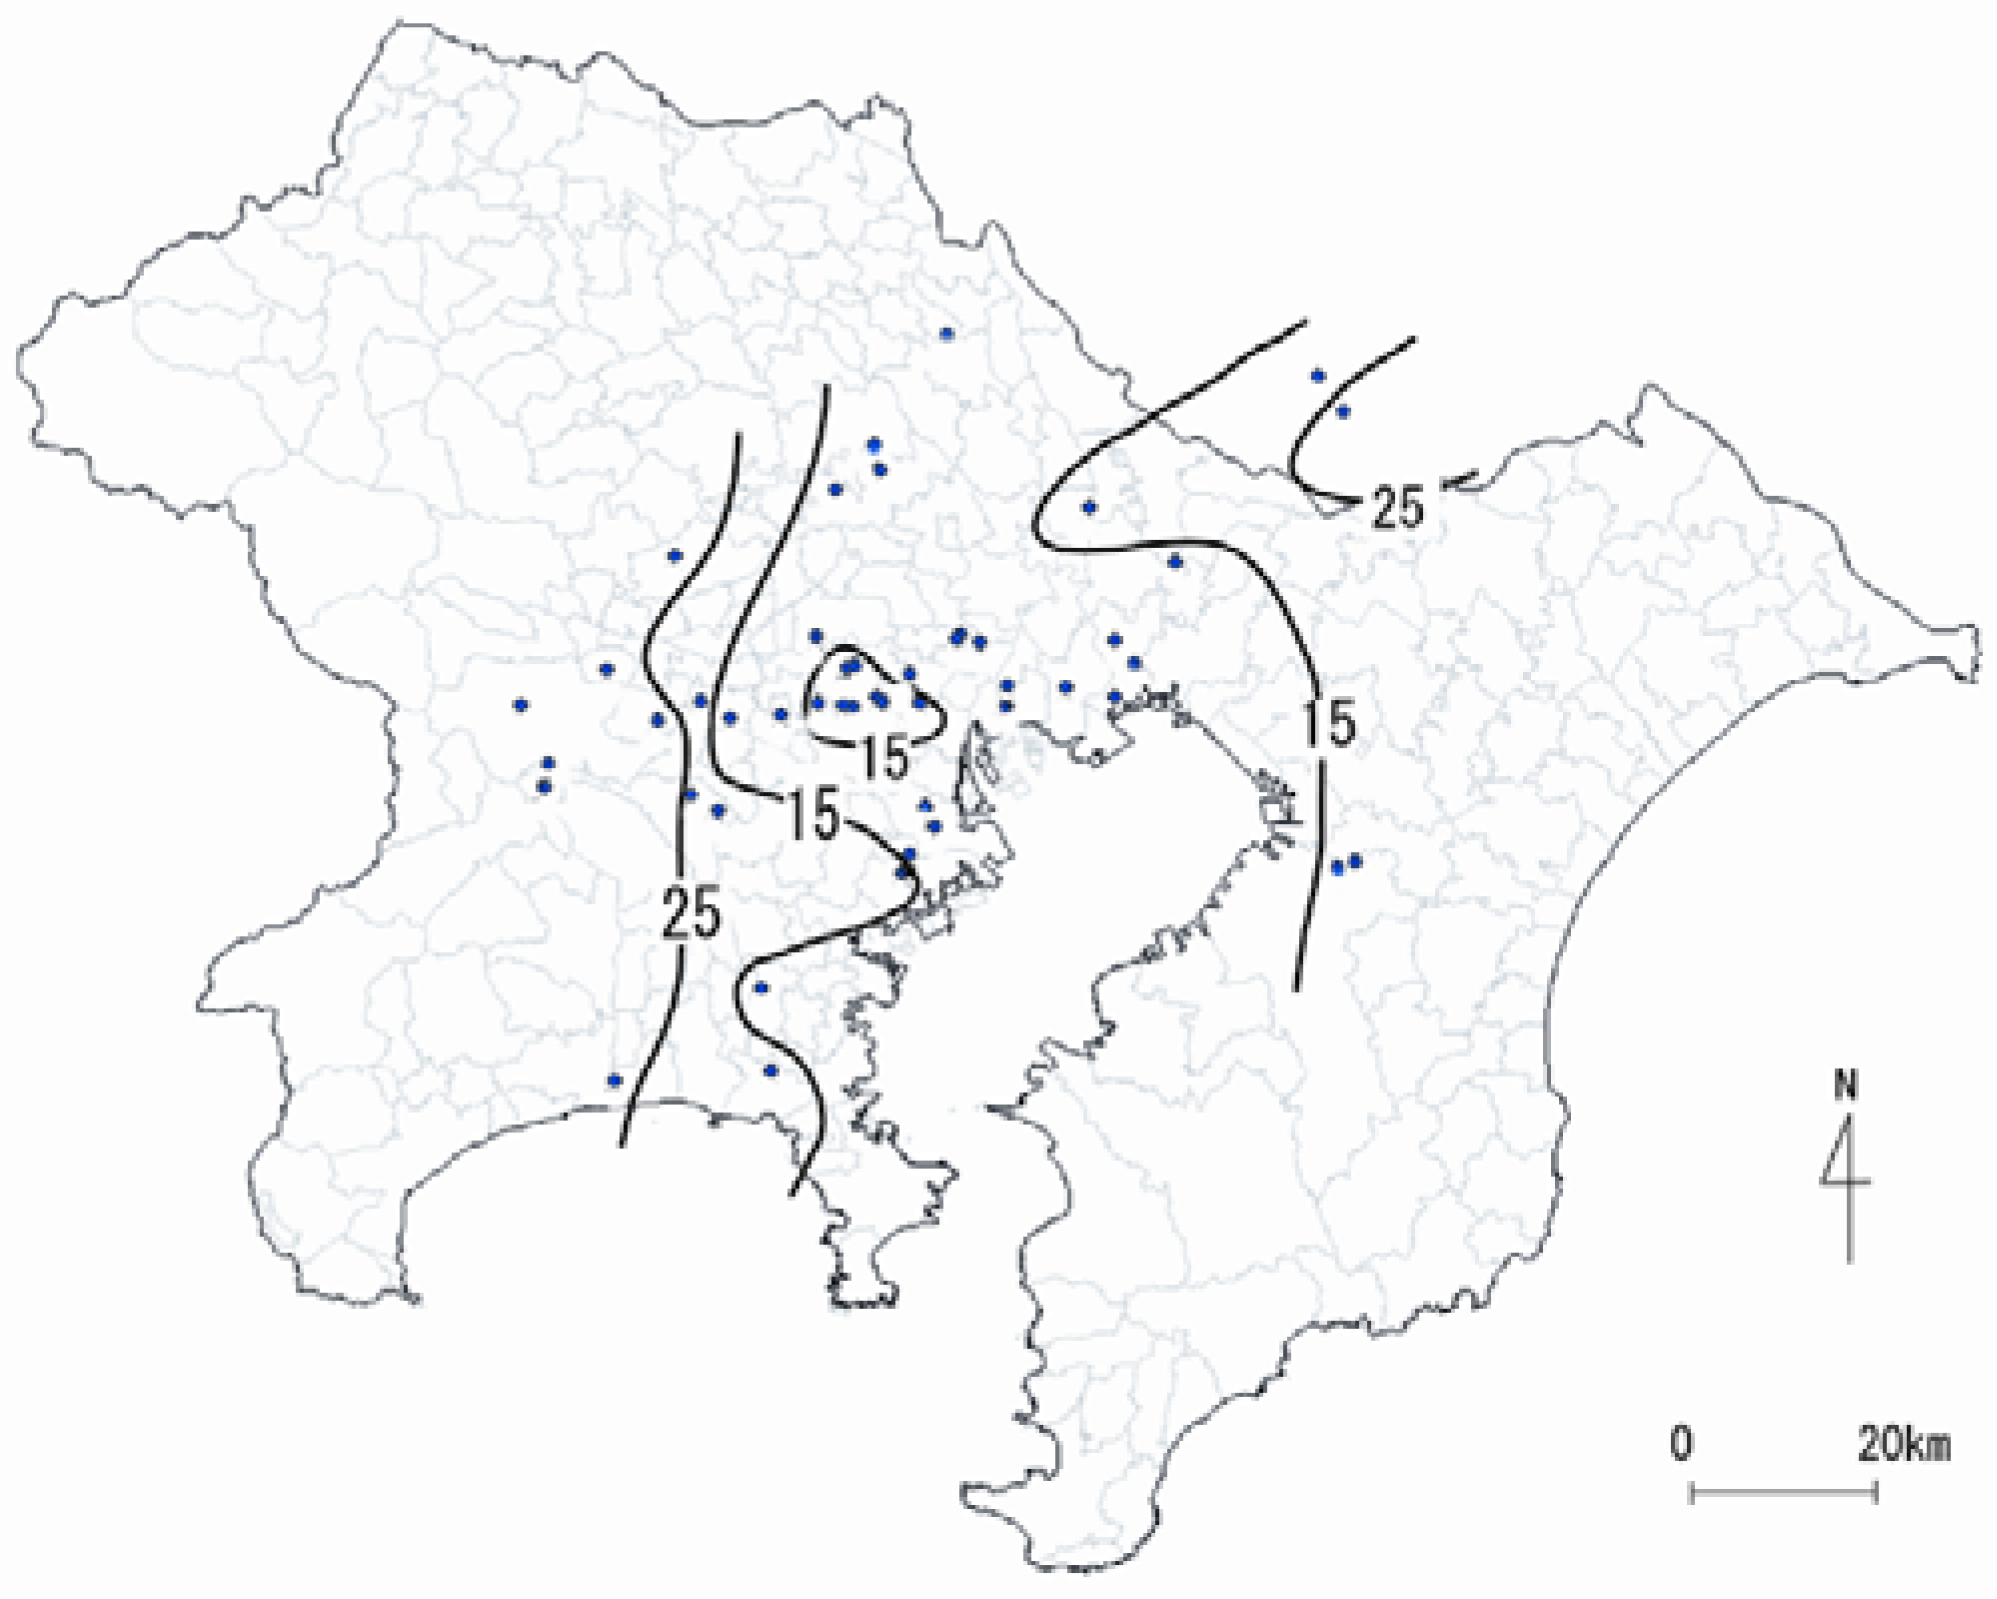
Regional Wide Dispersion of Pollens

Figure 5 shows a regional distribution of the total pollen dispersion in the South Kanto area, at the central part in which Tokyo is located. The measurement was made at 32 sampling sites for 24 hours on 15-16 April 2005. Pollen counts are shown in counts cm-2 day-1. Business offices and congested urban traffic areas are concentrated in the central part of the South Kanto area. In the outer part of this area, some suburban and rural areas are located where the natural environment is still kept and not a small number of trees are planted.
The contour lines of 200 and 300 pollen counts cm-2 day-1 are shown in Figure 5. It is understandable that higher pollen counts were observed in outer areas, that is, in suburban and rural areas. Although the air pollution level is high in the central area owing to air pollutant emission sources being concentrated there, the pollen counts are lower in the central area. To the contrary, higher pollen counts were observed in suburban and rural areas. These results suggested that pollen sources are located much more in the outer parts of the South Kanto area.
Figure 6 shows a similar regional distribution of total pollen dispersion on the basis of the measurement of 78 sampling sites in the South Kanto area on 14-15 April 2006. Two contour lines of 15 and 25 pollen counts cm-2 day-1 are drawn in the figure. Apparently the pollen dispersion in 2006 was very low compared with 2005. Experimental dates in the month are almost the same as in 2005 and 2006, but the counts are reduced by a factor of 1/10. However, the characteristic that the pollen counts are higher in the outer areas than the ones in the central area was commonly observed.
According to the two trails, it can be concluded that pollen dispersion is higher in suburban and rural areas than in the urban area in Tokyo. Although pollen counts are low in an urban area, residents there have suffered from heavy pollinosis. It is suggested according to previous studies [35,36,37,38,39,40,41,42,43] that ambient pollutants such as primary and secondary particulate matters, especially diesel smoke, photochemical ozone, hydrocarbons and NOx are associated with development of the disease although heredity and genetic interaction have been shown to play an important role in allergic sensitization. Therefore, the control of air pollutant emissions is considered to be essential to the reduction of pollinosis patients.

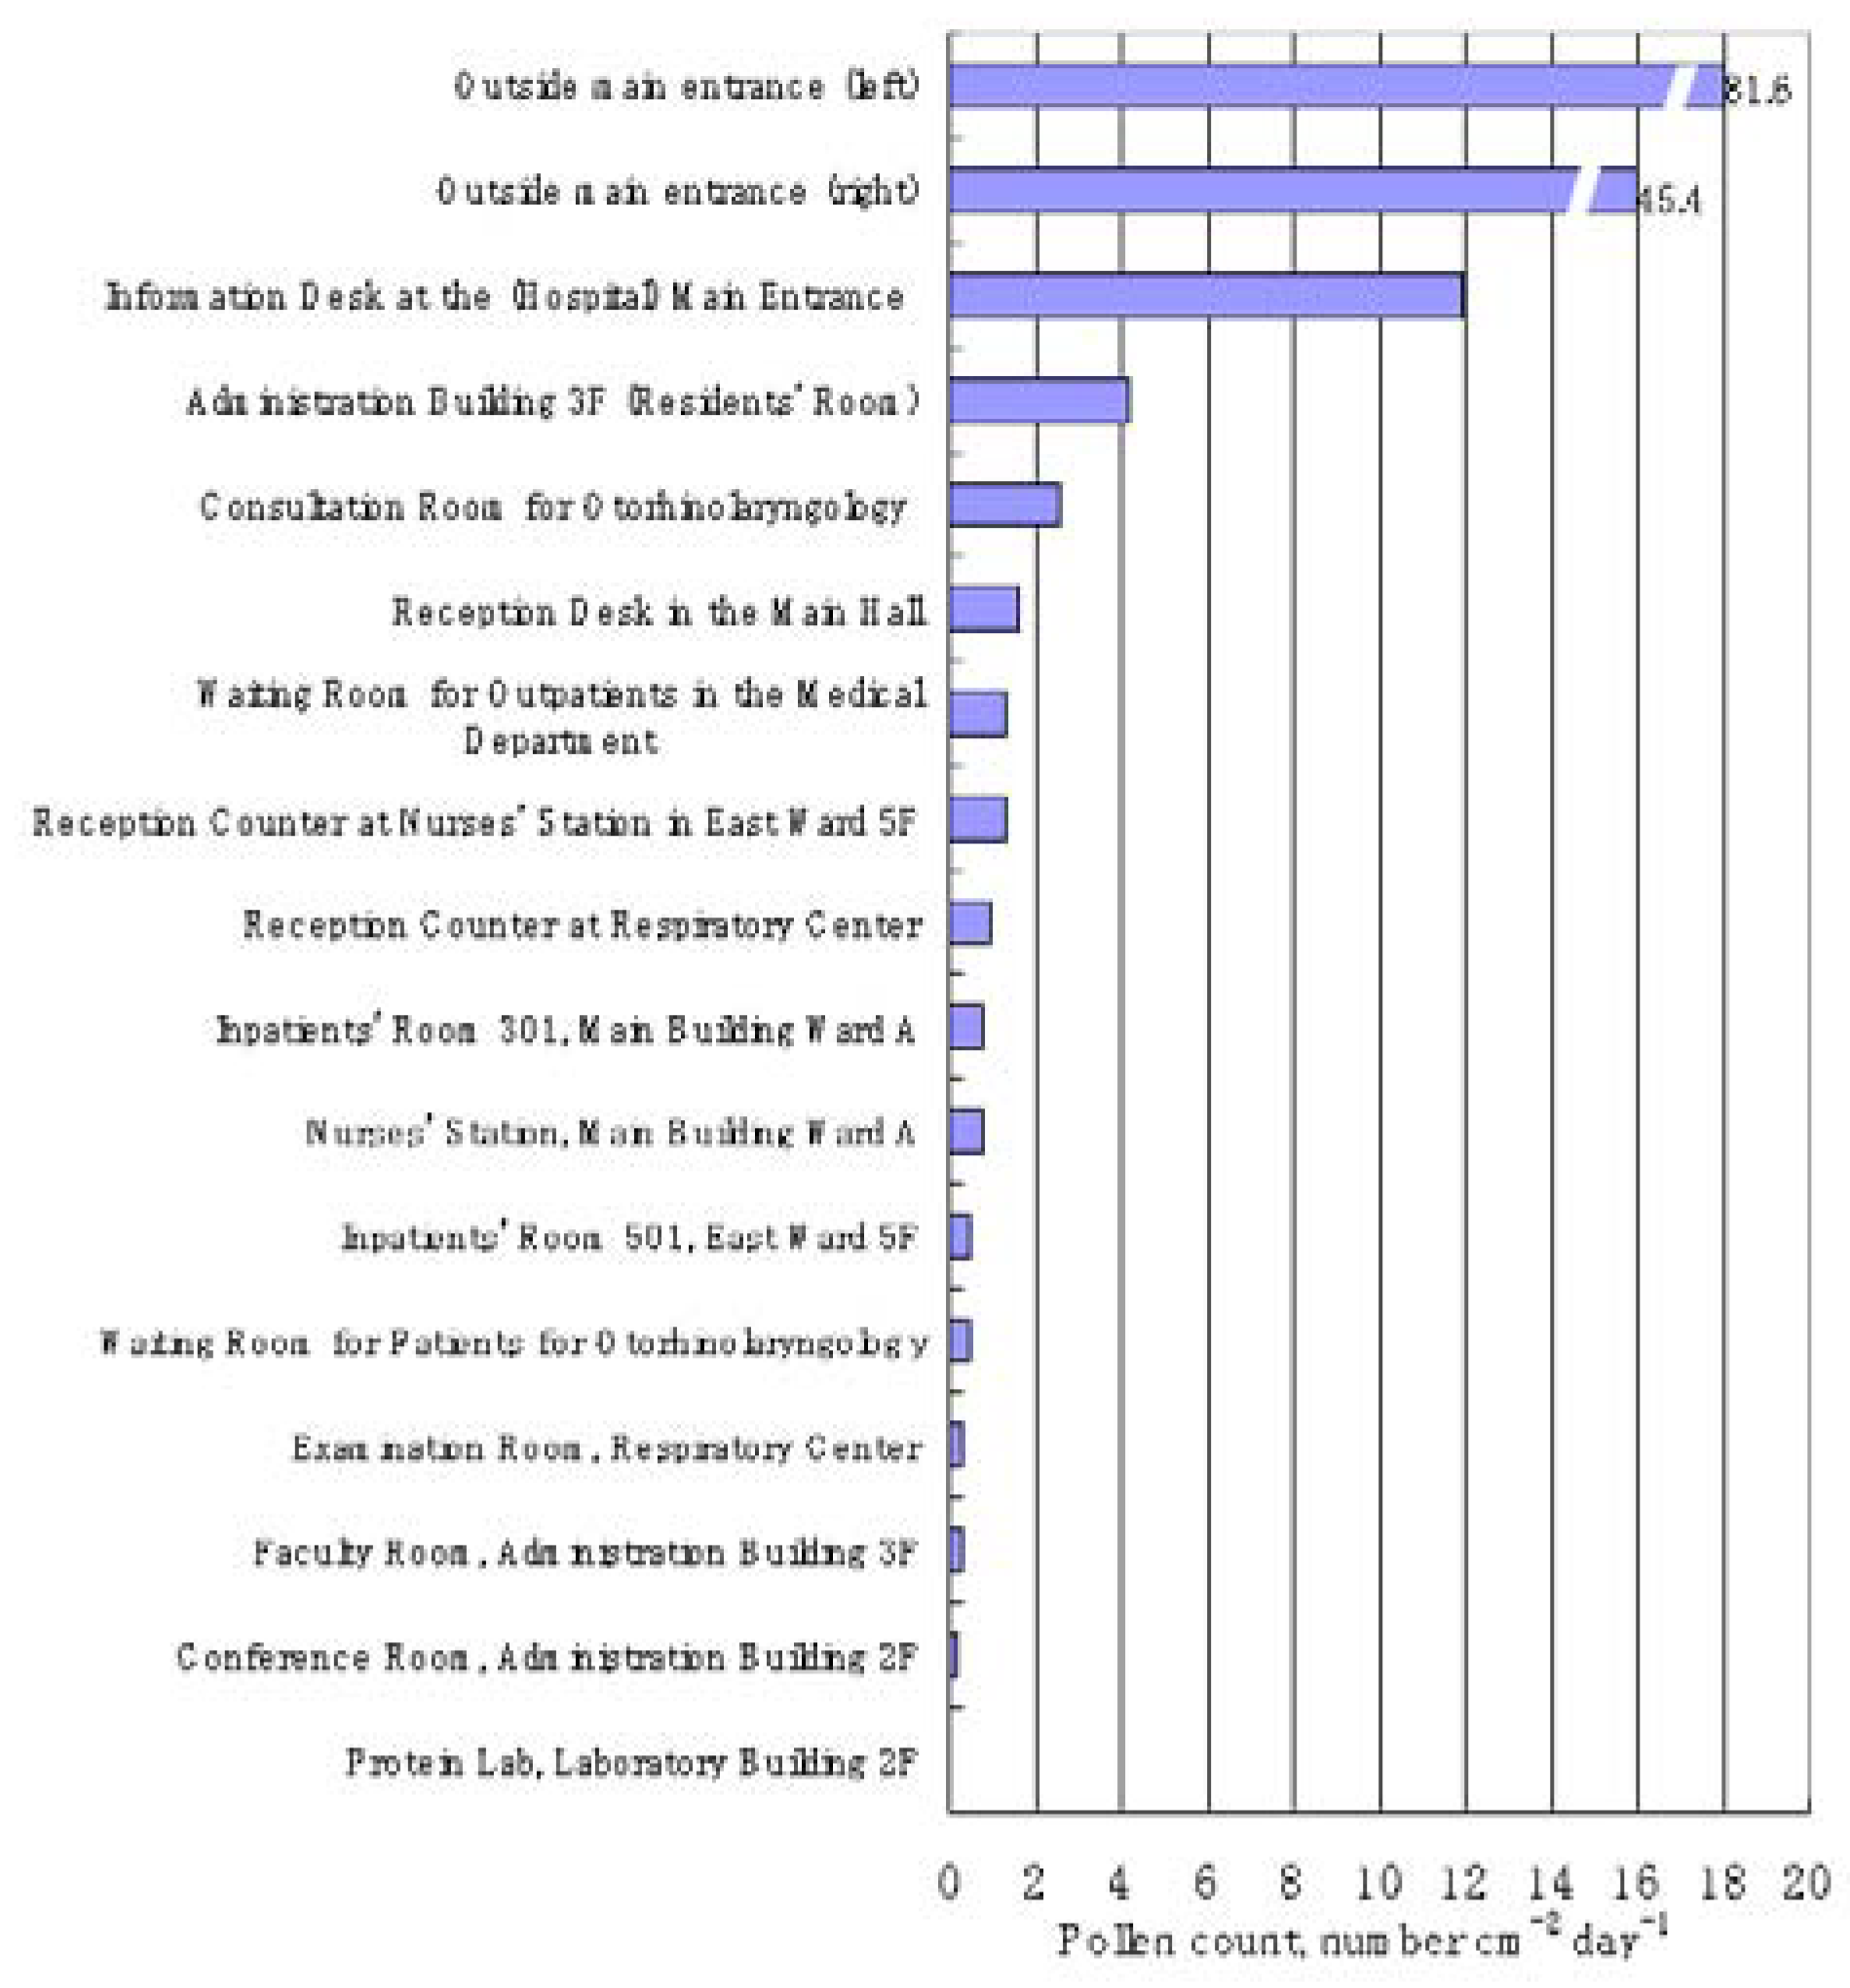
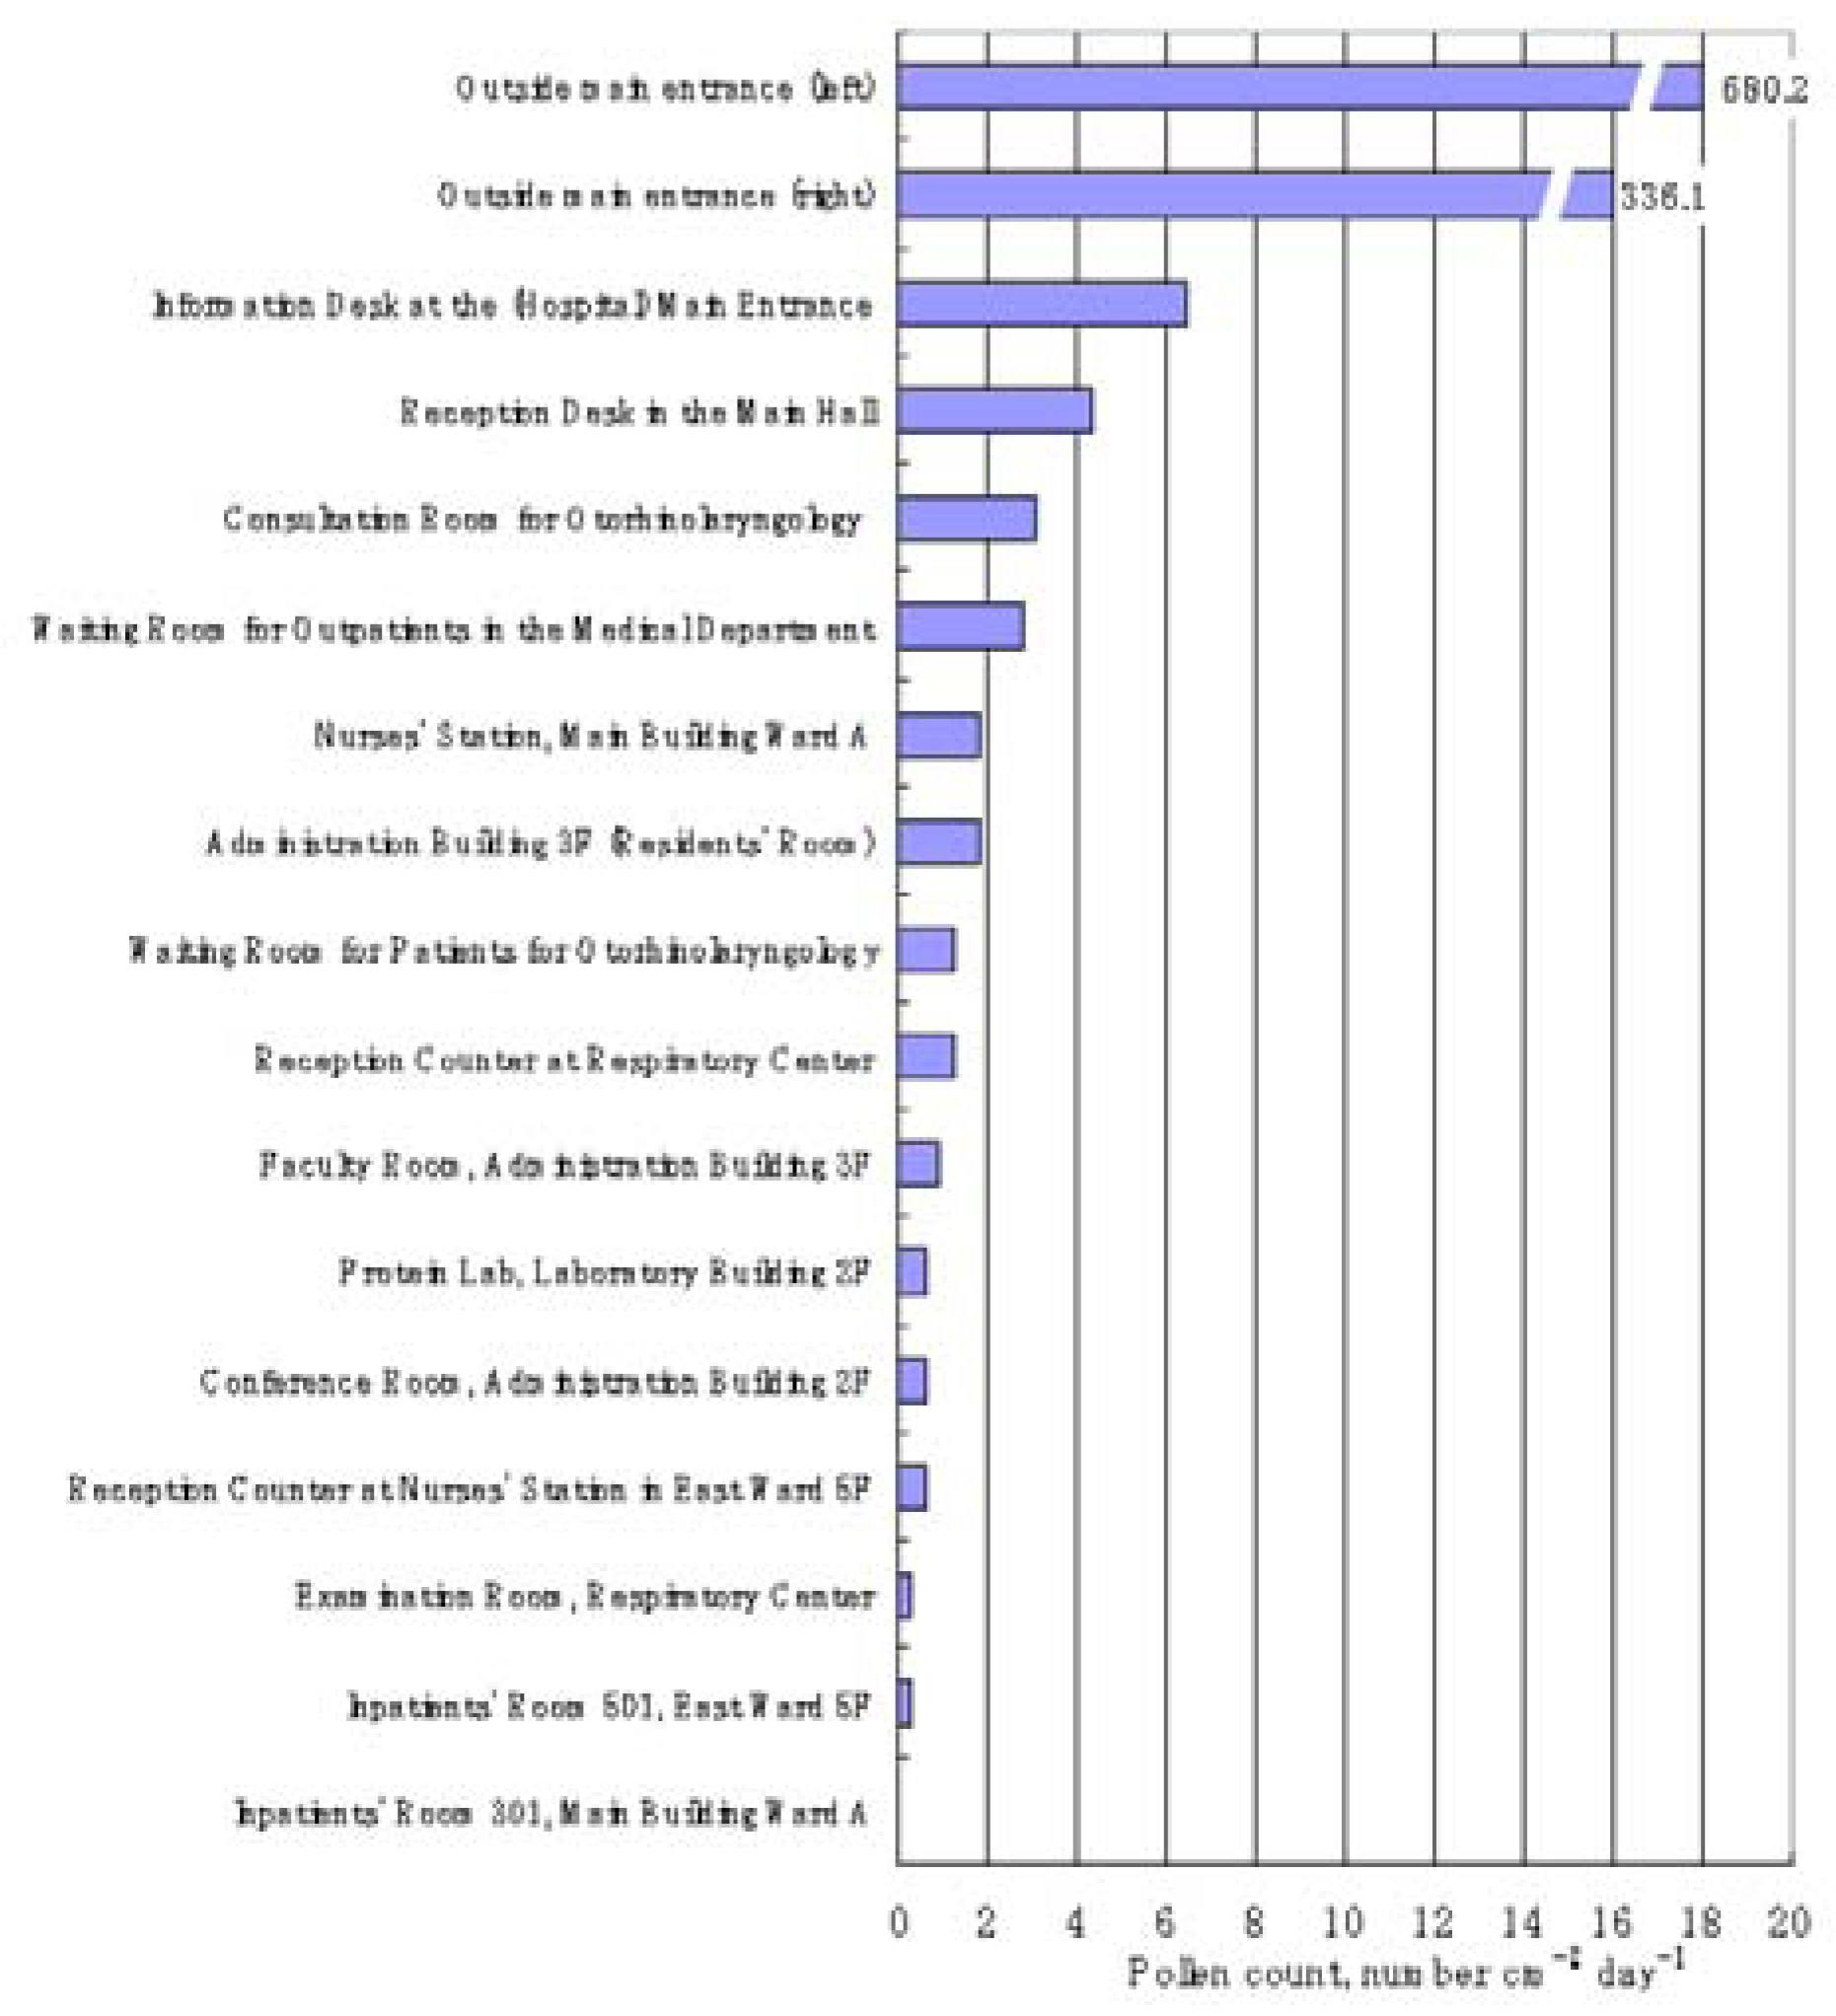
Indoor Dispersion of Pollens

It is an actual fact that the majority of pollen exposure probably occurs outdoors, but the amount of time spent indoors nowadays makes even low-level indoor exposures important for our health risk.
Figure 7 shows the influence of outdoor pollen dispersion on the indoor environment at the lobby of the main building of Kyoritsu Women’s University. The measurements were conducted during March 2005. The ratios of daily indoor pollen counts to outdoor pollen counts which were measured on the rooftop of the building were classified by every 2%. The histogram of appearance frequencies was compiled as frequency percentage through the month. The ratios ranged between 0.3% and 14%. The most frequent range is between 4.1% and 6.0% with an appearance frequency of 13% to the total daily data. The averaged ratio of the indoor to the outdoor is 4.1%. In addition, the pollen counts in a flourishing office located at 9th floor of the same building were observed to be at a very low level such as 0.0 to 3.8 counts cm-2 day-1 with an average of 0.3 counts cm-2 day-1. These numbers are much smaller than our expectation in advance. For instance, in previous papers, it was observed in France that approximately 60% of the taxa found in the environment close to the house were also present inside the house. In that case, ragweed pollen was the most prevalent taxon [49]. Moreover, geometric means of the paired indoor to outdoor ratios of mobile homes were reported to 56% and 52% in Houston and El Paso, respectively [47].
In our research, although the sampling site in a lobby is crowded by many students milling about, the entrance is equipped with automated double shutting doors. The low level of pollen counts under these conditions suggests that indoor pollen will be mainly carried from the outer environment by the air movement, not by re-suspending of pollens being attached to students’ clothing.
Figure 8 shows the characteristics of indoor pollen dispersion in a hospital building of a medical school. Such a building is suitable for the examination of pollen dispersion in the indoor environment because it is organized as a whole with busy medical treatment parts and relatively quiet research facility parts.
Pollen dispersion counts on sites at the entrance were observed to be about 82 and 45 counts cm-2 day-1. It was on a rainy day. The count at the information desk inside a hospital was reduced to the 12 pollen counts cm-2 day-1 of the maximum indoor count because it is located near the entrance which was very frequently opened by crowded visitors. The counts at the other sites gradually decreased although three sites of the administration building 3F, the consultation room for in otorhinolaryngology and the reception desk in the main hall are relatively high because the movement of air would be accelerated due to patients’ and hospital staffers’ frequently going and coming around those sites. Moreover, it is remarkable that pollen dispersion was observed almost everywhere, such as even at the examination room and the conference room which is located far from the entrance and is not so crowded. That is, pollen will enter even to the deeper sites through the slight movement of air although the pollen level is low.
Figure 8. Characteristics of indoor total pollen dispersion in a hospital building in Kasumigaura, Ibaraki Prefecture under a rainy weather condition on 11-13 April 2005.
Ijerph 05 00076 g008
Figure 9 shows similar results on a fine weather day. The pollen dispersions at the outside sites of the entrance were greatly raised to the levels of 680 and 336 counts cm2 day-1 because it was measured in a fine weather. Characteristics of the indoor dispersion were mostly similar to the ones shown in Figure 8, although the levels were raised to some extent due to the influence of higher outside pollen dispersion.
In conclusion, indoor pollen dispersion can be controlled under the condition of keeping windows closed and entry air filtered. We still have the problem about the importance of pollen accumulating inside a building. There is some possibility that pollen allergens do accumulate in house dust and remain beyond the pollen season [1]. In addition, the re-suspension of settled pollens on the floor is also necessary to be considered in some cases [56]. It is concluded that the indoor air quality related to pollen dispersion should be periodically monitored to ensure the reduction of pollinosis.

Conclusion

This research is aiming at grasping the behavior of pollen dispersion in and around an urban area through the measurements of the dispersion characteristics at the various sampling locations in the outdoor and the indoor environments. Especially, Japanese cedar (Cryptomeria japonica) and Japanese cypress (Chamaecyparis obtusa) were focused due to causing heavy pollinosis in Japan in spring and they have remarkably increased in the years since the 1970s. It is known that major allergens are Cry j 1 and Cry j 2 for Japanese cedar and Cha o 1 for Japanese cypress, respectively.
Airborne pollens were counted continuously for three months (Feb., Mar. and Apr.) of the Japanese cedar pollen and Japanese cypress seasons in 2005 and 2006 by the use of the Durham’s pollen trap method in and around Tokyo Japan. As a result, the following findings were obtained:
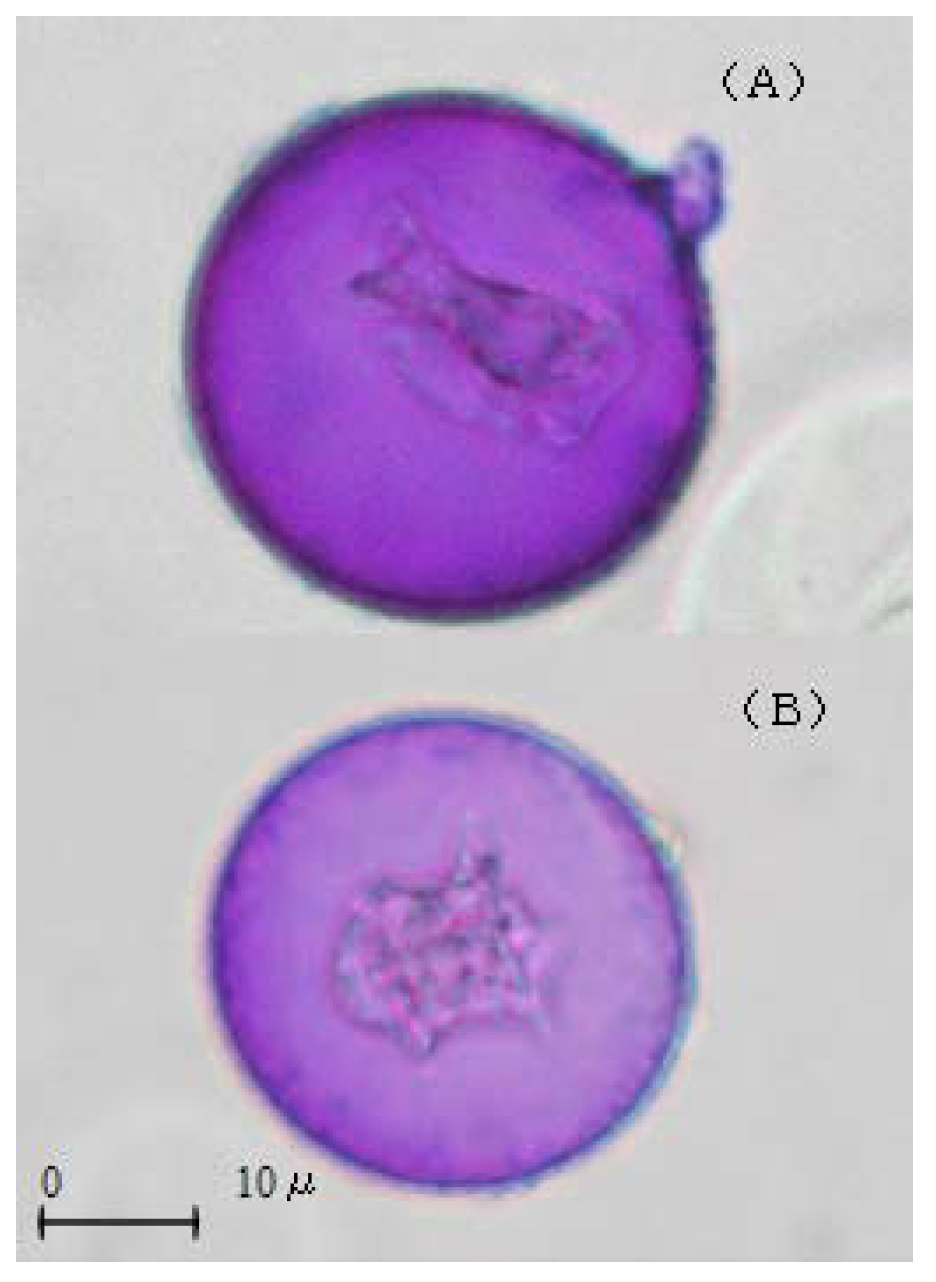
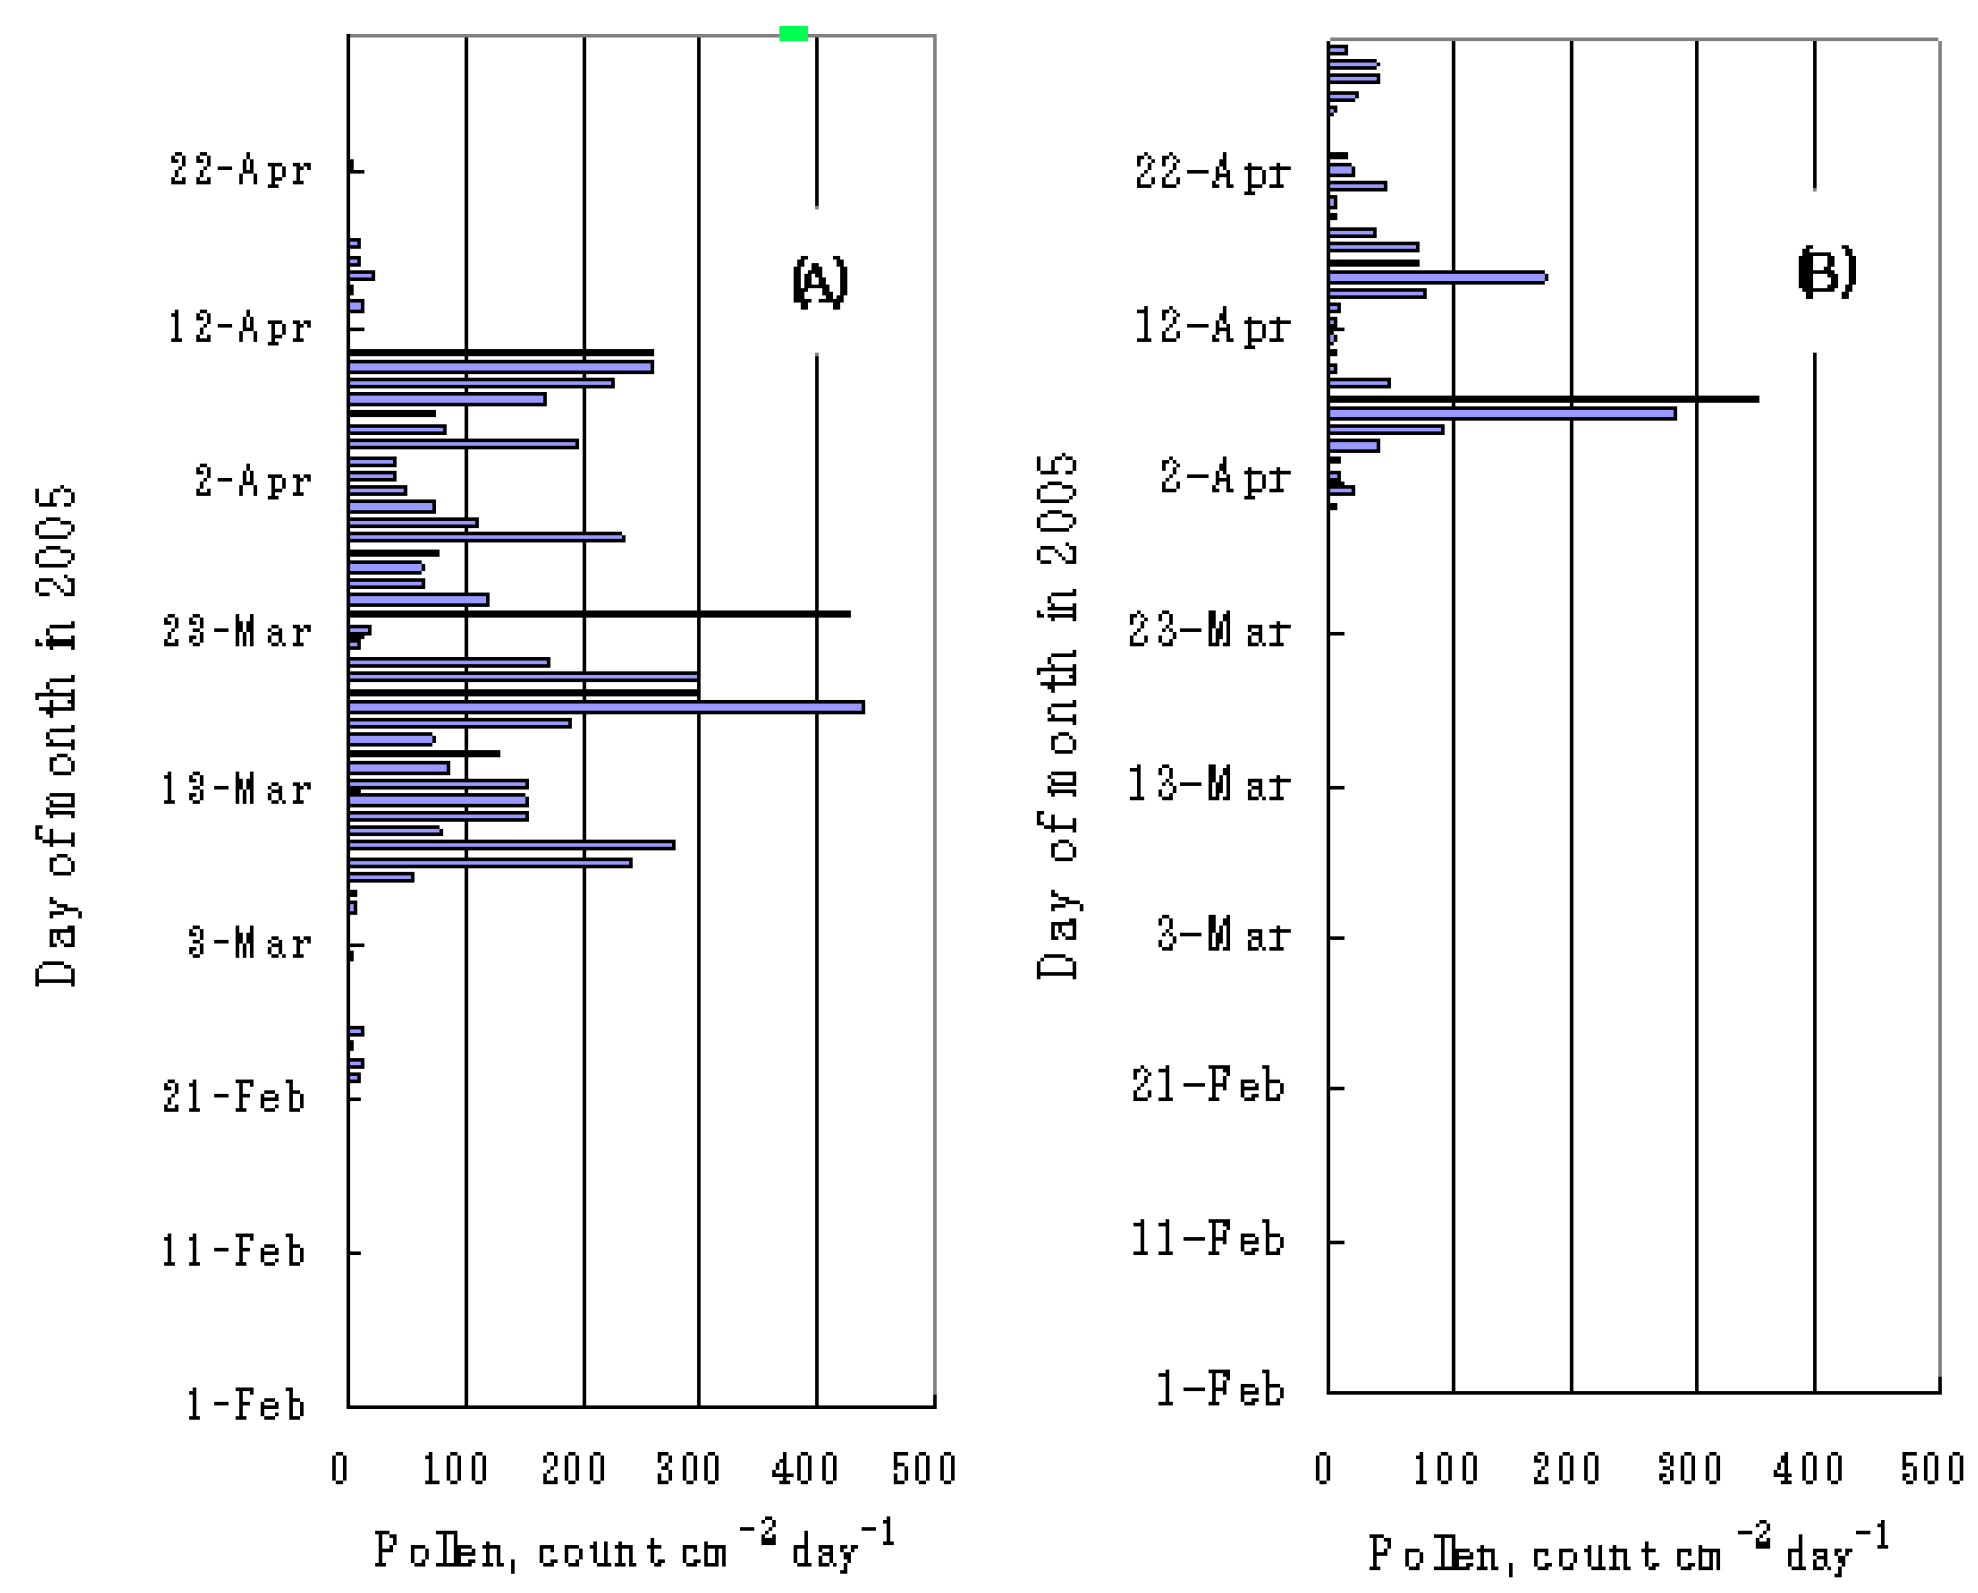
  • The pollen dispersions were observed to be at extremely high levels in 2005 compared with the ones in the past two decades. As for Japanese cedar pollen, the high level of more than 50 counts cm-2 day-1, top severe warning level out of 4 ranks for pollen risk, had continued since 3 February until 10 April with some exceptional low level days. The maximum level was observed as 440 counts cm-2 day-1 on 18 March 2005. Japanese cypress dispersed pollen in the area in the latter period was observed compared with Japanese cedar dispersed pollen. The maximum dispersion level in this season was observed to be 351 counts cm-2 day-1. Total accumulated dispersions of Japanese cedar and Japanese cypress pollens were 5,552 and 1,552 counts cm-2 for the three months (Feb., Mar. and Apr.) in 2005, respectively.
On the other hand, the dispersion of both pollens in 2006 was very low. Total accumulated dispersions of Japanese cedar and Japanese cypress pollens were 421 and 98 counts cm-2 for three months (Feb., Mar. and Apr.) in 2006, respectively. Pollen levels were lowered by a factor of 1/13.2 for Japanese cedar and by a factor of 1/15.8 for Japanese cypress when comparing 2005 and 2006.
The conditions of aged trees and meteorological factors are concluded to have caused the above results in measurements.
2.
The pollen deposition on a walking person in an urban area showed that the pollen counts on the feet were observed to be extremely high compared with the ones on the shoulder, back and legs. These findings suggested that pollen fell on the surface of the paved road at first, rebounded to the ambient air and was deposited on the residents again. It is concluded that the road would be a secondary pollen source.
3.
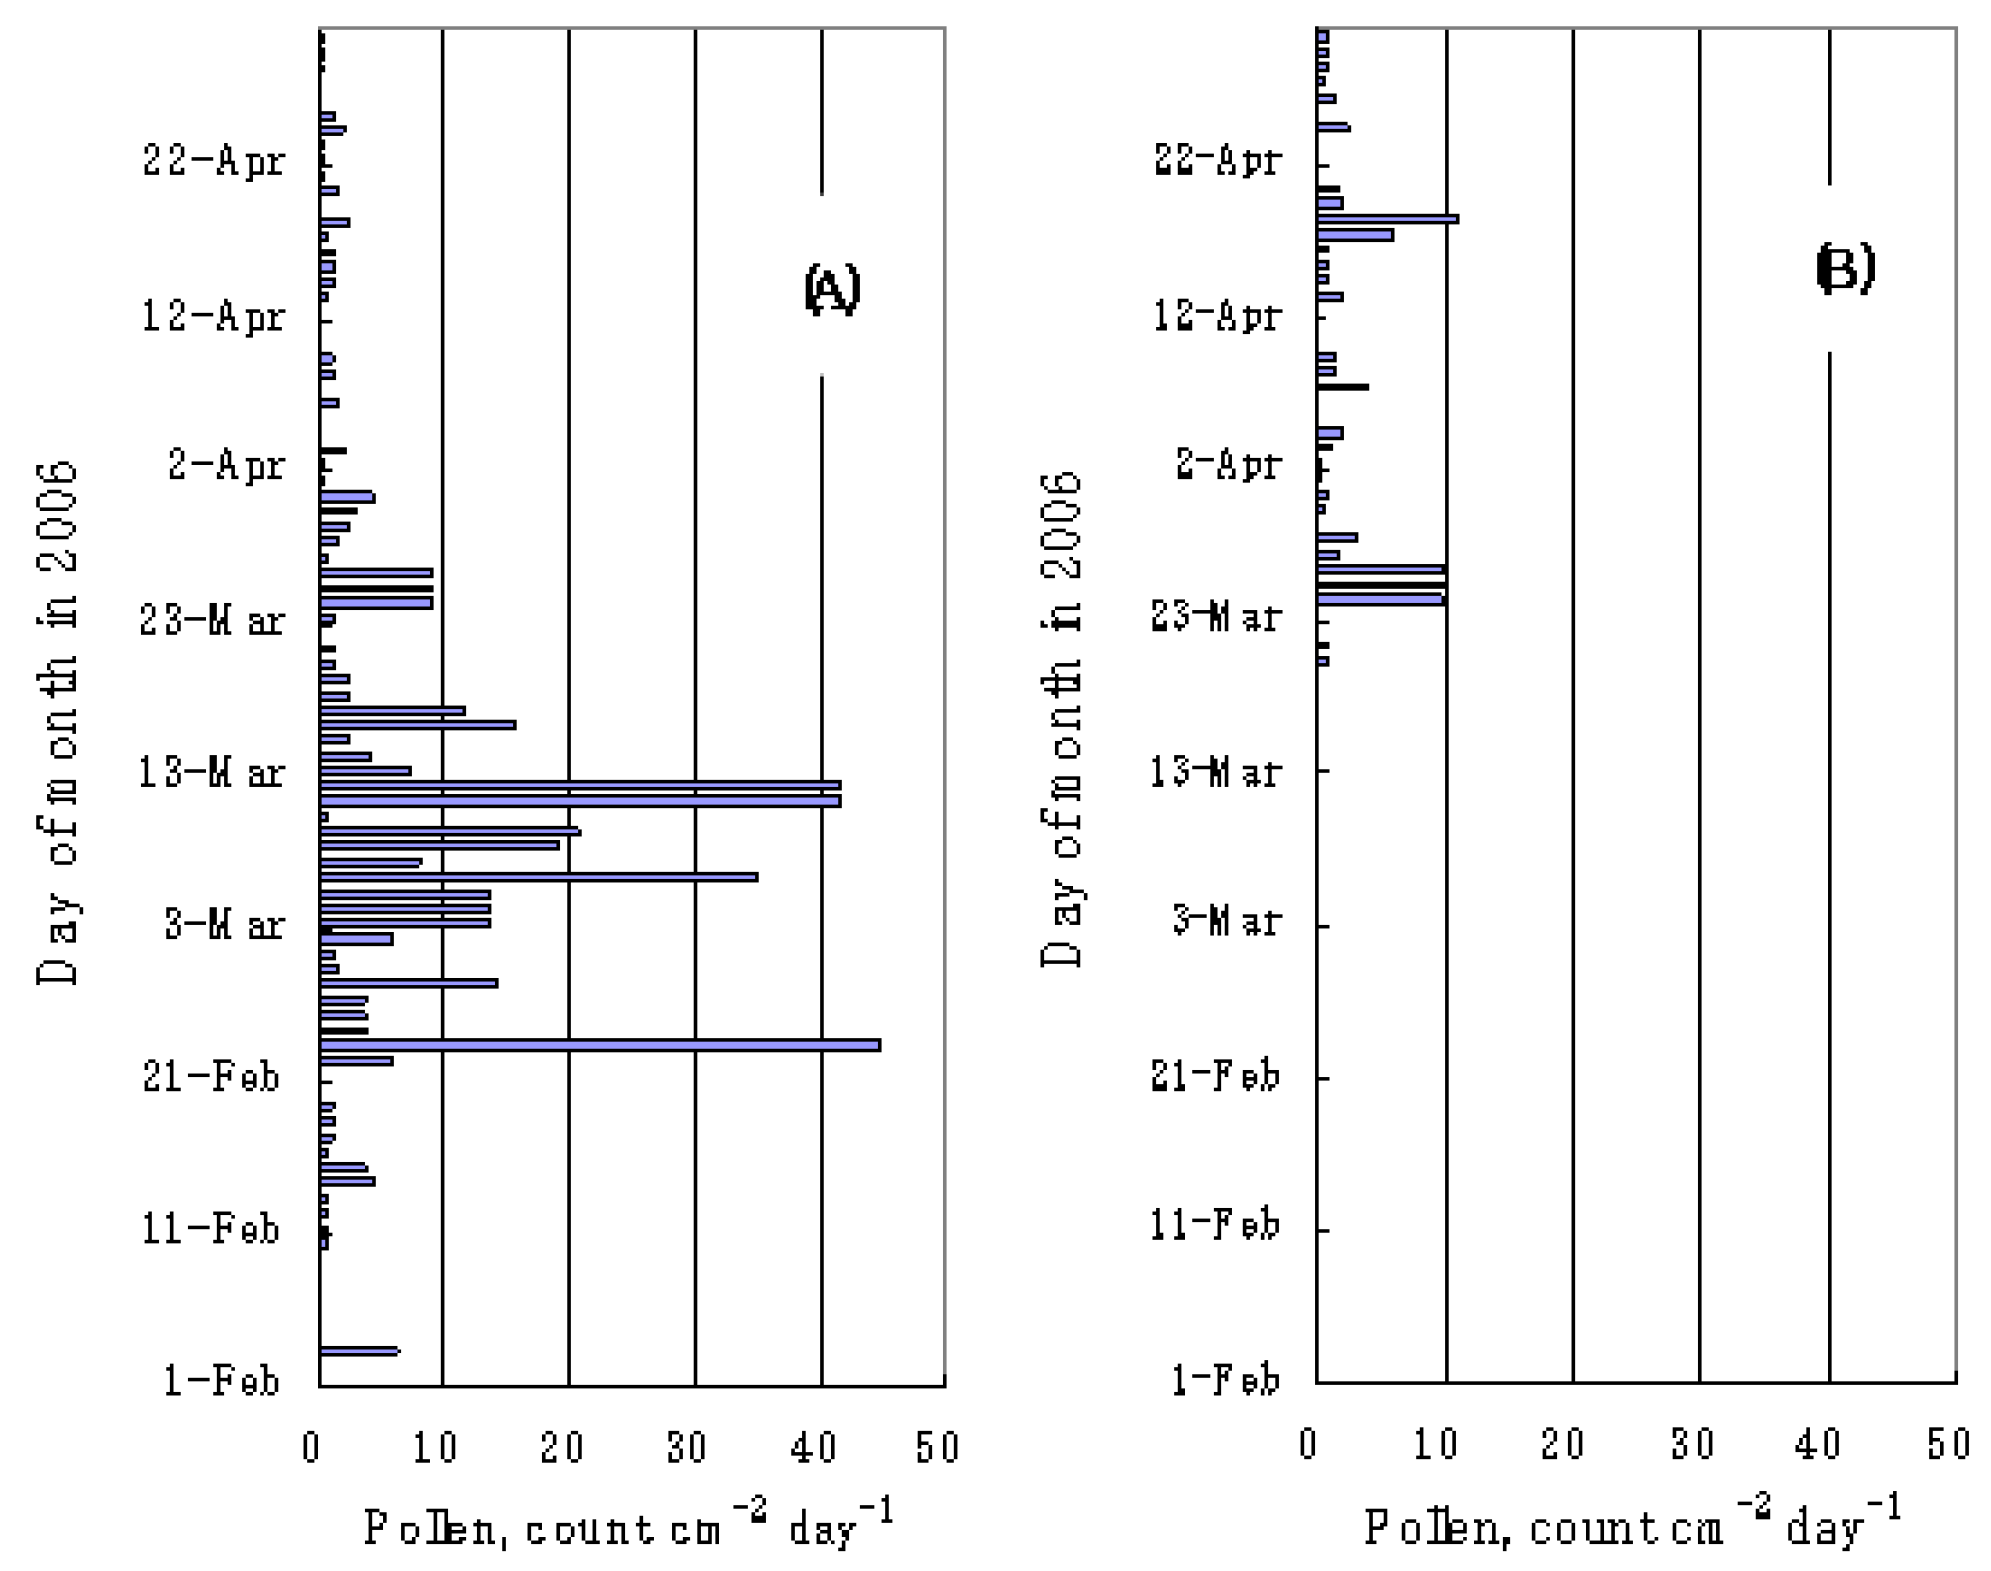
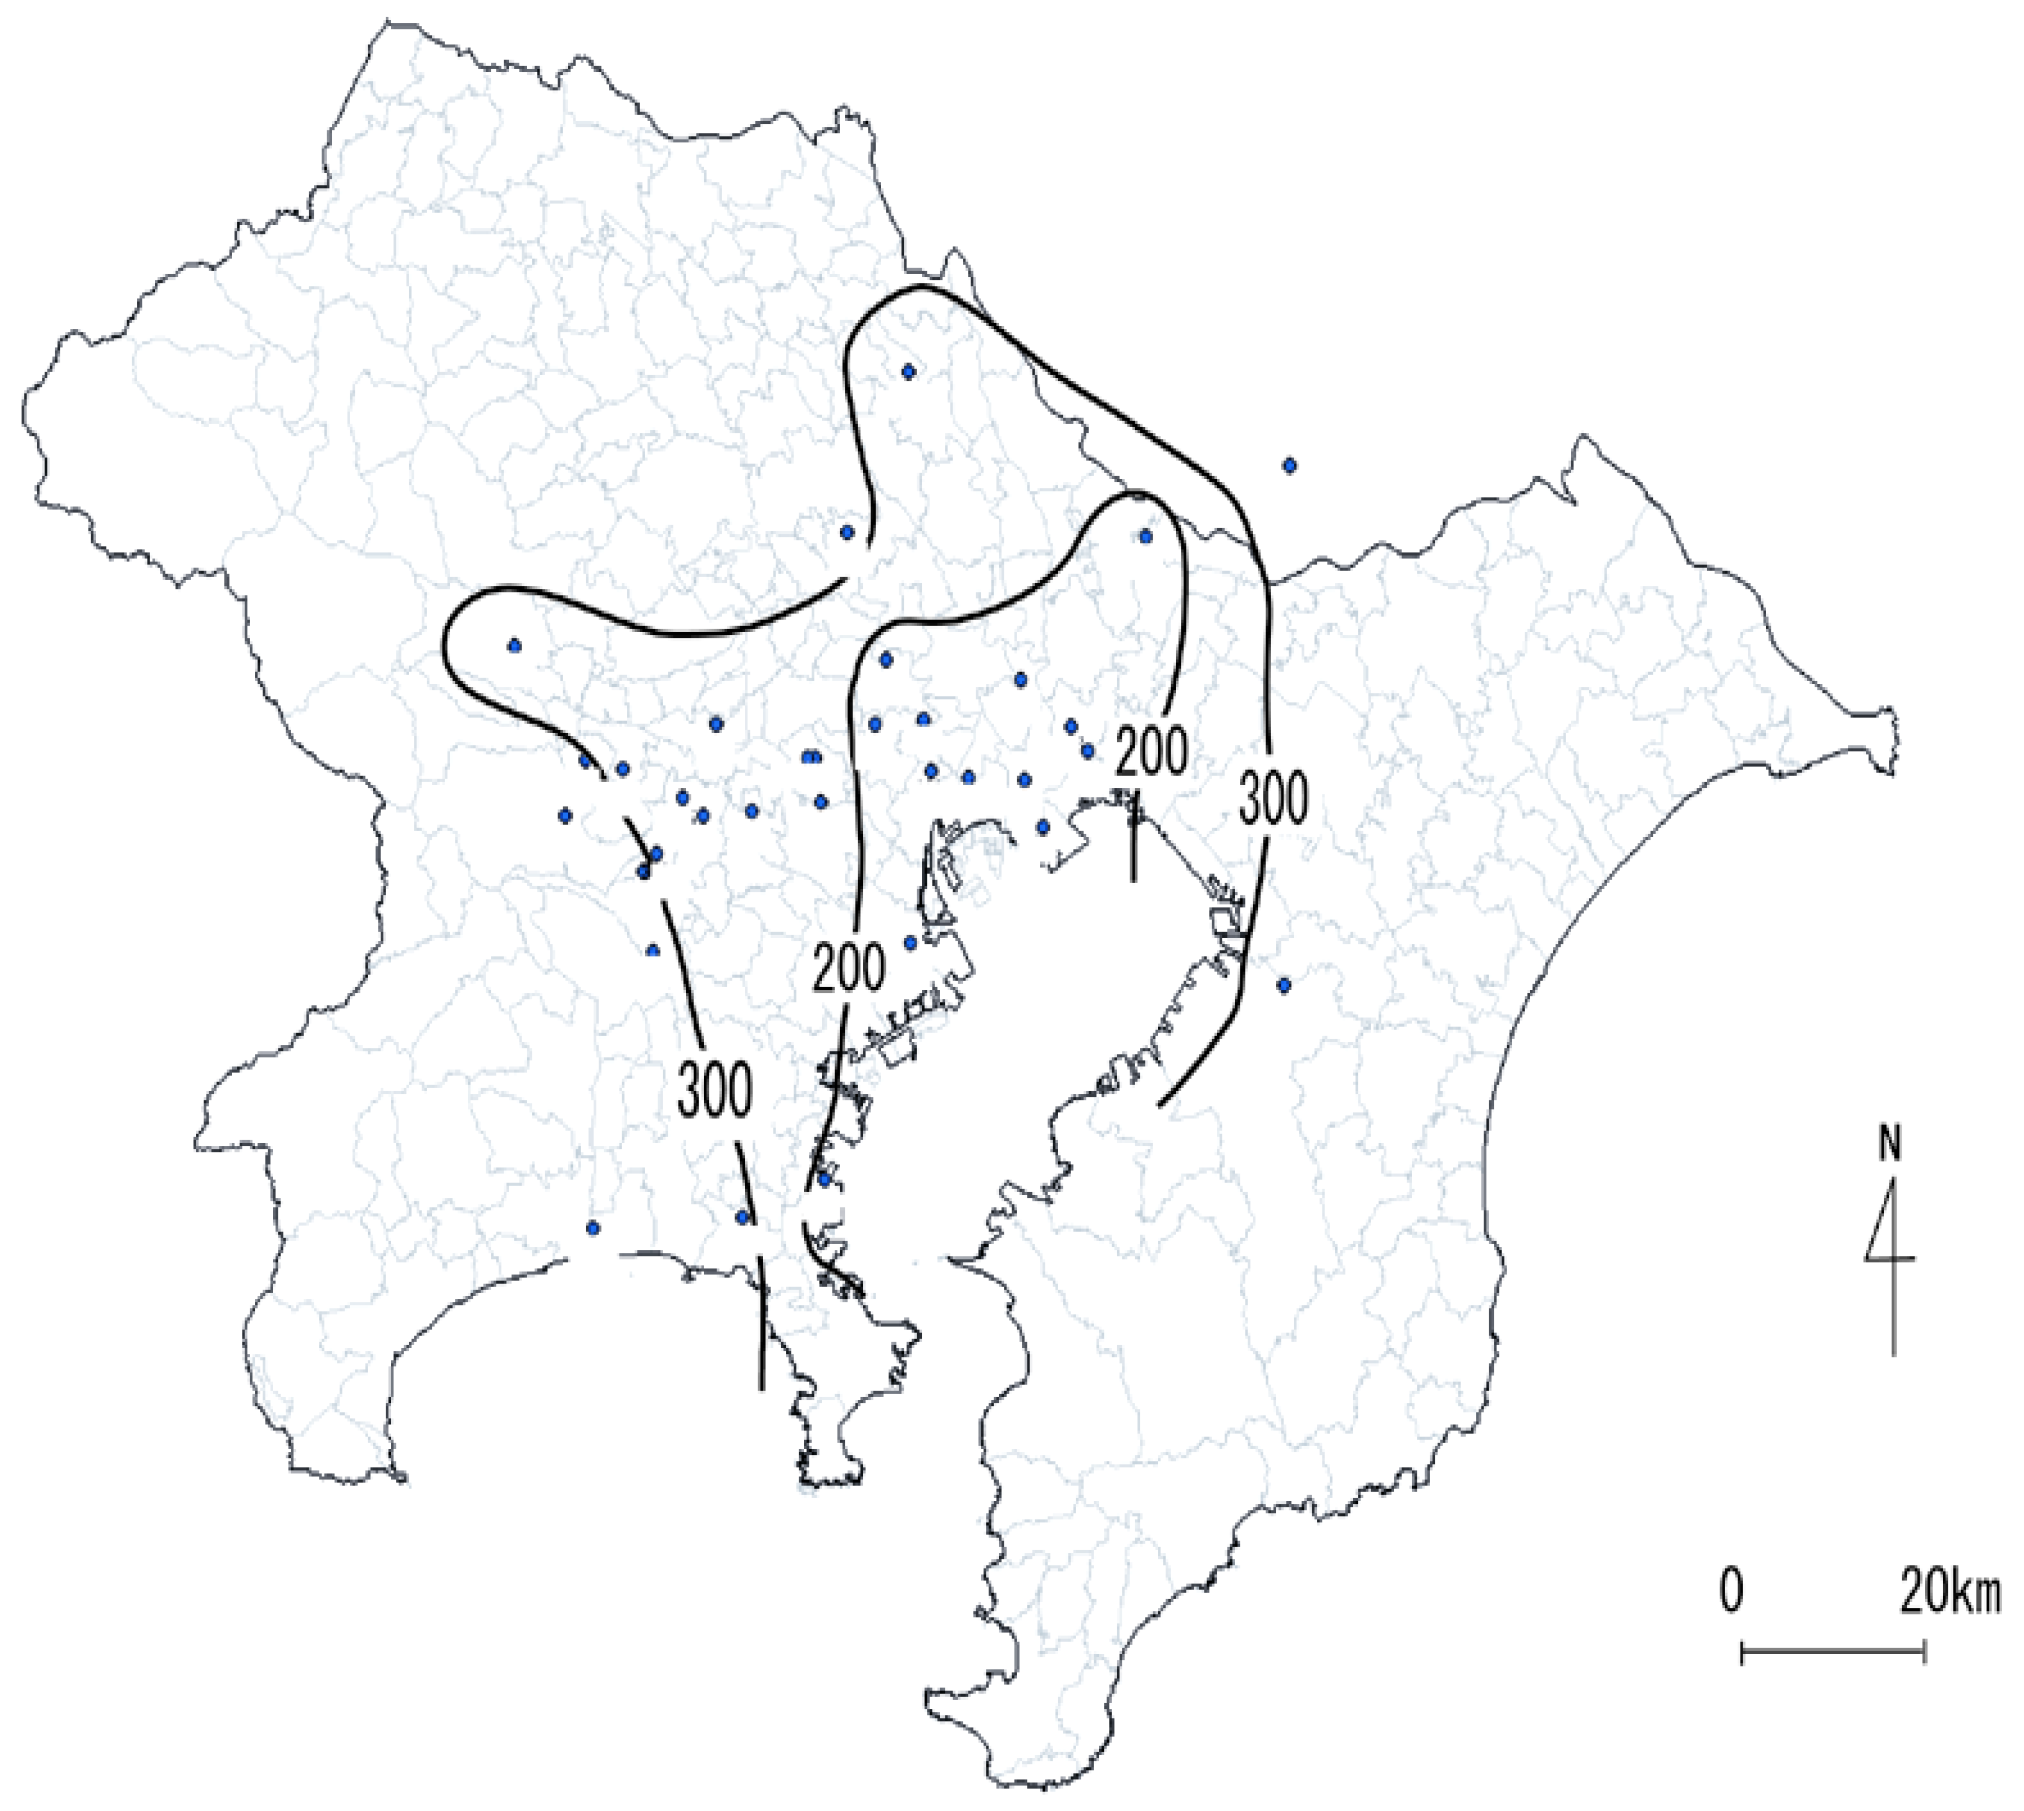
Regional distributions of total pollen dispersion in the South Kanto area were characterized on 15-16 March 2005 and on 14-15 March 2006. Although the pollen levels in 2005 was much higher than in 2006, it was commonly observed that higher pollen counts existed in the outer areas, that is, in suburban and rural areas. The natural environment, the sources of pollen dispersion, is still prevailing there. The necessity of the control of air pollutant emissions was discussed for the reduction of pollinosis patients.
4.
Indoor dispersion of pollens was evaluated at first at the lobby of the main building of Kyoritsu Women’s University. The averaged ratio of the indoor to the outdoor is 4.1%. Although this figure seemed to be small, it is considered valid since the entrance is equipped with automated double shutting doors. Indoor pollen dispersion in the hospital building of a medical school was also examined. Except for the sites near to the entrance, the pollen dispersion in the indoor environment was fairly low. It is concluded that indoor pollen will be mainly carried from the outer environment by the movement of air, not by re- suspending of pollens being attached to persons’ clothing. Moreover, attention should be paid to the problem about the importance of pollen accumulating inside a building.

References

  1. Burge, H. A. : An update on pollen and fungal spore aerobiology, J. Allergy Clin. Immunol, 2002, 110, 544–552. [Google Scholar] [CrossRef] [PubMed]
  2. Keirns, C. C. : Better than nature: the changing treatment of asthma and hay fever in the United States, Stud. Hist. Phil. Biol. & Biomed. Sci., 2003, 34, 511–531. [Google Scholar]
  3. Bergmann, R. I.; Wahn, U. ; The allergy march: from food to pollen, Environmental Toxicology and Pharmacology, Bergmann K. E. Environ. Toxicol. Pharmacol., 1997, 4, 79–83. [Google Scholar] [PubMed]
  4. Schaeppi, G. F.; Suphioglu, C.; Taylor, P. E.; Knox, R.B. : Concentrations of the major birch tree allergen Bet v 1 in pollen and respirable fine particles in the atmosphere, J. Allergy Clin. Immunol., 1997, 100, 656–661. [Google Scholar] [CrossRef] [PubMed]
  5. Fahlbusch, B.; Hornung, D.; Heinrich, J.; Jager, L. : Predictors of group 5 grass-pollen allergens in settled house dust: comparison between pollination and nonpollination seasons, Allergy 2001, 56, 1081–1086. [Google Scholar]
  6. Porsbjerg, C.; Linstow, M. L.; Nepper-Christensen, S. C.; Rasmussen, A.; Korsgaard, J.; Nolte, H.; Backer, V. : Allergen sensitization and allergen exposure in Greenlander Inuite residering in Denmark and Greenland, Respiratory Medicine, Res. Medi., 2002, 96, 736–744. [Google Scholar]
  7. Cortegano, I.; Civantos, E.; Aceituno, E.; del Moral, A.; Loepez, E.; Lombardero, M.; del Pozo, V.; Lahoz, C. : Cloning and expression of a major allergen form Cupressus arizonica pollen, Cup a 3, aPR-5 protein expressed under polluted environment, Allergy, 2004, 59, 485–490. [Google Scholar]
  8. Ishizaki, T.; Koizumi, K.; Ikemori, R.; Ishiyama, Y.; Kushibiki, E. : Studies of prevalence of Japanese cedar pollinosis among the residents in a densely cultivated area, Annals of Allergy, 1987, 58, 265–270. [Google Scholar]
  9. Nakagawa, H.; Ohashi, N.; Omura, A.; Watanabe, Y.; Teranishi, H.; Keyaki, Y. : Clinical manifestations of Japanese cedar pollinosis: An epidemiological study, Rhinology, 1996, 34, 201–205. [Google Scholar]
  10. Sakurai, Y.; Nakamura, K.; Teruya, K.; Shimada, N.; Umeda, T.; Tanaka, H.; Yoshizawa, N. : Prevalence and risk factors of allergic rhinitis and Cedar pollinosis among Japanese men, Prev. Med., 1998, 27, 617–622. [Google Scholar]
  11. Okuda, M.; Shida, T. : Clinical aspects of Japanese cedar pollinosis, Allergology International, Allergol. Int., 1998, 47, 1–8. [Google Scholar]
  12. Naito, N.; Iwata, S.; Yokoyama, N. : Laryngeal symptoms in patients exposed to Japanese cedar pollen: allergic reactions and environmentalpollution, Eur. Arch Otorhinolaryngol, 1999, 256, 209–211. [Google Scholar] [CrossRef]
  13. Tanihara, S.; Oki, I.; Ojima, T.; Nakamura, Y.; Yanagawa, H. : Process and current status of the epidemiologic studies on cedar pollinosis in Japan, J. Epidemiol., 1999, 9, 20–26. [Google Scholar] [CrossRef]
  14. Ozawa, K.; Dejima, K.; Watanabe, Y.; Takenaka, H. : A longitudinal observation of sensitization to Japanese cedar pollen and house dust mite among schoolchildren, Allergol. Int., 1999, 48, 69–78. [Google Scholar]
  15. Nishihata, S.; Inouye, S.; Saiga, T.; Sahashi, N.; Suzuki, S.; Murayama, K.; Yokoyama, T.; Saito, Y. : Prevalence rate of allergy to Japanese cedar pollen in Tokyo--from field investigation in 1996 by Tokyo Japanese cedar pollen allergy measurements and review committee, Arerugi, 1999, 48, 597–604. [Google Scholar]
  16. Nagata, N.; Mutoh, H.; Kumahara, K.; Arimoto, Y.; Tomemori, T.; Sakurai, D.; Arase, K.; Ohno, K.; Yamakoshi, T.; Nakano, K.; Numata, T.; Konno, A. : Association between nasal allergy and a coding variant of the FceRIb gene Glu237Gly in a Japanese population, Hum. Genet., 2001, 109, 262–266. [Google Scholar]
  17. Ozawa, K.; Dejima, K.; Takenaka, H. : Prevalence of Japanese cedar pollinosis among schoolchildren in Japan, Int. Arch. Allergy Immunol., 2002, 128, 165–167. [Google Scholar]
  18. Yasuda, H.; Yui, Y.; Shimizu, T.; Shida, T. : Isolation and partial characterization of the major allergen form Japanese cedar (Cryptomeria japonical) pollen, J. Allergy Clin. Immunol., 1983, 71, 77–86. [Google Scholar] [CrossRef]
  19. Taniai, M.; Kayano, T.; Takakura, R.; Yamamoto, S.; Usui, M.; Ando, S.; Kurimoto, M.; Panzani, R.; Matuhasi, T. : Epitopes on Cry j I and Cry j II for the human IgE antibodies cross-reactive between Cupressus Sempervires and Cryptomeria Japonica pollen, Mol. Immunol., 1993, 30, 183–189. [Google Scholar]
  20. Taniguchi, Y.; Ono, A.; Sawatani, M.; Nanba, M.; Kohno, K.; Usui, M.; Kurimoto, M.; Matuhasi, T. : Cry j I, a major allergen of Japanese cedar pollen, has pectate lyase enzyme activity, Allergy, 1995, 50, 90–93. [Google Scholar]
  21. Sakaguchi, M.; Hashimoto, M.; Nigi, H.; Yasuda, H.; Takahashi, Y.; Watanabe, M.; Nagoya, T. : Epitope specificity of IgE antibodies to a major allergen (Cry j 1) of Japanese cedar pollen in sera of humans and monkeys with polinosis, Immunology, 1997, 91, 161–166. [Google Scholar]
  22. Sone, T.; Morikubo, K.; Miyahara, M.; Komiyama, N.; Shimizu, K.; Tsunoo, H.; Kino, K. : T cell epitopes in Japanese cedar (Cryptpmeria japonica) pollen allergens: Choice of major T cell epitopes in Cry j 1 and Cry j 2 toward design of the peptide-based immunotherapeutics for the management of Japanese cedar pollinosis, J. Immunol., 1998, 161, 448–457. [Google Scholar]
  23. Hirahara, K.; Tatsuta, T.; Takatori, T.; Ohtsuki, M.; Kirinaka, H.; Kawaguchi, J.; Serizawa, N.; Taniguchi, Y.; Saito, S.; Sakaguchi, M. : Preclinical evaluation of an immunotherapeutic peptide comprising 7 T-cell determinants of Cry j 1 and Cry j 2, the major Japanese cedar pollen allergens, J. Allergy Clin. Immunol., 2001, 108, 94–100. [Google Scholar] [CrossRef]
  24. Okano, M.; Kino, K.; Takishita, T.; Hattori, H.; Ogawa, T.; Yoshino, T.; Yokoyama, M.; Nishizaki, K. : Roles of carbohydrate on Cry j 1, the major allergen of Japanese cedar pollen, in specific T-cell responses, J. Allergy Clin. Immunol., 2001, 108, 101–108. [Google Scholar] [CrossRef]
  25. Sakaguchi, M.; Masuda, K.; Yasuda, H.; Saito, S.; DeBoer, D. J.; Tsujimoto, H. : IgE reactivity and cross-reactivity to Japanese cedar (Cryptopmeria japonica) and cypress (Chamaecyparis obtsusa) pollen allergens in dogs with atopic dermatitis, Vet. Immunol. Immunopathol., 2001, 83, 69–77. [Google Scholar]
  26. Nakamura, H.; Miyagawa, K.; Ogino, K.; Endo, T.; Imai, T.; Ozasa, K.; Motohashi, Y.; Matsuzaki, I.; Sasahara, S.; Hatta, K.; Eboshida, A. : High contribution contrast between the genes of eosinophil peroxidase and IL-4 receptor α-chain in Japanese cedar pollinosis, J. Allergy Clin. Immunol., 2003, 112, 1127–1131. [Google Scholar]
  27. Fujiwara, S.; Yasunaga, S.; Iwabuchi, S.; Masuda, K.; Ohno, K.; Tsujimoto, H. : Cytokine profiles of peripheral blood mononuclear cells from dogs experimentally sensitized to Japanese cedar pollen, Vet. Immunol. Immunopathol., 2003, 93, 9–20. [Google Scholar] [CrossRef] [PubMed]
  28. Masuda, K.; Sakaguchi, M.; Saito, S.; Yasuda, H.; Iwabuchi, S.; Tsukui, T.; Hayashi, N.; Nakno, Y.; Kurata, K.; Maeda, S.; Ohno, K.; Tsujimoto, H. : Identification of peptides containing T-cell epitopes of Japanese cedar (Cryptopmeria japonica) pollen allergen (Cry j 1) in dogs, Vet. Immunol. Immunopathol., 2004, 102, 45–52. [Google Scholar] [CrossRef] [PubMed]
  29. Murasugi, T.; Nakagami, Y.; Yoshitomi, T.; Hirahara, K.; Yamashita, M.; Taniguchi, Y.; Sakaguchi, M.; Ito, K. : Oral administration of a T cell epitope inhibits symptoms and reactions of allergic rhinitis in Japanese cedar pollen allergen-sensitized mice, Eur. J. Pharmacol., 2005, 510, 143–148. [Google Scholar]
  30. Masuda, K. : DNA vaccination against Japanese cedar polliosis in dogs suppresses type I hypersensitivity by controlling lesional mast cells, Vet. Immunol. Immunopathol., 2005, 108, 185–187. [Google Scholar] [CrossRef]
  31. Midoro-Horiuti, T.; Schein, C. H.; Mathura, V.; Braun, W.; Czerwinski, E. W.; Togawa, A.; Kondo, Y.; Oka, T.; Watanabe, M.; Goldblum, R. M. : Structural basis for epitope sharing between group 1 allergens of cedar pollen, Mol. Immunol., 2006, 43, 509–518. [Google Scholar]
  32. Suzuki, M.; Komiyama, N.; Itoh, M.; Itoh, H.; Sone, T.; Kino, K.; Takagi, I. : Purification, characterization and molecular cloning of Cha o 1, a major allergen of Chamaecyparis Obtusa (Japanese Cypress) pollen, Mol. Immunol., 1996, 33, 451–460. [Google Scholar]
  33. Aceituno, E.; Pozo, V. D.; Minguez, A.; Arrieta, I.; Cortegano, I.; Cardaba, B.; Gallardo, S.; Lahoz, C. : Molecular cloning of major allergen from Cupressus arizonica pollen: Cup a 1, Clin. Exp. Allergy, 2000, 30, 1750–1758. [Google Scholar]
  34. Cortegano, I.; Civantos, E.; Aceituno, E.; del Moral, A.; Lopez, E.; Lombardero, M.; del Pozo, V.; Lahoz, C. : Cloning and expression of a major allergen from Cupressus arizonica pollen, Cup a 3, a PR-5 protein expressed under polluted environment, Allergy, 2004, 59, 485–490. [Google Scholar]
  35. Sanches, D. D.; Tsien, A.; Fleming, J.; Saxon, A. : Combined diesel exhaust particulate and ragweed allergen challenge markedly enhances human in vivo nasal ragweed-specific IgE and skews cytokine production to a T helper cell 2-type pattern, J. Immunol., 1997, 164, 2406–2413. [Google Scholar]
  36. Nelson, H. S. : The importance of allergens in the development of asthma and the persistence of symptoms, J. Allergy Clin. Immunol., 2000, 105, S628–S632. [Google Scholar] [CrossRef]
  37. Conner, T. I.; Norris, G. A.; Landis, M. S.; Williams, R. W. : Individual particle analysis of indoor, outdoor, and community samples from the 1998 Baltimore particulate matter study, Atmos. Environ., 2001, 35, 3935–3946. [Google Scholar]
  38. Amato, G. D.; Liccardi, G.; Amato, M. D.; Cazzola, M. : The role of outdoor air pollution and climatic changes on the rising trends in respiratory allergy, Res. Med., 2001, 95, 606–611. [Google Scholar]
  39. Moshammer, H.; Neuberger, M. : The active surface of suspended particles as a predictor of lung function and pulmonary symptoms in Austrian school children, Atmos. Environ., 2003, 37, 1737–1744. [Google Scholar]
  40. Harkema, J. R; Wagner, J. G. : Epithelial and inflammatory responses in the airways of laboratory rats coexposed to ozone and biogenic substances: Enhancement of toxicant-induced airway injury, Exp. Toxicol. Pathol., 2005, 57, 129–141. [Google Scholar] [CrossRef] [PubMed]
  41. Namork, E.; Johansen, B. V.; Løvik, M. : Detection of allergens adsorbed to ambient air particles collected in four European cities, Toxicol. Lett., 2006, 165, 71–78. [Google Scholar]
  42. Nikasinovic, L.; Just, J.; Sahraoui, F.; Grimfeld, N. A.; Momas, I. : Nasal inflammation and personal exposure to fine particles PM2.5 in asthmatic children, J. Allergy Clin. Immunol., 2006, 117, 1382-1388.43. Curtis, L.; Rea, W.; Smith-Willis, P.; Fenyves E.; Pan, Y.: Adverse health effects of outdoor air pollutants, Environ. Int., 2006, 32, 815–830. [Google Scholar]
  43. Schulz, T.; Senkpiel, K.; Ohgke, H. : Comparison of the toxicity of reference mycotoxins and spore extracts of common indoor moulds, Int. J. Hygiene Environ. Health, 2004, 207, 267–277. [Google Scholar] [CrossRef]
  44. Dotterud, L. K.; Kvammen, B.; Lund, E.; Falk, E. S. : An evaluation of atopic diseases in relation to immediate skin test reactions among schoolchildren in the Sor-Varanger community, J. Eur. Acad. Dermatol. Venereol., 1995, 5, 240–249. [Google Scholar]
  45. Couturier, P.; Basset, D.; Penel, V. : Réhabilitation du capteur de pollens de Montélimar-Ancône et surveillance de l'ambroisie en Vallée du Rhône en 1995, Revue Française d'Allergologie et d'Immunologie Clinique, 1997, 37, 66–68. [Google Scholar]
  46. Sterling, D. A. : Lewis, R. D.: Pollen and fungal spores indoor and outdoor of mobile homes, Ann. Allergy Asthma Immunol., 1998, 80, 279–285. [Google Scholar]
  47. Monn, C.; A.-Kirkpatrick, P.; Künzli, N.; Defila, C.; Peeters, A.; A.-Liebrich, U.; Leuenberger, P. ; SAPALDIA Team: Air pollution, climate and pollen comparisons in urban, rural and alpine regions in Switzerland (SAPALDIA study), Atmos. Environ., 1999, 33, 2411–2416. [Google Scholar]
  48. Déchamp, C.; Penel, V. : Results of pollen counts for 2001 from the Rhône-Alpes ragweed pollen-monitoring network (SARA), Revue Française d’Allergologie et d’Immunologie Clinique, 2002, 42, 539–542. [Google Scholar]
  49. Farrera, I.; Calleja, M.; Dechamp, C. : Indoor and outdoor pollen sedimentation in the Rhone-Alpes region during the ragweed pollination season, Revue Française d'Allergologie et d'Immunologie Clinique, 2002, 42, 750–753. [Google Scholar]
  50. Makra, L.; Juhasz, M.; Beczi, R.; Borsos, E. : The history and impact of airborne Ambrosia (Asteraceae) pollen in Hungary, Grana, 2004, 43, 1–8. [Google Scholar]
  51. Makra, L.; Juhasz, M.; Borsos, R.; Beczi, E. : Meteorological variables connected with airborne ragweed pollen in Southern Hungary, Int. J. Biometeorol., 2004, 49, 37–47. [Google Scholar] [CrossRef] [PubMed]
  52. Moshammer, H.; Schinko, H.; Neuberger, M. : Total pollen counts do not influence active surface measurements, Atmos. Environ., 2005, 39, 1551–1555. [Google Scholar]
  53. Durham, O. C. : The volumetric incidence of atmospheric allergens IV. A proposed standard method of gravity sampling, counting, and volumetric interpolation of results, J. Allergy, 1946, 17, 79–86. [Google Scholar]
  54. Bureau of Welfare and Health Care of the Tokyo Metropolitan Government, Pollen dispersion information in the Tokyo metropolitan area in 2006, Tokyo Metropolitan government Press: Tokyo, 2006; pp1-50.
  55. Karlsson, E.; Fangmark, I.; Berglund, T. : Resuspension of an indoor aerosol, J. Aerosol Sci., 1996, 27, S441–S442. [Google Scholar] [CrossRef]
Figure 1. Map of the location of pollen sampling sites in the neighborhood of Tokyo in the Japan Islands. A: Kyoritsu Women’s University located in the central part of Tokyo, B: Kasumigaura hospital of Tokyo Medical University and C: South Kanto area (as showed in Figure. 5 later).
Ijerph 05 00076 g001
Figure 2. Photo images of Japanese cedar pollen (A) and Japanese cypress pollen (B) as seen through an optical microscope.
Ijerph 05 00076 g002
Figure 3. Characteristics of Japanese cedar pollen (A) and Japanese cypress pollen (B) dispersions measured on a daily basis on the rooftop of the main building of Kyoritsu Women’s University through 1 February and 30 April 2005.
Ijerph 05 00076 g003
Figure 4. Characteristics of Japanese cedar pollen (A) and Japanese cypress pollen (B) dispersions measured on a daily basis on the rooftop of Kyoritsu Women’s University through 1 February and 30 April 2006.
Ijerph 05 00076 g004
Figure 5. Regional distribution of total pollen dispersion in the South Kanto area on 15-16 March 2005. (Pollen, count cm-2 day-1).
Ijerph 05 00076 g005
Figure 6. Regional distribution of total pollen dispersion in the South Kanto area on 14-15 March 2006. (Pollen, count cm-2 day-1).
Ijerph 05 00076 g006
Figure 7. The influence of outdoor pollen dispersion on the indoor environment at the lobby of the main building of Kyoritsu Women’s University in March 2005.
Ijerph 05 00076 g007
Figure 9. Characteristics of indoor total pollen dispersion in a hospital building in Kasumigaura, Ibaraki Prefecture under a fine weather condition on 13-14 April 2005.
Ijerph 05 00076 g009
Table 1. Total pollen deposition on a walking person along a street in Tokyo, Japan in April 2005.
DateSampler positionTotal pollen number, counts cm-2 hour-1
Right Side Left Side
28 MarShoulder2.2 0.9
Back 0.2
Left0.5 0.3
Foot25.9 7.3
7 AprilShoulder73.8 67.3
Back 61.0
Left63.1 3.6
Foot245.5 178.2
Disclaimer/Publisher’s Note: The statements, opinions and data contained in all publications are solely those of the individual author(s) and contributor(s) and not of MDPI and/or the editor(s). MDPI and/or the editor(s) disclaim responsibility for any injury to people or property resulting from any ideas, methods, instructions or products referred to in the content.

