Article

Hydrochemical Analysis and Evaluation of Groundwater Quality in Tumkur Taluk, Karnataka State, India

by
C. Sadashivaiah
1,
C. R. Ramakrishnaiah
2,* and
G. Ranganna
3
1
Department of Civil Engineering, S.I.T., Tumkur –572103, India
2
Department of Civil Engineering, BMSCE, Bangalore –560019, India
3
UGC-CSA, Department of Mathematics, Central College Campus, Bangalore University, Bangalore- 560 001, India
*
Author to whom correspondence should be addressed.
Int. J. Environ. Res. Public Health 2008, 5(3), 158-164; https://doi.org/10.3390/ijerph5030158
Submission received: 7 July 2008 / Accepted: 27 August 2008 / Published: 30 September 2008

Abstract

:
Tumkur Taluk is located in the southeastern corner of Karnataka state between 13° 06′30″ to 13° 31′ 00″ North latitude and 76° 59′ 00″ to 77° 19′ 00″ East Longitude. The Taluk spreads over an area of 1043 sq.km falling within the semiarid region and frequently facing water scarcity as well as quality problems. The major sources of employment are agriculture, horticulture and animal husbandry, engaging almost 80% of the workforce. Water samples are collected from 269 stations during pre-monsoon and 279 locations during post-monsoon of the year 2006, and were subjected to analysis for chemical characteristics. The type of water that predominates in the study area is Ca-Mg-HCO3 type during both preand post-monsoon seasons of the year 2006, based on hydro-chemical facies. Besides, suitability of water for irrigation is evaluated based on sodium adsorption ratio, residual sodium carbonate, sodium percent, salinity hazard and USSL diagram.

Introduction

Water quality analysis is one of the most important aspects in groundwater studies. The hydro chemical study reveals quality of water that is suitable for drinking, agriculture and industrial purposes. Further, it is possible to understand the change in [1, 2] quality due to rock-water interaction or any type of anthropogenic influence. Groundwater often consists of seven major chemical elements- Ca+2, Mg+2, Cl−1, HCO3−1 Na+1, K+1, and SO4 −2. The chemical parameters of groundwater play a significant role in classifying and assessing water quality. Considering the individual and paired ionic concentration, certain indices are proposed to find out the alkali hazards. Residual sodium carbonate (RSC) can be used as a criterion for finding the suitability of irrigation waters. It was observed that the criteria used in the classification of waters for a particular purpose considering the individual concentration may not find its suitability for other purposes and better results can be obtained only by considering the combined chemistry of all the ions rather than individual or paired ionic characters [35]. Chemical classification also throws light on the concentration of various predominant cations, anions and their interrelationships. A number of techniques and methods have been developed to interpret the chemical data. Zaporozee [6] has summarized the various modes of data representation and has discussed their possible uses.
Presentation of chemical analysis in graphical form makes understanding of complex groundwater system simpler and quicker. Methods of representing the chemistry of water like Collin’s bar diagram [5], radiating vectors of Maucha [7], and parallel and horizontal axes of Stiff [8], have been used in many parts of the world to show the proportion of ionic concentration in individual samples. Subramanian [9] followed a series of methods to interpret and classify the chemistry of groundwater in hard rock, including coastal zones in the southern parts of India.
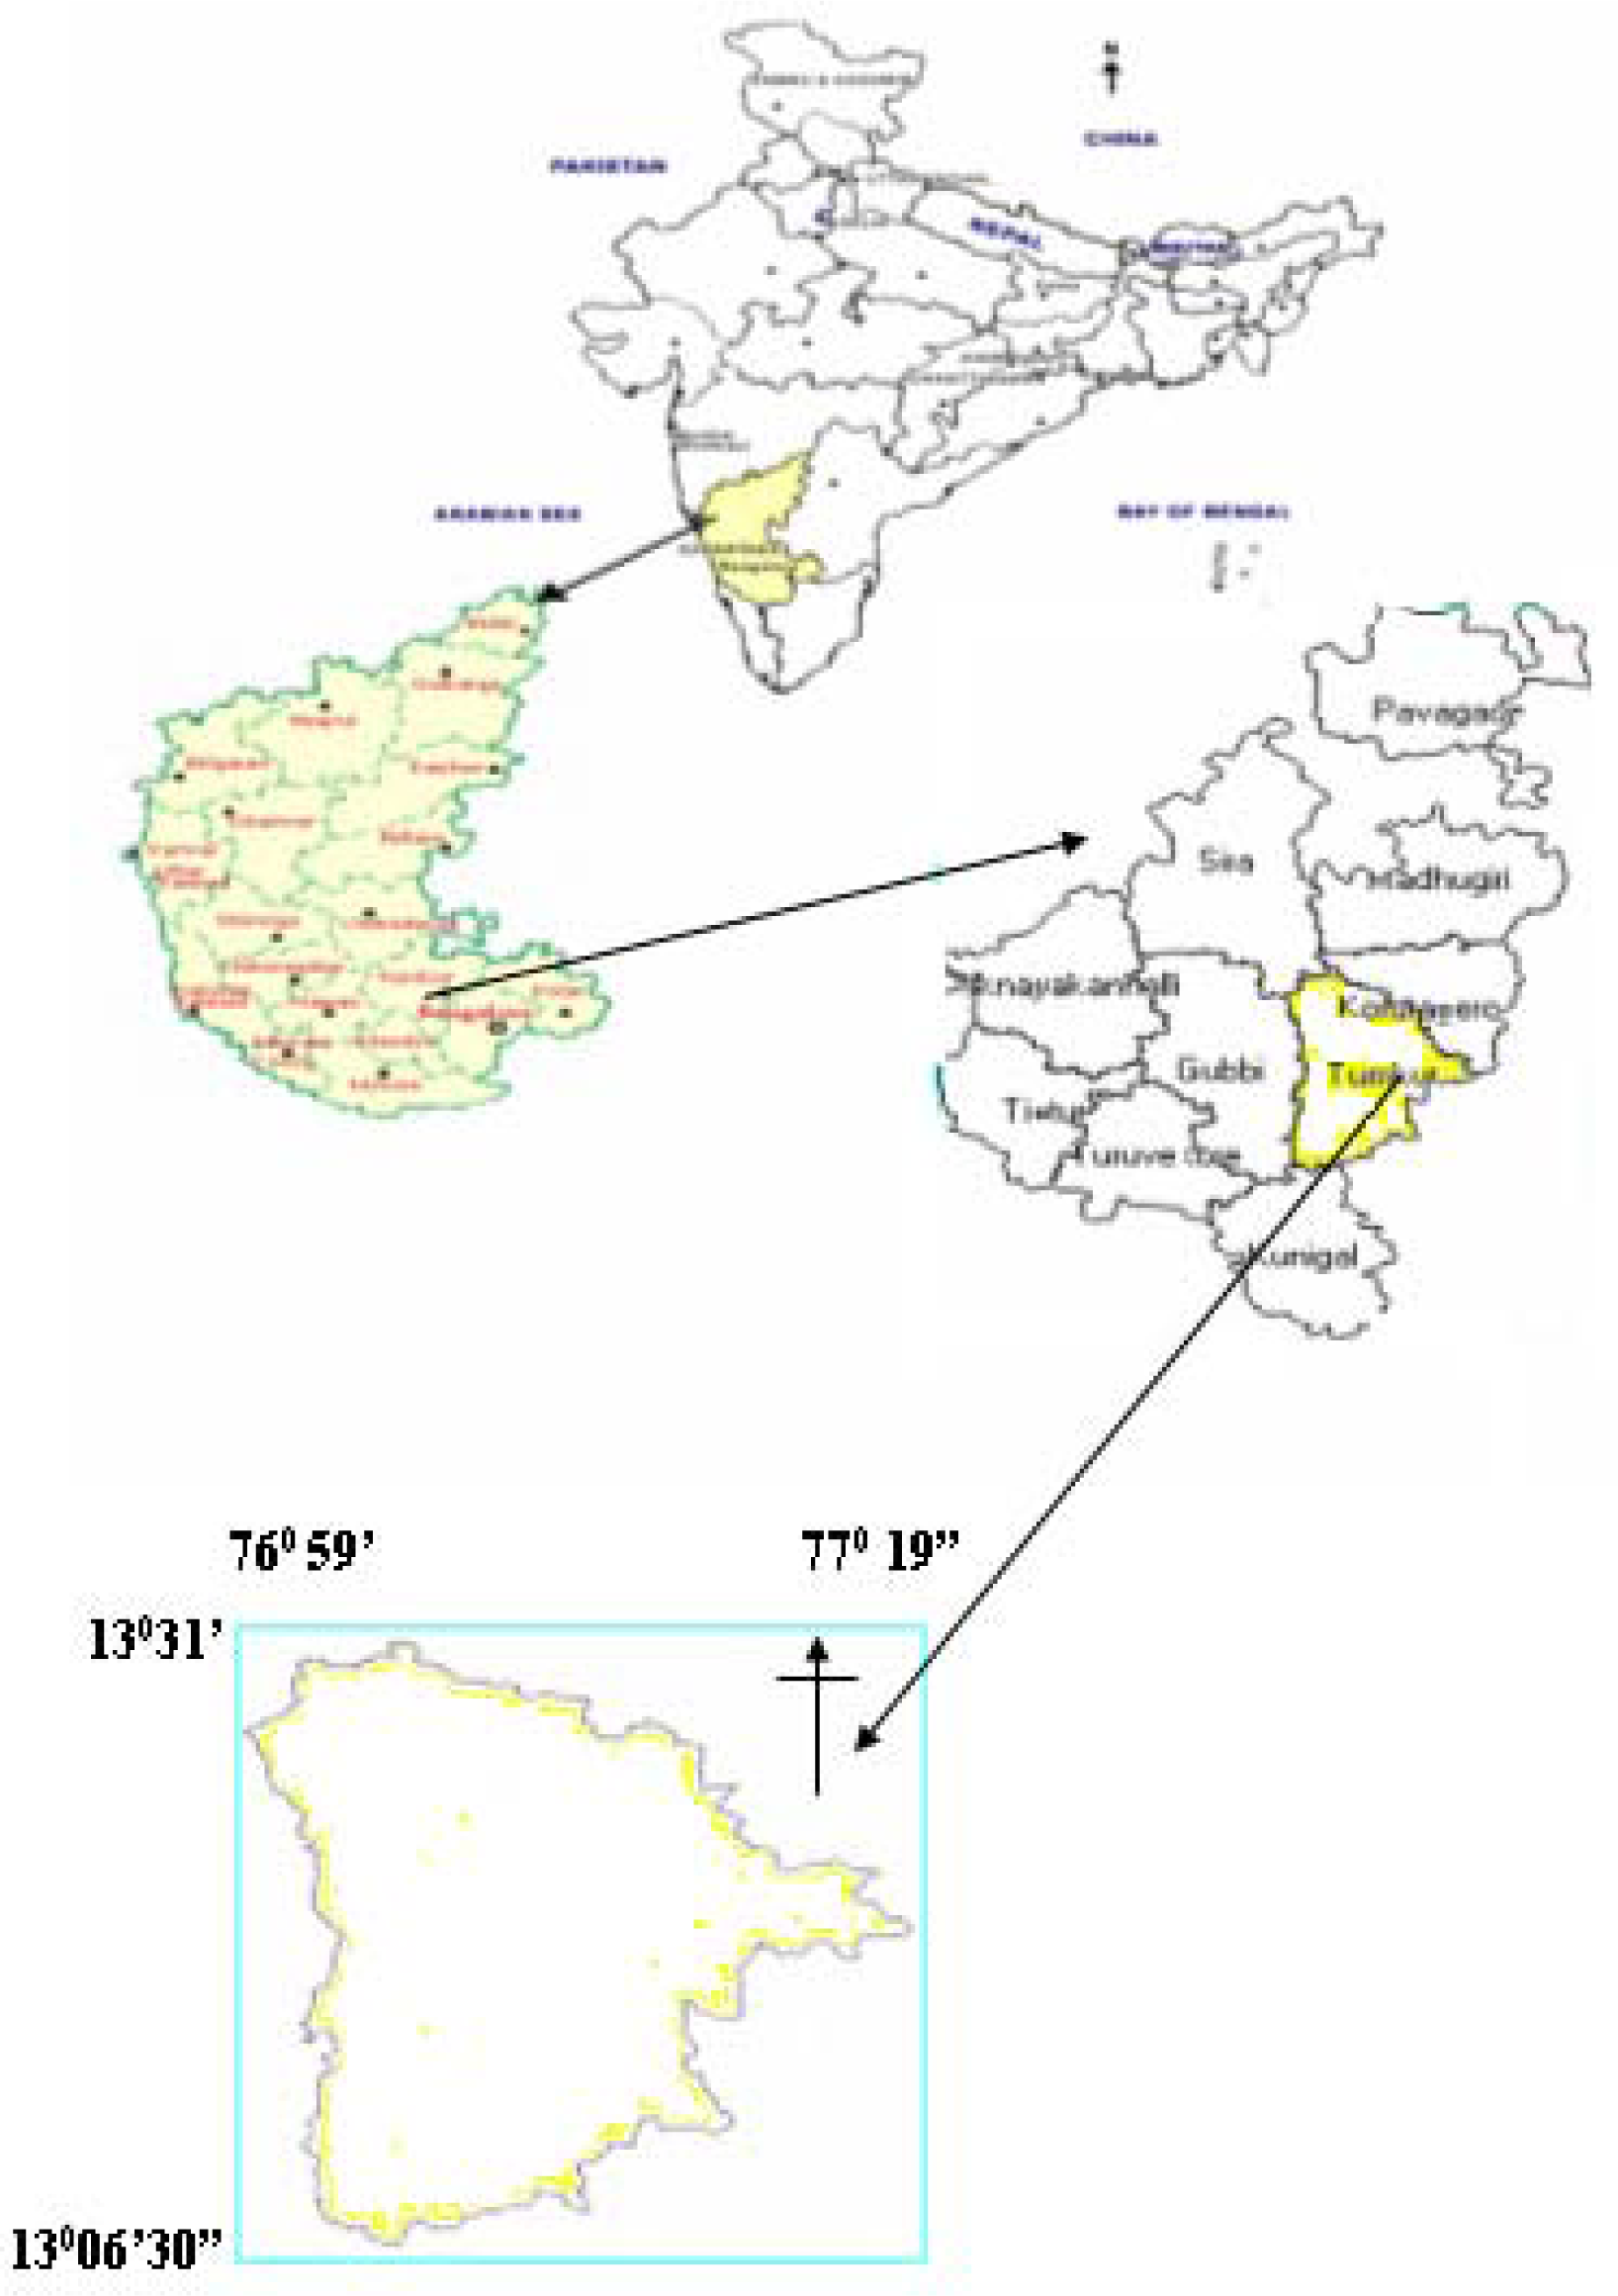
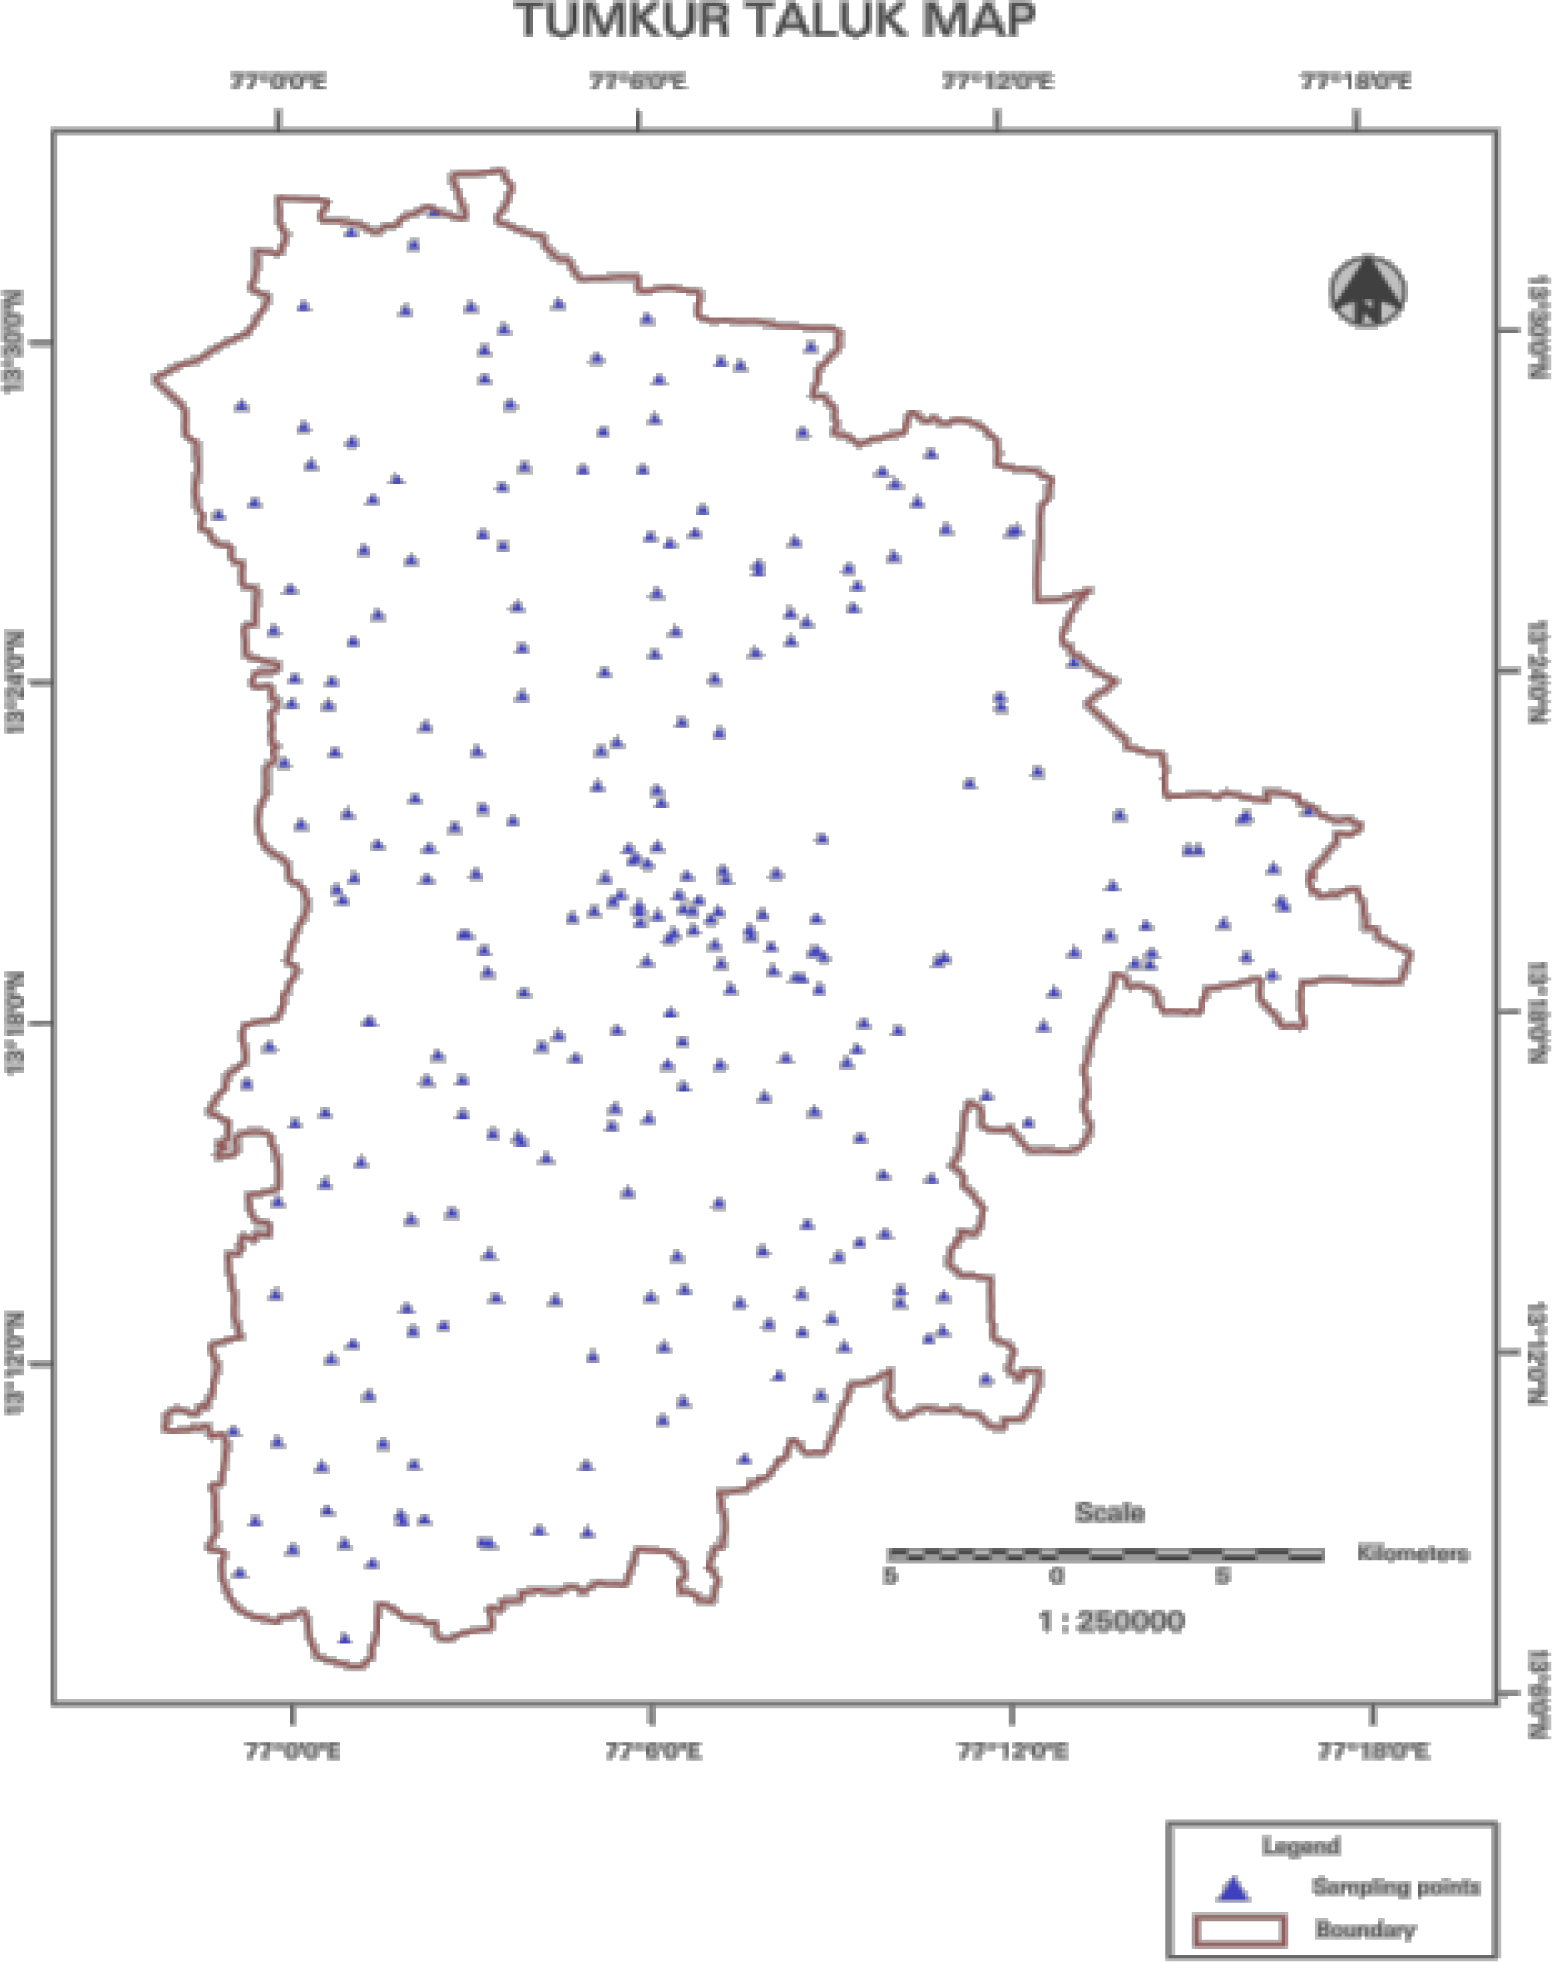
The objective of the present work is to discuss the major ion chemistry of groundwater of Tumkur Taluk. In this case the methods proposed by piper, Back and Hanshaw, Wilcox, Eaton, Todd [10] and USSL (US Salinity Laboratory) classification have been used to study critically the hydrochemical characteristics of groundwater of Tumkur Taluk.

Study Area

Tumkur Taluk is located in the southeastern corner of Karnataka state between 13° 06′30″ to 13° 31′ 00″ North latitude and 76° 59′ 00″ to 77° 19′ 00″ East longitude (Fig. 1) and covers an area of 1043 sq.km with a population of 5, 16,661 [11]. The major sources of employment are agriculture, horticulture and animal husbandry, which engage almost 80% of the workforce. The major industries are that of chemicals, oil, cotton, soap, tools, food processing, rice mills, stone crushing and mining. Occurrence, movement and storage of groundwater are influenced by lithology, thickness and structure of rock formations. Weathered and fractured granites, granitic gneiss form the main aquifer in Tumkur, Taluk. Ground water in the study area occurs under water table conditions in the weathered and fractured granite, Gneisses. There is no perennial river in the study area. The major ion chemistry of groundwater of Tumkur, Taluk has not been studied earlier.

Methodology

Groundwater samples were collected from 237 locations from rural Tumkur and 32 samples from Tumkur city limits during pre-monsoon period (February 2006). Post-monsoon (December 2006) period samples were collected from 237 locations from rural Tumkur Taluk and 42 locations from Tumkur city limits (Fig. 2). The collected water samples were transferred into precleaned polythene container for analysis of chemical characters. Chemical analyses were carried out for the major ion concentrations of the water samples collected from different locations using the standard procedures recommended by APHA-1994 [12]. The analytical data can be used for the classification of water for utilitarian purposes and for ascertaining various factors on which the chemical characteristics of water depend.

Results and Discussion

Maximum and minimum concentration of major ions present in the groundwater from the study area is presented in Table 1. The Piper-Hill diagram [
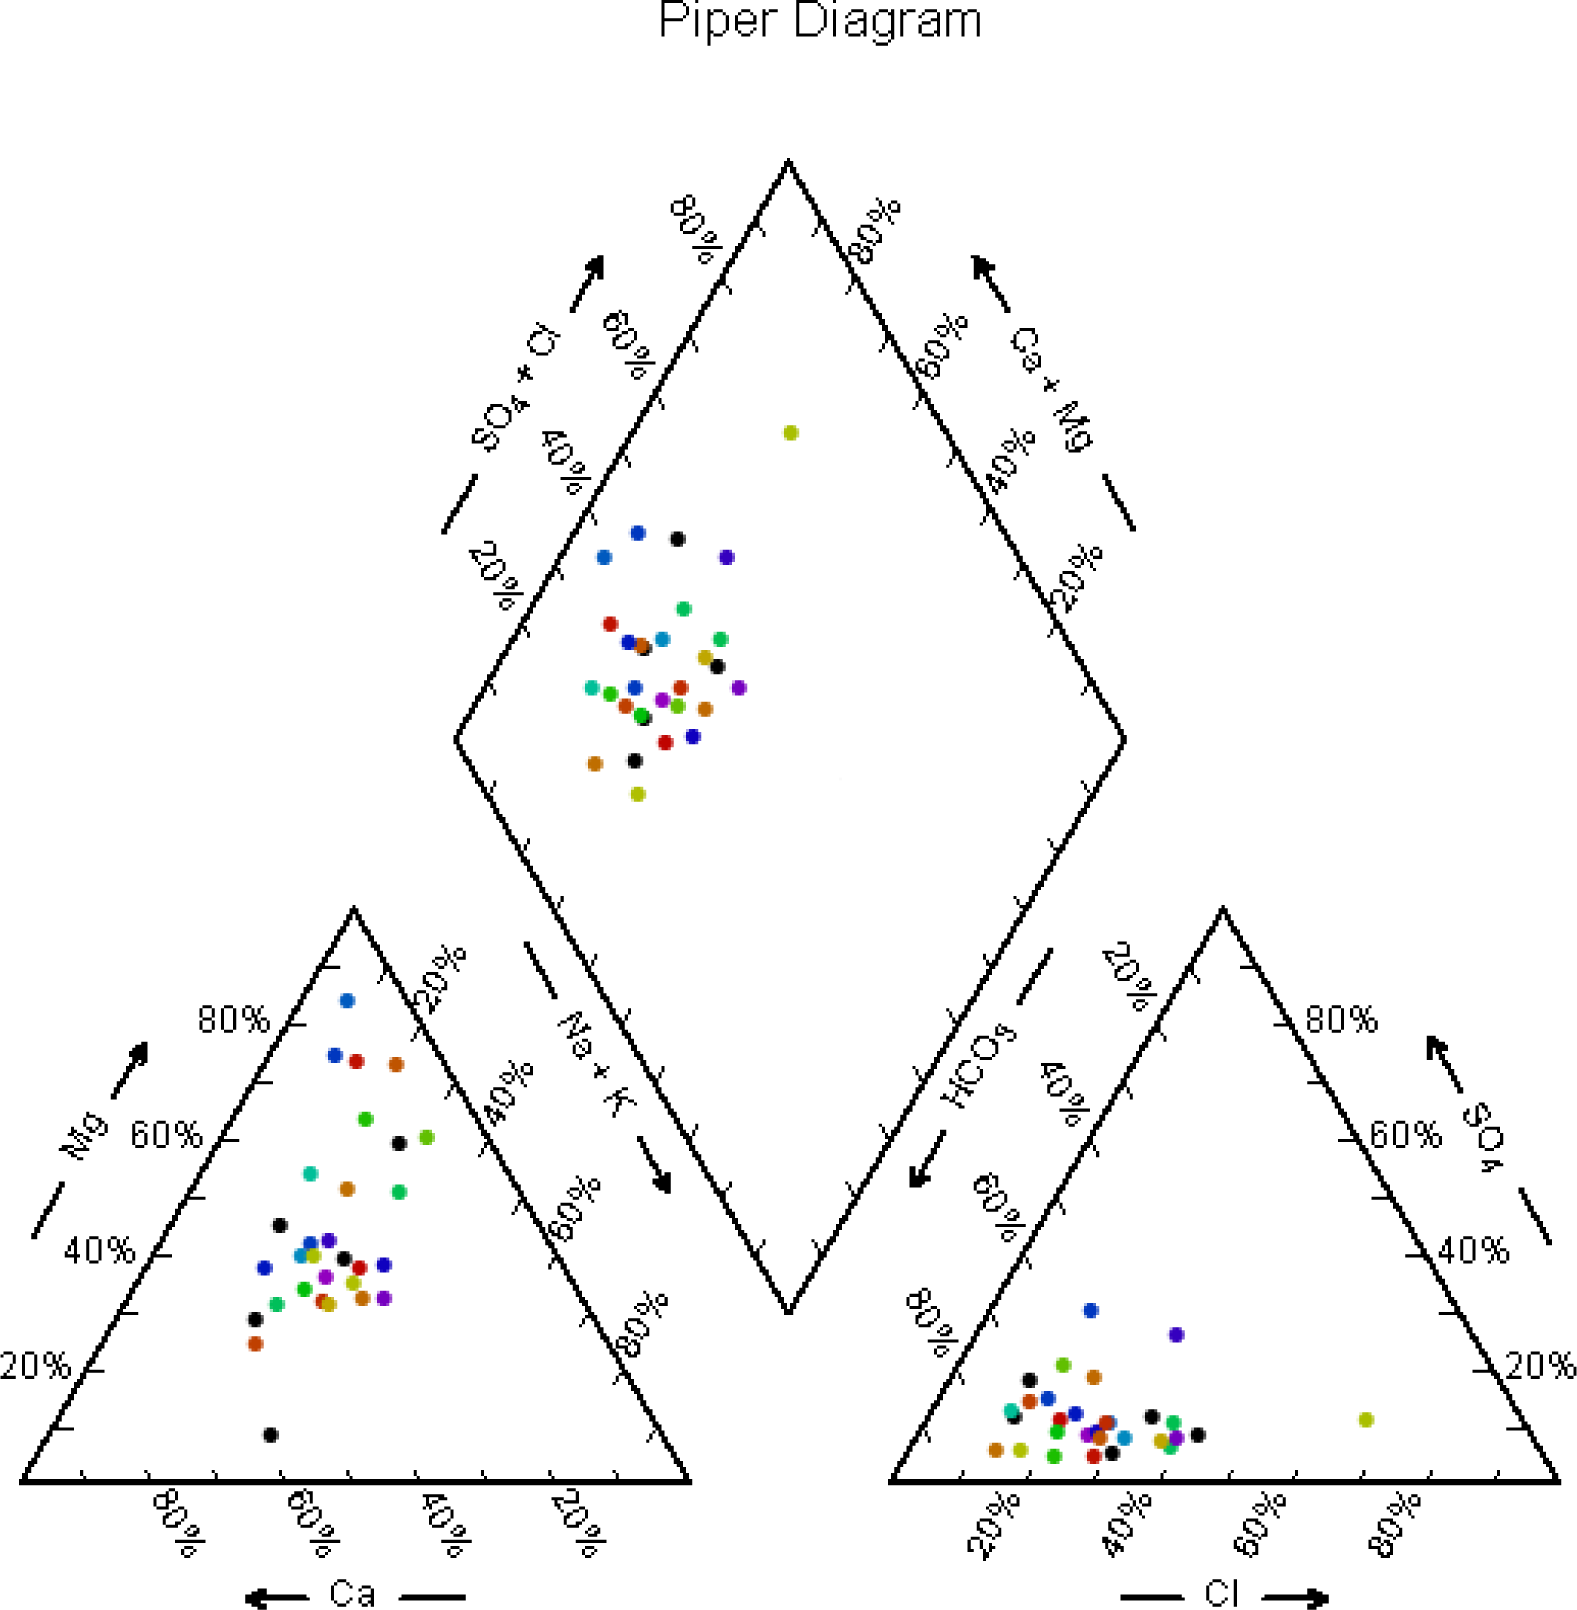
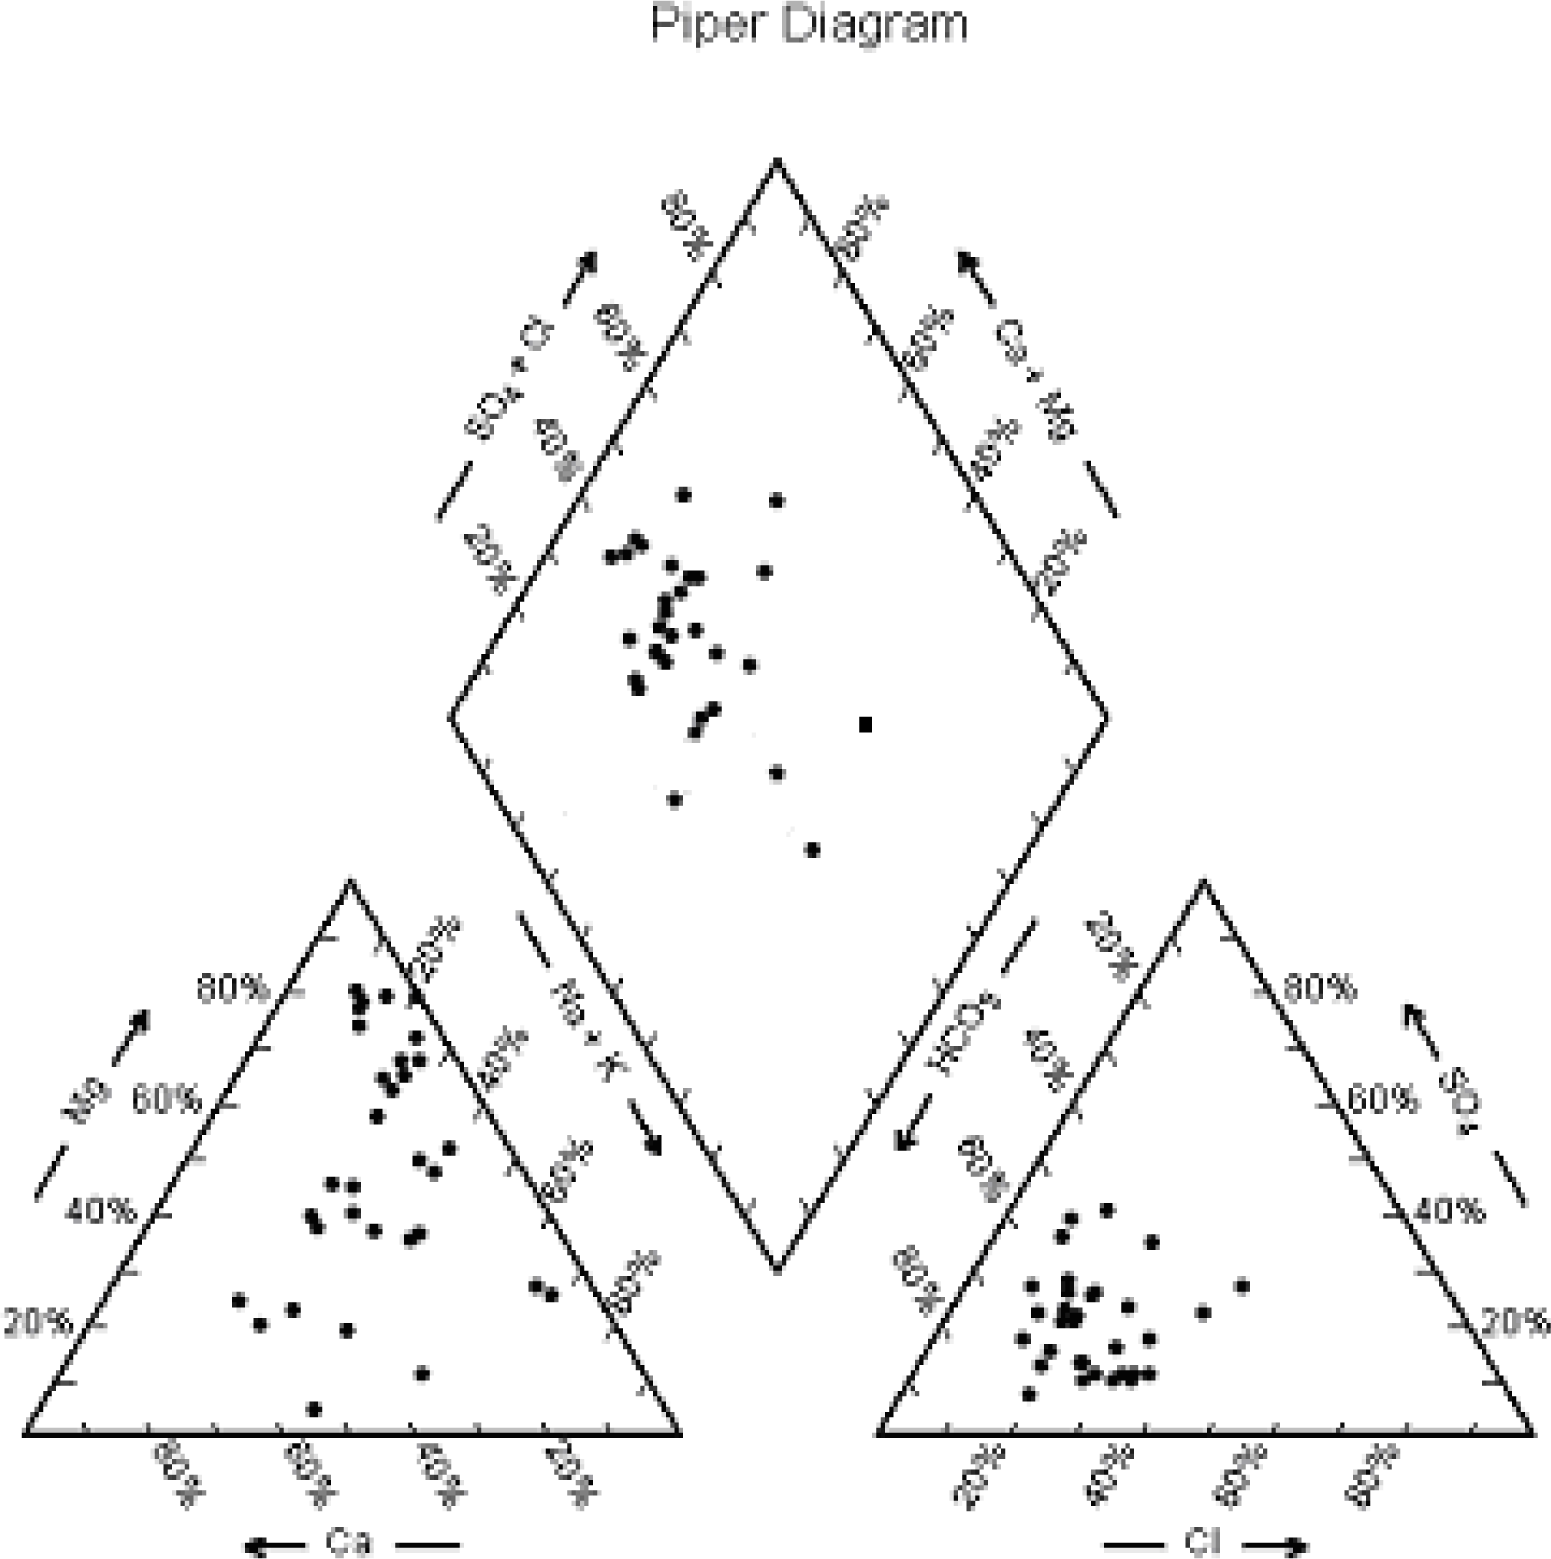
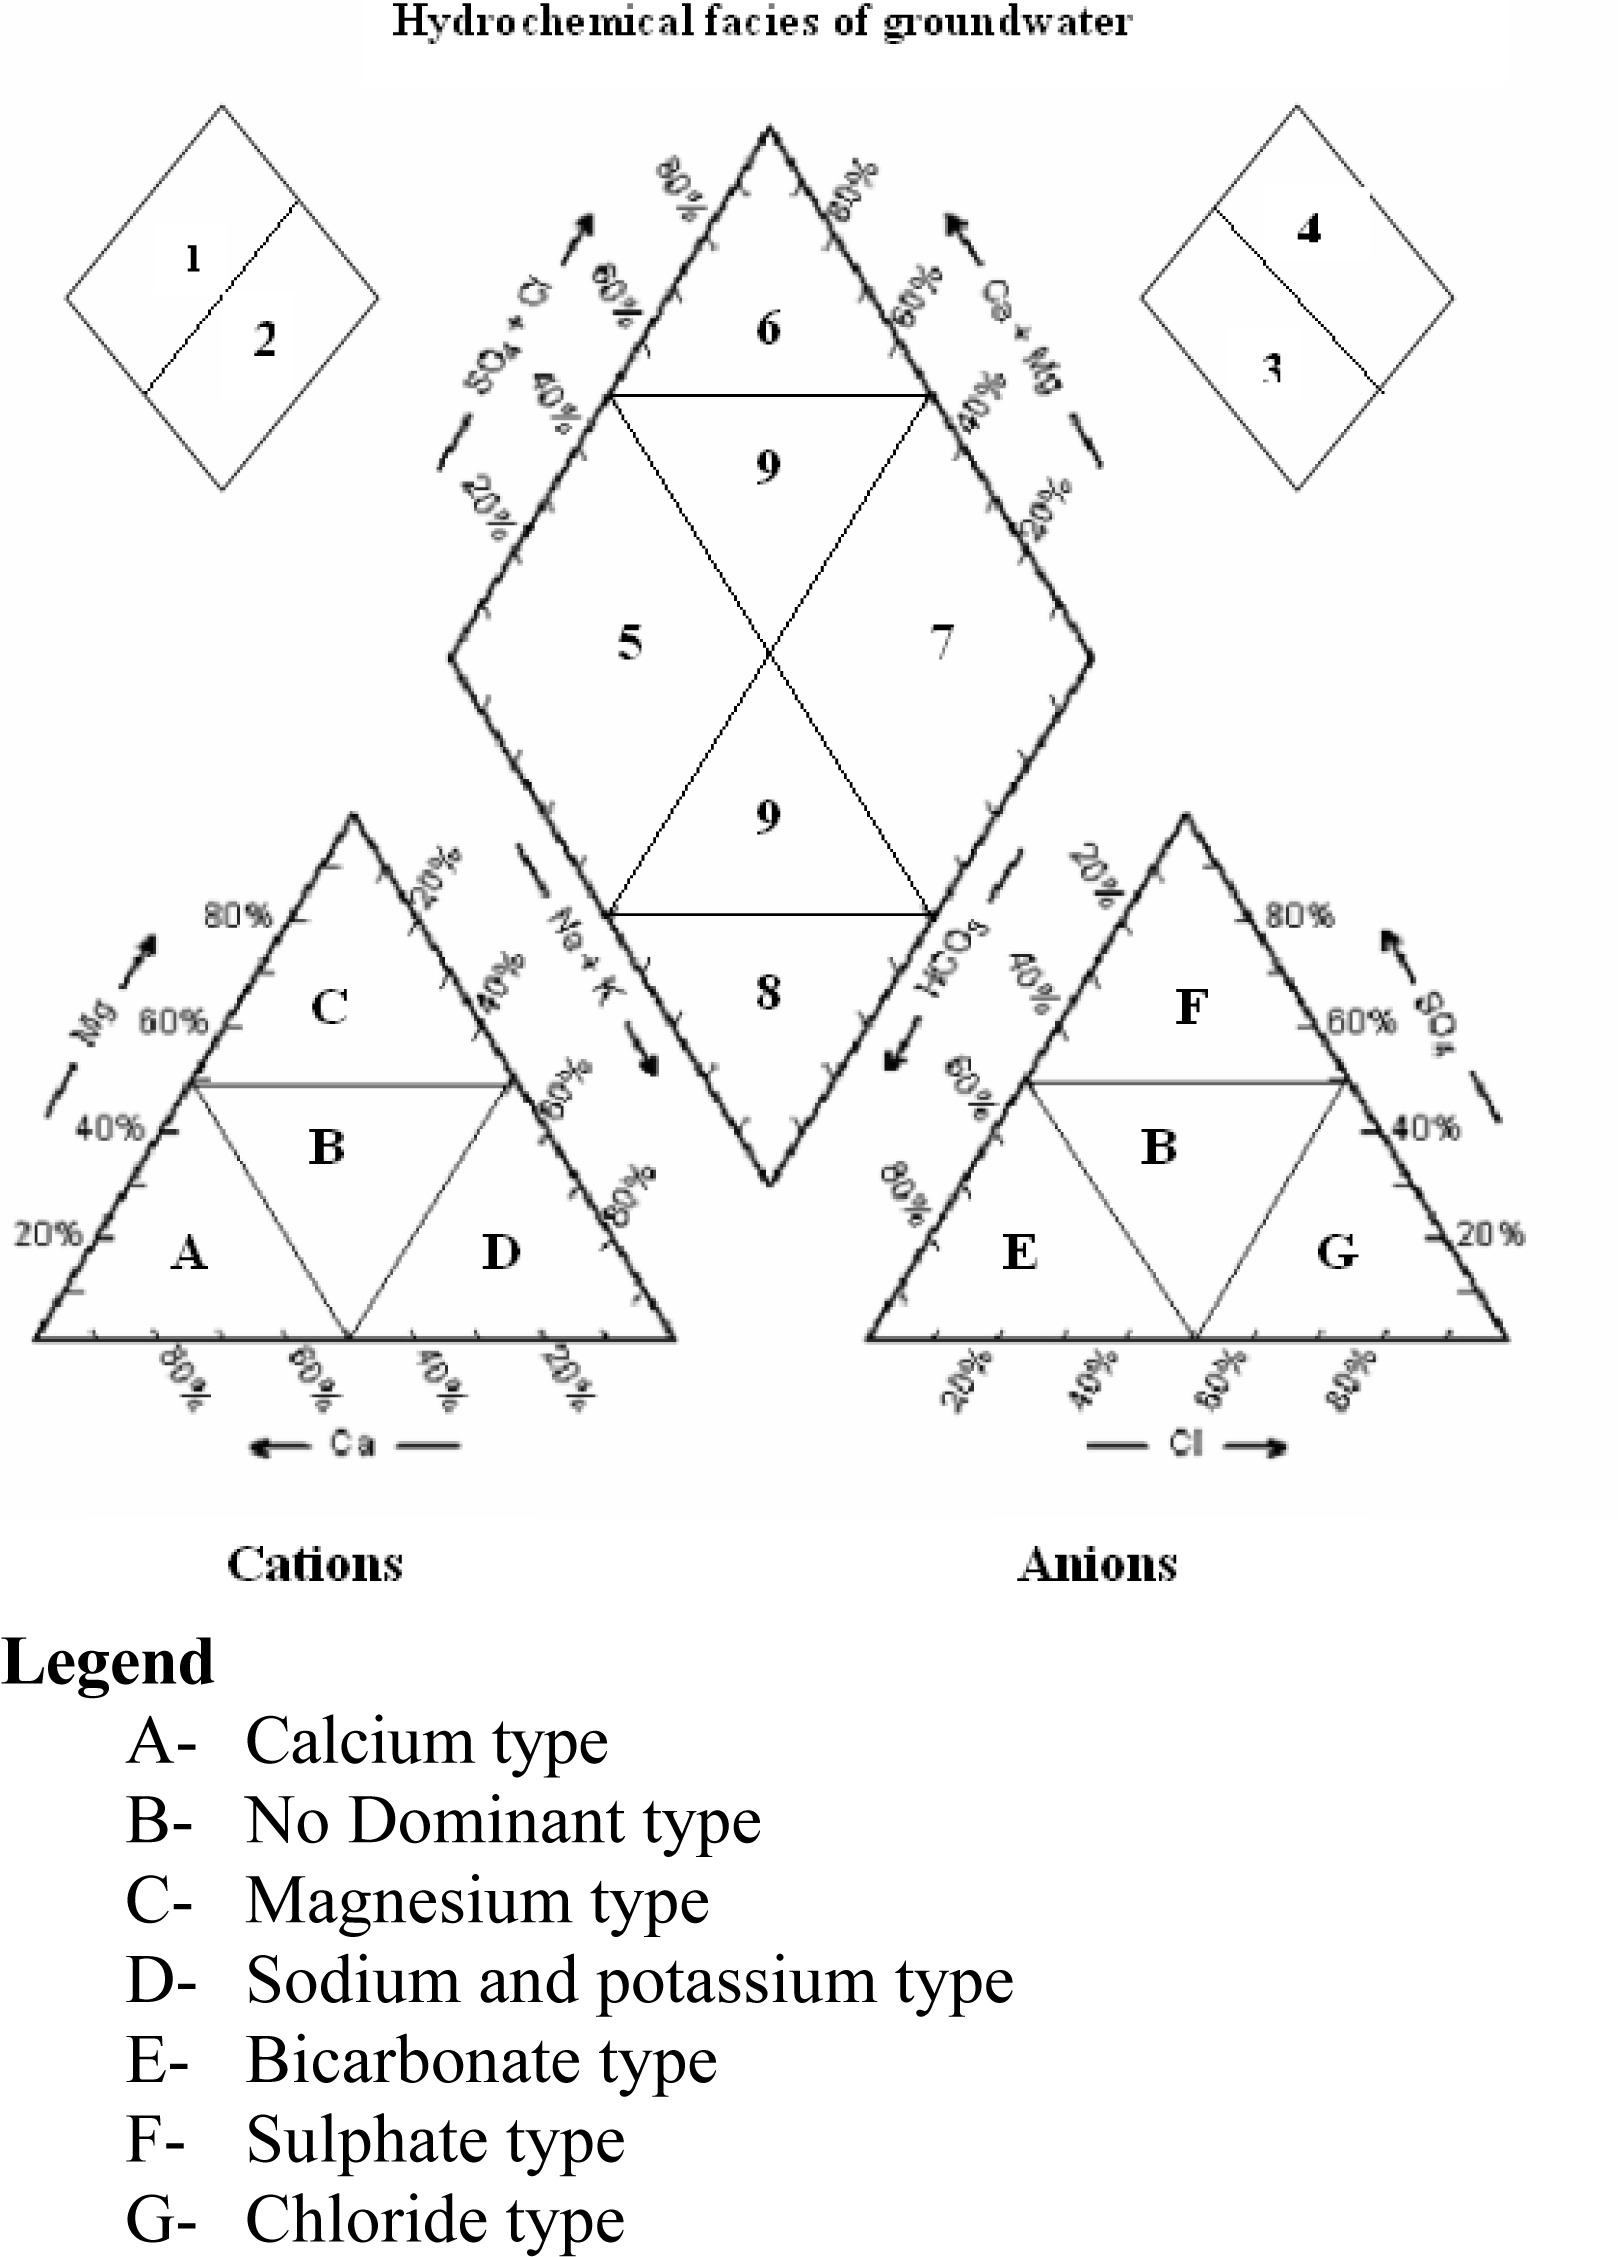
13] is used to infer hydro-geochemical facies. These plots include two triangles, one for plotting cations and the other for plotting anions. The cations and anion fields are combined to show a single point in a diamond-shaped field, from which inference is drawn on the basis of hydro-geochemical facies concept. These tri-linear diagrams are useful in bringing out chemical relationships among groundwater samples in more definite terms rather than with other possible plotting methods.
Chemical data of representative samples from the study area presented by plotting them on a Piper-tri-linear diagram for pre-and post-monsoon (figures 3 and 4). These diagrams reveal the analogies, dissimilarities and different types of waters in the study area, which are identified and listed in Table 2. The concept of hydrochemical facies was developed in order to understand and identify the water composition in different classes.
Facies are recognizable parts of different characters belonging to any genetically related system. Hydrochemical facies are distinct zones that possess action and anion concentration categories. To define composition class, Back and co-workers [14] suggested subdivisions of the tri-linear diagram (figure 5). The interpretation of distinct facies from the 0 to 10% and 90 to 100% domains on the diamond-shaped cation to anion graph is more helpful than using equal 25% increments. It clearly explains the variations or domination of cation and anion concentrations during pre-monsoon and post-monsoon. Ca-Mg-type of water predominated during pre-monsoon. The percentage of samples falling under Ca-Mg-type was 90 during pre-monsoon season. Similar type of water is predominated during post-monsoon also with 100 % water samples. For anion concentration, HCO3-type of water predominated during pre-monsoon with 87.5% samples and during post-monsoon with 91% samples. There is no significant change in the hydro-chemical facies noticed during the study period (pre- and post-monsoon), which indicates that most of the major ions are natural in origin. The reason is groundwater passing through igneous rocks dissolves only small quantities of mineral matters because of the relative insolubility of the rock composition.
Water hardness is caused primarily by the presence of cations such as calcium and magnesium and anions such as carbonate, bicarbonate, chloride and sulfate in water. Water hardness has no known adverse effects; however, some evidence indicates its role in heart disease [15]. Hard water is unsuitable for domestic use. In Tumkur region, the total hardness varies between 70 to 1060 ppm for the pre-monsoon (Jan–Feb 2006) period. For the post-monsoon period (Nov–Dec 2006), the value varies from 55 to 824 ppm. According to Sawyer and McCarty’s[16] classification for hardness, 26 samples fall under moderately hard class and 242 samples fall under hard and very hard class for pre-monsoon water samples. The hardness classification is given in Table 3. The suitability of groundwater for irrigation purposes depends upon its mineral constituents. The general criteria for judging the quality are: (i) Total salt concentration as measured by electrical conductivity (EC) (ii) Relative proportion of sodium to other principal cations as expressed by SAR, (iii) Bicarbonate (HCO3) and (iv) Boron.
Wilcox [17] classified groundwater for irrigation purposes based on per cent sodium and Electrical conductivity. Eaton [18] recommended the concentration of residual sodium carbonate to determine the suitability of water for irrigation purposes. The US Salinity Laboratory of the Department of Agriculture adopted certain techniques based on which the suitability of water for agriculture is explained.
The sodium in irrigation waters is usually denoted as per cent sodium and can be determined using the following formula [17].
% Na = ( Na + ) × 100 / ( Ca 2 + + Mg 2 + + Na + 1 + K + 1 )
where the quantities of Ca2+, Mg2+ Na+ and K+ are expressed in milliequivalents per litre (epm).
The classification of groundwater samples with respect to per cent sodium is shown in Table 4. It is observed that about 250 samples are excellent to good during pre-monsoon and 254 samples are excellent to good during post- monsoon. In waters having high concentration of bicarbonate, there is tendency for calcium and magnesium to precipitate as the water in the soil becomes more concentrated. As a result, the relative proportion of sodium in the water is increased in the form of sodium carbonate. RSC is calculated using the following equation.
RSC = ( HCO 3 + CO 3 2 ) ( Ca 2 + + Mg 2 + )
where all ionic concentrations are expressed in epm.
According to the US Department of Agriculture, water having more than 2.5 epm of RSC is not suitable for irrigation purposes. Groundwater of the study area is classified on the basis of RSC and the results are presented in Table 5 for both pre- and post-monsoon seasons. Based on RSC values, over 267 samples have values less than 1.25 and are safe for irrigation during pre-monsoon. During post-monsoon 272 samples were safe for irrigation. Only 2 samples in the pre-monsoon and 7 samples in the post-monsoon are fair.
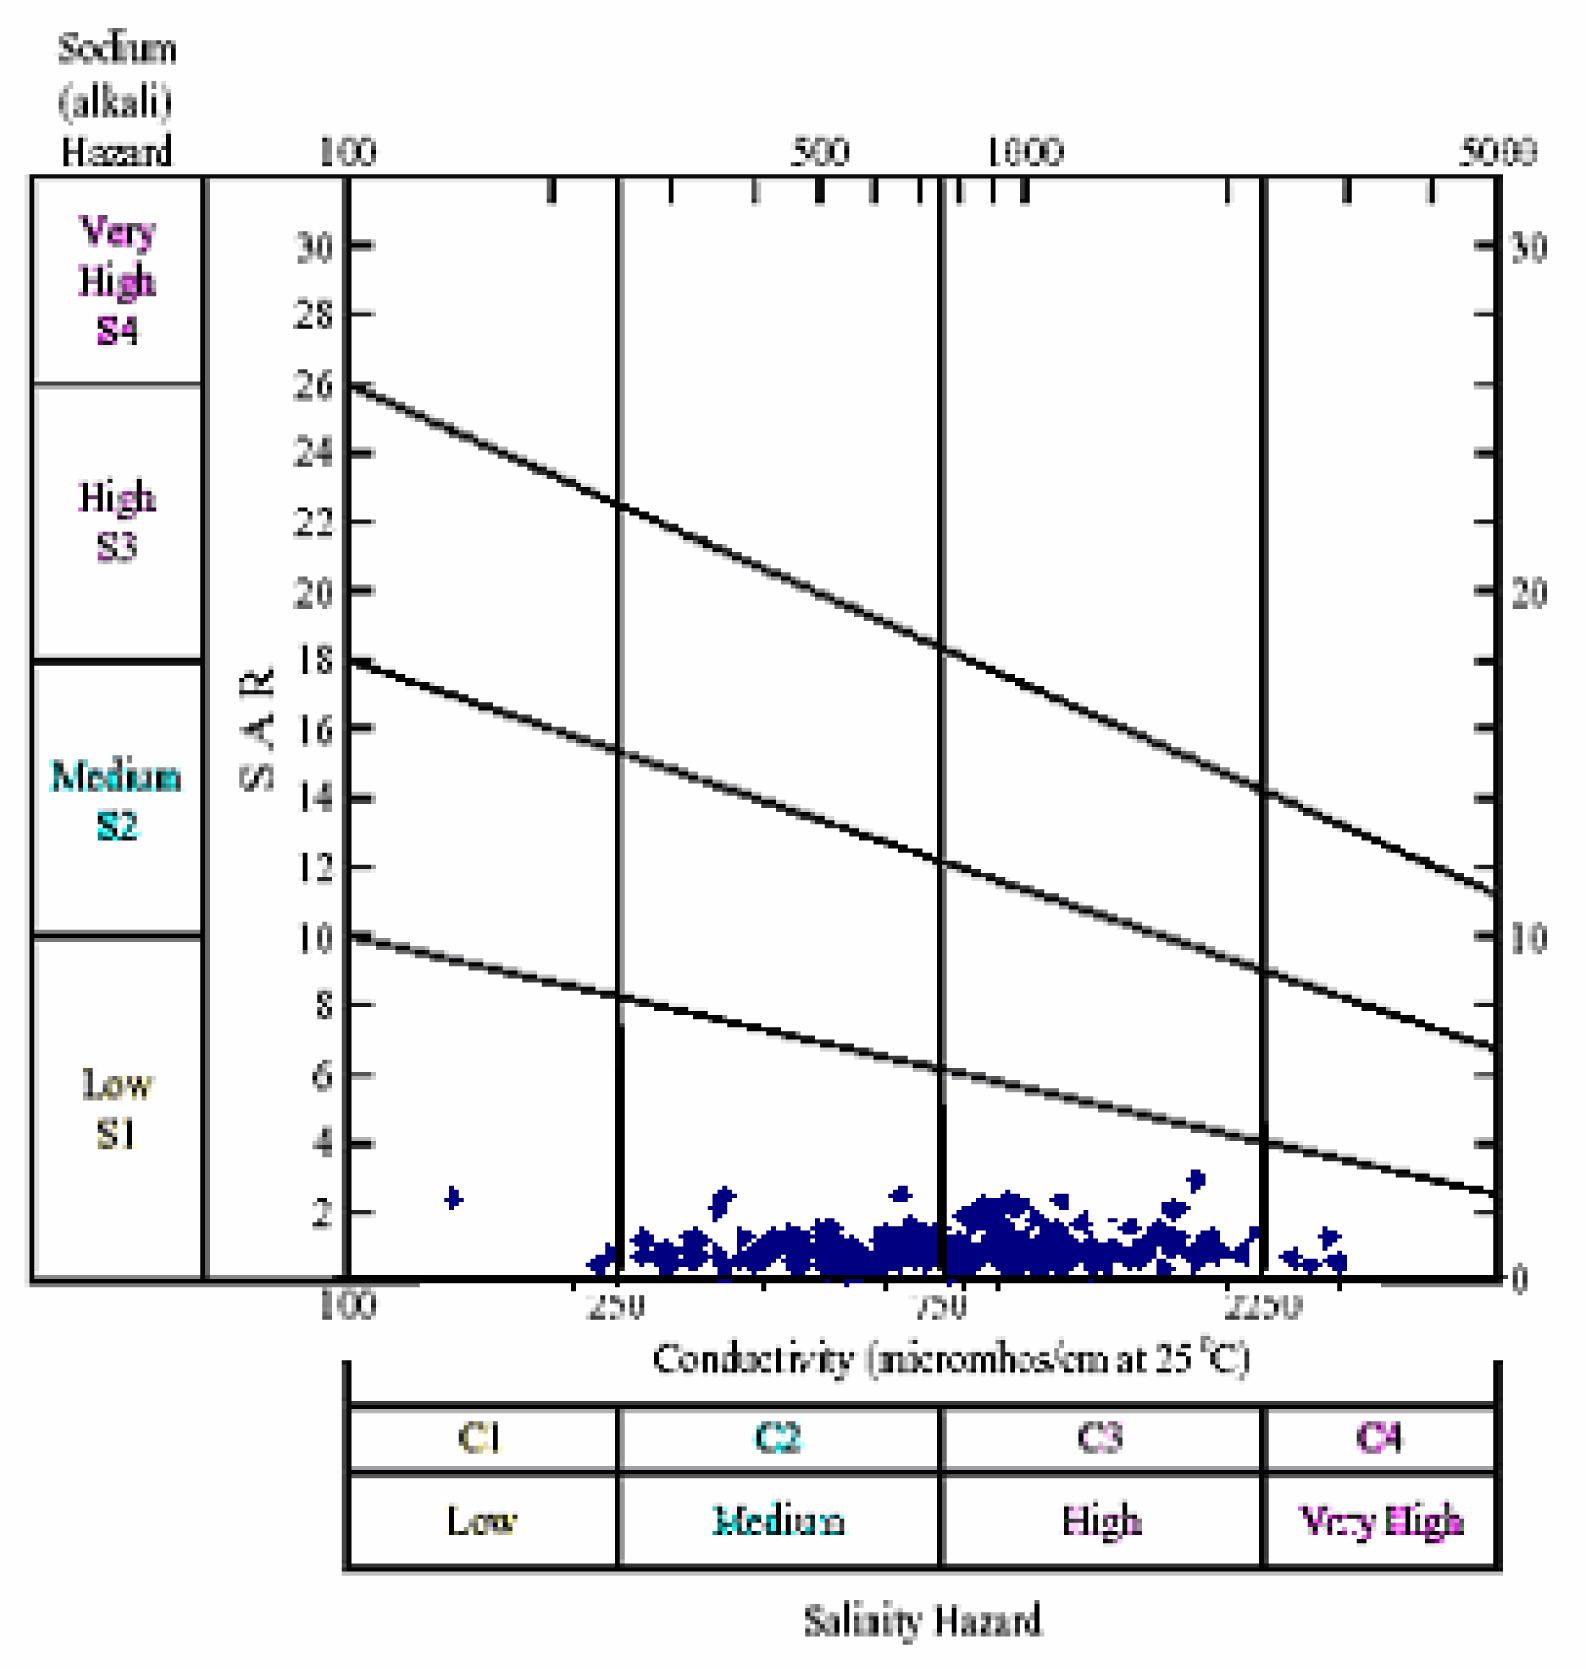
The most important characteristics of irrigation water in determining its quality are: (i) Total concentration of soluble salts; ii) Relative proportion of sodium to other principal cations; (iii) Concentration of boron or other element that may be toxic, and (iv) Under some condition, bicarbonate concentration as related to the concentration of calcium plus magnesium. These have been termed as the salinity hazard [17], sodium hazard, boron hazard and bicarbonate hazard. In the past, the sodium hazard has been expressed as per cent sodium of total cations. A better measure of the sodium hazard for irrigation is the SAR which is used to express reactions with the soil. SAR is computed as
SAR = Na + { Ca 2 + Mg 2 + 2 } 1 / 2
where all ionic concentrations are expressed in epm
The classification of groundwater samples from the study area with respect to SAR is represented in 
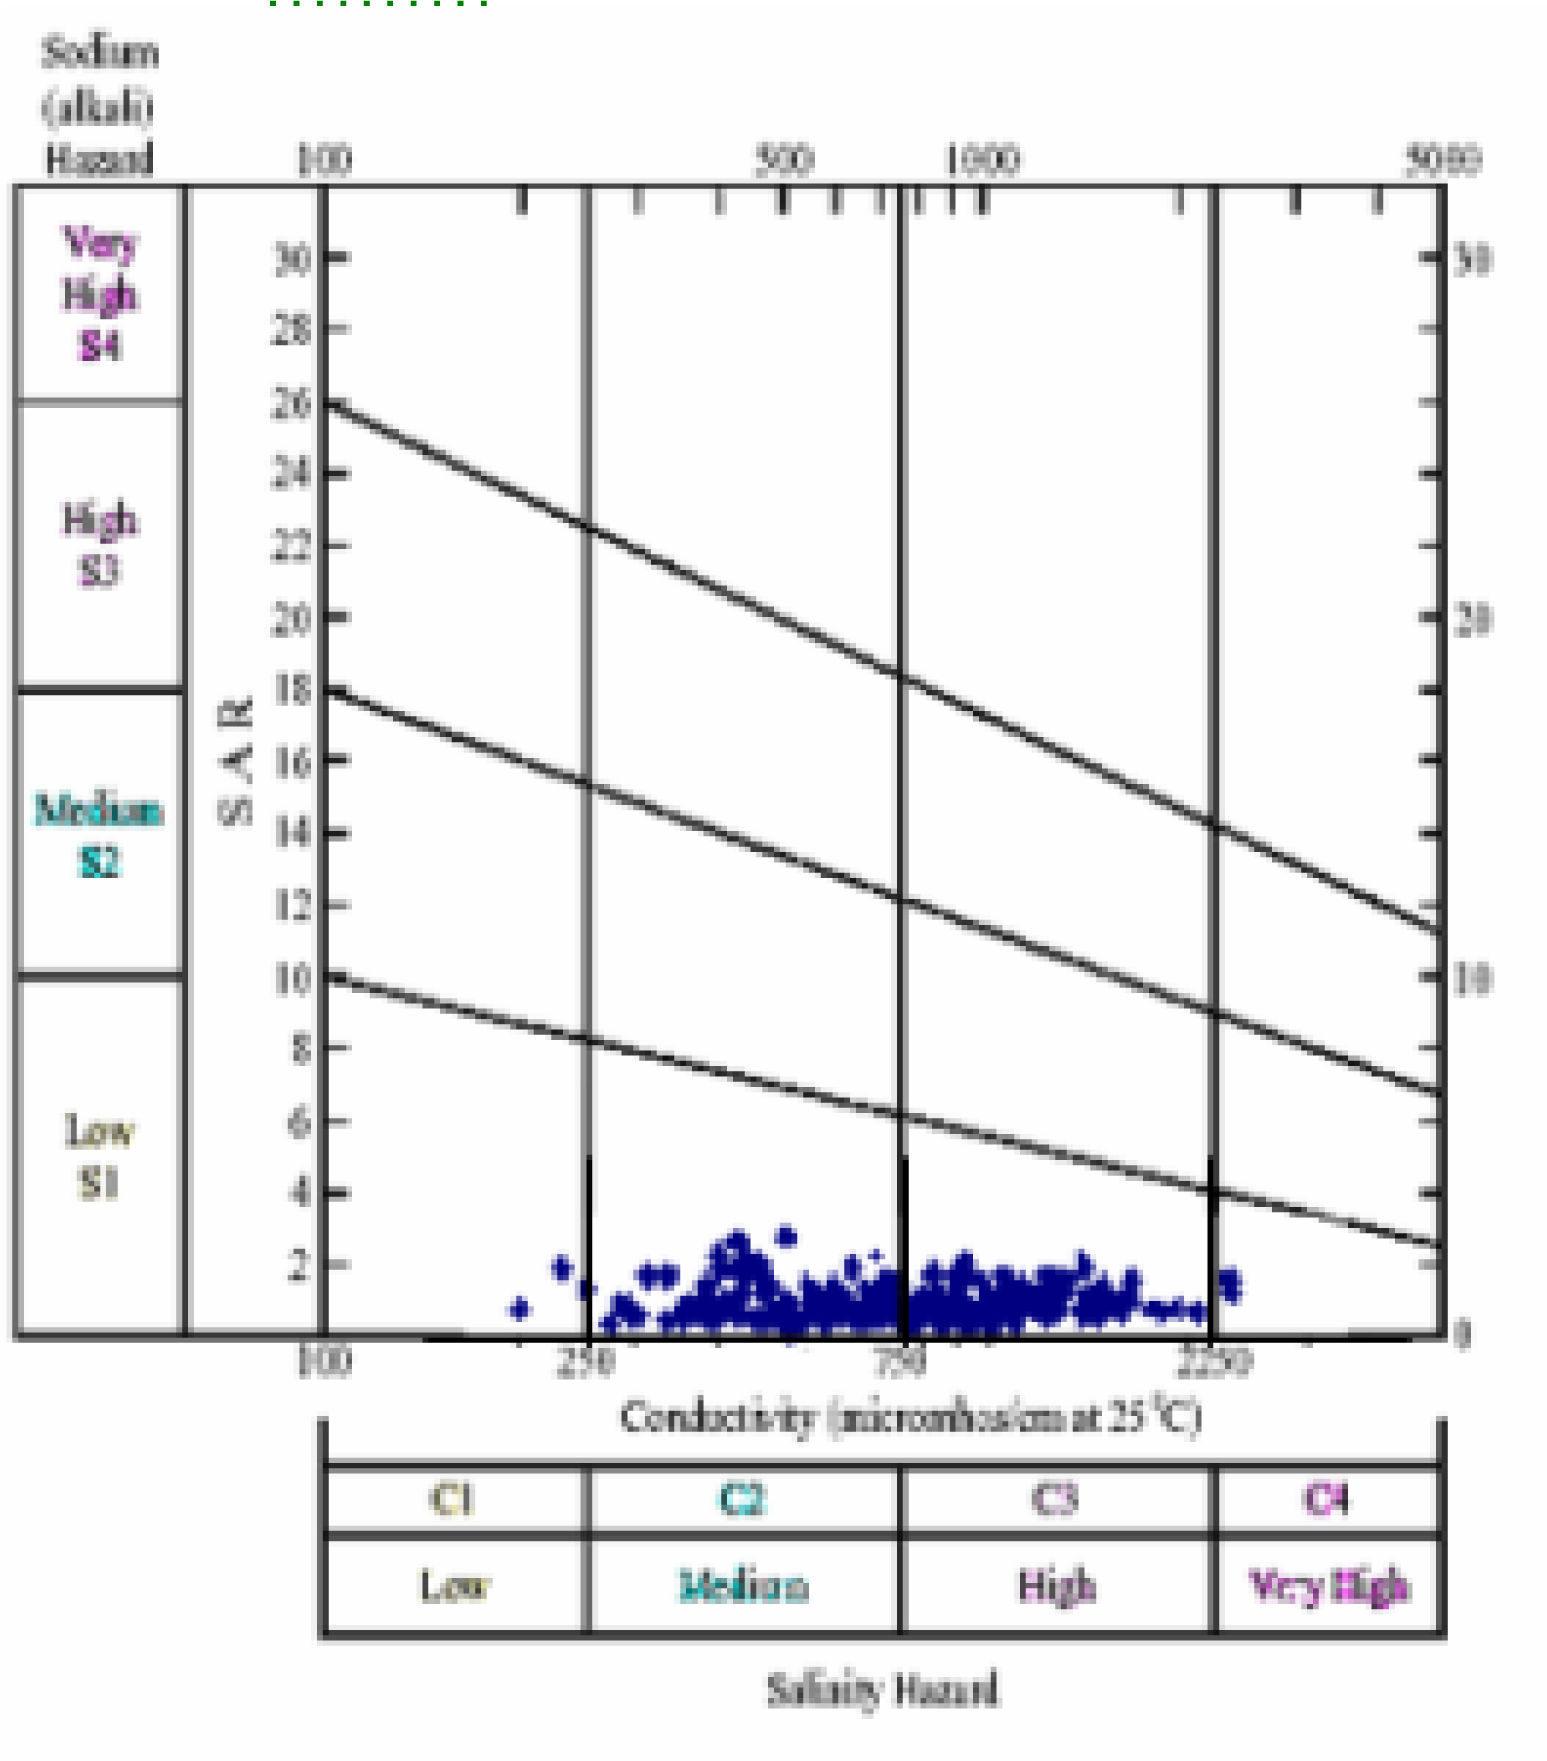
Table 6. During Pre- and post-monsoon, the SAR value of all the samples are found to be less than 10, and are classified as excellent for irrigation When the SAR and specific conductance of water are known, the classification of water for irrigation can be determined by graphically plotting these values on the US salinity (USSL) diagram (figure 6 & 7). The groundwater of Tumkur taluk is in general Ca-Mg-HCO3 type during both pre- and post monsoon seasons of the year 2006. About 98% of the samples are grouped within C2S1 and C3S1 classes in both pre- and post-monsoon (figure 6 & 7).
For the purpose of diagnosis and classification, the total concentration of soluble salts (salinity hazard) in irrigation water can be expressed in terms of specific conductance. Classification of groundwater based on salinity hazard is presented in table 7. It is found from the EC value, only 4 samples during pre-monsoon and 3 samples during post-monsoon were found to be unsuitable for irrigation purposes.
In Tumkur, Taluk, the groundwater is generally Ca-Mg-HCO3 type, which is mainly due to the geology of the area which comprises igneous rocks of crystalline nature, in which the major units are gneisses and granites. Ground water in the study area occurs under water table conditions in the weathered and fractured granite, Gneisses.

Conclusions

  • The type of water that predominates in the study area is Ca-Mg-HCO3 type during both pre-and post-monsoon seasons of the year 2006, based on hydro-chemical facies.
  • Though the suitability of water for irrigation is determined based on SAR, %Na, RSC and Salinity hazard, it is only an empirical conclusion. In addition to water quality, other factors like soil type, crop type, crop pattern, frequency and recharge (rainfall), climate, etc. have an important role to play in determining the suitability of water.
  • Water that is not suitable based on the above classification may be suitable in well-drained soils.
  • The suitability of water for irrigation is evaluated based on SAR, %Na, RSC and salinity hazards. Most of the samples in Tumkur, Taluk fall in the suitable range for irrigation purpose either from SAR, % Na or RSC values.
  • About 98% of the samples are grouped within C2S1 and C3S1 classes in both pre- and post-monsoon season (figure 6 & 7).
  • Most of the samples in Tumkur, Taluk fall in the suitable range for irrigation purpose from USSL diagram.
Figure 1:. Location map
Ijerph 05 00158f1
Figure 2:. Groundwater sampling locations
Ijerph 05 00158f2
Figure 3:. Post-monsoon groundwater samples plotted in piper-Trilinear diagram.
Ijerph 05 00158f3
Figure 4:. Pre-monsoon groundwater samples plotted in piper-Trilinear diagram
Ijerph 05 00158f4
Figure 5:. Classification diagram for anion and cation facies in the form of major-ion percentages. Water types are designed according to the domain in which they occur on the diagram segments.
Ijerph 05 00158f5
Figure 6:. USSL classification of groundwater during pre-monsoon
Ijerph 05 00158f6
Figure 7:. USSL classification of groundwater during post-monsoon
Ijerph 05 00158f7
Table 1:. Maximum and minimum concentration of major ions in groundwater samples
IonsPre-monsoon samples (mg l−1)Post-monsoon samples (mg l−1)

MinMaxMinMax
Na+141409109
K+1027036
Ca+21.6174.78174
Mg+20.24229.45.6169
CO3−210401030
HCO3−14555065602
Cl−14.566212340
SO4−20173.51.2142

Total hardness70106055824
Table 2:. Characterization of groundwater of Tumkur taluk of Karnataka on the basis of Piper tri-linear diagram
Subdivision of the diamondCharacteristics of corresponding subdivisions of diamond-shaped fieldsPercentage of samples in this category

Pre-MonsoonPost-Monsoon
1Alkaline earth (Ca+Mg) Exceed alkalies (Na+K)90100
2Alaklies exceeds alkaline earths100
3Weak acids (C03+HCO3) exceed Strong acids (SO4+Cl)87.591
4Strong acids exceeds weak acids12.59
5Magnesium bicarbonate type8191
6Calcium-chloride type03
7Sodium-chloride type30
8Sodium-Bicarbonate type00
9Mixed type (No cation-anion exceed 50%)166
Table 3:. Classification of water based on hardness by Sawyer and McCarthy
Hardness asWater classPre-monsoon samplesPost monsoon samples

CaCO3(ppm)
0–75Soft70 (1 sample)55–70 (3 samples)
75–150Moderate Hard104 – 150 (26 samples)95–150 (26 samples)
150–300Hard155 – 300 (160 samples)152–300 (196 samples)
>300Very hard304–1060 (82 samples)305–824 (54 samples)
Table 4:. Sodium percent water class
Sodium (%)Water classPre-monsoon SamplesPost-monsoon samples
<20Excellent3.34–19.80 (90 samples)7.38–19.94 (105 samples)
20–40Good20.04–39.92 (160 samples)20.25–39.88 (149 samples)
40–60Permissible40.07–57.25 (17 samples)40.48–59.90 (24 samples)
60–80Doubtful61.29–61.46 (2 samples)63.16 (1 sample)
>80Unsuitable--
Table 5:. Groundwater quality based on RSC (Residual sodium carbonate)
RSC (epm)Remark on qualityPre-monsoon samplesPost-monsoon samples
<1.25Good16.47 – 1.24 (267 samples)7.03 to 1.20 (272 samples)
1.25–2.5Doubtful1.46–1.55 (2 samples)1.27 to 1.60 (7 samples)
>2.5Unsuitable
Table 6:. Sodium hazard classes based on USSL classification
Sodium Hazard classSAR in Equivalents per moleRemark on qualityPre-monsoon samplesPost-monsoon samples

(Alakalinity)
S110Excellent0.11–3.54 (all 269 samples)0.30–3.52 (all 279 samples)
S210 – 18Good
S318–26Doubtful
S4 and S5>26Unsuitable
Table 7:. Salinity hazard classes
Salinity hazard classEC in (micro-mohs/cm)Remark on qualityPre-monsoon samplesPost-monsoon samples
C1100–250Excellent130–230 (3 samples)200–230 (2 samples)
C2250–750Good260–750 (129samples)270 – 750 (147 samples)
C3750–2,250Doubtful760–2200 (133samples)760 – 2050 (127 samples)
C4 & C5>2,250Unsuitable2500–3000 (4 samples)2270–2300 (3 samples)

Acknowledgments

The authors wish to acknowledge Dr. Shasidhar, Principal, SIT, Dr. M. N. Channabasappa, Director, S.I.T., for providing computer facilities to develop this program. Many thanks are extended to Dr. K. P. Shivananda, Head, Department of Civil Engineering, S.I.T., for his encouragement while preparing this paper.

References

  1. Kelley, WP. Permissible composition and concentration of irrigation waters. Proc. ASCE 1940, 66, 607. [Google Scholar]
  2. Wilcox, LV. The quality water for irrigation use. US Dept. Agric. Bull. 1948, 1962, 40. [Google Scholar]
  3. Handa, BK. Modified classification procedure for rating irrigation waters. Soil Sci 1964, 98, 264–269. [Google Scholar]
  4. Handa, BK. Modified Hill-piper diagram for presentation of water analysis data. Curr, Sci. 1965, 34, 131–314. [Google Scholar]
  5. Hem, JD. Study and interpretation of the chemical characteristics of natural water. USGS Water Supply Paper 1985, 2254, 117–120. [Google Scholar]
  6. Zaporozee, A. Graphical interpretation of water quality data, groundwater. 1972, 10, 32–43. [Google Scholar]
  7. Maucha, R. The graphic symbolization of the chemical composition of natural waters. Hiderol, Kozlony 1940, 29. [Google Scholar]
  8. Stiff, HA, Jr. The interpretation of chemical water analysis by means of patterns. J. Petrol. Technol. 1940, 3, 15–16. [Google Scholar]
  9. Subramanian. Hydro geological studies of the coastal aquifers of Tiruchendur, Tamil nadu. PhD thesis, Manonmanian sundaranar University,. Thiruneveli, 1994; p. 75. [Google Scholar]
  10. Todd, DK. Groundwater HydrologyWiley: New York, 1980, 2nd edn; p. 315. [Google Scholar]
  11. Director of Census Operations. District Census Handling of Karnataka. Census of India 1991. [Google Scholar]
  12. Standard method for examination of water and wastewater. American Public Health Association, NW, DC 20036 1994.
  13. Piper, AM. A graphic procedure I the geo-chemical interpretation of water analysis. USGS Groundwater Note no 1953, 12. [Google Scholar]
  14. Back, W; Hanshaw, BB. Advances in hydro-science. In chemical Geohydrology; Academic Press: New York, 1965; Volume 11, p. 49. [Google Scholar]
  15. Schroeder, HA. Relations between hardness of water and death rates from certain chronic and degenerative diseases in the United States. J. Chron disease 1960, 12, 586–591. [Google Scholar]
  16. Sawyer, GN; McCarthy, DL. Chemistry of sanitary Engineers, 2nd ed; McGraw Hill: New York, 1967; p. 518. [Google Scholar]
  17. Wicox, LV. Classification and use of irrigation waters; US Department of Agriculture: Washington Dc, 1995; p. 19. [Google Scholar]
  18. Eaton, EM. Significance of carbonate in irrigation water. Soil Sci 1950, 69, 12–133. [Google Scholar]
  19. Kumaresan, M. Riyazuddin: Major ion chemistry of environmental samples around sub- urban of Chennai city. Curr, Sci, 2006, 91(12). [Google Scholar]

