Qualitative Environmental Analysis for Industrial Districts Implantation Using Geoprocessing Techniques

Abstract
: Industrial districts became important instruments which are used by the Public Power to induce economic decentralization and create new development poles. For this reason the legislative process is an indispensable means to define the priorities in the uses of soil, also to conduct and follow the process of industrial registration. However, the industrial district establishment shall not be analyzed by taking into account just the economic factor, but also the environmental issue of the enterprise. Thus, this research has the objective of determining adequate places for industrial districts implantation, having as a pilot area the city of São Leopoldo, Rio Grande do Sul State, Brazil. A Geographic Information System for execution of spatial analysis and criteria creation on a large volume of environmental information will be used as a tool, which will be guided by the Municipal, State and Federal legislation and a Quickbird satellite image that covers the interest area. The main information used on this research are: altimeter, hydrography, soil use, pedology, geology and infrastructure. The results are visualized in scenarios modeled in accordance with the restrictions imposed upon the information, allowing at the end, to combine all scenarios and create through the multiple criteria method a map that indicates adequate places for implantation of industrial districts.Introduction
Since the 19th century, cities have been passing through a transformation without precedents that is strongly related to the high acceleration of industrialization in great world centers [1]. Since then processes of soil occupation and natural resources exploitation have evidenced a reality that shows no harmony with the concept of sustainable development, making it necessary a revaluation and replacement of the methods practiced in relation to planning the use of soil.
The United Nations Conference occurred on 1972 in Stockholm, began a world discussion about environmental questions related to pollution effects provoked by industries, visible since the Industrial Revolution, and intensified through the industrialization started on 1960, serving as base for the corrective process of institutional arrangement and planning of environmental policies in many countries. The environmental policies and guidelines began to grow in 90 decade with an integrator vision, transforming the industry in a key element for environment quality management [2].
São Leopoldo city belongs to Rio Grande do Sul state in Brazil, and even having a great environmental legislation, necessitate a legislative structure actualized and harmonized with the state and federal one. A substantial part of this legislation is previous the Federal Constitution from 1988 and the Environment State Code from Rio Grande do Sul state from 2000. The research objectives are to determine suitable places for industrial districts implantation in São Leopoldo city, using a Geographic Information System (GIS) as a tool to realize spatial analysis and create criterions on a large volume of environmental information, pondered by municipal, estate and federal legislations.
Materials and Methods
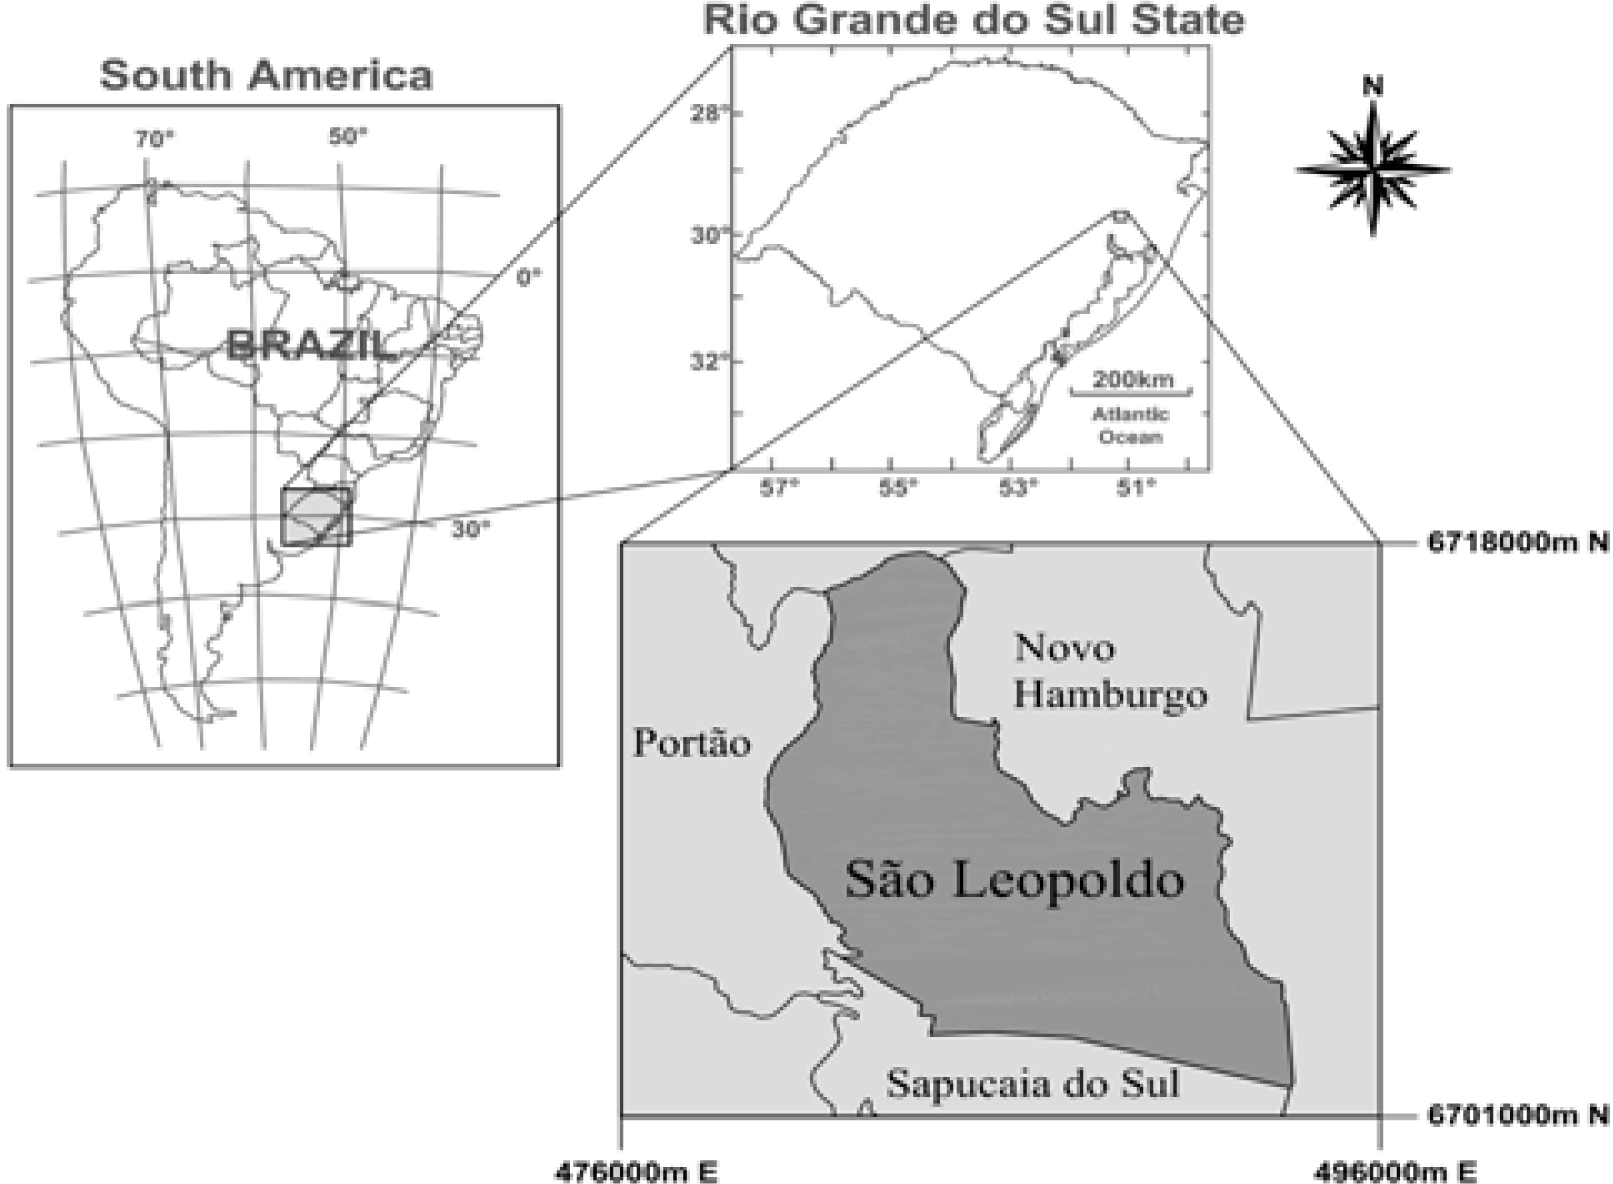
São Leopoldo has an area of 111.12 km2 and is located on the metropolitan region, 32 km to north from Porto Alegre capital, next to Estância Velha, Novo Hamburgo, Sapucaia do Sul and Portão cities (Figure 1). Situate between the geodetic coordinates 51°13′39″W, 29°49′48″S and 51°01′14″W, 29°38′59″S, in depression of Rio dos Sinos hydrographic basin, where occur a large plain, constituent by wetlands and inundate areas [3].
For this research the following materials and programs were used:
Quickbird satellite image with a spatial resolution of 0.6m, from year 2005;
Altimeter map of isolines with a vertical equidistant of 5 m – 1:10,000;
Geologic map – 1:100,000 [4];
Soil use map – 1:10,000;
Pedologic map – 1:25,000 [5];
Hydrographic map – 1:10,000;
Infrastructure map (Main roads) – 1:10,000;
Environment state code;
Brazilian Forest Code [8];
Director Plan of São Leopoldo [9];
Environment Plan of São Leopoldo [3];
Municipal Organic Law [10];
GIS - software ArcGIS 8.3 and SPRING 4.2;
Microsoft Access database;
1 pair of GPS receptor model LEICA SR-9400 (Simple frequency);
Software SKI – 2.35 for GPS data process.
GIS allows combining information and executing spatial analysis, where the results are visualized on scenarios modeled in accordance with imposed restrictions over information. All maps used in this research are associated with the SIRGAS geodetic system (South American Geocentric Reference System) in the UTM projection (Universal Transverse Mercator). The georeference accuracy is supported by a geodetic network, with 30 points implanted in the municipality.
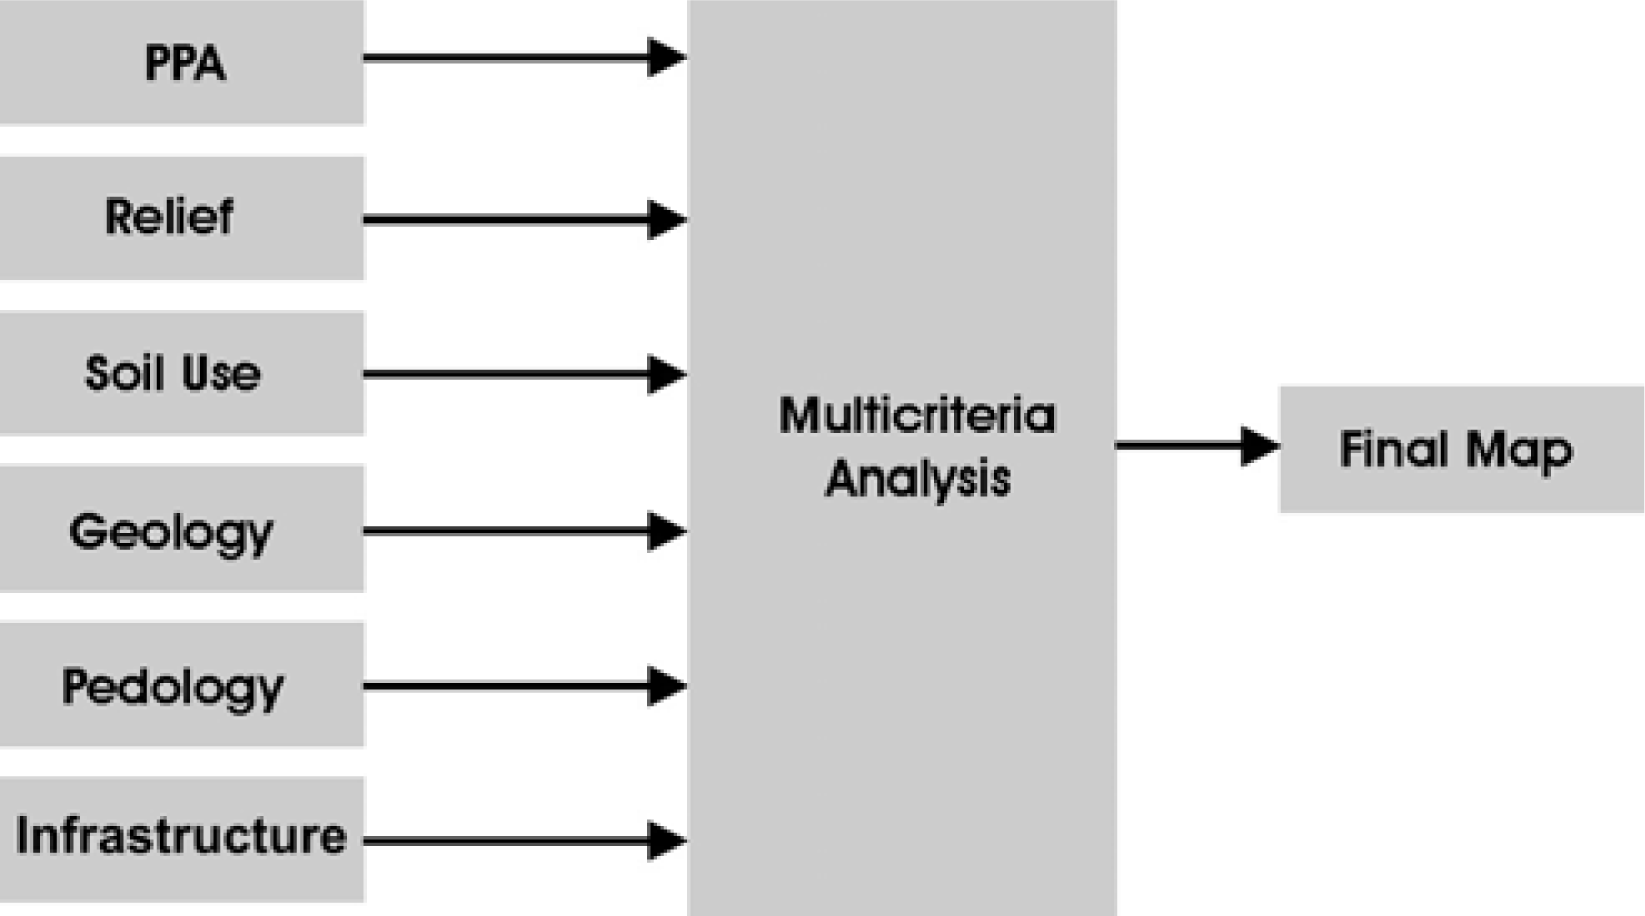
A summary of spatial analysis executed on the definition process of suitable areas for industrial districts implantation could be visualized on Figure 2.
To compose the final map, were combined, guided by the multicriteria analysis, the following maps: six maps of Permanent Preservation Areas (PPA), a relief map (slope classes), a soil use map, a pedologic map, a geologic map and an infrastructure map (with the main access roads from municipality).
The use of multicriteria analysis as a tool for alternatives valuation is an appropriate method to develop scenarios through many combined hypothesis. The territory capability for industrial use could be measured through criterions or set of criterions that are associated with different themes. These criterions could be organized in groups or levels of analysis, and combined through attribution of different importance rates or weights.
The scale applied to the classes that will be presented on next section, uses the method based on weights from 0 to 5: 5 – best; 4 – good; 3 – medium; 2 – bad; 1 – worst; 0 – unsuitable [11, 12].
Results and Discussions
Relief Map
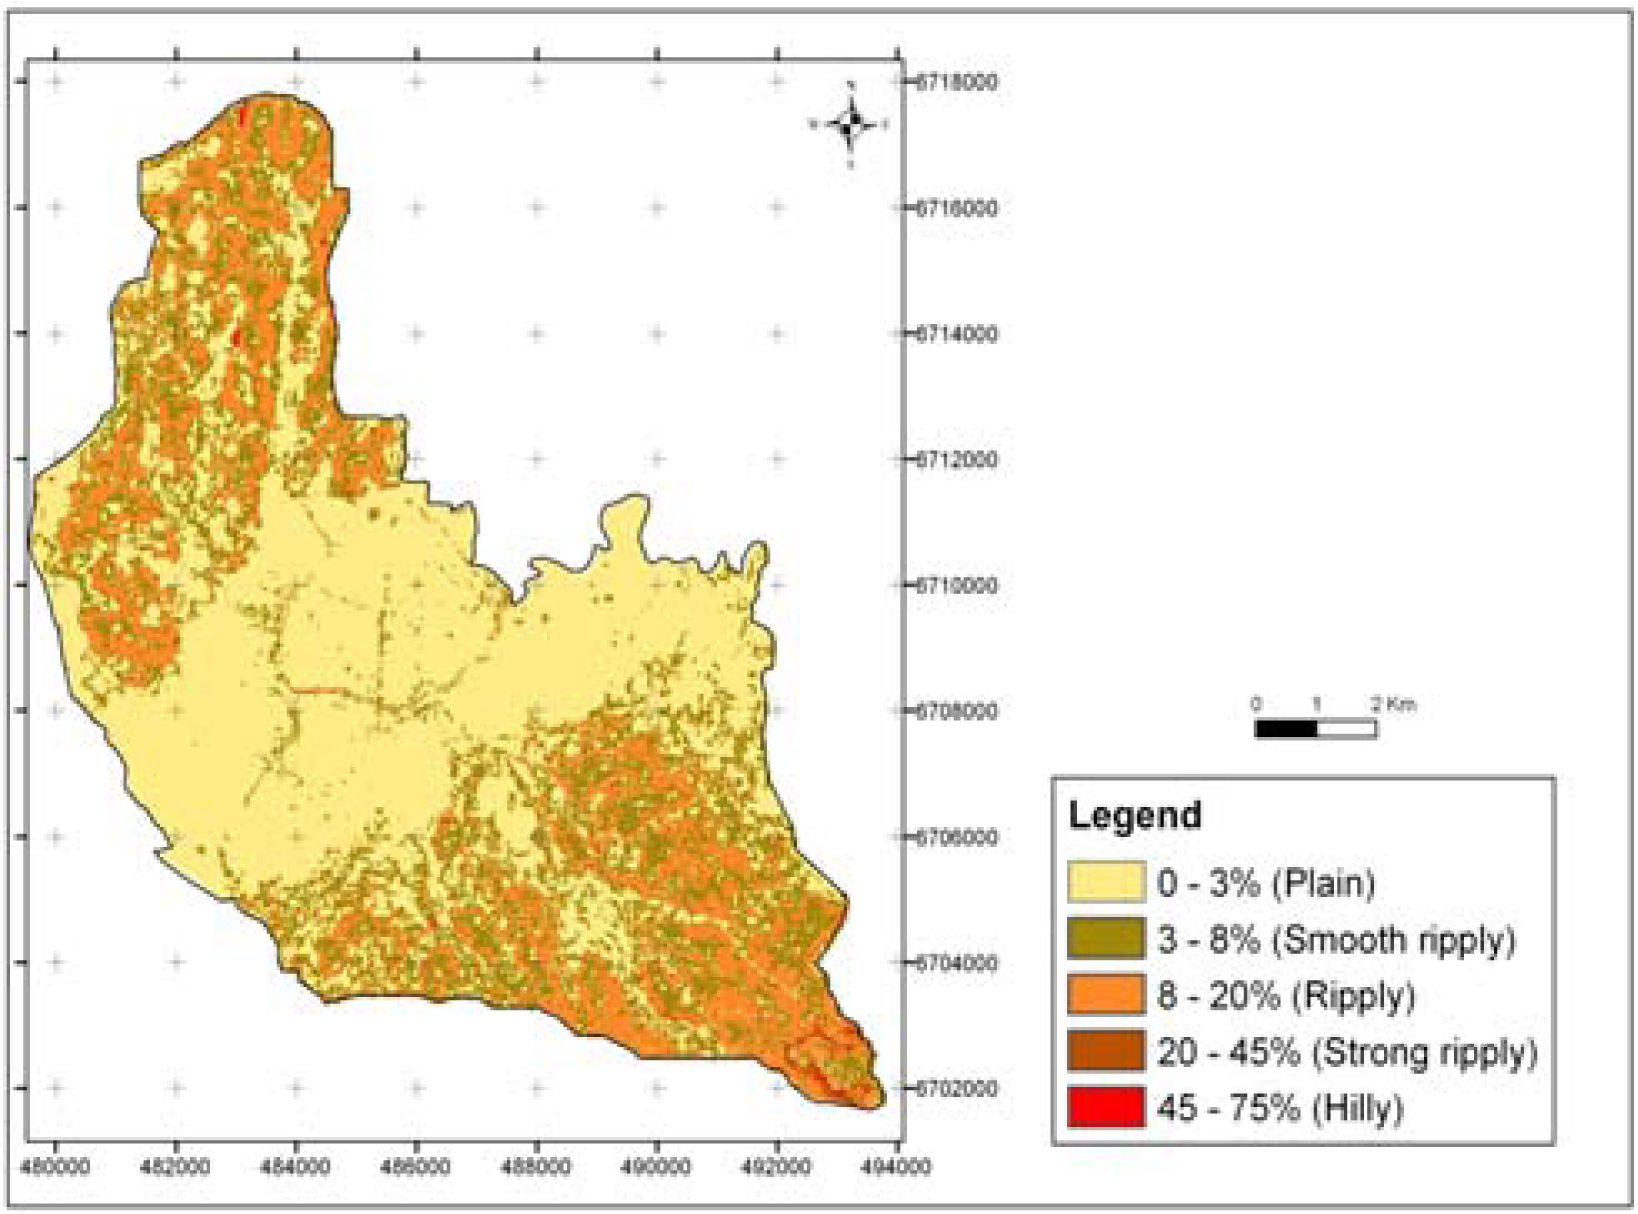
To establish a declivity classification and weights definition for multicriteria analysis, were adopted the relief classes proposed by Brazilian Soil Classification System [13], represented on Figure 3. Below are presented the characteristics of each relief class and it proposed weight:
Plain: declivity from 0 to 3% - Weight: 5;
Smooth ripply: declivity from 3 to 8% - Weight: 4;
Ripply: declivity from 8 to 20% - Weight: 3;
Strong ripply: declivity from 20 to 45% - Weight: 2;
Hilly: declivity over 45% - Weight: 0.
The relief map shows that more than a half of the municipality, 61.45 km2 (55% of territory), is occupied by best areas for industrial districts implantation, considering declivity factor. The other classes occupy the following areas: smooth ripply 26.97 km2 (24.27%); ripply 21.44 km2 (19.29%); strong ripply 1.16 km2 (1.04%); and hilly 0.41 km2 (0.4%).
Soil Use
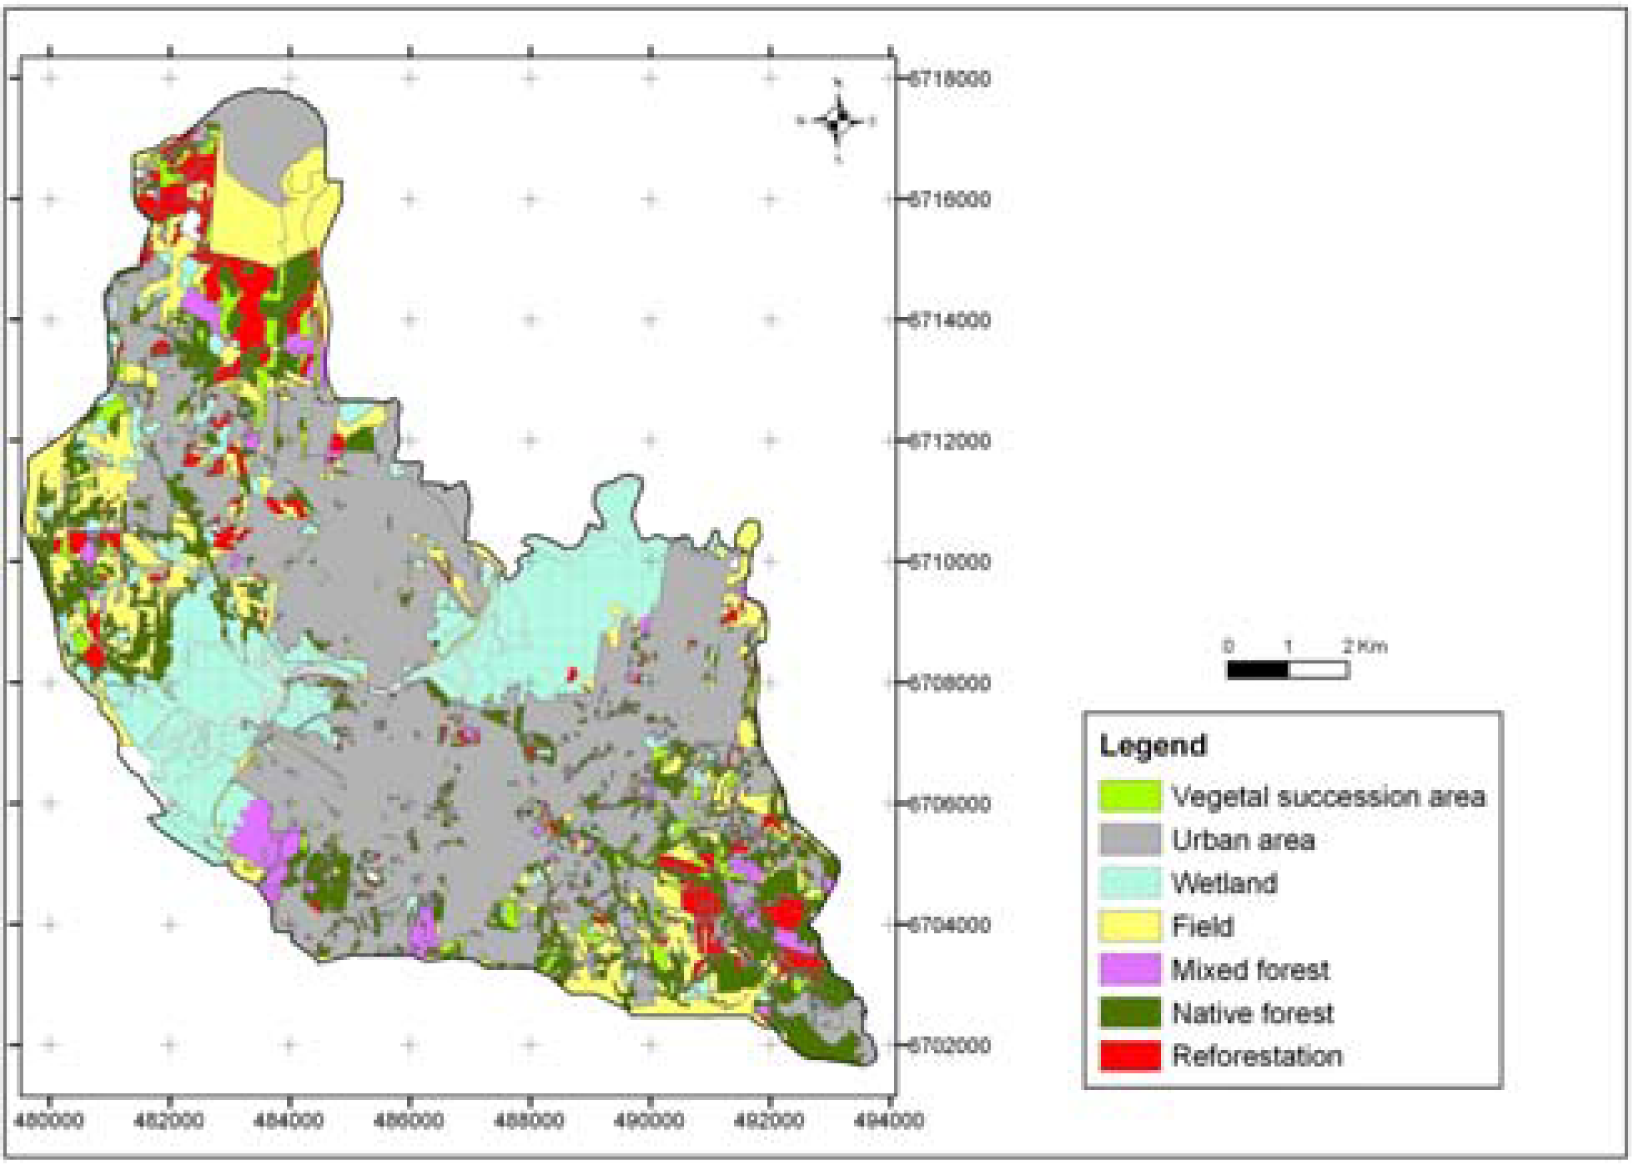
Below are described the soil use classes with their respective weights for multicriteria analysis [14]:
Vegetal succession area: represents the initial reoccupation process of space by vegetation. Weight 2. This class occupies an area of 2.4 km2 (2.6% of the territory);
Urban area: comprehended by constructed areas. Weight 2. It occupies an area of 46.77 km2 (42.09% of the territory);
Wetland: permanently or temporally flood areas. Weight 0, because are law protected areas. It occupies an area of 19.07 km2 (17.16%);
Field: composed by fields, exposed soils and deforests areas. Weight 5, because doesn’t have legal restrictions. Is occupies an area of 17.75 km2 (15.43%);
Mixed forest: vegetation constituted by native and exotic species. Weight 2, but its use must be carefully evaluated. This class occupies an area of 3.28 km2 (2.95%);
Native forest: inserted on Atlantic forest domain. Weight 0, because are law protected areas. Native forests occupy an area of 15.4 km2 (13.86%);
Reforestation: vegetation constituted by exotic species. Weight 4, because doesn’t have legal restrictions. Is occupies an area of 5.38 km2 (4.84% of the territory).
The soil use classes’ distribution could be seen in Figure 4.
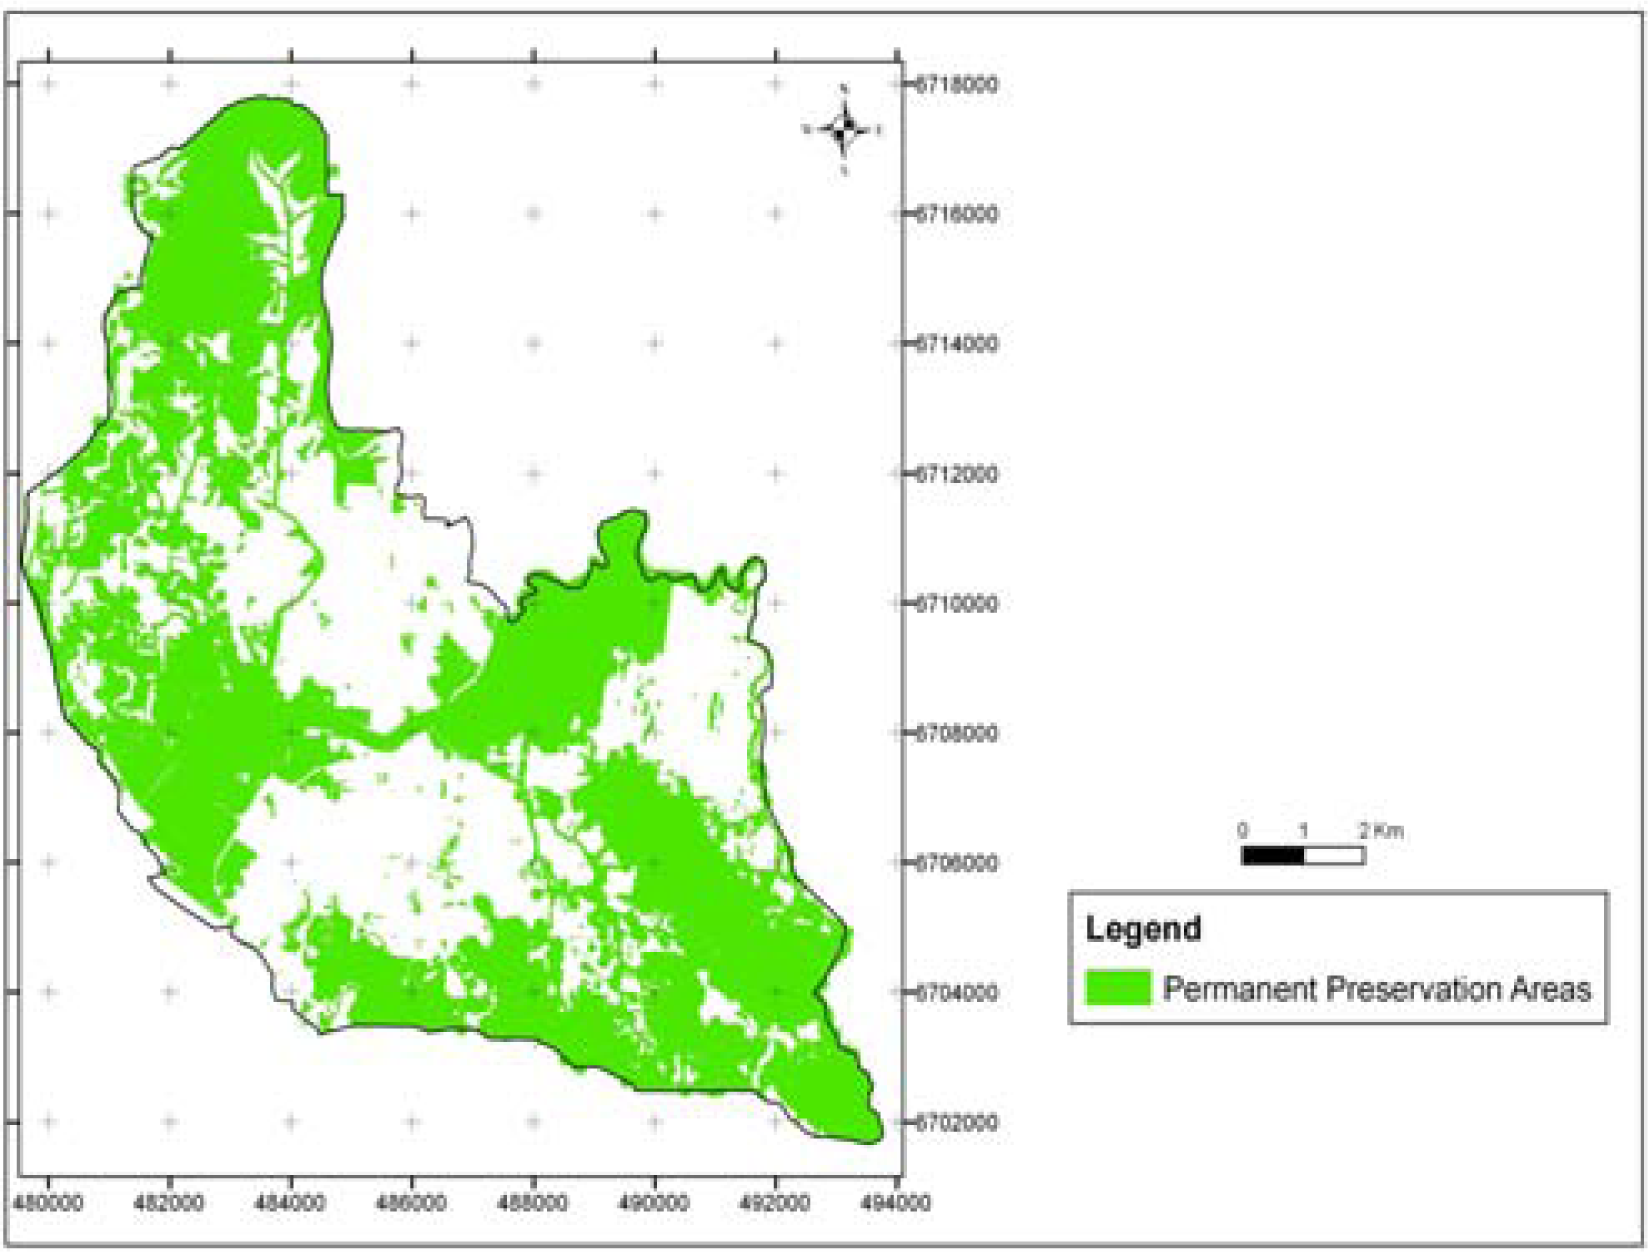
Permanent Preservation Area
The criteria used to delimit Permanent Preservation Areas (PPA) were based on CONAMA resolutions [6,7], Brazilian Forest Code [8] and Municipal Organic Law [10].
To define the PPA at scale 1:10,000, were used altimetric, hydrographic and soil use maps.
The PPA total area occupy 65.56 km2, corresponding to 58.99% of São Leopoldo territory. Where PPA of slope superior third (top line) respond, singly, by the larger extension (22.97%) of protected areas, consecutive by the wetlands category (17.22%), native forests (13.52%), along the rivers courses (12.34%), around the fountainheads (7.77%) and hill tops (2.5%). It is important to observe that these classes could be overlapped.
The PPA total area distribution could be visualized in Figure 5.
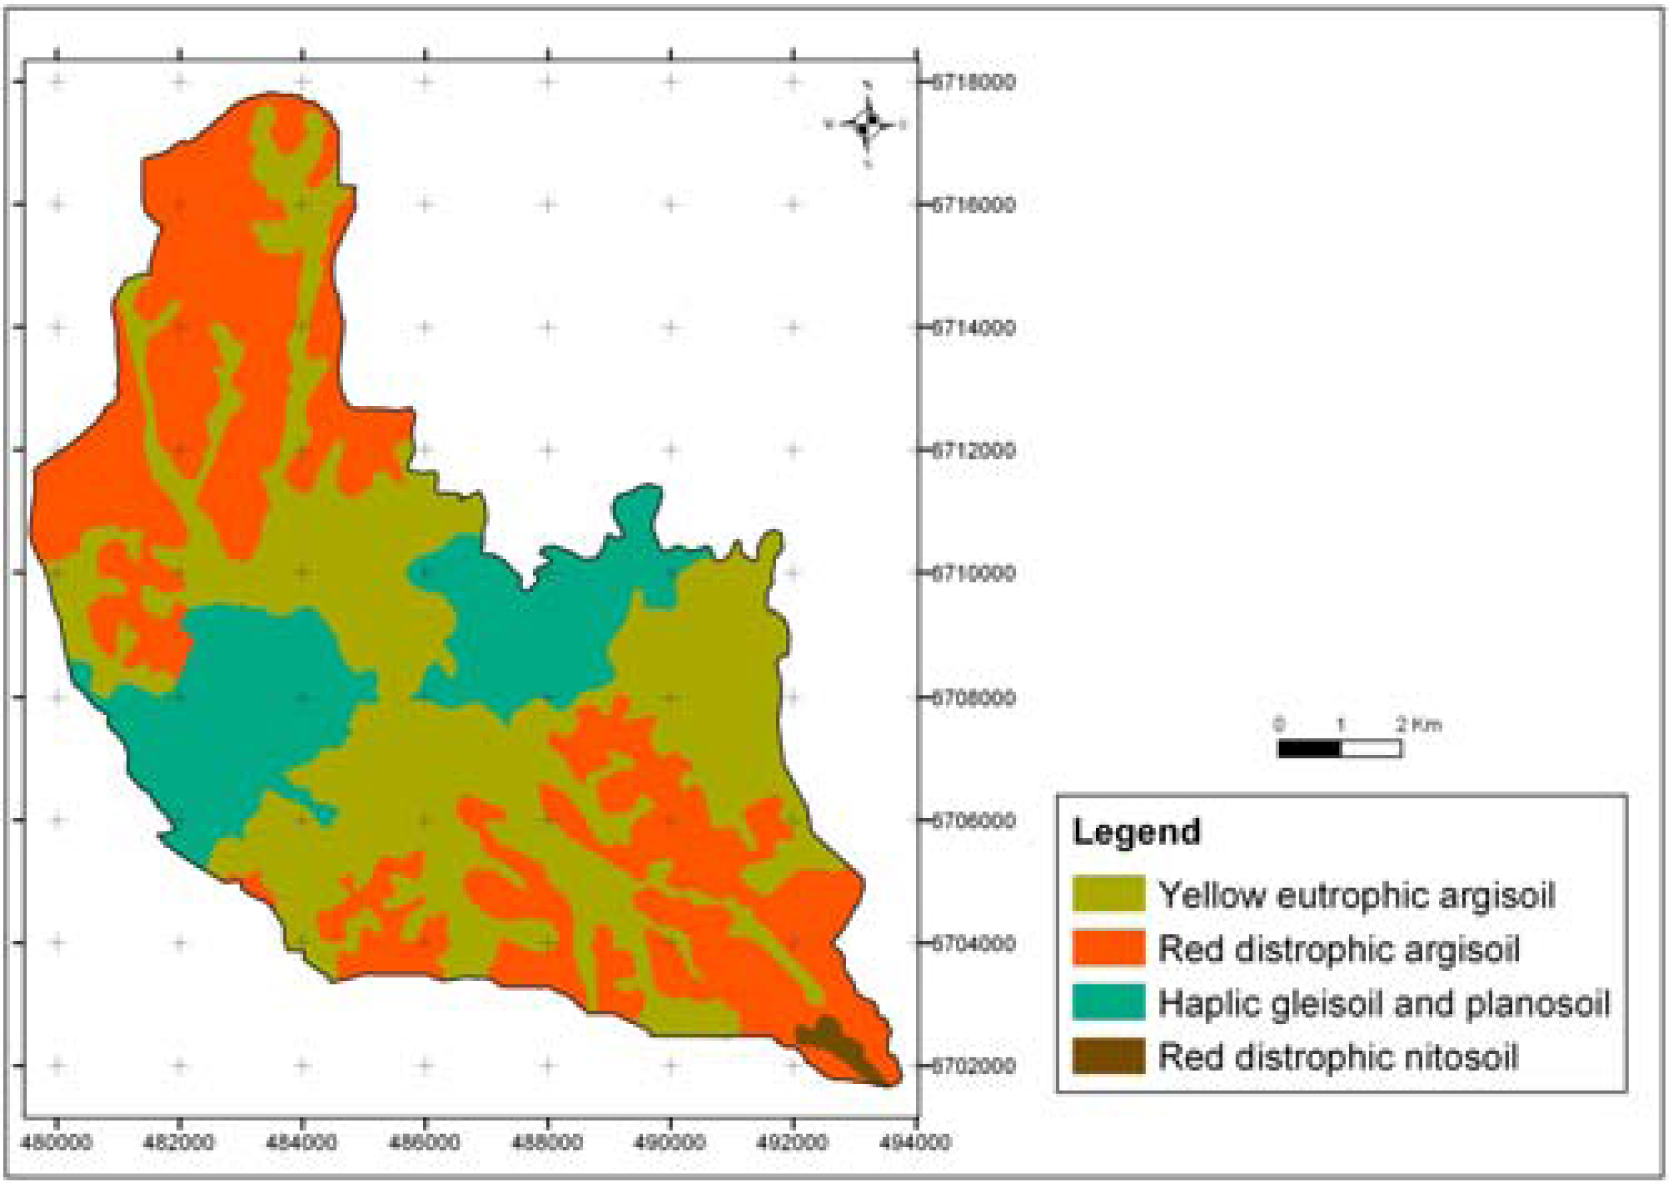
Pedology
In agreement with the scale of survey, were identified four types of soil [5]: yellow eutrophic argisoil (48.89 km2 of the territory), red distrophic argisoil (41.8 km2), haplic gleisoil and planosoil (19.81 km2) and red distrophic nitosoil (0.61 km2).
Below are presented the proposed weights for each type of soil, considering groundwater contamination propensity [5, 13, 15]:
Yellow eutrophic argisoil: Weight 2, because it has a permeability > 10−3 cm/s;
Red distrophic argisoil: Weight 3, because it has a permeability = 10−4 cm/s;
Haplic gleisoil and planosoil: Weight 1, because though they have a permeability = 10−4 cm/s, these types of soils occur in wetlands, where high investments in infrastructure are necessary;
Red distrophic nitosoil: Weight 4, because it has a permeability = 10−5 cm/s.
Figure 6 presents the pedologic distribution in São Leopoldo city.
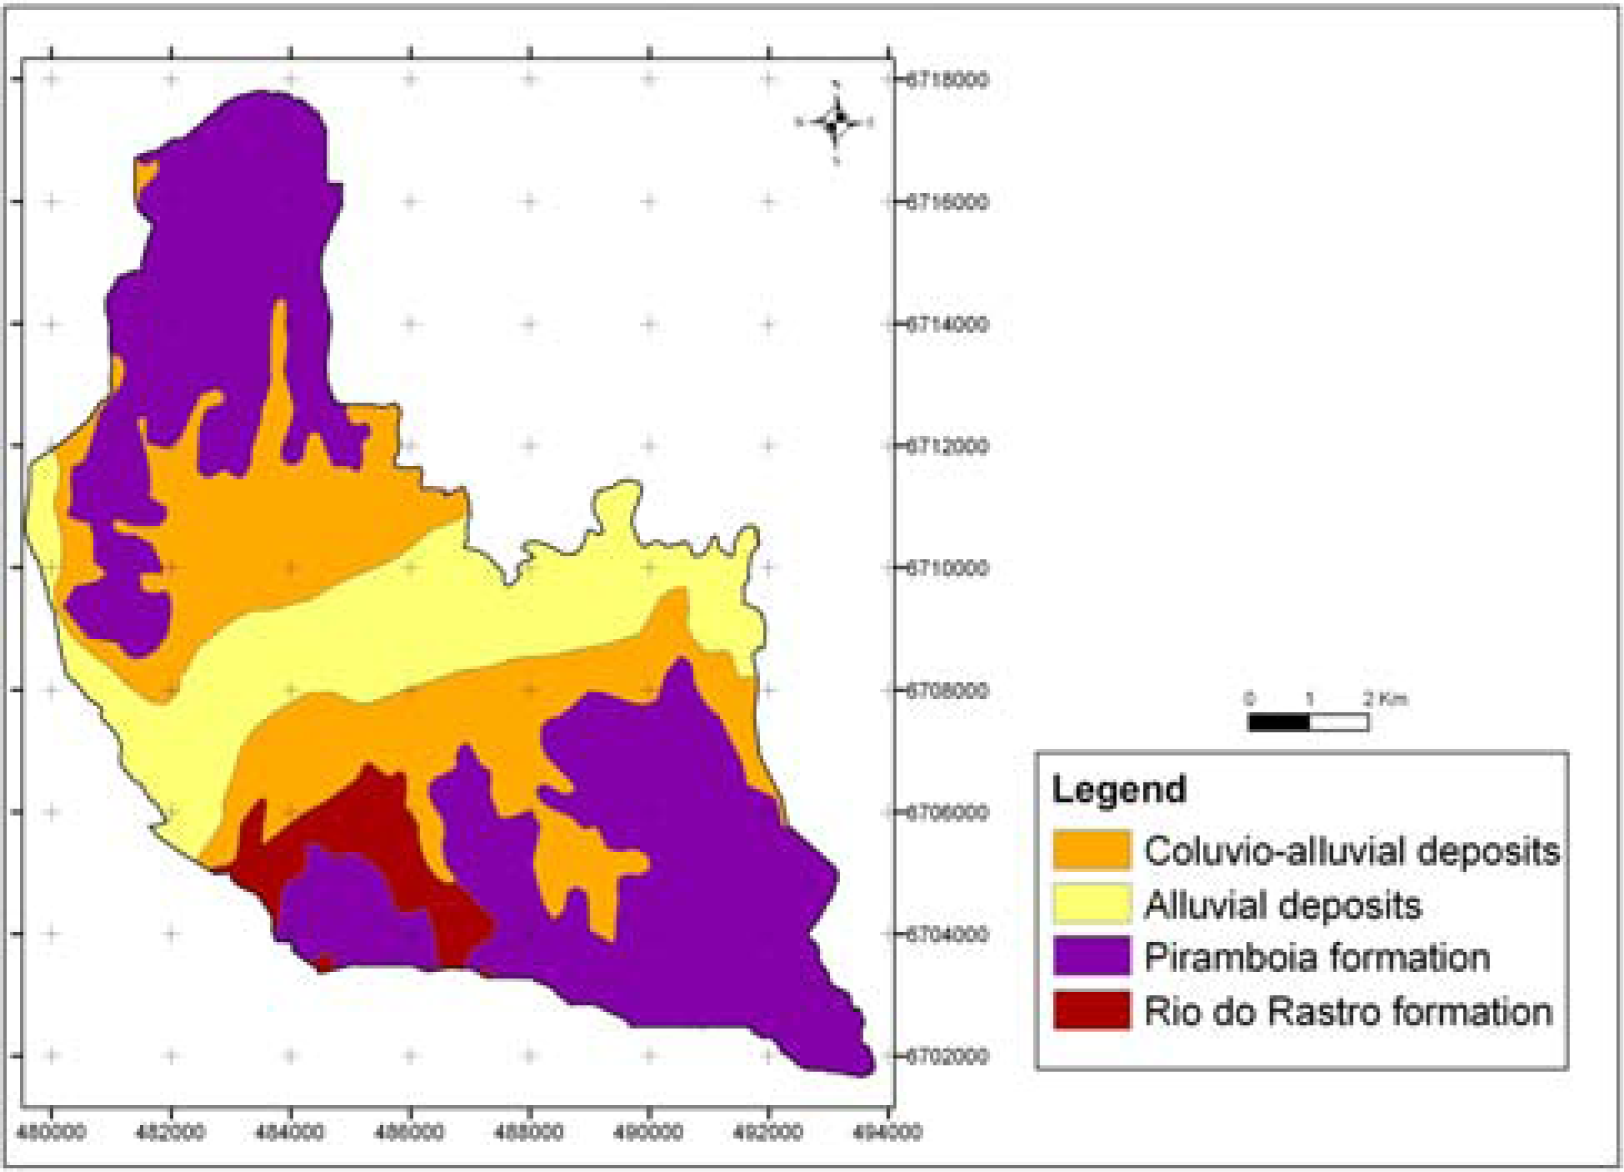
Geology
Considering that the geologic map is at scale 1:1,000,000, its detailing level on metropolitan region, allows to using it at scale 1:100,000 [4]. The geologic distribution could be seen in Figure 7.
Below are presented the proposed weights for each type of formation, considering groundwater contamination propensity:
Rio do Rasto formation: Weight 4, because is low permeable and absent of aquifer;
Piramboia formation: Weight 3, though it has an important freatic layer that could be easy contaminated;
Alluvial deposits: Weight 1, because this formation works as a superficial flow-off;
Coluvio-alluvial deposits: Weight 2, because this formation has a high risk of contamination, but is a bit less than the alluvial deposits.
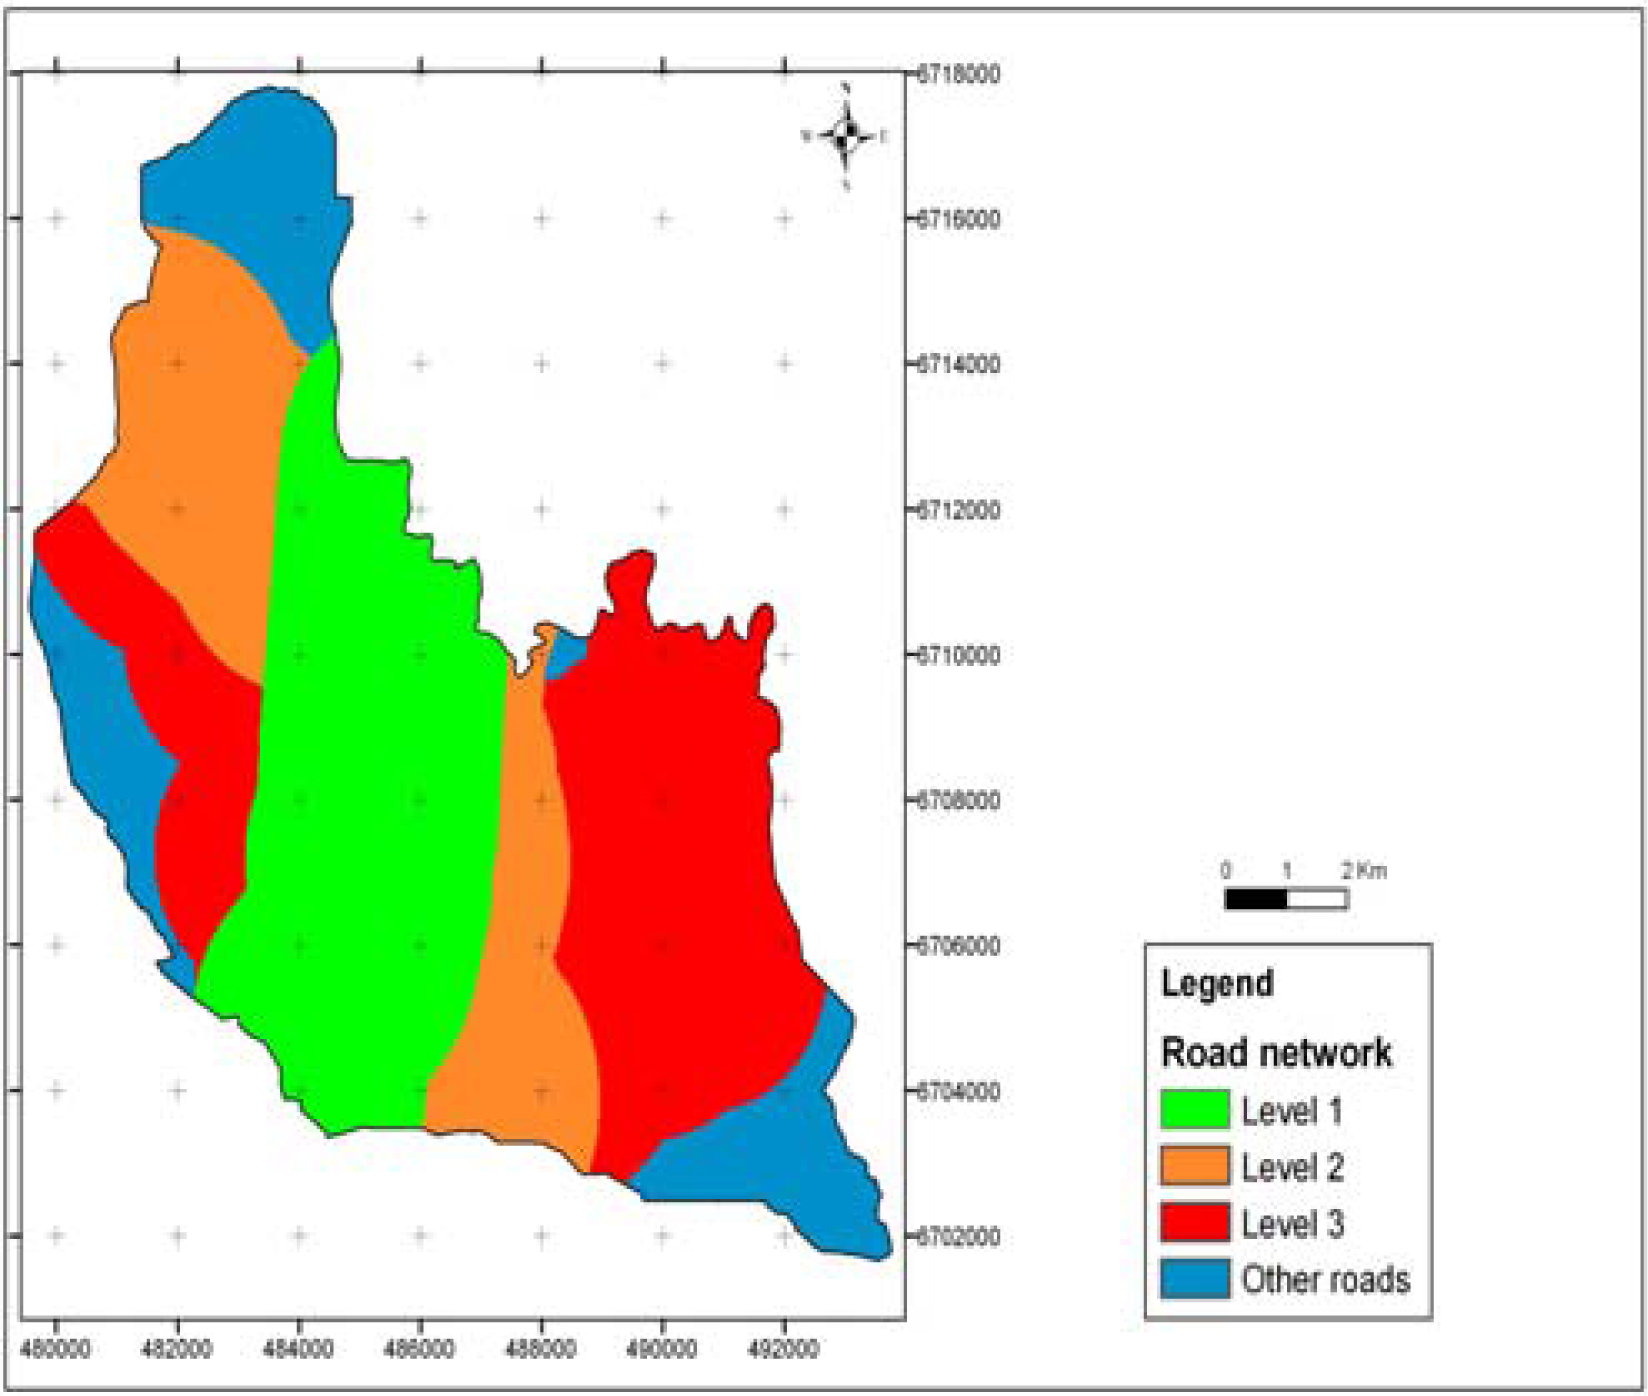
Infrastructure
The classic thought estimates that the main preoccupation of an organization is minimize transportation costs, therefore located next to raw materials source, energy and intermediate products, so reducing transportation costs from origin to transformation local.
For the infrastructure factor on multi-criteria analysis, was considered just the existing structural roads, because they represent the main access roads of municipality. The proposed weights for them were based on the importance levels established on effective Director Plan [9]. Figure 8 presents the infrastructure influence levels, where: level 1 – weight 5; level 2 – weight 4; level 3 – weight 3; and other roads – weight 2.
To delimit the influence area of each road and identify favorable industrial location places, analyzing its spatial position and importance, was adopted a maximum infrastructure distance of 2 km [14]. Then the represented areas in Figure 8, respecting the overlapping of roads with more weight, occupy the following portions of the territory: level 1 – 33; 97 km2; level 2 – 23.93 km2; level 3 – 34.43 km2; and other roads – 18.99 km2.
Final Map
Through the six maps mentioned on previous subsections (Relief, Soil Use, PPA, Pedology, Geology and Infrastructure), was possible to create the final map that aiming to establish suitable areas for industrial districts implantation, respecting the environmental preservation.
To generate the final map, all maps had been standardizing and processing on software SPRING, through the LEGAL (Spatial Language for Algebraic Geoprocessing) language, in the following way: each thematic raster map was transformed in a numeric map (Digital Terrain Model), with its respective weights from multi-criteria analysis (5, 4, 3, 2, 1, 0); all numeric maps were added, generating a single map; over this map was applied a normalization process, letting its values between 0 and 1; through a histogram was possible to determine an interval of significant values from numeric map, for which was applied a slice of six levels, generating a new thematic raster map; to this map was inserted the PPA areas with weight 0 again, concluding thus the final map.
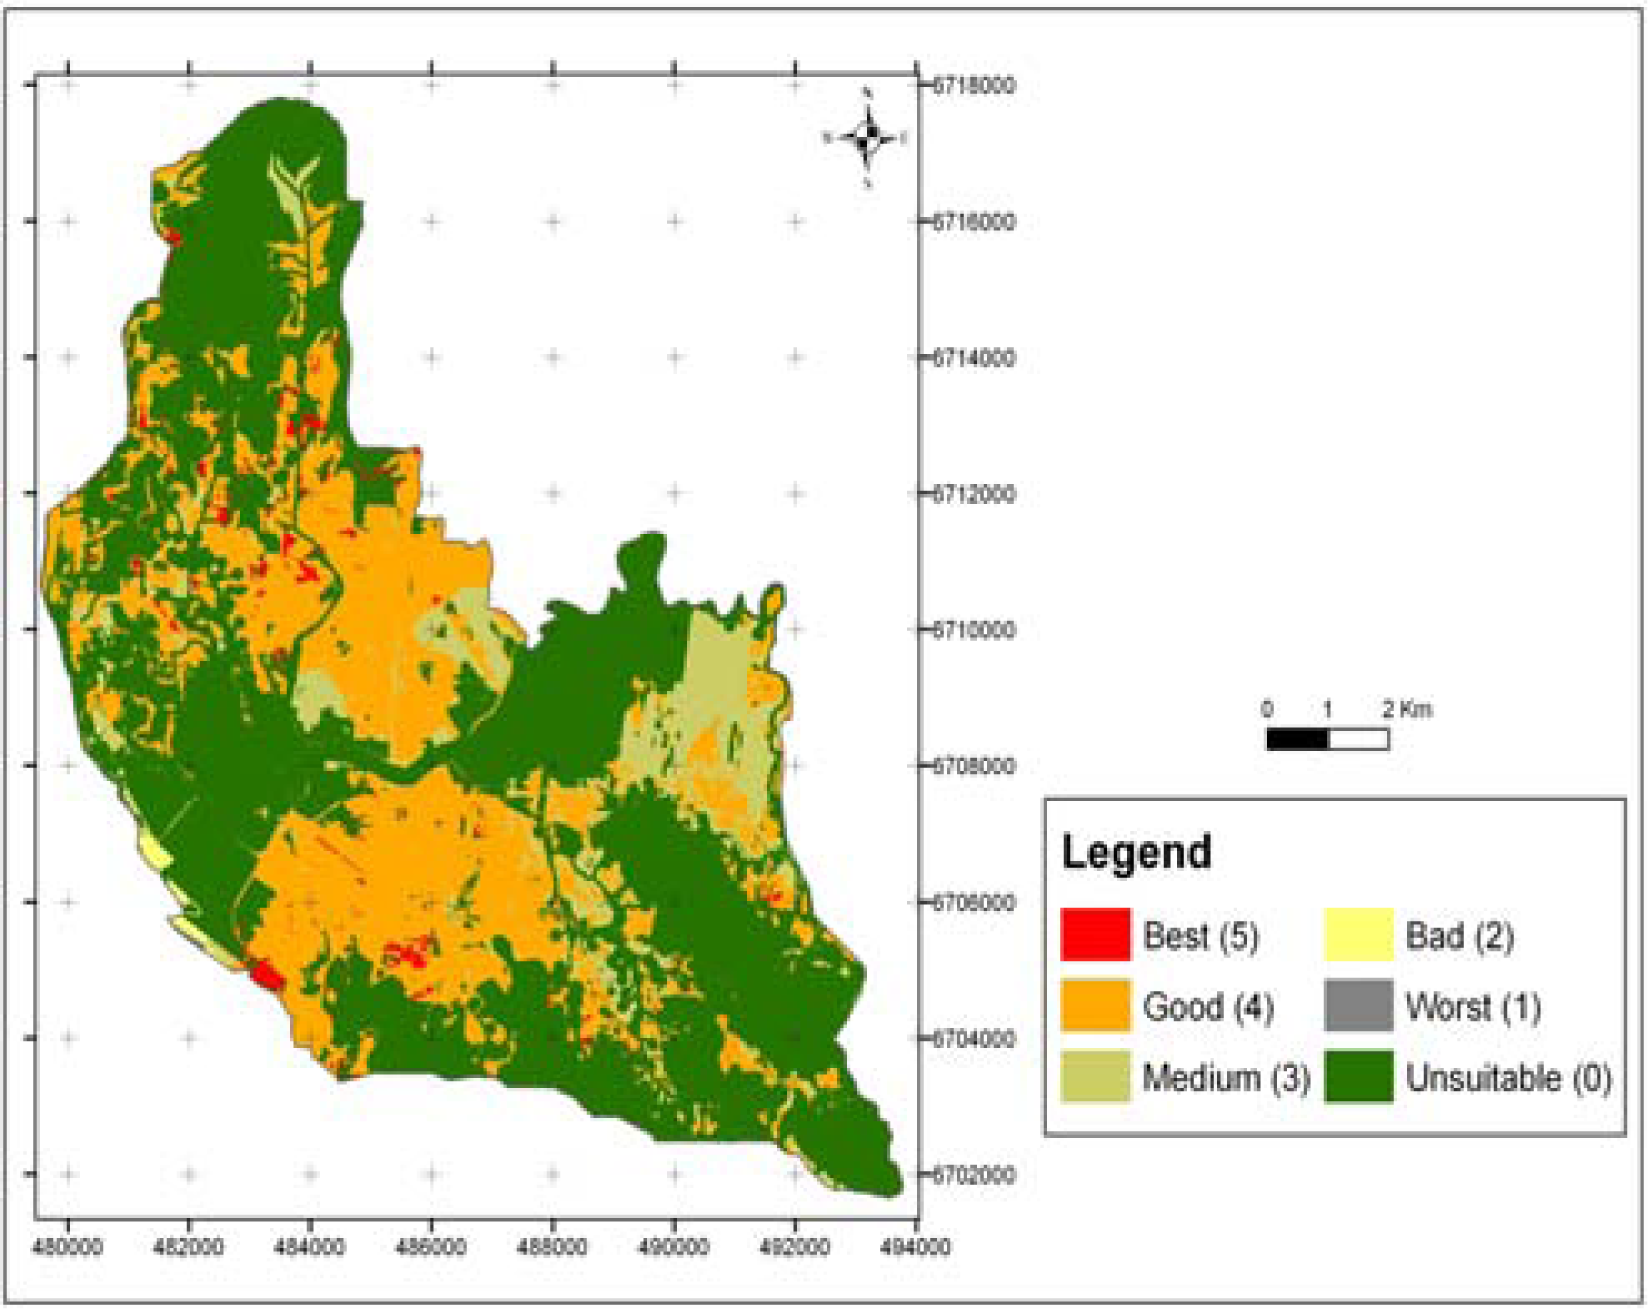
Figure 9 presents the results that indicate the suitable areas for industrial districts implantation in São Leopoldo city.
The following results of suitable analysis for industrial districts implantation could be observed:
Best (Weight 5): cover an area with 1.18 km2 (1.06% of the territory), occurring, mainly, in urban areas next to level 1 roads;
Good (Weight 4): occupies an area of 34.04 km2 (30.63% of the territory), being situated, mainly, in urban areas;
Medium (Weight 3): cover an area of 9.82 km2 (8,84%), concentrating in urban areas and areas located next to PPA;
Bad (Weight 2): with an area of 0.464 km2 (0.42%), being situated near from PPA;
Worst (Weight 1): occupies a small area, with 0.064 km2 (0.06%), occurring in the extremities of municipality next to PPA;
Unsuitable (Weight 0): covers an area of 65.56 km2 (58.99% of the territory), being situated in areas that must be protected in agreement with the effective legislation.
Table 1 presents a summary of classes used on multi-criteria analysis with their respective weights and occupied areas.
Conclusions
This research proposed an environmental analysis to choice suitable places for industrial districts implantation, question not considered by the majority of researches developed on this area, that objective just profit maximization. Through the established eliminatory and classificatory criteria, were possible to reduce the search universe, facilitating the decision-making process for the public power.
Among the spatial analysis executed, the obtained results allow to reduce the suitable areas for industrial districts implantation in 58.99% of the municipality. This reduction was imposed by PPA (Permanent Preservation Area), which received weight 0 on multi-criteria analysis, in other words, these areas couldn’t be used, because are protected by municipal, state and federal laws, and contain a representative set of fauna and flora diversity, with a regional importance and must be preserved [14].
The fact of São Leopoldo is situated over an inundation plain, not amaze the large proportion of areas occupied by PPA. However, is important to add that 24.25% of these areas are constructed and 8.21% are reforested. Then 32.64% of PPA is already changed. Although more than a half of municipality is composed by PPA, was discovered a considerable proportion of suitable areas for industrial districts implantation, where 31.69% were considered better and good, and 8.84% medium.
A comparative between the industrial zones proposed in Environmental Plan from 2002 [3] and the final map of this research, evidence the importance of researches based on environmental analysis, once that the industrial zone suggest that 10.96% of São Leopoldo territory be used for industrial finalities, where 72.74% of these areas are situated over PPA.
The wind direction and frequency analysis must also do part in the choice process of suitable places for industrial districts implantation, because atmospheric pollution displacement generated by the industries that are on places with more wind incidence, could affect the urban area. In São Leopoldo, decision makers must have more preoccupation with the winds arising from southeast region (25.7% of frequency), because if it is summed up with south and east winds, represent 45% of wind frequency on the city.
The results presented on this paper confirm the omission of environmental criteria adoption for industrial districts implantation, fact verified along the centuries at practically all countries of world. Therefore the industrial registration process must be reviewed, including criteria for environment preservation, because as well as for São Leopoldo, where a considerable part of the areas considered suitable for industrial districts implantation, already be urbanized and, each time more, the PPA are occupied to promote the expansionist policy in the city, other cities around the world must start to think about its natural riches.
The conciliation of urban development with environmental protection must be present on decision process of city halls and other public organizations, because only so is possible to guarantee the sustainability between expansion and preservation.


| Map | Classes | Weight on multicriteria analysis | Area (km2) | Percentage of territory |
|---|---|---|---|---|
| PPA | PPA | 0 | 65.558 | 58.99 |
| Geology | Rio do Rasto formation | 4 | 5.47 | 4.92 |
| Piramboia formation | 3 | 51.5 | 46.34 | |
| Alluvial deposits | 1 | 22.82 | 20.53 | |
| Coluvio-alluvial deposits | 2 | 31.32 | 28.18 | |
| Infra-structure | Level 1 | 5 | 33.97 | 30.57 |
| Level 2 | 4 | 23.93 | 21.53 | |
| Level 3 | 3 | 34.43 | 30.98 | |
| Other roads | 2 | 18.99 | 17.09 | |
| Pedology | Yellow eutrophic argisoil | 2 | 48.89 | 44.09 |
| Red distrophic argisoil | 3 | 41.8 | 36.97 | |
| Haplic gleisoil and planosoil | 1 | 19.81 | 17.83 | |
| Red distrophic nitosoil | 4 | 0.61 | 0.55 | |
| Relief | Plain | 5 | 61.14 | 55.02 |
| Smooth ripply | 4 | 26.97 | 24.27 | |
| Ripply | ||||
| Strong | 3 | 21.44 | 19.29 | |
| Ripply | 2 | 1.16 | 1.04 | |
| Hilly | 0 | 0.41 | 0.37 | |
| Soil Use | Vegetal succession area | 2 | 2.4 | 2.6 |
| Urban area | 2 | 46.77 | 42.09 | |
| Wetland | 0 | 19.07 | 17.16 | |
| Field | 5 | 17.75 | 15.43 | |
| Mixed forest | 2 | 3.28 | 2.95 | |
| Native forest | 0 | 15.4 | 13.86 | |
| Reforestation | 4 | 5.38 | 4.84 | |
Acknowledgments
This research was supported by the project Implantation of a Geographic Information System for the Environmental Diagnosis in São Leopoldo, maintenance by Municipal Secretariat of Environment from São Leopoldo (SEMMAM) and Vale do Rio dos Sinos University (UNISINOS).
References:
- Albano, M. Formulation process of 2° Director Plan of Environmental Urban Development from Porto Alegre. Dissertation. Master in Urban and Regional Planning. Rio Grande do Sul Federal University, In Portuguese. 1999. [Google Scholar]
- Fragomeni, ALM. Ecological industrial parks as an instrument of cooperative environmental planning and management. Dissetation. Master in Energetic Planning Science. Rio de Janeiro Federal University, In Portuguese. 2005. [Google Scholar]
- Teixeira, MB. Environmental Plan of São Leopoldo: institutional structures, environmental planning and protection. MTC: Porto Alegre, In Portuguese. 2002. [Google Scholar]
- Schobbenhaus, C, Ed.; SH.22 - Porto Alegre Map. Schobbenhaus, C, Ed.; In Geologic map of Brazil in Millionth; CPRM: Brasília, In Portuguese; 2004.
- Nascimento, CFG. Criteria verification for selection of suitable areas to final disposal of urban solid residues in municipality of São Leopoldo – RS. Dissertation. Master in Geology. Vale do Rio dos Sinos University, In Portuguese. 2001. [Google Scholar]
- CONAMA. National Environment Council. Resolution Nr. 302. Federal legislation, In Portuguese. 2002. [Google Scholar]
- CONAMA. National Environment Council. Resolution Nr. 303. Federal Legislation In Portuguese. 2002. [Google Scholar]
- 1965.
- São Leopoldo. Law Nr. 6.125. Dispose of Director Plan of São Leopoldo. Municipal legislation, In Portuguese. 2003.
- Ramos, RAR. Industrial location: a model for the North West of Portugal. Thesis. University of Minho, In Portuguese. 2000. [Google Scholar]
- Silva, ANR, Ed.; SIG: Framework to introduce emergent techniques in urban and regional planning and transportation: a 3D tool for urban environmental analysis, multicriteria evaluation, artificial neural network. Ed. dos Autores: São Carlos, In Portuguese. 2004.
- EMBRAPA. National Center of Soil Researches. Brazilian system of soil classification. EMBRAPA: Brasília, In Portuguese. 1999. [Google Scholar]
- Souza, PH. de.: Weighing of environmental factors for industrial districts zone proposition using GIS. Dissertation. Master in Hydraulics and Sanitation. University of São Paulo, In Portuguese. 1998. [Google Scholar]
- Maltchik, L; Bertoluci, VDM; Erba, DA. Inventory of wetlands from municipality of São Leopoldo, Rio Grande do Sul, Brazil. Botância In Portuguese. 2003, 53, 79–88. [Google Scholar]
© 2008 MDPI All rights reserved.
Share and Cite
Baretta, L.; Veronez, M.R.; Reinhardt, A.O. Qualitative Environmental Analysis for Industrial Districts Implantation Using Geoprocessing Techniques. Int. J. Environ. Res. Public Health 2008, 5, 457-463. https://doi.org/10.3390/ijerph5050457
Baretta L, Veronez MR, Reinhardt AO. Qualitative Environmental Analysis for Industrial Districts Implantation Using Geoprocessing Techniques. International Journal of Environmental Research and Public Health. 2008; 5(5):457-463. https://doi.org/10.3390/ijerph5050457
Chicago/Turabian StyleBaretta, Luciane, Maurício Roberto Veronez, and Alessandro Ott Reinhardt. 2008. "Qualitative Environmental Analysis for Industrial Districts Implantation Using Geoprocessing Techniques" International Journal of Environmental Research and Public Health 5, no. 5: 457-463. https://doi.org/10.3390/ijerph5050457