Development of a Combined Real Time Monitoring and Integration Analysis System for Volatile Organic Compounds (VOCs)

Abstract
:1. Introduction
2. Experimental Section
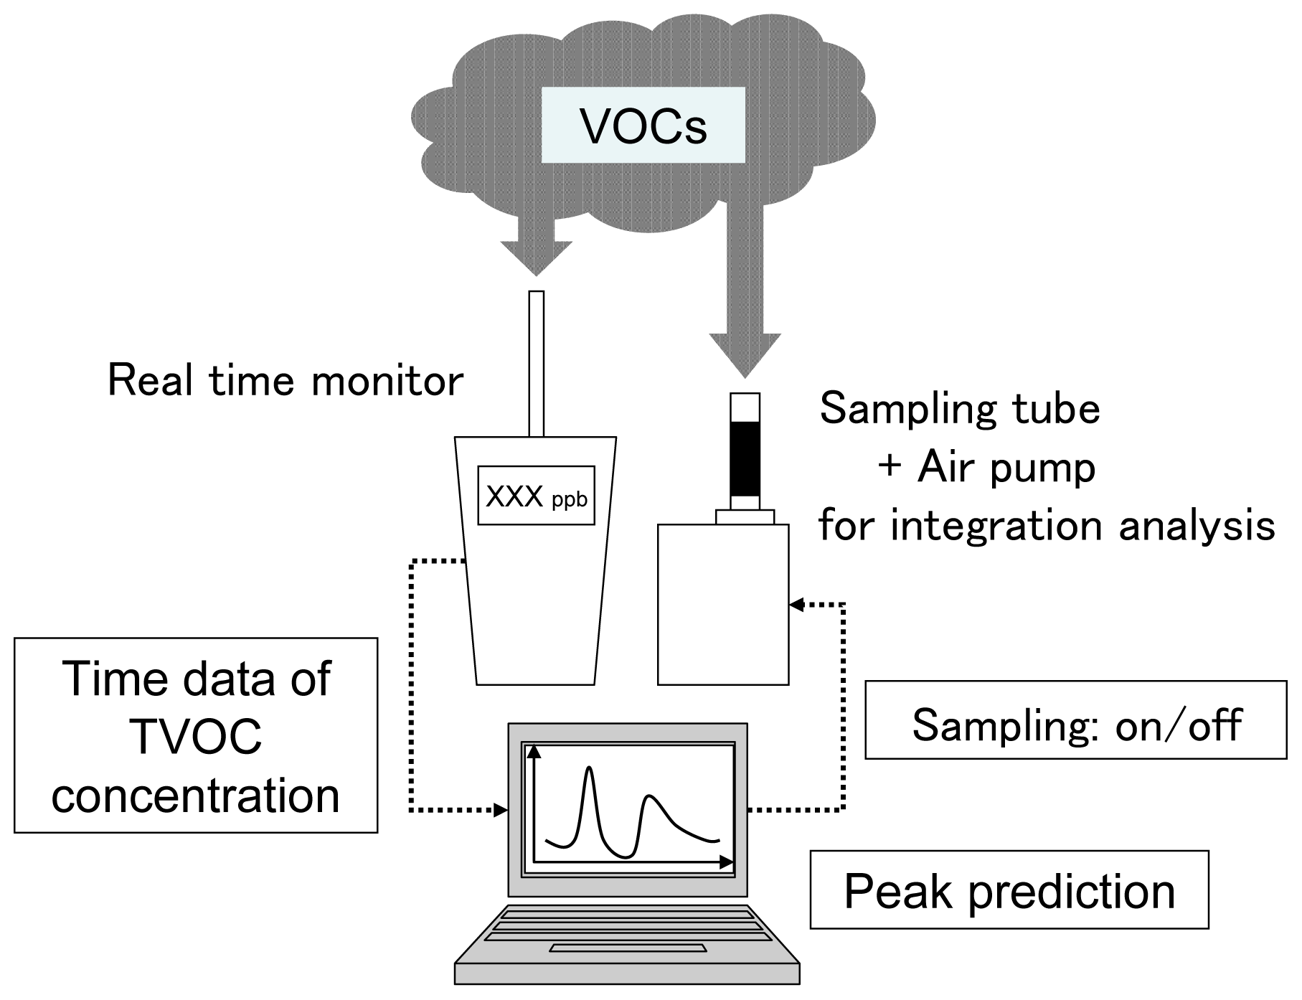
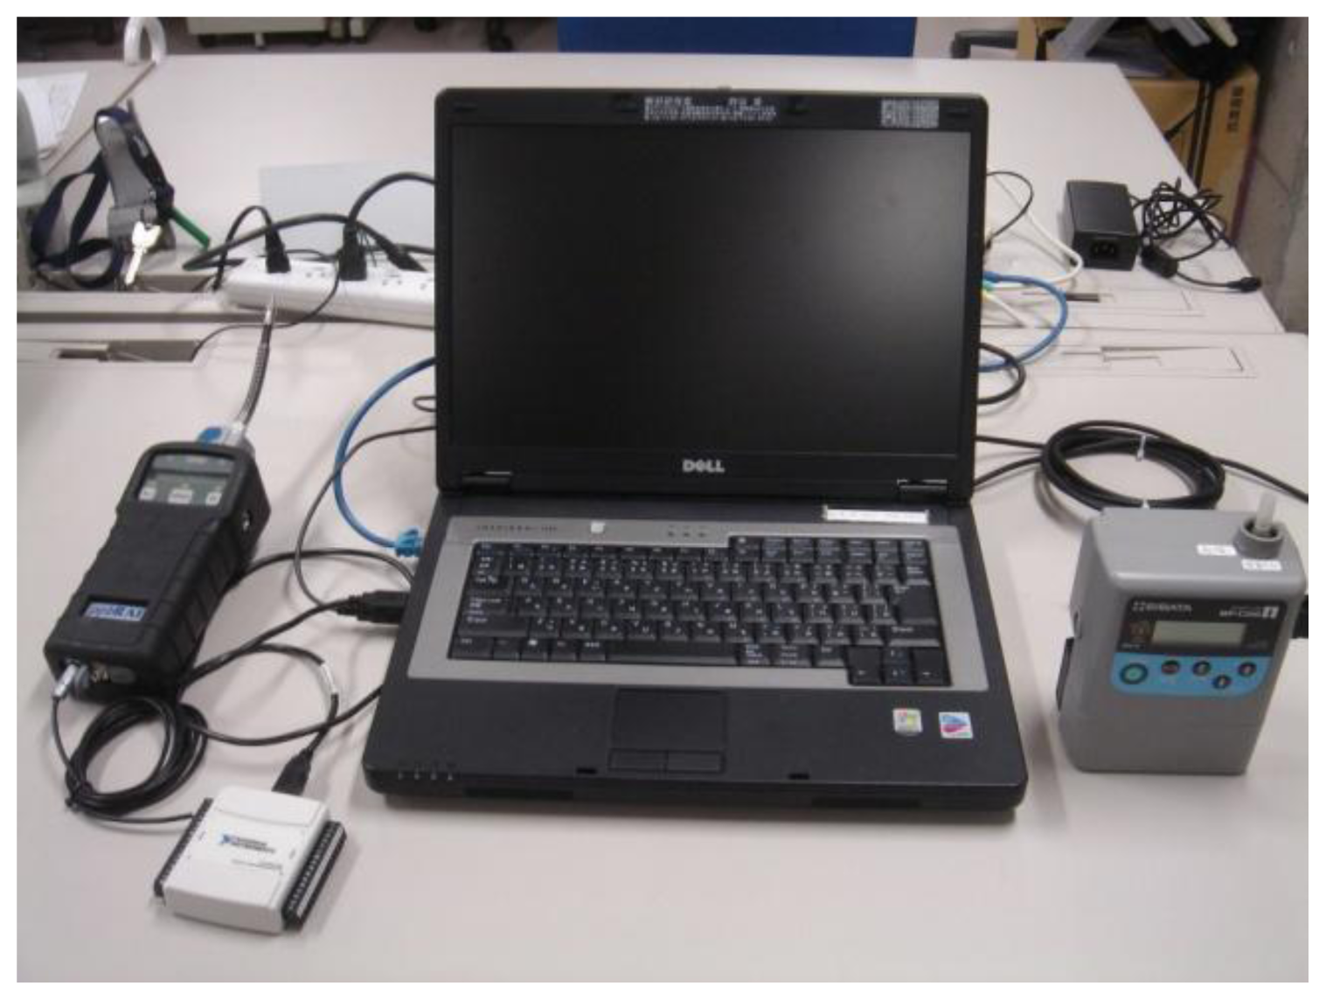
2.1. Physical Setup of the PCS
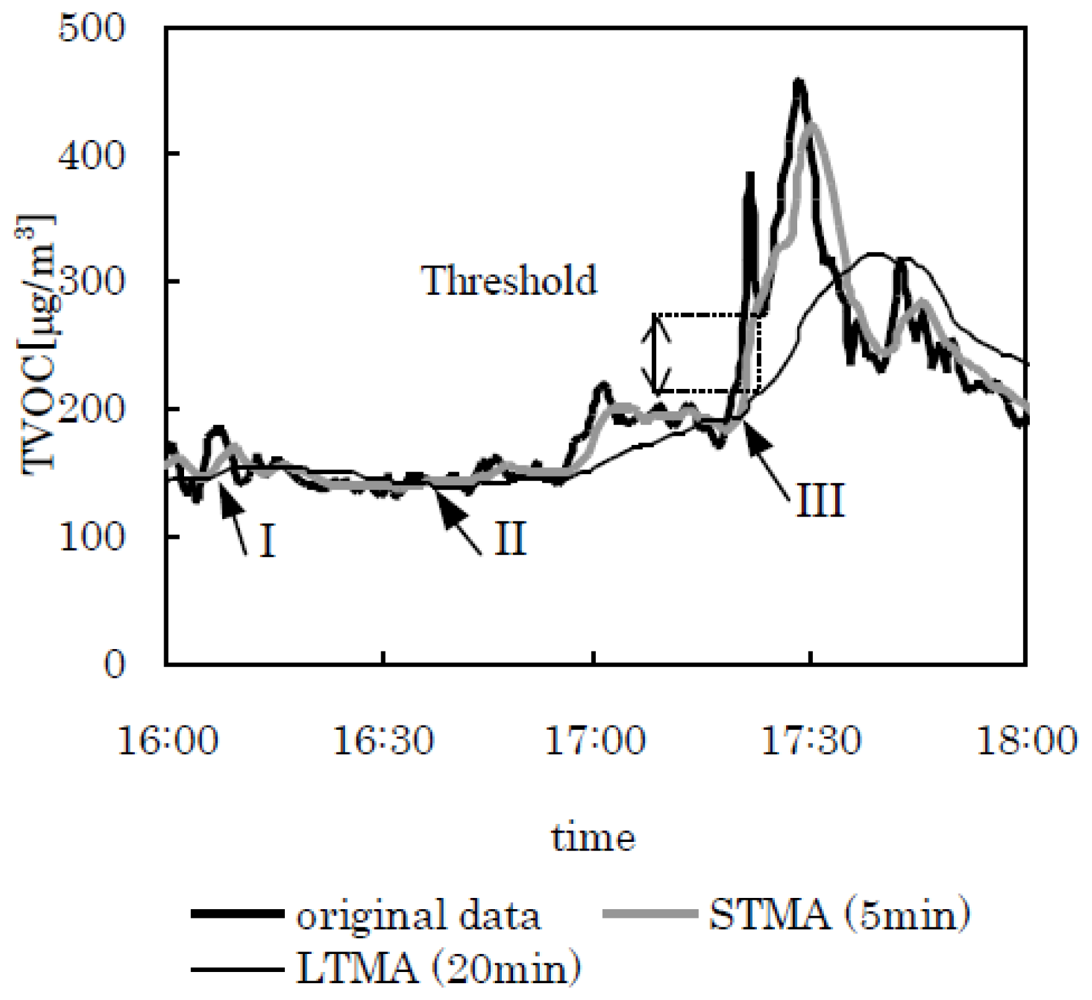
2.2. Peak Prediction Algorithm
2.3. Integration Analysis
3. Results and Discussion
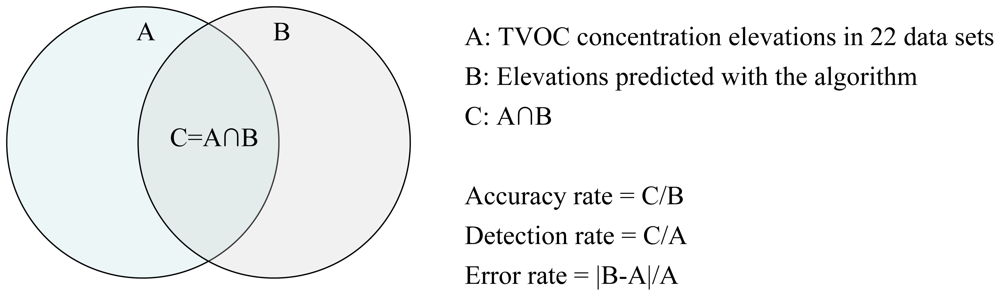
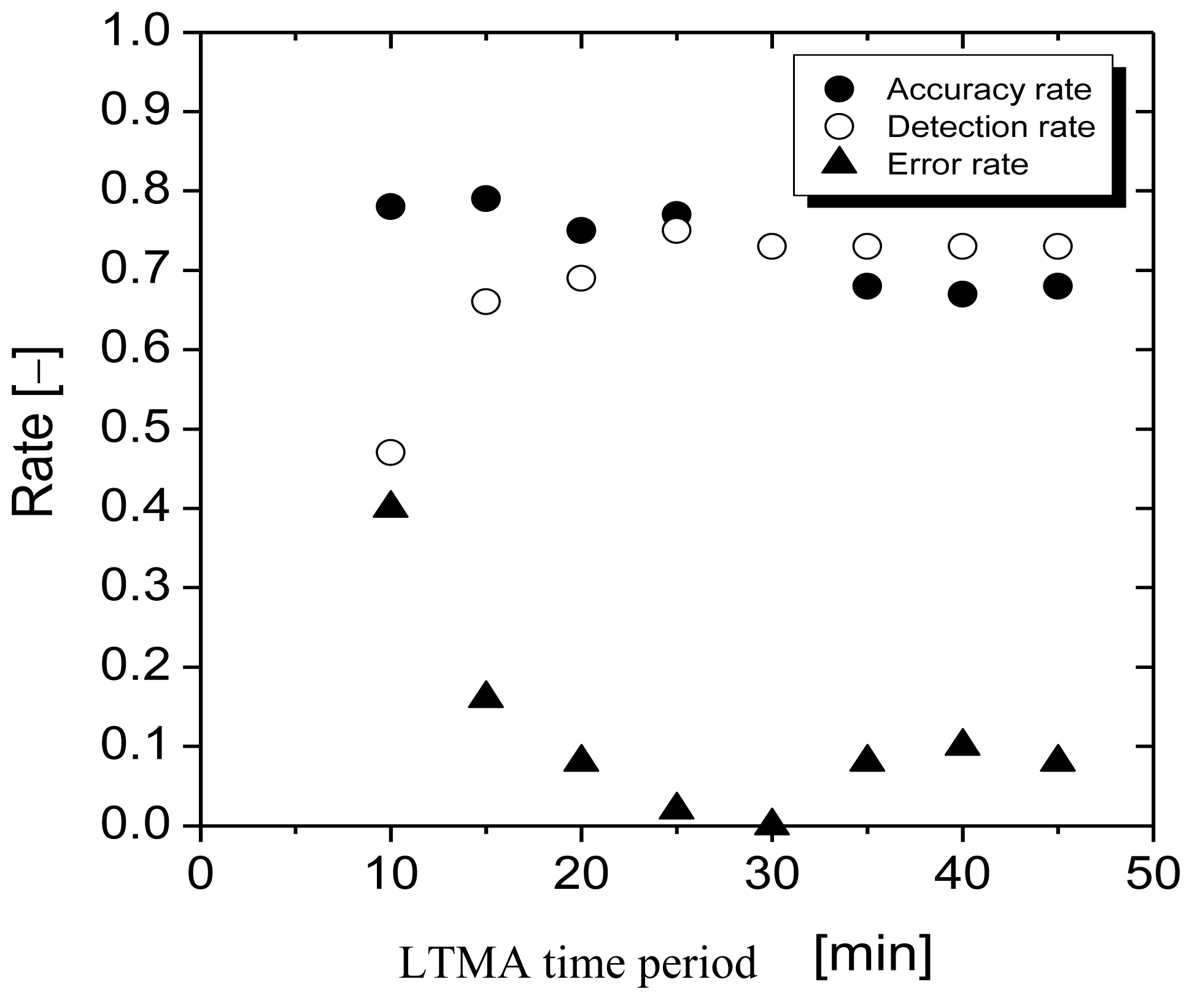
3.1. Optimization of the Elevation Prediction Algorithm
3.2. Application of the PCS with Optimized Algorithm to Indoor Air Measurements
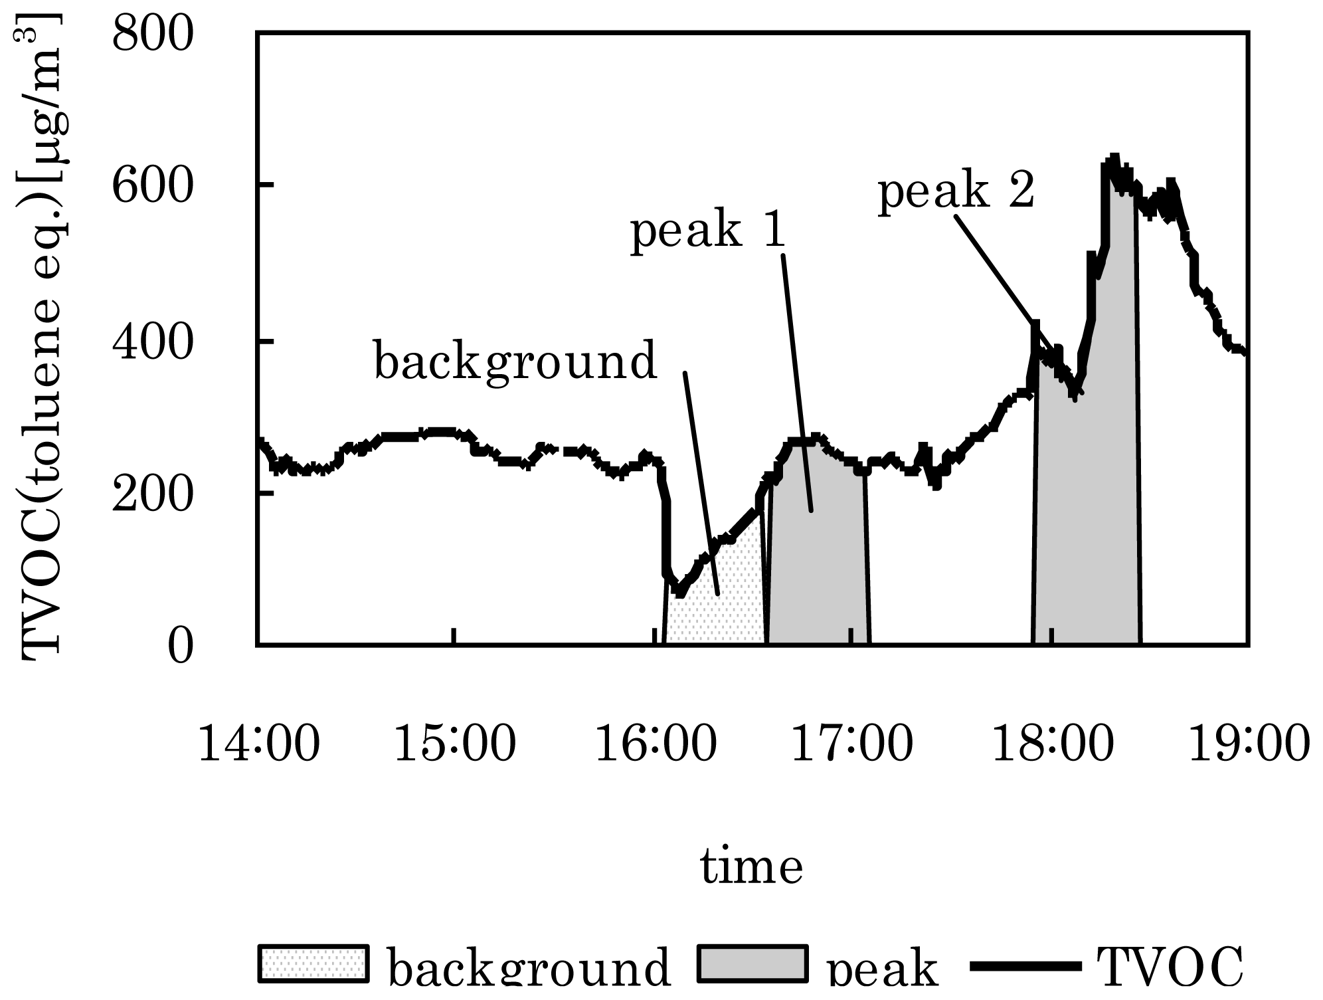
Case 1
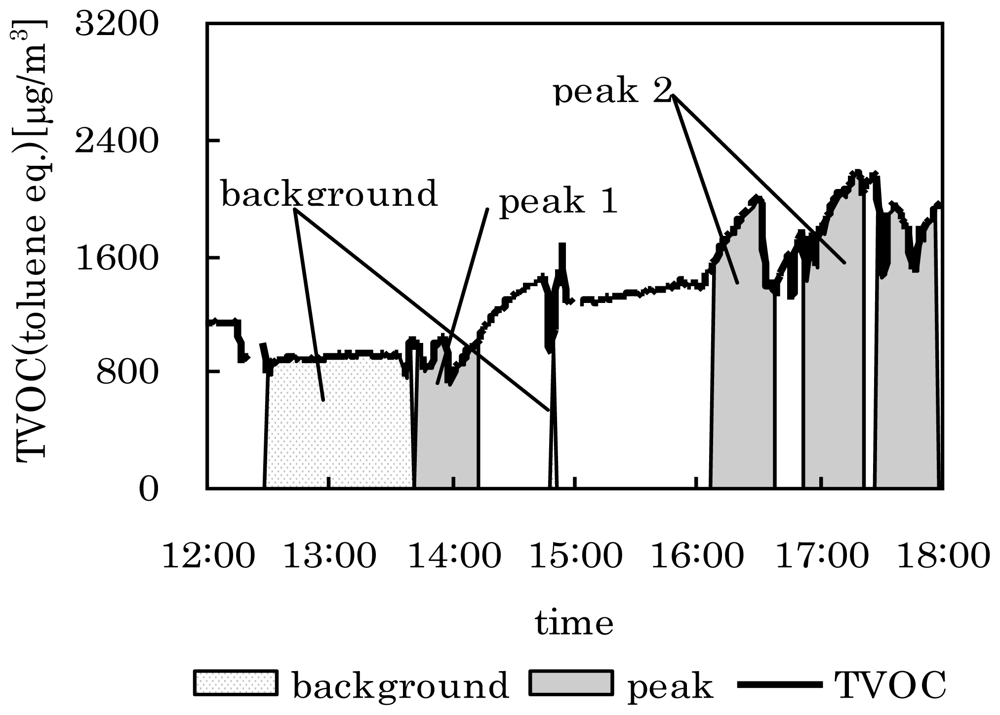
Case 2
4. Conclusions
Acknowledgments
References and Notes
- Andersson, K; Bakke, JV; Bjørseth, O; Bornehag, C-G; Clausen, G; Hongslo, JK; Kjellman, M; Kjærgaard, S; Levy, F; Mølhave, L; Skerfving, S; Sundell, J. TVOC and health in non-industrial indoor environments: Report from a nordic scientific consensus meeting at Långholmen in Stockholm. Indoor Air 1997, 7, 78–91. [Google Scholar]
- Cullen, MR. The worker with multiple chemical sensitivities: An overview. Occup Med 1987, 2, 655–661. [Google Scholar]
- Mølhave, L; Clausen, G; Berglund, B; Ceaurriz, J; Kettrup, A; Lindvall, T; Maroni, M; Pickering, AC; Risse, U; Rothweiler, H; Seifert, B; Younes, M. Total Volatile Organic Compounds (TVOC) in indoor air quality investigations. Indoor Air 1997, 7, 225–240. [Google Scholar]
- Health Labour Welfare Ministry of Japan. Interim report of Investigative Commission on Sick House (Indoor Air Pollution), Summary of the 1st to 3rd Meeting, Sampling Methods for Chemical Pollutants in Indoor Air and Its Measurement Methods (in Japanese). 2000. Avaliable online: http://www1.mhlw.go.jp/houdou/1206/h0629-2_b_13.html (accessed on 25 November 2010).
- ECA-IAQ (European Collaborative Action), Indoor Air Quality and Its Impact on Man; Report No.19; Luxembourg office for official publications of the European Community: Luxembourg, Germany, 1997.
- Tholl, D; Boland, W; Hansel, A; Loreto, F; Röse, USR; Schnitzler, J-P. Practical approaches to plant volatile analysis. Plant J 2006, 45, 540–560. [Google Scholar]
- RAE Systems, Application and Technical Notes, 3rd ed; RAE Systems World Headquarters: San Jose, CA, USA, 2005.


| ATD/GC/MS | ||
| ATD | First desorption | 300 °C (10 min) |
| Second desorption | 5 °C → 40 °C/min → 300 °C (10 min) | |
| GC | Column | HP-1 MS (60.0 m × 250 m, 1.00 m) |
| Carrier gas | He | |
| Column temperature | 40 °C (4 min)→7 °C /min →280 °C (10 min) | |
| MS | Analytical mode | SCAN |
| Mass range | m/z = 33–550 | |
| HPLC | ||
| Column | Ascentis RP-Amide (250 mm×4.6 mm, 5 m) | |
| Mobile phase | H2O : CH3CN = 35 : 65 | |
| Flow rate | 1.0 mL/min | |
| Injection volume | 20 L | |
| Column temperature | 35 °C | |
| Detector | Diode Array Detector 360 nm | |
| Background | Peak 1 | Peak 2 | |
|---|---|---|---|
| Acetaldehyde | <3 | 10 | 54 |
| Acetone | 6 | 46 | 75 |
| p-Dichlorobenzene | <2 | 52 | 99 |
| Nonanal | <17 | 43 | 70 |
| α-Pinene | 0.8 | 74 | 192 |
| Styrene | <3 | 9 | 53 |
| Undecane | <2 | 41 | 64 |
| Others | 12 | 256 | 241 |
| Background | Peak 1 | Peak 2 | |
|---|---|---|---|
| Butyraldehyde | 209 | 643 | 251 |
| Decane | 13 | 13 | 55 |
| Dodecane | 7 | 6 | 50 |
| Formaldehyde | 7 | 36 | 116 |
| Nonanal | <17 | <17 | 81 |
| Undecane | 12 | 10 | 76 |
| Others | 115 | 19 | 535 |
© 2010 by the authors; licensee Molecular Diversity Preservation International, Basel, Switzerland. This article is an open-access article distributed under the terms and conditions of the Creative Commons Attribution license (http://creativecommons.org/licenses/by/3.0/).
Share and Cite
Oka, K.; Iizuka, A.; Inoue, Y.; Mizukoshi, A.; Noguchi, M.; Yamasaki, A.; Yanagisawa, Y. Development of a Combined Real Time Monitoring and Integration Analysis System for Volatile Organic Compounds (VOCs). Int. J. Environ. Res. Public Health 2010, 7, 4100-4110. https://doi.org/10.3390/ijerph7124100
Oka K, Iizuka A, Inoue Y, Mizukoshi A, Noguchi M, Yamasaki A, Yanagisawa Y. Development of a Combined Real Time Monitoring and Integration Analysis System for Volatile Organic Compounds (VOCs). International Journal of Environmental Research and Public Health. 2010; 7(12):4100-4110. https://doi.org/10.3390/ijerph7124100
Chicago/Turabian StyleOka, Kentaro, Atsushi Iizuka, Yasuo Inoue, Atsushi Mizukoshi, Miyuki Noguchi, Akihiro Yamasaki, and Yukio Yanagisawa. 2010. "Development of a Combined Real Time Monitoring and Integration Analysis System for Volatile Organic Compounds (VOCs)" International Journal of Environmental Research and Public Health 7, no. 12: 4100-4110. https://doi.org/10.3390/ijerph7124100