Quantitative Analysis of Tremors in Welders

Abstract
:Background:
Objectives:
Methods:
Results:
Conclusions:
1. Introduction
2. Methods
2.1. Selection of Subjects
2.2. Accelerometry
2.3. Statistical Analysis
3. Results and Discussion
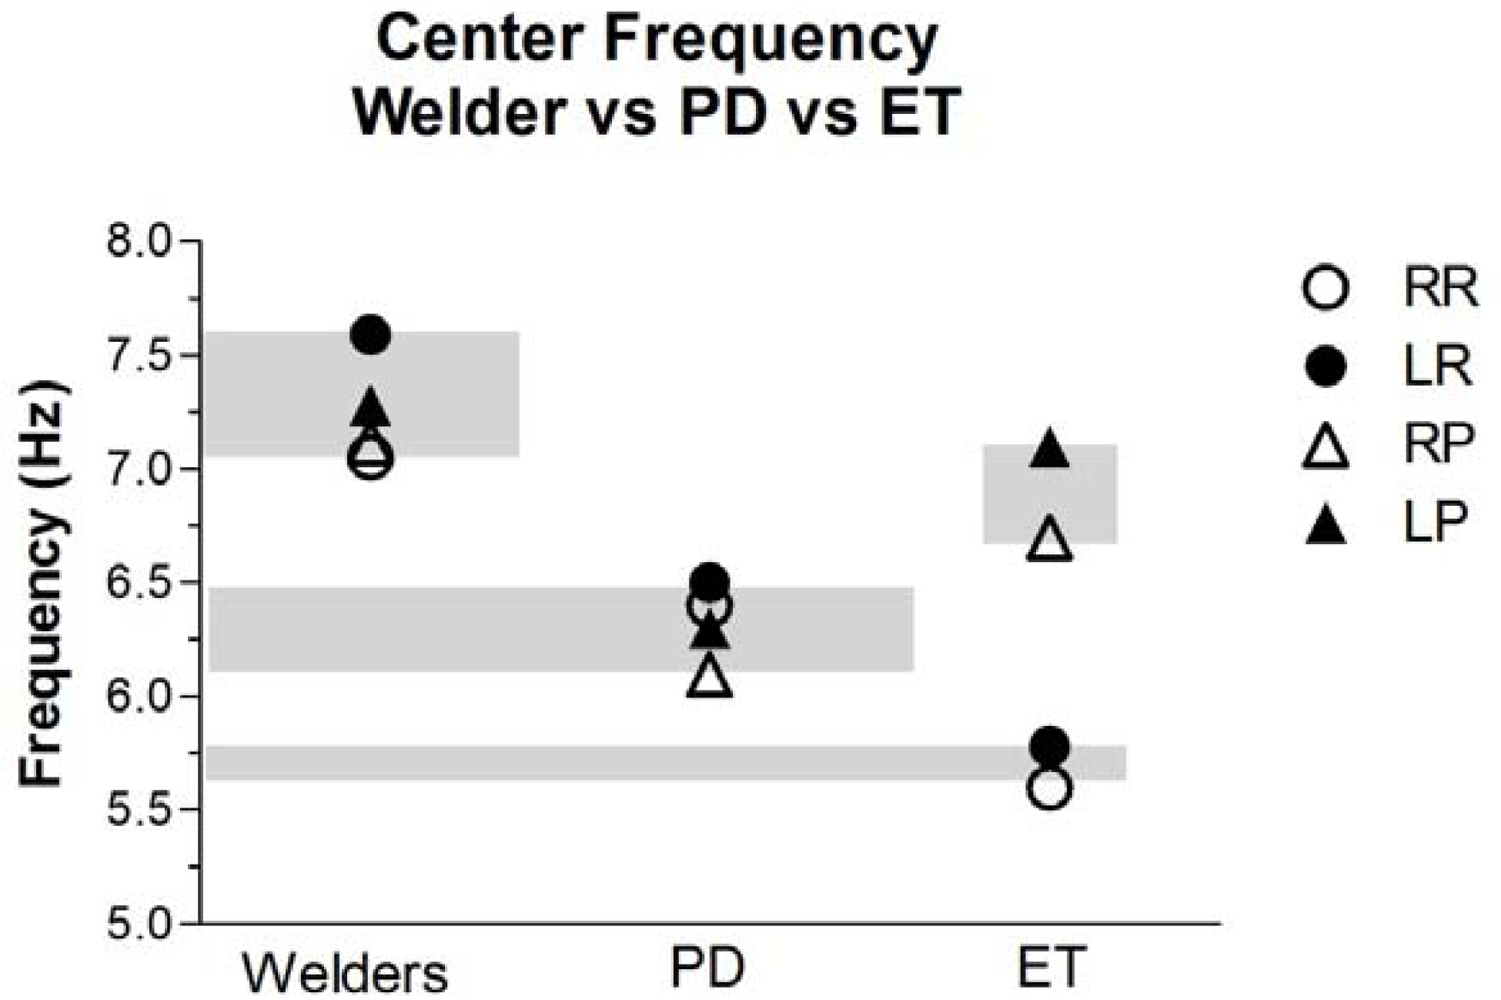
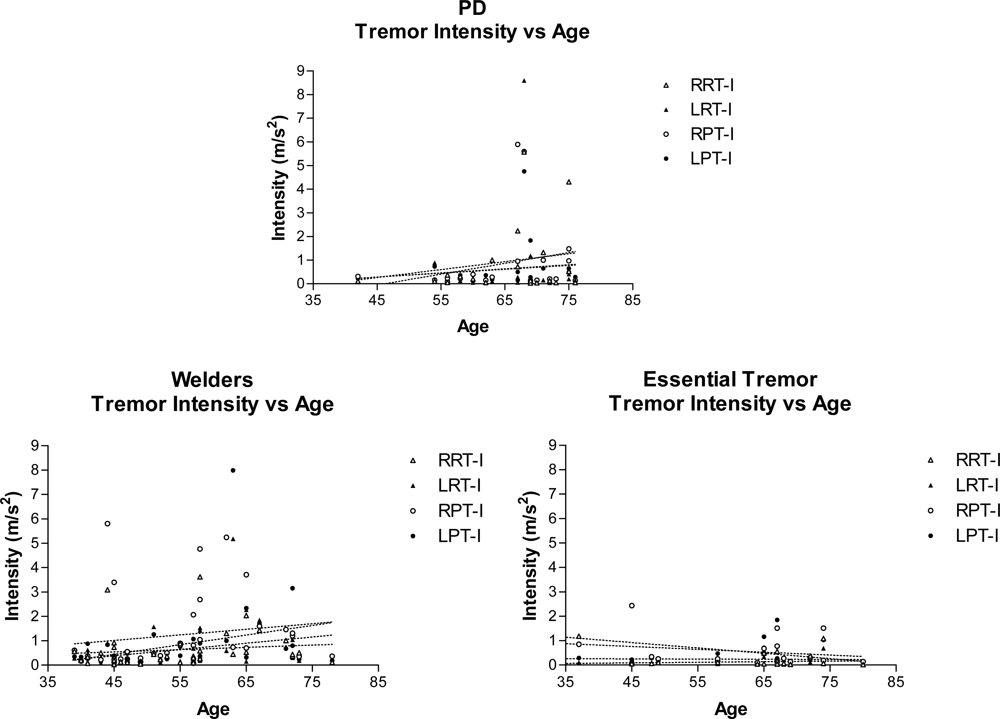
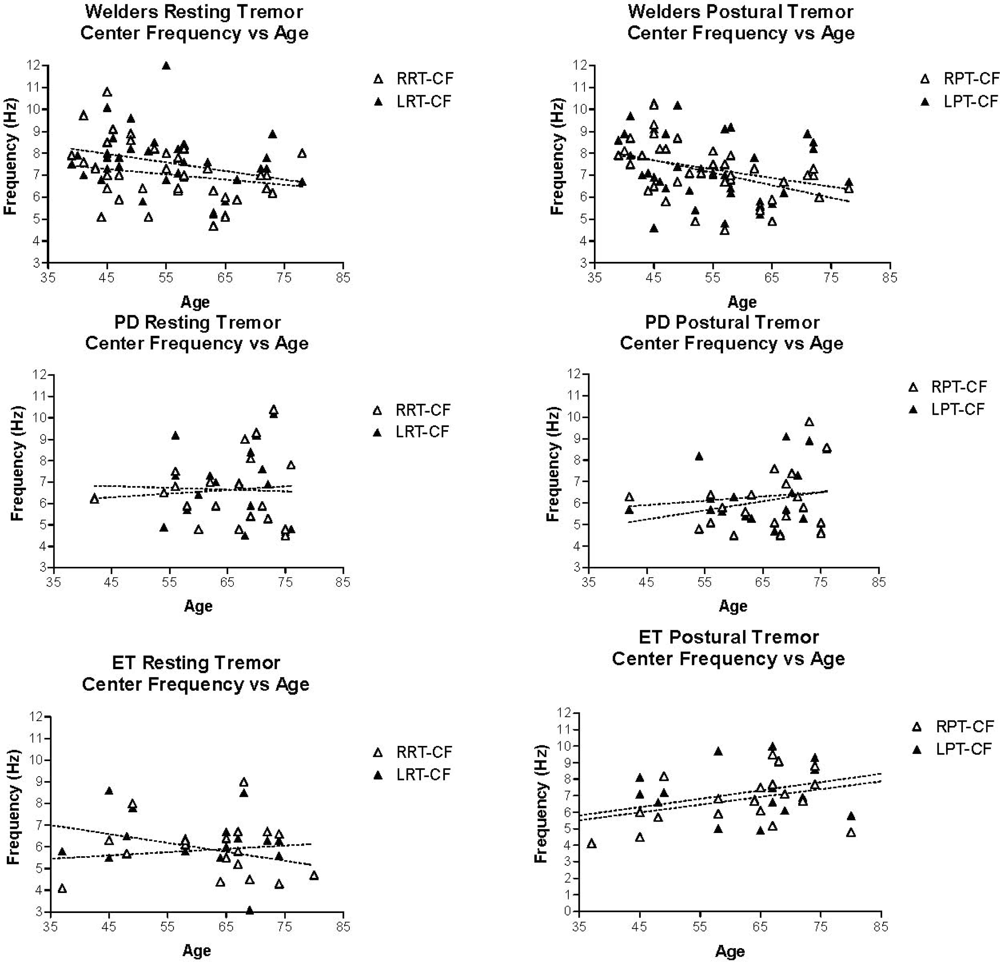
Quantitative Tremor Analysis
4. Conclusions
Acknowledgments
References
- Edsall, DL; Wilbur, FP; Drinker, CK. The occurrence, course and prevention of chronic manganese poisoning. J. Ind. Hyg 1919, 1, 183–193. [Google Scholar]
- Cotzias, GC. Manganese, melanins and the extrapyramidal system. J. Neurosurg 1966, 24, 170–180. [Google Scholar]
- Wisniewska-Hejka, Z; Cempel, M; Nyka, WM. Neurological examinations of workers with chronic exposure to manganese dioxide during the production of piles and batteries. Neurol. Neurochir. Pol 1978, 12, 435–441. [Google Scholar]
- Huang, CC; Chu, NS; Lu, CS; Wang, JD; Tsai, JL; Tzeng, JL; Wolters, EC; Calne, DB. Chronic manganese intoxication. Arch. Neurol 1989, 46, 1104–1106. [Google Scholar]
- Racette, BA; McGee-Minnich, L; Moerlein, SM; Mink, JW; Videen, TO; Perlmutter, JS. Welding-related parkinsonism: Clinical features, treatment, and pathophysiology. Neurology 2001, 56, 8–13. [Google Scholar]
- Barbeau, A. Manganese and extrapyramidal disorders (a critical review and tribute to Dr. George C. Cotzias). Neurotoxicology 1984, 5, 13–35. [Google Scholar]
- Hochberg, F; Miller, G; Valenzuela, R; McNelis, S; Crump, KS; Covington, T; Valdivia, G; Hochberg, B; Trustman, JW. Late motor deficits of Chilean manganese miners: A blinded control study. Neurology 1996, 47, 788–795. [Google Scholar]
- Despres, C; Lamoureux, D; Beuter, A. Standardization of a neuromotor test battery: The CATSYS system. Neurotoxicology 2000, 21, 725–735. [Google Scholar]
- Beuter, A; Edwards, R; deGeoffroy, A; Mergler, D; Hundnell, K. Quantification of neuromotor function for detection of the effects of manganese. Neurotoxicology 1999, 20, 355–366. [Google Scholar]
- Beuter, A; Lambert, G; Macgibbon, B. Quantifying postural tremor in workers exposed to low levels of manganese. J. Neurosci. Methods 2004, 139, 247–255. [Google Scholar]
- Racette, BA; Tabbal, SD; Jennings, D; Good, L; Perlmutter, JS; Evanoff, B. Prevalence of parkinsonism and relationship to exposure in a large sample of Alabama welders. Neurology 2005, 64, 230–235. [Google Scholar]


| Welders (n = 37) | IPD (n = 20) | ET (n = 20) | |
|---|---|---|---|
| Males/Female | 36/1 | 13/7 | 9/11 |
| Age | 54.8 ± 10.7 | 65.3 ± 9.15 | 59.5 ± 14.9 |
| Age at Onset | 47.9 ± 11.7 | 59.5 ± 9.68 | 50 ± 14.8 (n = 12) |
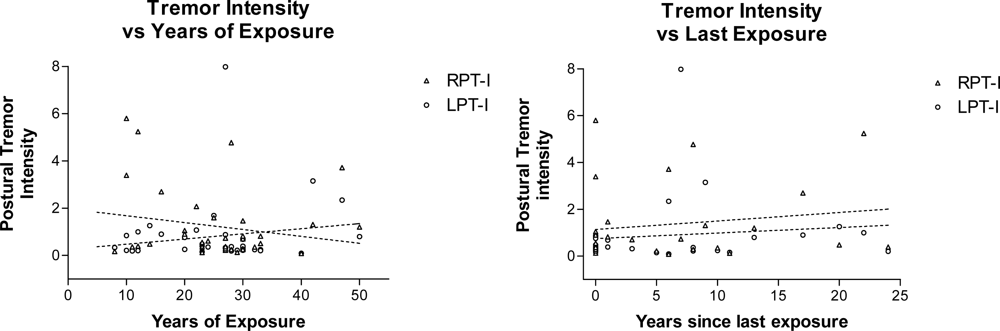
| Years of Exposure to Welding Fumes | 25.6 ± 10.8 | — | — |
| Years since last Exposure | 7.8 ± 10.7 | — | — |
| Welders | IPD | ||
|---|---|---|---|
| Number of subjects with sign/total examined (%) | Significance level | ||
| Initial symptoms (based on history) | |||
| Tremor | 29/32 (90.1%) | 14/17 (82%) | p = 0.41 |
| Bradykinesia | 5/32 (15.6 %) | 3/17 (17.6%) | p = 1.0 |
| Balance | 7/31 (22.5%) | 1/17 (5.8%) | p = 0.23 |
| Limb cramping | 7/32 (21.8 %) | 0/17 (0%) | p = 0.08 |
| Current signs (based on UPDRS) * | |||
| Resting tremor (Item 20 >0) | 19/31 (61.2%) | 9/16 (56.2%) | p = 0.76 |
| Action tremor (Item 21>0) | 27/31 (87%) | 3/16 (18.7%) | * p < 0.0001 |
| Postural tremor (Item 21≥3) | 21/31 (67.7%) | 2/16 (12.5%) | * p < 0.0005 |
| Dystonic limb posture | 1/31 (3.2%) | 1/17 (5.8%) | p = 0.66 |
| Cog-wheel rigidity (Item 22>0) | 8/29 (27.5%) | 3/17 (17.6%) | p = 0.45 |
| Distribution of signs (based on UPDRS) * | |||
| Asymmetric Tremor UE (Item 20 R≠L) | 4/29 (13.7%) | 10/16 (62.5%) | * p = 0.002 |
| Asymmetric Rigidity UE (Item 22 R≠L) | 11/29 (37.9%) | 11/12 (91.6%) | * p = 0.002 |
| Asymmetric Brady UE (Item 23 R≠L) | 11/29 (37.9%) | 11/11 (100%) | * p = 0.003 |
| Autonomic nervous system (based on history) | |||
| Dyshidrosis | 11/29 (37.9%) | 0/17 (0%) | * p = 0.01 |
| Dizziness on standing | 0/29 (0%) | 1/17 (5.8%) | p = 0.25 |
| Welders (n = 37) | ||||||||
|---|---|---|---|---|---|---|---|---|
| Resting Tremor | Postural Tremor | |||||||
| Intensity (m/s2) | Center Freq. (Hz) | Center Freq. Dispersion (Hz) | Harmonic Index | Intensity (m/s2) | Center Freq. (Hz) | Center Freq. Dispersion (Hz) | Harmonic Index | |
| Right side Mean ± SEM | 0.774 ± 0.194 | 7.05 ± 0.263 | 1.19 ± 0.160 | 0.941 ± 0.041 | 1.61 ** ± 0.457 | 7.12 ± 0.208 | 1.36 ± 0.204 | 0.910 ± 0.066 |
| Left side Mean ± SEM | 0.706 ± 0.175 | 7.59 ± 0.227 | 1.90 ± 0.187 | 0.917 ± 0.049 | 1.07 ± 0.335 | 7.28 ± 1.54 | 2.04 ± 0.707 | 0.936 ± 0.055 |
| PD (n = 20) | ||||||||
|---|---|---|---|---|---|---|---|---|
| Resting Tremor | Postural Tremor | |||||||
| Intensity (m/s2) | Center Freq. (Hz) | Center Freq. Dispersion (Hz) | Harmonic Index | Intensity (m/s2) | Center Freq. (Hz) | Center Freq. Dispersion (Hz) | Harmonic Index | |
| Right side Mean ± SEM | 0.867 ± 0.338 | 6.64 ± 0.367 | 1.93 ± 0.336 | 0.946 ± 0.045 | 0.937 ± 0.377 | 6.10 ± 0.315 | 2.21 ± 0.363 | 0.94 ± 0.058 |
| Left side Mean ± SEM | 0.633 ± 0.424 | 6.65 ± 0.377 | 1.59 ± 0.346 | 0.944 ± 0.038 | 0.613 ± 0.235 | 6.32 ± 0.323 | 2.24 ± 0.299 | 0.936 ± 0.050 |
| ET (n = 20) | ||||||||
|---|---|---|---|---|---|---|---|---|
| Resting Tremor | Postural Tremor | |||||||
| Intensity (m/s2) | Center Freq. (Hz) | Center Freq. Dispersion (Hz) | Harmonic Index | Intensity (m/s2) | Center Freq. (Hz) | Center Freq. Dispersion (Hz) | Harmonic Index | |
| Right side Mean ± SEM | 0.241 ± 0.076 | 5.829 * ± 0.291 | 1.755 ± 0.272 | 0.956 ± 0.007 | 0.588 ** ± 0.140 | 6.674 ± 0.340 | 2.580 ± 0.306 | 0.936 ± 0.008 |
| Left side Mean ± SEM | 0.124 ± 0.035 | 5.995 * ± 0.355 | 2.270 ± 0.330 | 0.939 ± 0.008 | 0.599 ** ± 0.175 | 7.055 ± 0.386 | 2.855 ± 0.305 | 0.918 ± 0.010 |
© 2011 by the authors; licensee MDPI, Basel, Switzerland. This article is an open-access article distributed under the terms and conditions of the Creative Commons Attribution license (http://creativecommons.org/licenses/by/3.0/).
Share and Cite
Sanchez-Ramos, J.; Reimer, D.; Zesiewicz, T.; Sullivan, K.; Nausieda, P.A. Quantitative Analysis of Tremors in Welders. Int. J. Environ. Res. Public Health 2011, 8, 1478-1490. https://doi.org/10.3390/ijerph8051478
Sanchez-Ramos J, Reimer D, Zesiewicz T, Sullivan K, Nausieda PA. Quantitative Analysis of Tremors in Welders. International Journal of Environmental Research and Public Health. 2011; 8(5):1478-1490. https://doi.org/10.3390/ijerph8051478
Chicago/Turabian StyleSanchez-Ramos, Juan, Dacy Reimer, Theresa Zesiewicz, Kelly Sullivan, and Paul A. Nausieda. 2011. "Quantitative Analysis of Tremors in Welders" International Journal of Environmental Research and Public Health 8, no. 5: 1478-1490. https://doi.org/10.3390/ijerph8051478