Evaluation of Changes in Effluent Quality from Industrial Complexes on the Korean Nationwide Scale Using a Self-Organizing Map


Abstract
:1. Introduction
2. Materials and Methods
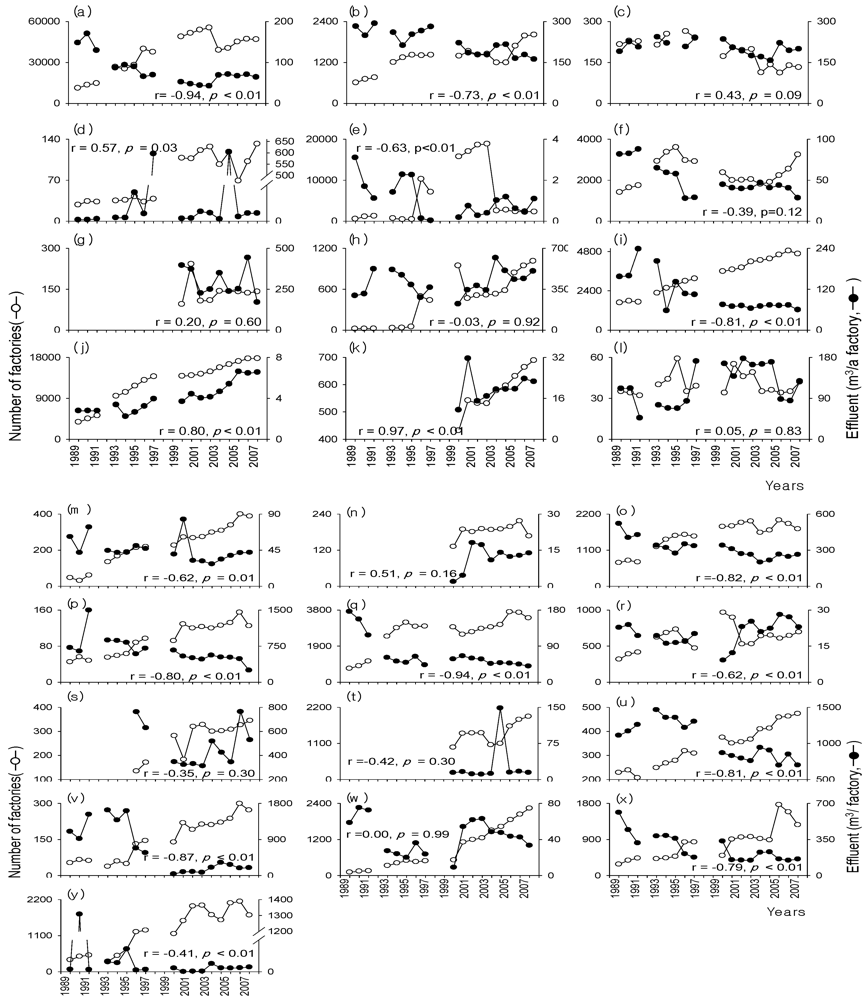
2.1. Water Quality Data

2.2. Modeling Changes in Water Quality

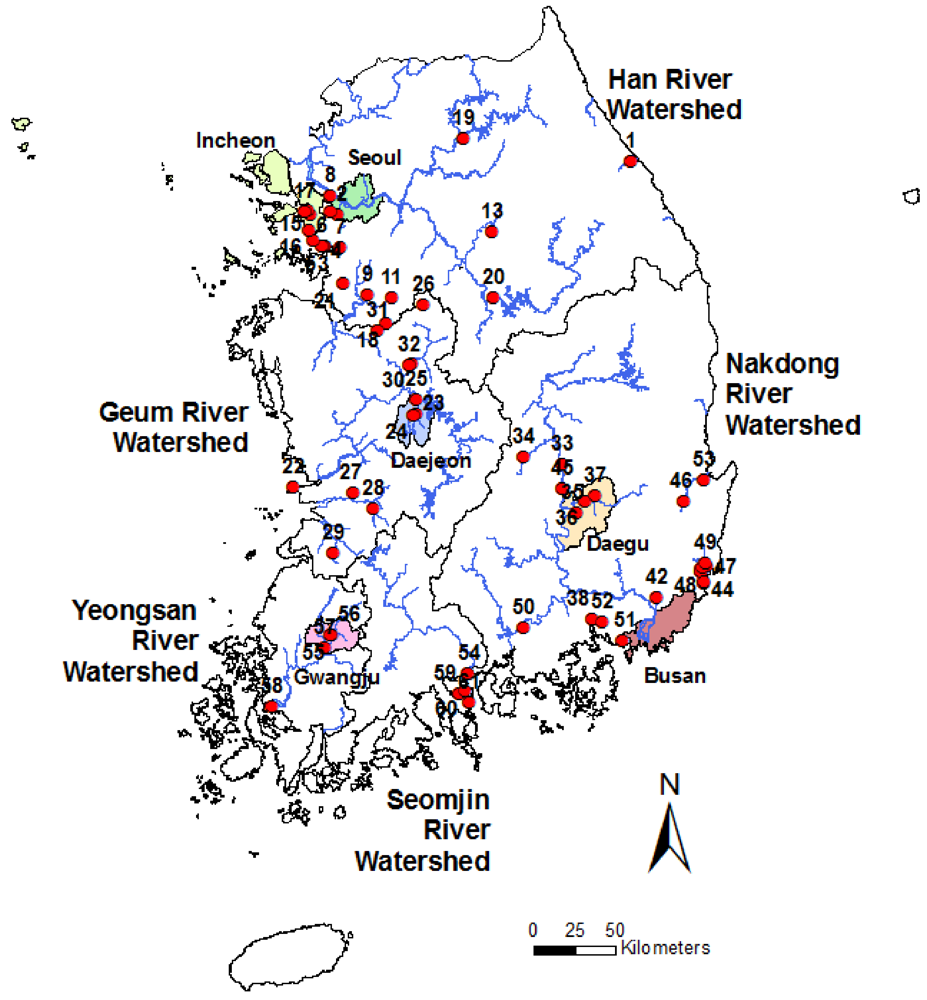
| Watershed | Site number | Industrial complex | Survey period (year.month) | Watershed | Site number | Industrial complex | Survey period (year.month) | |
|---|---|---|---|---|---|---|---|---|
| Han River | 1 | Gangneung | 1992.03–2008.12 | Nakdong River | 33 | Gumi | 1992.03-2008.12 | |
| 2 | Seoul Digital | 1992.03–2008.12 | 34 | Gimcheon | 1994.01–2008.12 | |||
| 3 | Banwol1 | 1989.02–2008.12 | 35 | Dalseong | 1990.01–2008.12 | |||
| 4 | Banwol2 | 1989.02–2008.12 | 36 | Daegu 3rd | 1989.01–2008.12 | |||
| 5 | Banwol3 | 1989.02–2008.12 | 37 | Daegu Geomdan | 1990.01–2008.12 | |||
| 6 | Banwol4 | 1992.03–2008.12 | 38 | Masan | 1989.01–2008.12 | |||
| 7 | Banwol Plating | 1994.01–2008.12 | 39 | Petrochemical1 | 1989.02–2008.12 | |||
| 8 | Seonam Wastewater treatment | 1992.03–2008.12 | 40 | Petrochemical2 | 1990.01–2008.12 | |||
| 9 | Songtan | 1994.01–2008.12 | 41 | Petrochemical3 | 1998.02–2008.12 | |||
| 10 | Sihaw | 1995.01–2008.12 | 42 | Yangsan | 1989.01–2008.12 | |||
| 11 | Anseong | 1992.03–2008.12 | 43 | Onsan1 | 1989.01–2008.12 | |||
| 12 | Yeongdeungpo Mechanical | 1992.03–2008.12 | 44 | Onsan2 | 1989.02–2008.12 | |||
| 13 | Wonju | 1989.01–2008.12 | 45 | Waewan | 2001.02–2008.12 | |||
| 14 | Incheon 5, 6 | 1992.03–2008.12 | 46 | Yonggang | 1994.01–2008.12 | |||
| 15 | Incheon | 2002.01–2008.12 | 47 | Ulsan1 | 1989.01–2008.12 | |||
| 16 | Incheon Namdong | 1992.03–2008.12 | 48 | Ulsan2 | 1998.02–2008.12 | |||
| 17 | Incheon local | 1992.03–2008.12 | 49 | Ulsan3 | 1998.02–2008.12 | |||
| 18 | Cheonheung | 1995.01–2008.12 | 50 | Jinju | 1989.01–2008.12 | |||
| 19 | Chuncheon | 1989.01–2008.12 | 51 | Jinhae Macheon | 1994.01–2008.12 | |||
| 20 | Chungju | 1998.02–2008.12 | 52 | Changwon | 1989.01–2008.12 | |||
| 21 | Hyangnam Pharmaceutical | 1992.03–2008.12 | 53 | Pohang | 1989.01–2008.12 | |||
| Geum River | 22 | Gunsan | 2003.01–2008.12 | Yeongsan River/Seumjin River | 54 | Gwangyang | 1990.01–2008.12 | |
| 23 | Daejeon | 1989.01–2008.12 | 55 | Gwangju1 | 2003.01–2008.12 | |||
| 24 | Daejeon | 1989.01–2008.12 | 56 | Gwangju2 | 2003.01–2008.12 | |||
| 25 | Daejeon | 1994.01–2008.12 | 57 | Gwangju3 | 2003.01–2008.12 | |||
| 26 | Daepung | 1998.02–2008.12 | 58 | Daebul | 2002.01–2008.12 | |||
| 27 | Iri | 1989.01–2008.12 | 59 | Yeocheon1 | 1999.01–2008.12 | |||
| 28 | Jeonju | 1989.01–2008.12 | 60 | Yeocheon2 | 1989.01–2008.12 | |||
| 29 | Jeongeup | 1990.01–2008.12 | 61 | Ocheon | 1990.01–2008.12 | |||
| 30 | Cheongju1 | 1989.07–2008.12 | ||||||
| 31 | Cheongju2 | 1992.01–2008.12 | ||||||
| 32 | Hyungdo | 1995.01–2008.12 | ||||||
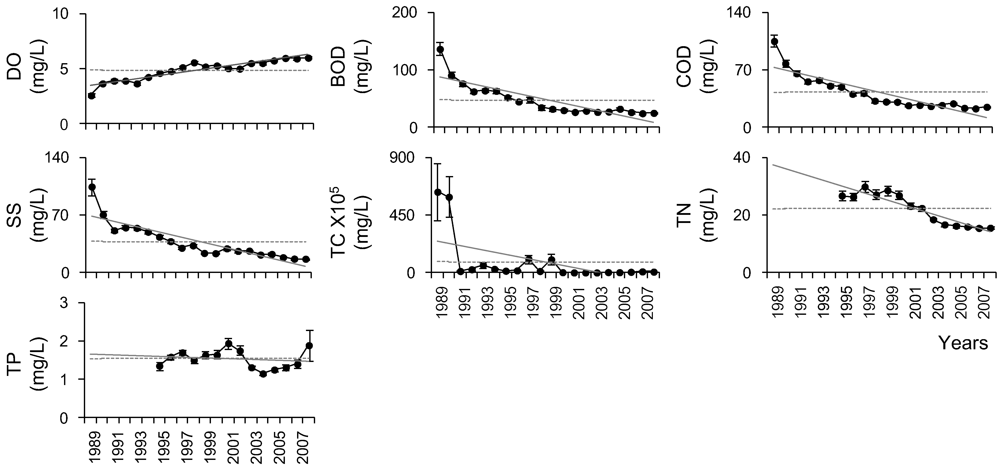
| Variables | Survey period | Samples/year | Mean | SE * | Valid N ** |
|---|---|---|---|---|---|
| Physico-chemical variables | |||||
| DO (mg/L) | 1989–2008 | 24 | 5.11 | 0.07 | 959 |
| BOD (mg/L) | 1989–2008 | 24 | 40.77 | 1.81 | 959 |
| COD (mg/L) | 1989–2008 | 24 | 36.98 | 1.18 | 959 |
| TSS (mg/L) | 1989–2008 | 24 | 32.59 | 1.12 | 959 |
| TC *** × 105 (mg/L) | 1989–2008 | 12 | 47.0 | 16.3 | 959 |
| TN (mg/L) | 1994–2008 | 12 | 21.72 | 0.75 | 776 |
| TP (mg/L) | 1994–2008 | 12 | 1.51 | 0.07 | 777 |
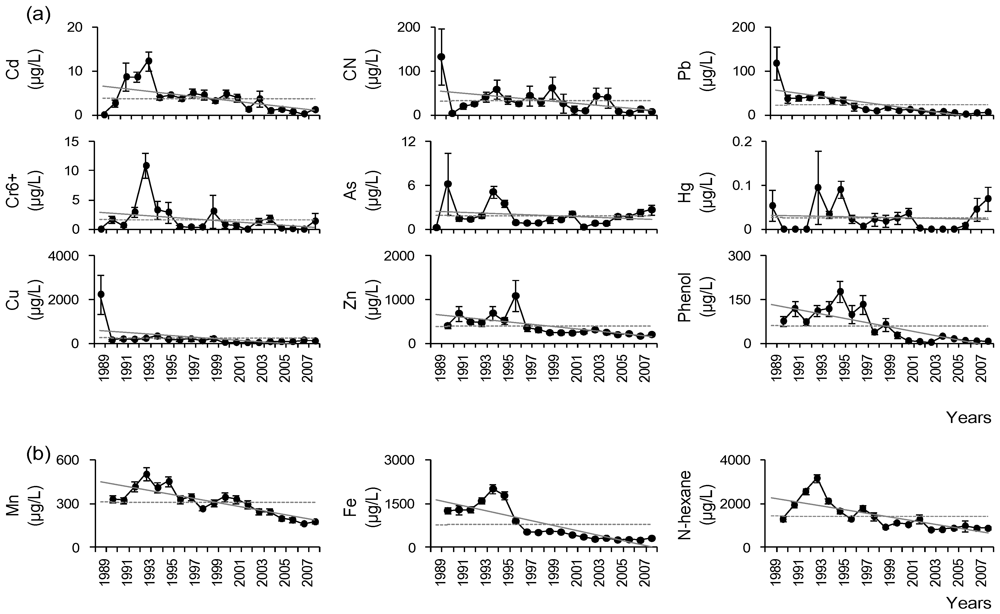
| Priority pollutants | |||||
| Cd (μg/L) | 1989–2008 | 12 | 3.42 | 0.36 | 959 |
| Cy (μg/L) | 1989–2008 | 12 | 28.56 | 5.68 | 959 |
| Pb (μg/L) | 1989–2008 | 12 | 17.44 | 2.23 | 959 |
| Cr6+ (μg/L) | 1989–2008 | 12 | 1.51 | 0.31 | 959 |
| As (μg/L) | 1989–2008 | 12 | 1.77 | 0.19 | 959 |
| Hg (μg/L) | 1989–2008 | 12 | 0.03 | 0.01 | 959 |
| Cu (μg/L) | 1989–2008 | 12 | 170.21 | 35.06 | 959 |
| Zn (μg/L) | 1989–2008 | 12 | 352.42 | 43.28 | 941 |
| Phenol (μg/L) | 1989–2008 | 12 | 50.73 | 7.43 | 941 |
| Non-priority pollutants | |||||
| Mn (μg/L) | 1989–2008 | 12 | 294.5 | 15.19 | 941 |
| Fe (μg/L) | 1989–2008 | 12 | 683.17 | 33.12 | 941 |
| n-Hexane (μg/L) | 1989–2008 | 12 | 1,325.45 | 60.01 | 941 |
3. Results
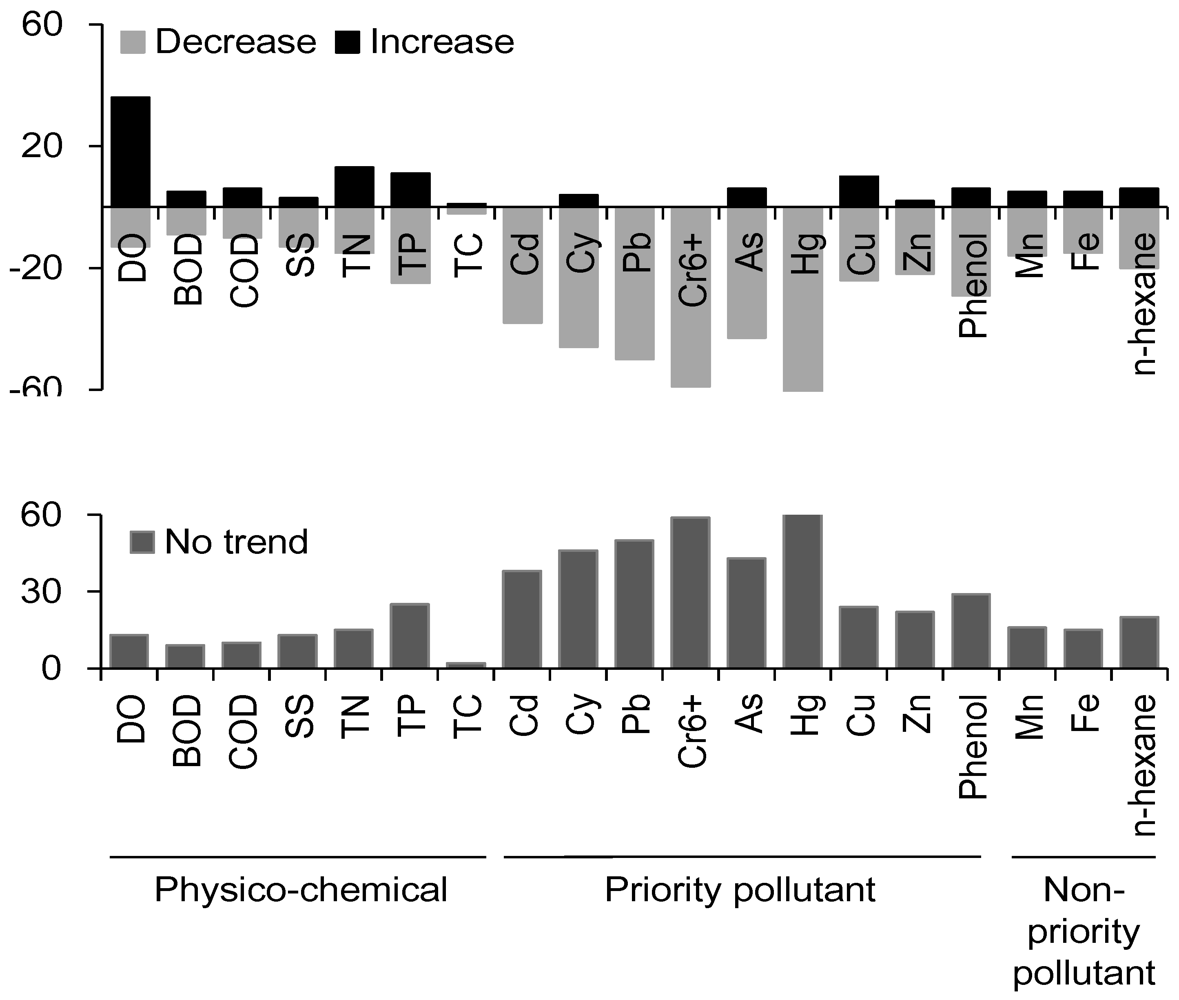
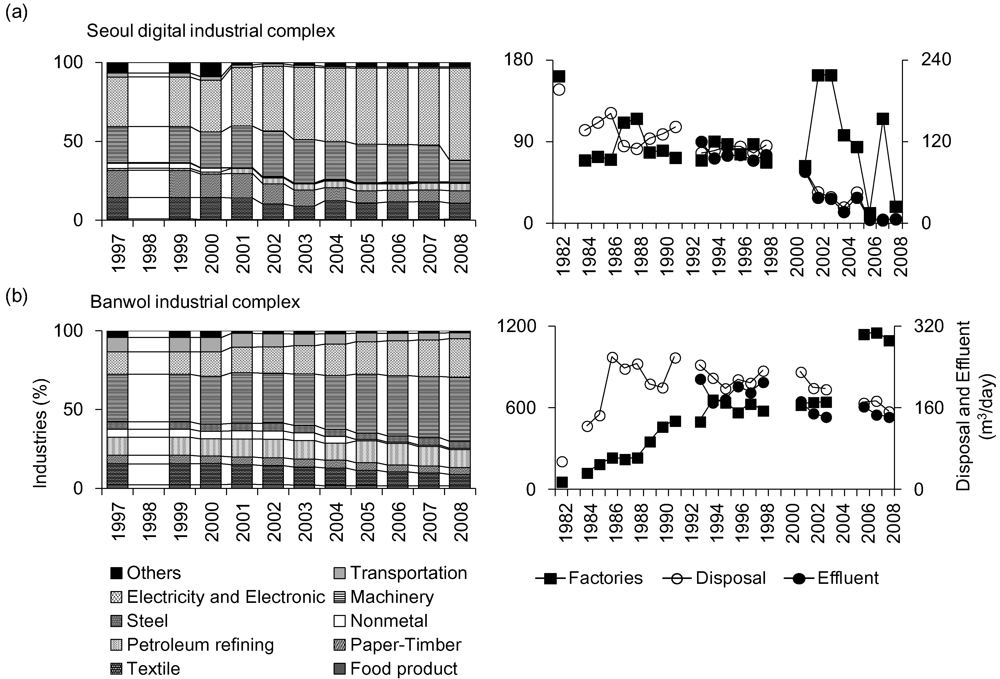
3.1. Changes in Water Quality


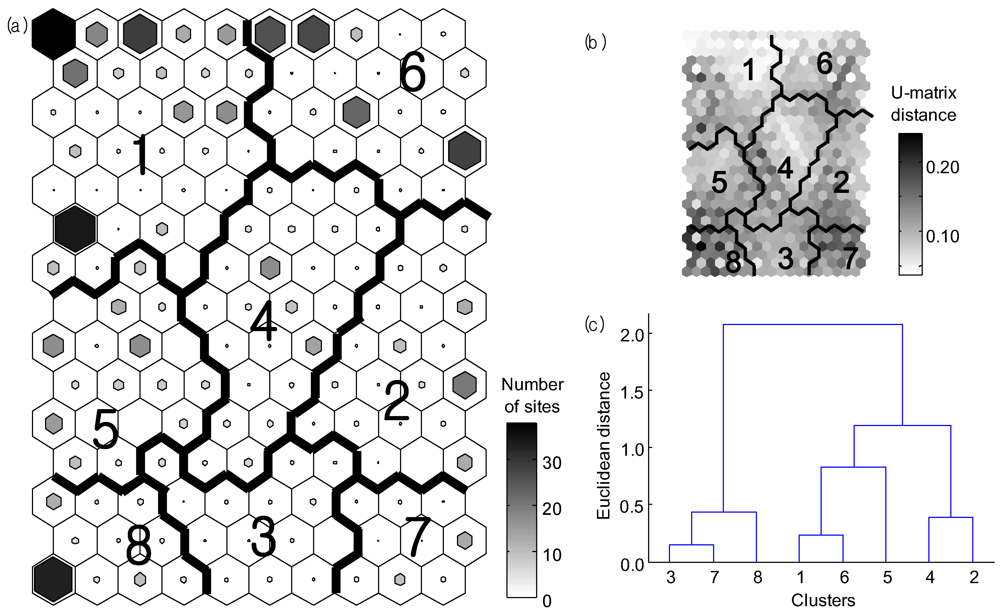
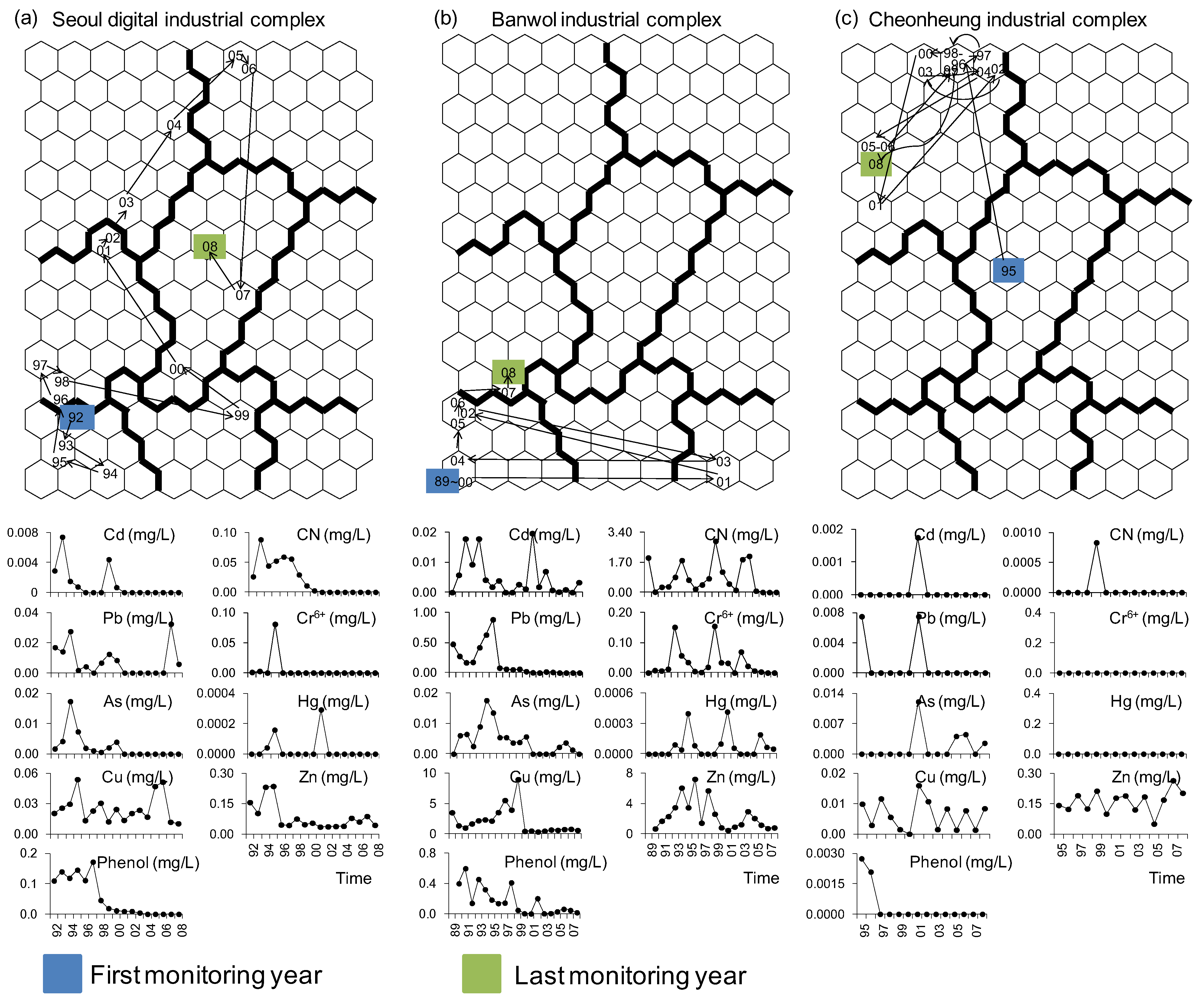
3.2. Pattern of Water Quality Changes

3.3. Differences in Water Quality among SOM Clusters
| Variables | Cluster | |||||||
|---|---|---|---|---|---|---|---|---|
| 1 | 2 | 3 | 4 | 5 | 6 | 7 | 8 | |
| Physico-chemical variables | ||||||||
| DO (mg/L) | 6.22 (0.12)a | 5.54 (0.22)ab | 4.92 (0.39)bc | 5.18 (0.2)b | 4.99 (0.18)b | 4.99 (0.18)b | 5.13 (0.4)b | 3.34 (0.28)c |
| BOD (mg/L) | 18.41 (2.43)d | 22.21 (4.61)cd | 37.08 (8.25)b | 36.74 (4.29)bc | 34.74 (3.79)c | 32.08 (3.69)c | 43.31 (8.43)ab | 105.74 (5.78)a |
| COD (mg/L) | 20.24 (1.39)d | 26.15 (2.64)c | 34.24 (4.74)b | 28.86 (2.46)bc | 31.23 (2.17)b | 30.75 (2.12)b | 41.91 (4.84)b | 88.07 (3.31)a |
| TSS (mg/L) | 18.42 (1.32)d | 18.63 (2.5)cd | 28.77 (4.49)b | 30.48 (2.33)b | 28.54 (2.06)b | 26.39 (2.01)bc | 28.44 (4.58)b | 62.06 (3.14)a |
| TC × 105(mg/L) | 12.4 (11.2)c | 2.7 (21.3)b | 12.5 (38.2)b | 14.6 (19.8)b | 10.3 (17.5)b | 48.8 (17.1)b | 12.9 (39.0)ab | 37.8 (26.7)a |
| TN (mg/L) | 13.87 (1.1)c | 22.33 (2.09)b | 25.03 (3.73)ab | 22.74 (1.94)b | 18.48 (1.71)b | 24.74 (1.67)b | 39.56 (3.82)a | 54.49 (2.61)a |
| TP (mg/L) | 1.25 (0.11)b | 1.08 (0.21)b | 2.1 (0.38)ab | 1.33 (0.2)b | 1.87 (0.18)b | 1.56 (0.17)b | 1.8 (0.39)b | 2.65 (0.27)a |
| Priority pollutant variables | ||||||||
| Cd (μg/L) | 0.13 (0.43)f | 11.74 (0.83)a | 1.59 (1.48)bc | 0.53 (0.77)de | 0.41 (0.68)ef | 2.3 (0.66)cd | 29.07 (1.51)a | 0.83 (1.04)b |
| Cy (μg/L) | 1.19 (9.22)e | 1.66 (17.52)de | 9.98 (31.39)b | 0.96 (16.3)d | 15.81 (14.4)bc | 10.67 (14.04)cd | 119.1 (32.06)b | 258.56 (21.97)a |
| Pb (μg/L) | 0.44 (2.39)b | 27.53 (4.53)a | 21.62 (8.12)a | 14.58 (4.22)a | 1.48 (3.73)b | 0.22 (3.63)b | 38.49 (8.29)a | 57.39 (5.68)a |
| Cr6+ (μg/L) | 0.37 (0.46)c | 0.01 (0.88)c | 0.28 (1.57)abc | 0.35 (0.81)c | 0.05 (0.72)c | 0.35 (0.7)c | 5.22 (1.6)ab | 8.59 (1.1)a |
| As (μg/L) | 2.01 (0.21)c | 1.21 (0.41)c | 1.29 (0.73)bc | 0.36 (0.38)cd | 0.85 (0.33)c | 0.07 (0.33)d | 3.17 (0.75)ab | 5.47 (0.51)a |
| Hg (μg/L) | 0.01 (0.01)b | 0.06 (0.01)b | 0.02 (0.02)b | 0.00 (0.01)b | 0.02 (0.01)b | 0.00 (0.01)b | 0.08 (0.02)ab | 0.10 (0.02)a |
| Cu (μg/L) | 11.8 (28.9)f | 35.6 (55.0)cd | 462.7 (98.5)bc | 45.2 (51.2)de | 31.3 (45.2)e | 49.6 (44.1)c | 176.1 (100.6)ab | 958.4 (68.9)a |
| Zn (μg/L) | 78.9 (75.8)e | 236.9 (144.1)bc | 708.4 (258.0)ab | 172.2 (134.0)cd | 130.3 (118.4)d | 239.1 (115.4)b | 999.8 (263.5)a | 2,054.9 (180.6)a |
| Phenol (μg/L) | 1.5 (12.0)b | 0.6 (22.8)b | 29.6 (40.8)a | 2.4 (21.2)b | 62.0 (18.7)a | 0.6 (18.2)b | 22.7 (41.6)a | 443.4 (28.5)a |
| Non-priority pollutant variables | ||||||||
| Mn (μg/L) | 128.7 (25.1)c | 418.3 (47.8)b | 293.4 (85.5)ab | 200.1 (44.4)b | 196.2 (39.2)b | 384.1 (38.3)b | 1045.4 (87.4)a | 491.1 (59.9)a |
| Fe (μg/L) | 251.0 (40.5)d | 454.1 (76.9)b | 544.6 (137.8)b | 497.3 (71.5)c | 413.9 (63.2)c | 568.4 (61.6)bc | 587.1 (140.7)ab | 1,903.2 (96.4)a |
| n-hexane (μg/L) | 648.4 (92.9)c | 520.3 (176.6)b | 1,504.9 (316.2)b | 1,426.8 (164.2)b | 1,215.4 (145.1)b | 1,014.9 (141.4)b | 1,871.1 (323.0)b | 3,536.7 (221.3)a |

4. Discussion

5. Conclusions
Acknowledgments
Conflict of Interest
References
- de Zwart, D. Monitoring Water Quality in the Future. In Biomonitoring; National Institute of Public Health and Environmental Protection (RIVM): Bilthoven, The Netherlands, 1995; Volume 3. [Google Scholar]
- Copeland, C. Water Quality: Implementing the Clean Water Act; CRS Report for Congress; US Congress: Washington, DC, USA, 2006. Available online: http://ncseonline.org/NLE/CRSreports/07Jan/RL33466.pdf (accessed on 3 October 2007).
- Copeland, C. Water Quality Issues in the 111th Congress: Oversight and Implementation; Congressional Research Service Reports; US Congress: Washington, DC, USA, 2009. [Google Scholar]
- DIRECTIVE 2000/60/EC of the European Parliament and of the Council Establishing a Framework for Community Action in the Field of Water Policy; European Union Law; EUR-Lex Home: Brussels, Belgium, 2000.
- Kallis, G.; Butler, D. The EU water framework directive: Measures and implications. Water Policy 2001, 3, 125–142. [Google Scholar]
- Council of the European Communities (CEC). Directive concerning the quality of surface waters intended for the abstraction of drinking water (75/440/EEC). Off. J. 1975, L194, 26.
- Council of the European Communities (CEC). Directive concerning the quality of bathing waters (76/160/EEC). Off. J. 1976, L31, 1.
- Council of the European Communities (CEC). Directive concerning the quality of fish waters (78/659/EEC). Off. J. 1978, L222, 1.
- Council of the European Communities (CEC). Directive concerning the quality of shellfish waters (79/923/EEC). Off. J. 1979, L281, 47.
- Council of the European Communities (CEC). Directive concerning urban waste water treatment (91/271/EEC). Off.J. 1991, L135, 40–52.
- Benedetti, L. Probabilistic Design and Upgrade of Wastewater Treatment Plants in the EU Water Framework Directive Context. Ph.D. Thesis, Ghent University, Ghent, Belgium, 2006. [Google Scholar]
- Kim, S.Y. Management status of industrial complex and policies. Environ. Inf. 2006, 28, 14–18. [Google Scholar]
- Korean Ministry of Environment, The Management and Improvement Plan of Industrial Wastewater; Ministry of Environment: Seoul, Korea, 2008.
- Shim, J.D.; Kang, H.K.; Lim, J.S.; Lee, C.M.; Han, J.E.; Seo, S.N.; Choe, C.S.; Kim, Y.H. A study on the water quality of effluent from Namdong industry complex. Rep. Incheon Inst. Heal. Environ. 2010, 12, 264–292. [Google Scholar]
- Korean Ministry of Environment, The Operating Plan of the Water Quality Monitoring Networks; Ministry of Environment: Seoul, Korea, 2011.
- Hirsch, R.M.; Slack, J.R.; Smith, R.A. Techniques of trend analysis for monthly water-quality data. Water Resour. Res. 1982, 18, 107–121. [Google Scholar] [CrossRef]
- Lettenmaier, D.P.; Hooper, E.R.; Wagoner, C.; Faris, K.B. Trends in stream quality in the continental United States, 1978–1987. Water Resour. Res. 1991, 27, 327–339. [Google Scholar] [CrossRef]
- Yu, Y.-S.; Zou, S.; Whittenmore, D. Non-parametric trend analysis of water quality data of rivers in Kansas. J. Hydrol. 1993, 150, 61–80. [Google Scholar] [CrossRef]
- Zipper, C.E.; Holtzman, G.I.; Darken, P.F.; Gildea, J.J.; Stewart, R.E. Virginia USA water quality, 1978 to 1995: Regional interpretation. J. Am. Water Resour. Assoc. 2002, 38, 789–802. [Google Scholar] [CrossRef]
- Chang, H.J. Spatial and temporal variations of water quality in the Han River and its tributaries, Seoul, Korea, 1993–2002. Water Air Soil Pollut. 2008, 161, 267–284. [Google Scholar]
- Kohonen, T. Self-organized formation of topologically correct feature maps. Biol. Cybern. 1982, 42, 59–69. [Google Scholar] [CrossRef]
- Kohonen, T. Self-Organizing Maps, 3rd ed; Springer: Berlin, Germany, 2001. [Google Scholar]
- Park, Y.S.; Chang, J.; Lek, S.; Cao, W.; Brosse, S. Conservation strategies for endemic fish species threatened by the Three Gorges Dam. Conserv. Biol. 2003, 17, 1748–1785. [Google Scholar] [CrossRef]
- Alhoniemi, E.; Himberg, J.; Parhankangas, J.; Vesanto, J. SOM Toolbox; Laboratory of Information and Computer Science, Helsinki University of Technology, 2000. Available online: http://www.cis.hut.fi/projects/somtoolbox/ (accessed on 31 March 2012).
- The Mathworks, Inc. MATLAB Version 6.1, The Mathworks, Inc.: Natick, MA, USA, 2001.
- Ultsch, A. Self-Organizing Neural Networks for Visualization and Classification. In Information and Classification; Opitz, O., Lausen, B., Klar, R., Eds.; Springer-Verlag: Berlin, Germany, 1993; pp. 307–313. [Google Scholar]
- Ward, J.H. Hierarchical grouping to optimize an objective function. J. Am. Stat. Assoc. 1963, 58, 236–244. [Google Scholar]
- Jain, A.K.; Dubes, R.C. Algorithms for Clustering Data; Prentice Hall: Englewood Cliffs, NJ, USA, 1988. [Google Scholar]
- McCune, B.; Mefford, M.M. PC-ORD-Multivariate Analysis of Ecological Data, Version 4.25, MjM Software: Glenden Beach, OR, USA, 1999.
- Crathorne, B.; Dobbs, A.J. Chemical Pollution of the Aquatic Environment by Priority Pollutants and its Control. In Pollution: Causes, Effects and Control; Harrison, R.M., Ed.; The Royal Society of Chemistry: Cambridge, UK, 1990; pp. 1–18. [Google Scholar]
- Zar, J.H. Biostatistical Analysis; Prentice Hall: Upper Saddle River, NJ, USA, 1999. [Google Scholar]
- StatSoft Inc. STATISTICA (Data Analysis Software System), Version 7. 2004. Available online: http://www.statsoft.com (accessed on 31 March 2012).
- Cho, H.Y. Issue of environmental pollution in industrial complex and the challenges of eco-industrial complex. Ind. Land Inf. 2006, 21, 2–7. [Google Scholar]
- Moon, C.I.; Lim, S.H. Weaving through paradoxes: Democratization, globalization, and environment politics in South Korea. East Asian Rev. 2003, 15, 43–70. [Google Scholar]
- Ku, M.J. The Current State and Prospects of Korea’s Eco-Industrial Parks. Ph.D. Thesis, Pusan National University, Pusan, Korea, 2010. [Google Scholar]
- Park, J.H.; Rhew, D.H.; Jung, D.I. Water quality status of the unit watersheds in the Yeongsan/Seomjin River Basin since the management of total maximum daily loads. J. Korean Soc. Water Qual. 2011, 27, 719–728. [Google Scholar]
- Lee, S.H. The discursive politics of water: Interurban struggles in the Nakdong River Catchment in South Korea. Urban Policy Res. 2002, 20, 281–298. [Google Scholar]
- Park, H.S.; Rene, E.R.; Choi, S.M.; Chiu, A.S.F. Strategies for sustainable development of industrial park in Ulsan, South Korea-from spontaneous evolution to systematic expansion of industrial symbiosis. J. Environ. Manag. 2008, 87, 1–13. [Google Scholar] [CrossRef]
- Lee, I.M. Restructuring and Managerial Improvement of Industrial Complexes: The Case of Seoul Digital Complex. Ph.D. Thesis, Dankook University, Gyeonggi-do, Korea, 2008. [Google Scholar]
- National Institute of Environmental Research, Generation and Process of Industrial Wastewater:The Result of the Factories Emitted Environmental Pollution Materials; Ministry of Environment: Seoul, Korea, 2010; (based on December 2008).
© 2012 by the authors; licensee MDPI, Basel, Switzerland. This article is an open-access article distributed under the terms and conditions of the Creative Commons Attribution license (http://creativecommons.org/licenses/by/3.0/).
Share and Cite
Bae, M.-J.; Kim, J.-S.; Park, Y.-S. Evaluation of Changes in Effluent Quality from Industrial Complexes on the Korean Nationwide Scale Using a Self-Organizing Map. Int. J. Environ. Res. Public Health 2012, 9, 1182-1200. https://doi.org/10.3390/ijerph9041182
Bae M-J, Kim J-S, Park Y-S. Evaluation of Changes in Effluent Quality from Industrial Complexes on the Korean Nationwide Scale Using a Self-Organizing Map. International Journal of Environmental Research and Public Health. 2012; 9(4):1182-1200. https://doi.org/10.3390/ijerph9041182
Chicago/Turabian StyleBae, Mi-Jung, Jun-Su Kim, and Young-Seuk Park. 2012. "Evaluation of Changes in Effluent Quality from Industrial Complexes on the Korean Nationwide Scale Using a Self-Organizing Map" International Journal of Environmental Research and Public Health 9, no. 4: 1182-1200. https://doi.org/10.3390/ijerph9041182