
Safety Evaluation of Evacuation Routes in Central Tokyo Assuming a Large-Scale Evacuation in Case of Earthquake Disasters


1
Graduate School of Informatics and Engineering, University of Electro-Communications, Chofu 182-8585, Japan
2
Graduate School of Information Systems, University of Electro-Communications, Chofu 182-8585, Japan
*
Author to whom correspondence should be addressed.
J. Risk Financial Manag. 2017, 10(3), 14; https://doi.org/10.3390/jrfm10030014
Submission received: 26 May 2017
/
Revised: 19 June 2017
/
Accepted: 20 June 2017
/
Published: 27 June 2017
(This article belongs to the Special Issue Risk Management Based on Intelligent Information Processing)
Abstract
:The present study aims to conduct a quantitative evaluation of evacuation route safety using the Ant Colony Optimization (ACO) algorithm for risk management in central Tokyo. Firstly, the similarity in safety was focused on while taking into consideration road blockage probability. Then, by classifying roads by means of the hierarchical cluster analysis, the congestion rates of evacuation routes using ACO simulations were estimated. Based on these results, the multiple evacuation routes extracted were visualized on digital maps by means of Geographic Information Systems (GIS), and their safety was evaluated. Furthermore, the selection of safe evacuation routes between evacuation sites for cases when the possibility of large-scale evacuation after an earthquake disaster is high is made possible. As the evaluation method is based on public information, by obtaining the same geographic information as the present study, it is effective in other areas, regardless of whether the information is from the past or future. Therefore, in addition to spatial reproducibility, the evaluation method also has high temporal reproducibility. Because safety evaluations are conducted on evacuation routes based on quantified data, the selected highly safe evacuation routes have been quantitatively evaluated, and thus serve as an effective indicator when selecting evacuation routes.
1. Introduction
From the experiences gained through the Great Hanshin Earthquake (1995) as well as the Great East Japan Earthquake (2011), in recent years, Japan has focused on disaster reduction by means of self and mutual help. In the case of Earthquake disasters, especially in crowded urban areas, many road blockages are likely to occur due to secondary disasters, including the collapse and combustion of buildings. Additionally, if an earthquake disaster occurs during a big event, such as the Tokyo Olympics and Paralympics, which will be held in Japan in 2020, busy urban areas especially around stadiums are expected to be crowded with evacuees. Therefore, in such cases, it is necessary to put an emphasis on how to reduce damage for risk management in central Tokyo.
To make a quick and safe “escape” from disasters, a clear evacuation plan, or more specifically, an evacuation route, must be developed. Current efforts to develop such evacuation plans by means of self and mutual help include activities such as walking the streets for disaster prevention and disaster drills using maps; an example of the latter is Disaster Imagination Game (DIG), which was created by Komura and Hirano (1997). However, as the main purpose of creating evacuation routes using such activities is the promotion of disaster prevention awareness and disaster prevention education, they are not quantitatively evaluated. As a result, the evacuation plans developed in the way described above may be influenced by the developers’ subjective thinking, and its practicability remains uncertain.
Based on the backdrop mentioned above, assuming a large-scale evacuation in the case of an earthquake disaster, the present study aims to conduct a quantitative evaluation of safety concerning evacuation routes using the Ant Colony Optimization (ACO) algorithm for risk management in central Tokyo. Additionally, the multiple evacuation routes extracted will be visualized on digital maps by means of Geographic Information Systems (GIS), and their safety will be evaluated. Based on the evaluation results, the present study will provide effective information concerning disaster reduction through self and mutual help, namely, the development of evacuation plans by individuals and voluntary disaster prevention organizations in regional communities.
In Section 3, ACO algorithm, which is the most important factor for the safety evaluation of evacuation routes in the present study, will be briefly introduced. In Section 4, in addition to selecting the target area of the present study, road network data using GIS will be made. In Section 5, road blockage probability per road and the number of estimated evacuees on roads will be calculated; a hierarchy cluster analysis using the former will be conducted; and roads will be classified by focusing on the similarity in safety. In Section 6, an evaluation experiment of ACO algorithm concerning the target area will be conducted. More specifically, a simulation of congestion conditions of evacuation routes in the target area will be conducted; the parameter of the most valid evaluation results will be applied to ACO; and the congestion rate of each evacuation route will be calculated. As the present study assumes a large-scale evacuation, in Section 7, evacuation routes with high congestion rates will be extracted and visualized on a digital map by means of GIS, and their safety will be evaluated. In the present study, ArcGIS Ver.10.1 of ESRI will be used as GIS, and construction of road network data, spatial analysis and the visualization of evacuation route choices will be conducted.
2. Related Work
The present study is related to: (1) evacuation routes; (2) road blockages; (3) spatial analysis using geographic information; and (4) application of ACO algorithm for route searches. Regarding studies related to (1) evacuation routes, Liu et al. (2006) developed an adaptive evacuation route algorithm that can respond to condition changes by the time course of flood disasters, using Dijkstra’s algorithm, which is the shortest route search method, as well as the flood disaster simulation by the Disaster Management Spatial Information System (DiMSIS). Alçada-Almeida et al. (2009) proposed a GIS-based decision support system that incorporates a multi-objective approach to locate emergency shelters and identifies evacuation routes in urban areas. Onorati et al. (2014) proposed a semi-automatic technique for knowledge acquisition and modeling on accessible evacuation routes using ontology. Shimura and Yamamoto (2014) proposed an evacuation route search method using a multi-objective genetic algorithm (GA).
Regarding studies related to (2) road blockages, using Higashinada Ward, Kobe City as an example, Imaizumi and Asami (2000) extracted an estimation model of road blockage probability and proposed a method for evaluation of urban area structure including road networks focusing on blocked intersections. Takeuchi and Kondo (2002) considered evacuation from a tsunami after an earthquake disaster, and analyzed evacuation routes that considered road blockage caused by the collapse of buildings and overall evacuation distance. Additionally, Ichikawa et al. (2004) indicated that road blockages due to building collapses greatly hinder evacuation, as it would not only create areas isolated from any evacuation sites, but also extend the evacuation distance as well as cause changes in evacuation sites. Moreover, they demonstrated that road blockage conditions and the distance distribution to the nearest evacuation site greatly differed, even within the same town or block, and that not only road width but also adjacent building conditions can affect road blockage conditions.
Regarding studies related to (3) spatial analysis using geographic information, Koarai et al. (2007) demonstrated the effectiveness of spatial analysis using GIS by analyzing a land condition map superimposed with information of past building damage caused by earthquakes on GIS, in addition to examining the relationship between foundation disasters caused by earthquakes and land conditions. By means of GA using geographic information, Asou et al. (2007) extracted the optimum location for evacuation sites in case of a disaster, while Inoue and Yamamoto (2013) extracted the optimum location for tourism related facilities in urban tourist areas.
Regarding studies related to (4) application of ACO algorithm for route searches, Nakamichi and Arita (2003) introduced stochastic choices in the ASrank method, which is the latest extension of ACO, as an operation to adjust the circuit diversity, and examined the obtained results. Mochio and Kitahara (2016) reproduced the ever-changing disaster conditions using information of the great earthquake obtained from the Rescue simulator, and by reducing the amount of calculations by means of ACO, real-time searches for the optimum evacuation route was conducted.
The present study comes under the first category of studies, and conducts the safety evaluation of evacuation routes referring to the results of studies related to (2) road blockages, (3) spatial analysis using geographic information, and (4) application of ACO algorithm for route searches. In studies related to (1) evacuation routes, though evacuation routes were extracted, their safety has not yet been evaluated. Additionally, comparing the related studies as shown above, the present study particularly targets crowded urban areas as well as densely populated areas, and in order to provide effective information concerning the development of evacuation plans for earthquake disasters, originality and usefulness will be displayed when quantitatively evaluating the safety of evacuation routes. Specifically, assuming a large-scale evacuation in case of an earthquake disaster, the present study will conduct the quantitative evaluation of safety concerning evacuation routes using ACO algorithm for risk management, in order to provide effective information for the development of evacuation plans using self-help and mutual help methods, which are more direct forms of natural disaster reduction help.
3. ACO Principles and Basic Model
In this section, ACO algorithm will be briefly introduced. ACO is a search method which mimics the path generation process when the ant is on the hunt for food, and it has been applied to combinatorial optimization problems such as the Travelling Salesman Problem (TSP), and has had many effective research results. Ants use pheromones to communicate while they move as a group, resulting in a type of organized system. ACO uses this system formation process for searches.
ACO basic model has been represented by an algorithm called the Ant System (AS) by Dorigo et al., and its original model dates back to the 1990s to their earlier studies (Dorigo et al. 1999). Based on AS which is the basics of ACO, ACO algorithm, stochastic route selection methods, and the numerical modeling of pheromones will be explained.
3.1. ACO Algorithm
The ACO flowchart is as shown in Figure 1, and each step shown will be explained below. In the present study, “Ant” will hereinafter be called “agent”.
- Step 1:
- Initial pheromone information will be attached to all routes, and the initial location of each agent will be set at random.
- Step 2:
- Each agent will randomly pick a route based on pheromone information and heuristic information.
- Step 3:
- The total distance of the collection of routes (circuit) selected by each agent in Step2 will be calculated.
- Step 4:
- Based on the total distance of the circuit mentioned in Step3, pheromone information will be attached to each route in the circuit. At the same time, a certain amount of pheromone put on all routes will be vaporized.
- Step 5:
- The process will go back to Step2, if the number of searches is below the maximum amount, and if it goes over the maximum number, the process will end here.
As shown above, ACO algorithm is simple, and all that is needed is a stochastic route selection method, heuristic information and pheromone information. This will be explained in more detail below.
3.2. Stochastic Selection Method of Routes
Stochastic route selection by ACO is determined by the pheromone information accumulated on the routes as well as heuristic information. The probability Pijk of agent number k selecting the route from i to j is calculated by means of Equation (1).
Here, pheromone information is τij(t), time is t, heuristic information is ηij, α is a multiplier of pheromone information, β is a multiplier of heuristic information, and C is a collection of routes which can be selected from routes starting from i.
(1) Heuristic Information
Heuristic information ηij generally uses the reciprocal number of the route’s distance. Therefore, if the route distance is dij, ηij can be defined by Equation (2).
When an agent is selecting a route, heuristic information selects a shorter route ahead without any connection with the total distance of the circuit.
(2) Pheromone information
Pheromone information is the one that is accumulated on routes and it is attached to each route of the circuit selected by an agent. The shorter the total distance of the circuit is, the higher the pheromone information value becomes. Additionally, the attached pheromone information decreases with the passing of time. Therefore, ACO takes into consideration the characteristics of the pheromone information, as well as the time variation as mentioned above.
The pheromone information τij (t) accumulated on route (i–j) at a certain time t evaporates at a rate of ρ concerning t + 1. Additionally, suppose more pheromone information is added by all agents. In other words, pheromone information τij (t + 1) for t + 1 can be calculated using Equation (3).
Here, the number of agents is n, the added pheromone information by agent number k is (t), and regarding the latter, the value becomes higher when the total distance of the circuit is shorter. Therefore, the added pheromone information from the total distance of the circuit selected by the agent can be calculated using Equation (4).
Here, Lk is the total distance of the circuit selected by agent number k. As the pheromone information evaporates with the passing of time, this prevents focusing on recent activities and getting localized solutions, and makes searches for a wide range of solutions possible.
4. Selection of Target Area and Creating Road Network Data
4.1. Selection of Target Area
Large-scale evacuations are when many people around venues of large events have to evacuate. As the Olympics and Paralympics are to be held in Tokyo Metropolis in 2020, an increase in tourists around the stadiums and other venues is expected. Therefore, if an earthquake disaster occurs in such areas, the probability of a large-scale evacuation is high. Consequently, as shown in Figure 2, Sendagaya of Shibuya Ward, an area close to the New National Stadium which will be the main venue of the Tokyo Olympics and Paralympics, is chosen as the target area.
4.2. Evacuation Rules
4.2.1. Order of Evacuation
If an earthquake disaster occurs in Tokyo Metropolis, especially in crowded urban areas, many road blockages are likely to occur due to secondary disasters which include the collapse and combustion of buildings. Therefore, in Tokyo Metropolis, the principal of a two-step evacuation on foot must be kept as an evacuation rule in case of an earthquake disaster. In this two-step evacuation, as a first step in the evacuation from the occurrence of a disaster, evacuees will evacuate to a temporary gathering sites and the damage situation will be confirmed. Elementary and junior high schools and parks are assigned as temporary gathering sites according to each neighborhood association. After checking the damage situation, if the temporary gathering site is seen as dangerous, an evacuation to a wide-area evacuation site will be made as part of the second step. Sites that are more than 10 hectares and cannot be affected by the radiant heat from fires are assigned as wide-area evacuation sites by the Tokyo Metropolitan Government. On the other hand, if the damage caused by fires following the disaster extends significantly and the evacuation to temporary evacuation site is seen as dangerous, evacuees will be instructed to go directly to wide-area evacuation sites (direct evacuation).
In the present study, in order to evaluate the safety of evacuation route assuming a large-scale evacuation, the travel between evacuation sites will be assumed and the safety of route between evacuation sites will be evaluated. This is because damage from fires are to be little as the target area is a fireproofed area, and the probability of direct evacuation cases to wide-area evacuation sites are estimated to be low. Additionally, in case of a large-scale evacuation, there may be a need for evacuees to move to other evacuation sites, when certain evacuation sites become overcrowded.
4.2.2. Assignment of Evacuation Sites
With reference to “Disaster Prevention Facilities, Shelters and Evacuation Areas in Tokyo Metropolis” (Tokyo Metropolitan Government 2017) and “Shibuya Ward Disaster Prevention Map” (Shibuya Ward 2017), as with the target area in the present study, north block 1 of Sendagaya, Shibuya Ward, near the main stadium for the Tokyo Olympics and Paralympics, is assigned as a wide-area evacuation site. Additionally, nine locations are also assigned as temporary evacuation sites. Therefore, in the present study, a total of ten evacuation sites have been set as both the evacuation starting points as well as destination points, and searches for evacuation routes will be conducted.
4.2.3. Evacuation Distance and Time for Evacuation Routes
Based on Urban Disaster Prevention Office of the City Bureau, Ministry of Construction (1997) and Director-General for Disaster Management in the Cabinet Office (2005), taking into consideration walking speed and evacuation time in times of a disaster, locations that are within 2 km of walking distance is assigned as wide-area evacuation sites. Regarding walking speed, though it is generally said to be about 4 km/h, taking into consideration the elderly and children as well as the fact that this is in case of a disaster, walking speed is considered to be 2 km/h which is half the normal speed (speed can drop to 1 km/h if in the dark). Regarding evacuation time, from the fatality occurrences according to the cause in the Great Kanto Earthquake (1923), it became evident that the fatalities caused by fire rapidly increased 3 h after the earthquake, and that the first hour after earthquake quickly passed by with the transportation of injured people, first-aid firefighting, and situation grasping. Therefore, though this leaves 2 h for evacuation, if another hour is allowed as a margin, only an hour is left for the actual evacuation time. Hence, the evacuation distance for an hour of evacuation time is around 2 km. This shows that for evacuation route in case of wide-area evacuation, the evacuation distance must be within 2 km and a route that is within an hour of evacuation time is desirable. As mentioned in the previous section, because the present study sets all evacuation sites including temporary evacuation sites as targets, evacuation routes within 1 km of evacuation distance and 0.5 h of evacuation time are considered desirable.
4.3. Making of Road Information Using GIS
4.3.1. Collection and Processing of Data Used
According to “District-based assessment of vulnerability to earthquake disaster (No. 7) in Tokyo Metropolis” published by the Tokyo Metropolitan Government, it is necessary to consider the road blockage caused by building collapses on the evacuation routes in the target area. Table 1 shows the data used in the present study and how the data was processed. In the present study, the same kinds of data were used and processed by the same method as Shimura and Yamamoto (2014). Information on the probability of total building collapse, sorted by ground area and building type, from “District-based assessment of vulnerability to earthquake disaster (No. 7) in Tokyo Metropolis” was used in calculating the road blockage probability and adding it to the road network. However, data on the year each building was constructed is fixed asset tax roll data which falls into the category of personal information, and it is difficult for individuals to obtain. Therefore, in the present study, the case of the worst damage possible was imagined, and it was assumed that all wooden buildings were constructed prior to 1970. Further, based on “District-based assessment of vulnerability to earthquake disaster (No. 7) in Tokyo Metropolis”, a uniform probability of total building collapse of 50.99% was used.
Further, in the present study, crowding in roads due to population concentration is taken into account as a chief cause of obstacles to evacuation. The nighttime and daytime populations sorted by administrative address units such as block, subdivision and aza (the smallest administrative unit in Japan) were considered (Table 1). The estimated populations in roads in both cases of daytime and nighttime were calculated.
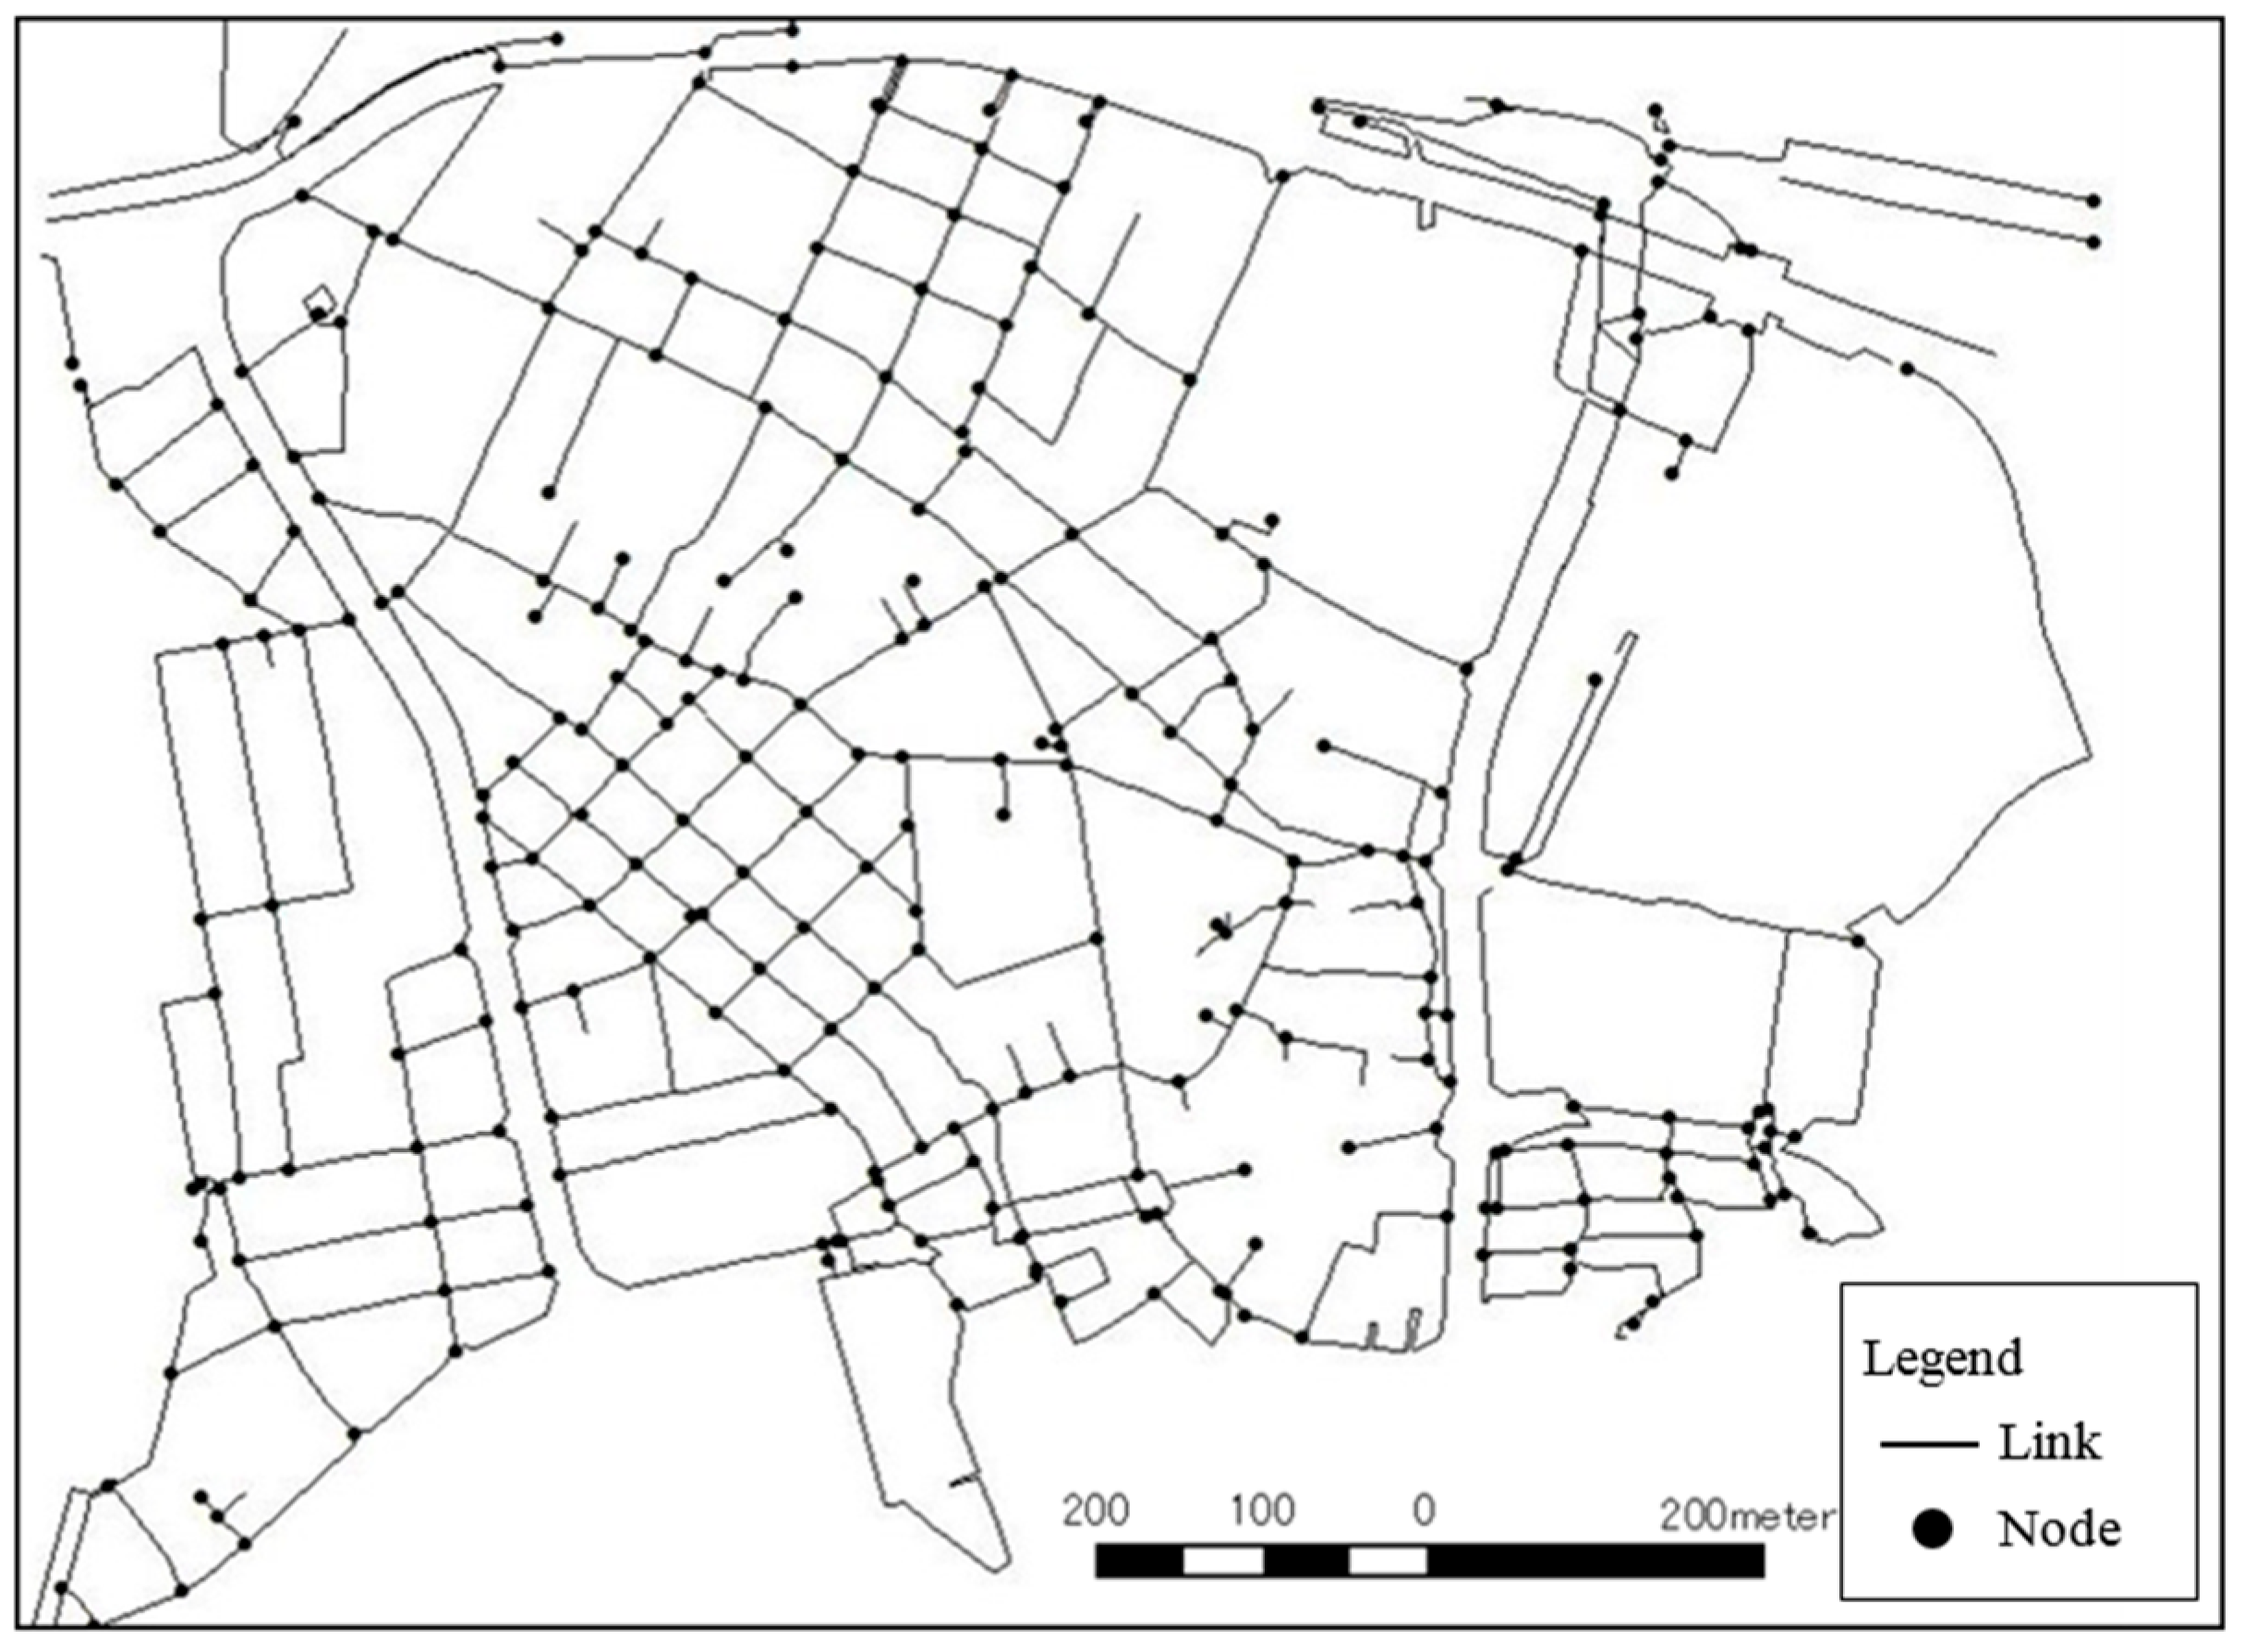
4.3.2. Making of Road Network Data
In the present study, the road blockage probability will be calculated from the relationship between the debris width buffer of wooden buildings along the road and the road’s centerline located in front of the buildings. Therefore, the road centerlines will be extracted from land use data, and using the data obtained, node data with intersection and junctions as well as link data with roads connecting the intersections and junctions will be made. Additionally, by integrating the above data, a road network data will be made. Figure 3 shows the road network made with the process mentioned above in the target area, and road information will be added to the data in the next section.
5. Road Classification Using Hierarchy Cluster Analysis
5.1. Generating of Road Network Information Using GIS
In the present study, the road network information was generated in the same method as (Shimura and Yamamoto 2014).
5.1.1. Calculation of Road Blockage Probability and Its Addition to the Road Network
Road blockage probability was added to the road network data shown in Figure 3 as an attribute. The present study takes into account two types of blockage: (1) Single blockage, defined as being when a road is blocked by the collapse of a wooden building on only one side of a road; and (2) Combined blockage, defined as being when a road is blocked by the collapse of wooden buildings on both sides of a road. Here, in the case of (1) single blockage, when the debris width produced by a collapsed building intersects with a building shape located on the other side of the road, the road located between these buildings is regarded as being blocked. Further, in the case of (2) combined blockage, when the debris widths produced by collapsed buildings on both sides of the road intersect, the road located between these collapsed buildings is regarded as being blocked.
Regarding road blockage probability for the case of (1) single blockage, since the road will be blocked by the collapse of one wooden building on one side of the road, the blockage probability is regarded as being the same as the probability that a wooden building will collapse. Meanwhile, in the case of (2) combined blockage, since the road is blocked when buildings on both the left and right sides of the road collapse, the blockage probability is found by multiplying the collapse probabilities for buildings on the left and right sides of the road. Below, methods for calculating road blockage probability and adding it to the road network are described.
(1) Roadside building extraction and classification
Roadside buildings, which are a primary factor in road blockage, were extracted. First, a buffer from the road centerline was created on the right side only, and the spatial search function of the GIS was used to extract buildings which intersected with the buffer. Similarly, next a buffer from the road centerline was created only on the left side, and buildings which intersected with the buffer were extracted. By following these steps, buildings were classified into those located on the right side of the road and those located on the left side of the road.
(2) Extraction of roadside wooden buildings and addition of collapse probability
Using the attribute search function of the GIS, wooden buildings were extracted from both the buildings on the right side and the buildings on the left side. Further, probability of collapse was added as an attribute to each of the wooden buildings.
(3) Extraction of pairs of buildings which would cause blockage
(a) Case of single blockage
A buffer with a radius equal to the debris width which would be produced from a wooden building on the right side of the road if it collapsed was created, and the spatial search function of the GIS was used to extract any building on the left side of the road which intersected with the buffer. The same was done for the left side of the road, and pairs of buildings which would cause single blockage were extracted. Regarding the outflow of debris that occurs when a building collapses, the case of maximum damage was imagined, and it was assumed that debris would flow out evenly in all directions. Further, regarding the debris width, with reference to Ichikawa et al. (2004), the debris width was found using Equation (5), given below. Regarding the number of floors in buildings, reference was made to data on the present building use situation. As the average floor height, a uniform average floor height of 3 m was used.
(Debris width) = (Number of floors) × (Average floor height)
(b) Case of combined blockage
Debris width buffers were created for wooden buildings on both the left and right sides of the road. The spatial search function of the GIS was used to extract left-side debris buffers which intersected with right-side debris buffers and right-side debris buffers which intersected with left-side debris buffers. These steps were performed to extract buildings on the right side and buildings on the left side which would cause combined blockage.
(4) Generation of road section lines
With reference to Yoshikawa et al. (2003), section lines (lines which connected the center points of buildings which would cause road blockage) were created. Using the XY To Line tool of the GIS, line data was generated for lines which connected the center points of buildings which would cause road blockage (which were extracted in (3) above), and this data was used as section lines. XY coordinates which were the center points of buildings were found using the geometry arithmetic function of the GIS. Section lines were generated to suit three types of case - the case of single blockage caused by the collapse of wooden buildings on the right side of the road, the case of single blockage caused by the collapse of wooden buildings on the left side of the road, and the case of combined blockage. Further, blockage probability which suited the type of blockage was added for each case.
(5) Addition of blockage probability to road network
Using the spatial coupling tool of the GIS, to each road link which intersected with the three types of section line generated in (4) above, blockage probability (indicated by pk) for each of the points on section lines (indicated by k) was added.
(6) Calculation of road blockage probability
Through the above operations, to each road link, blockage probabilities (indicated by pk) for points on section lines (these points were indicated by k) were added. The probability Ps that all points k on the section lines of each road link would be passable was calculated using the blockage probability pk, and is expressed by Equation (6) (Takeuchi and Kondo 2002).
Therefore, the road link blockage probability Pb was found using the Equation (7) below:
Using the field arithmetic function of the GIS, the above-described calculations were performed on the attribute table of road link data, and blockage probability was calculated for each road link.
5.1.2. Calculation of Estimated Evacuation Population in Road and Its Addition to the Road Network
The estimated population of evacuees which would occur in each road at the time of a disaster outbreak was calculated, and was added to road links as an attribute. Estimated population is used in the ACO when calculating evacuation time for a route. Below, methods for calculating the estimated population within a road and adding it to the road network are described. In the present study, populations in both cases of daytime (07:00–18:00) and nighttime (18:00–07:00) evacuations were used to calculate the estimated population in roads.
- (1)
- Using the spatial search function of the GIS, based on data on present use of buildings which intersected with block (called chome in Japan) polygon data taken from data on the present land use situation, for each block, the buildings in the block were extracted.
- (2)
- Using the attribute search function of the GIS, from the data on buildings extracted in step (1), only the single or detached houses and apartment buildings or housing complexes with many evacuees were extracted.
- (3)
- Using Equation (8), estimated populations which matched the total floor space of each residence were assigned. Calculation for Equation (8) was performed using the field arithmetic function of the GIS in attribute fields for building data.
- (4)
- Using the spatial coupling tool of the GIS, the estimated evacuation population of each residence was assigned to the road link closest to the residence.
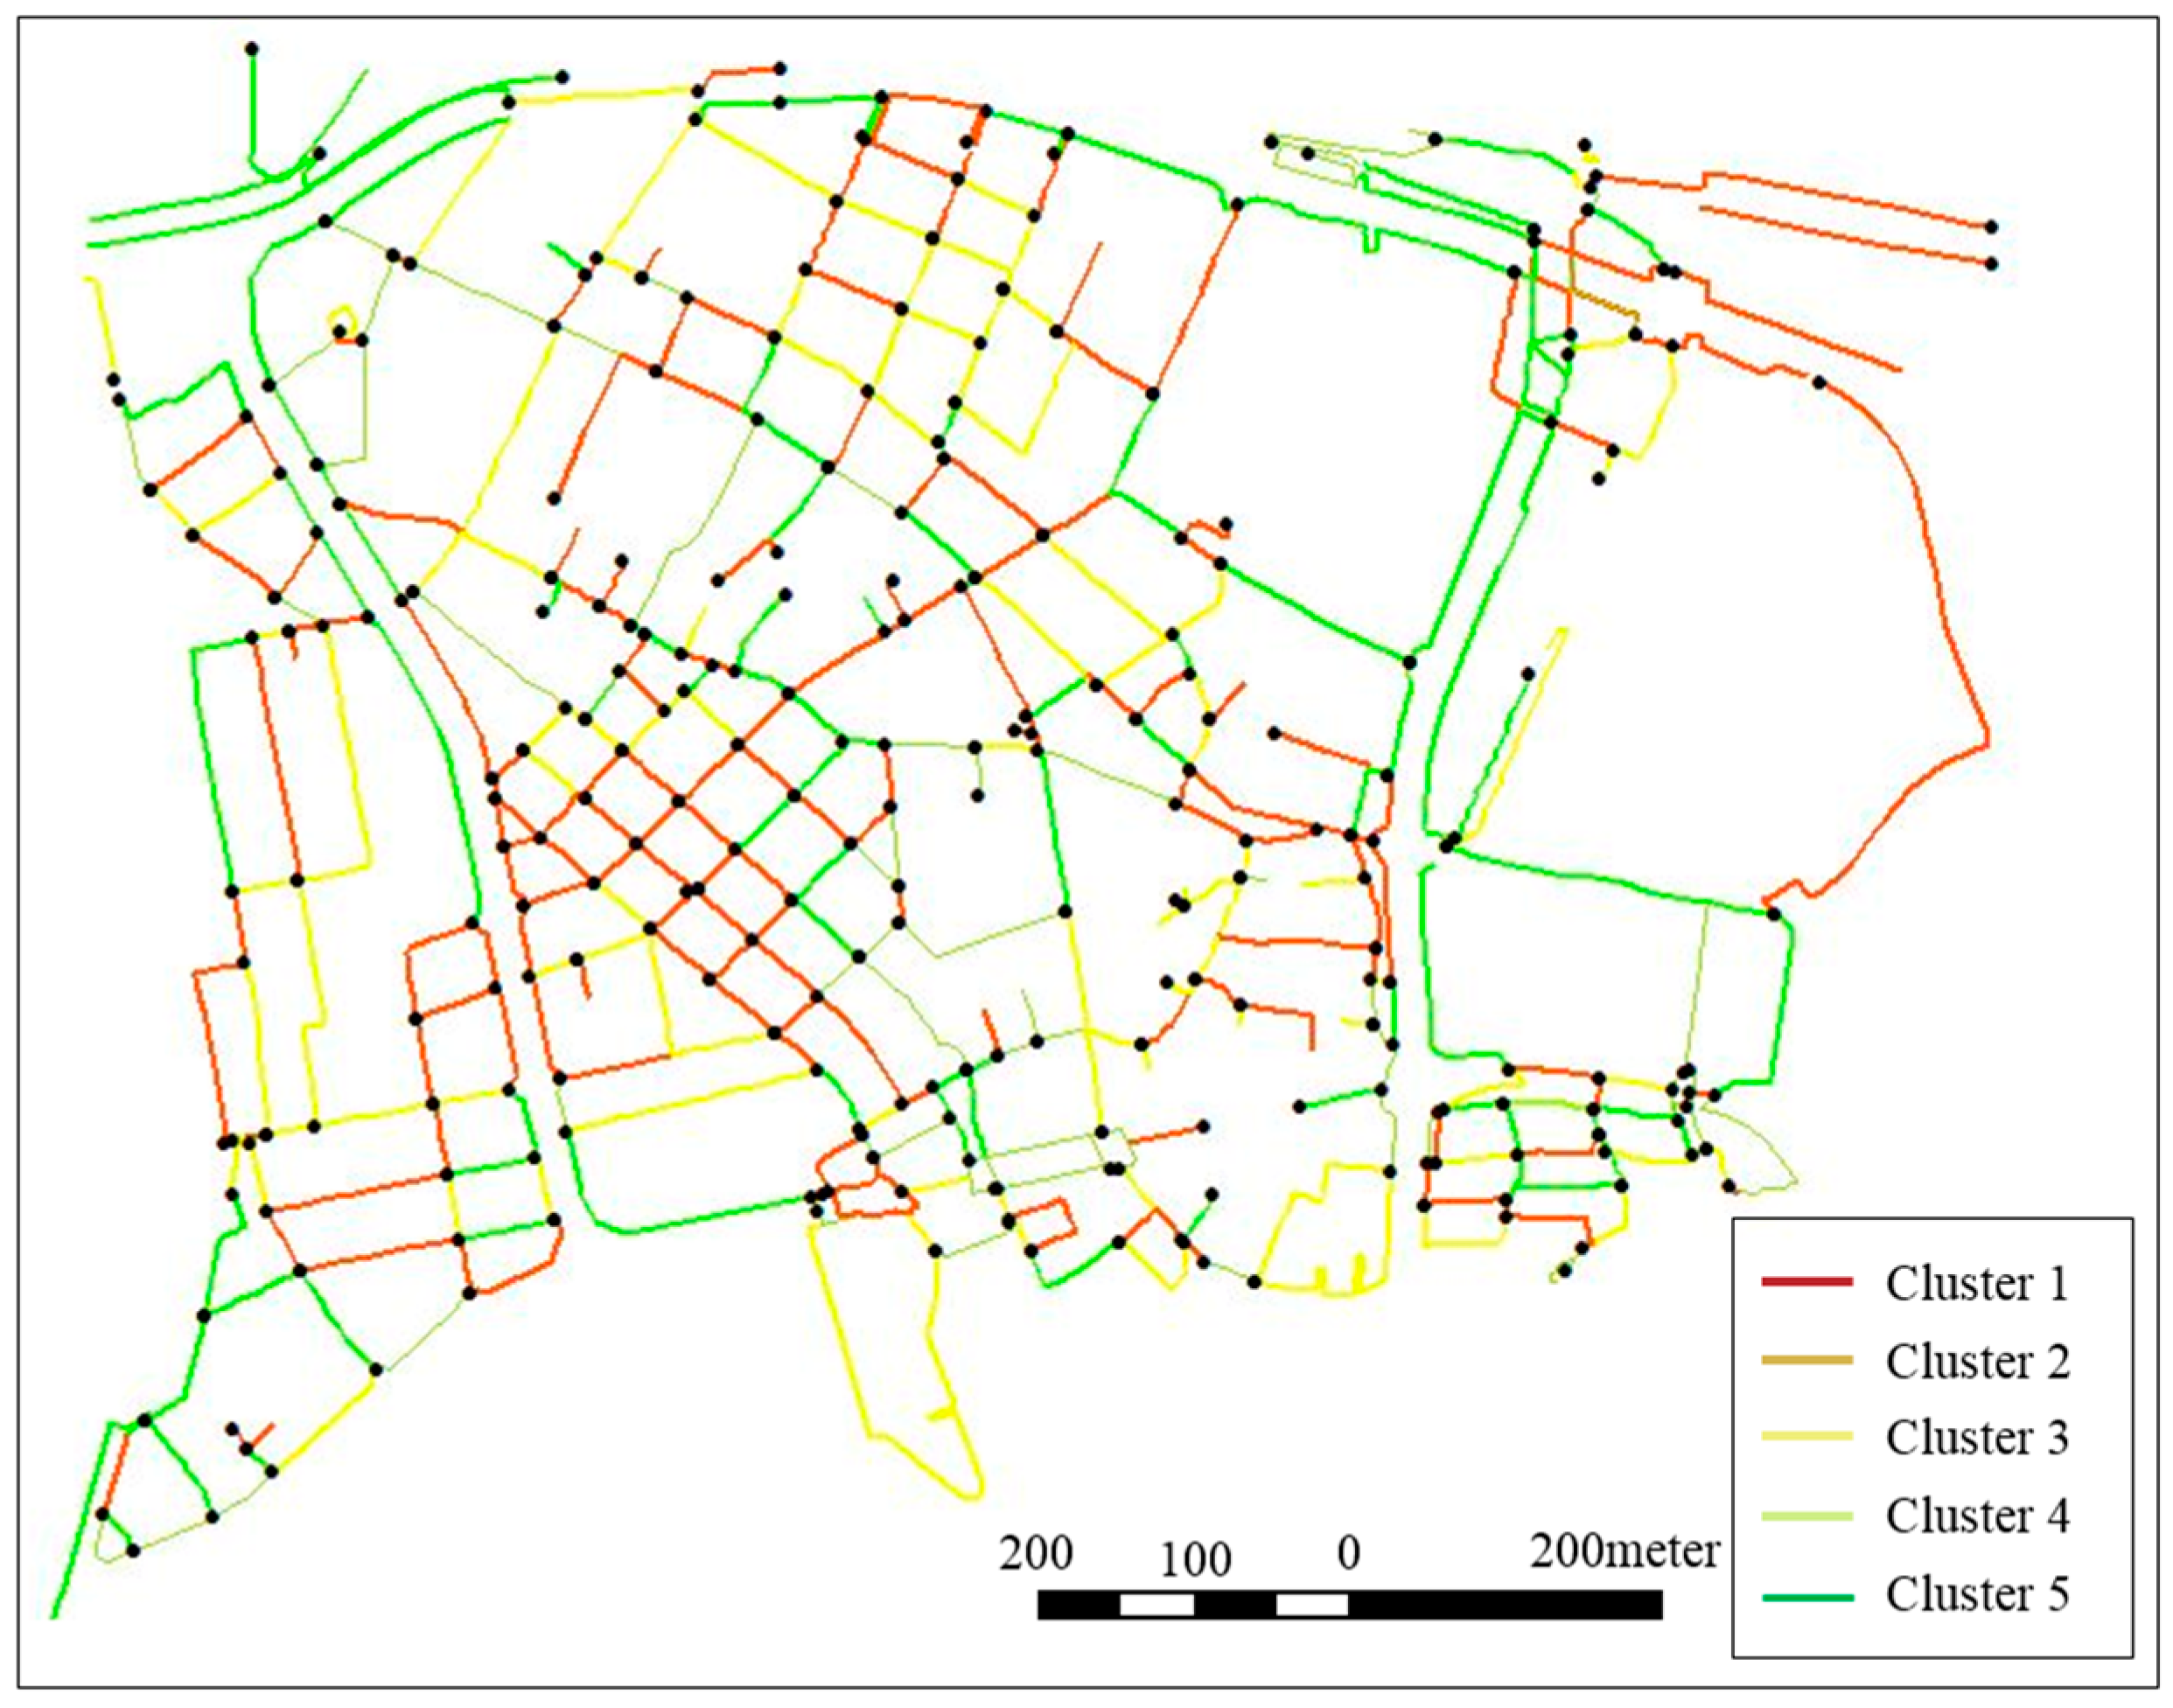
5.2. Road Classification
Focusing on the similarity in safety and setting the road blockage probability calculated on the basis of building collapse risk in the previous section as a variable, all roads in the target area were classified by the hierarchy cluster analysis using MATLAB. The Euclidean distance as the distance between objectives, and Ward’s method for calculation of the distance between clusters are used. The result from road classification is shown in Figure 4. In Figure 4, cluster 1 has the lowest safety, and safety levels are classified into 5 levels. The road classification results will be referred to when estimating the congestion rate using ACO.
6. Evaluation Experiment of the ACO Algorithm
In this section, an evaluation experiment will be conducted to demonstrate the effectiveness of the ACO algorithm. Using the information of large earthquakes obtained from a Rescue simulator, the ever-changing disaster conditions will be replayed. Additionally, route searches using ACO, which is a crowd flow model and metaheuristic solution, will be conducted to reduce the amount of calculations and to estimate real-time congestion in evacuation routes. In the evaluation experiment in this section, as described in Section 4.2.2, evacuation starting points and destination points are all considered as evacuation sites, and the congestion condition of evacuation route between evacuation sites will be estimated.
6.1. Method
6.1.1. Congestion Estimation Using the Back-Track Method
In the present study, when trying to obtain the number of evacuation routes from geographical information, a simulation by the back-track method using MATLAB will be conducted. The back-track method is a type of search that prioritizes depth, and when searching for a solution using this method, a potential process will be tested according to order. If it becomes evident that a solution cannot be found in a certain process, it will go back to the previous step and a different process will be tested. Therefore, this method thoroughly covers all possibilities. However, as it stops calculating and goes back to the previous step as soon as it becomes evident that a solution cannot be found, it is more efficient than the diallel estimation.
6.1.2. Simulation Process
According to the following procedures, the simulation will be conducted.
- (1)
- 1st tour
- (i)
- All ants will select an evacuation route at random with the same probability.
- (ii)
- The evaluation function of the evacuation routes selected by each ant will be calculated.
- (iii)
- Based on the evaluation function value selected in (ii), pheromones will be attached to the evacuation routes
- (2)
- From the 2nd tour on
- (iv)
- All ants will select evacuation routes following the pheromones.
- (v)
- The evaluation function of the evacuation routes selected by each ant will be calculated.
- (vi)
- Based on the evaluation function value of each ant, the pheromones on the evacuation routes will be updated.
6.2. Simulation and Evaluation Experiments Concerning the Target Area
In order to verify the effectiveness of the original simulation of the present study, a comparison of the following three different simulation results will be conducted, by changing the number of ants in correspondence with the number of evacuees and the amount of pheromones adjusted according to the process in the previous section. By doing these, the congestion rate of each road will be estimated.
6.2.1. ACO Parameter
The ACO parameter for simulations concerning the target area is as shown in Table 2. In order to compare the difference in results depending on the number of ants, all parameters except for the number of ants is made the same, and simulations for three different cases were conducted. As mentioned in Section 4.2.2, because there are ten evacuation sites within the target area, the number of solutions where pheromones can be updated is also ten. Additionally, the number of evacuees is represented in the number of ants. Taking into consideration the daytime and nighttime populations within the target area, the number of ants is 300 for daytime population and 100 for nighttime population.
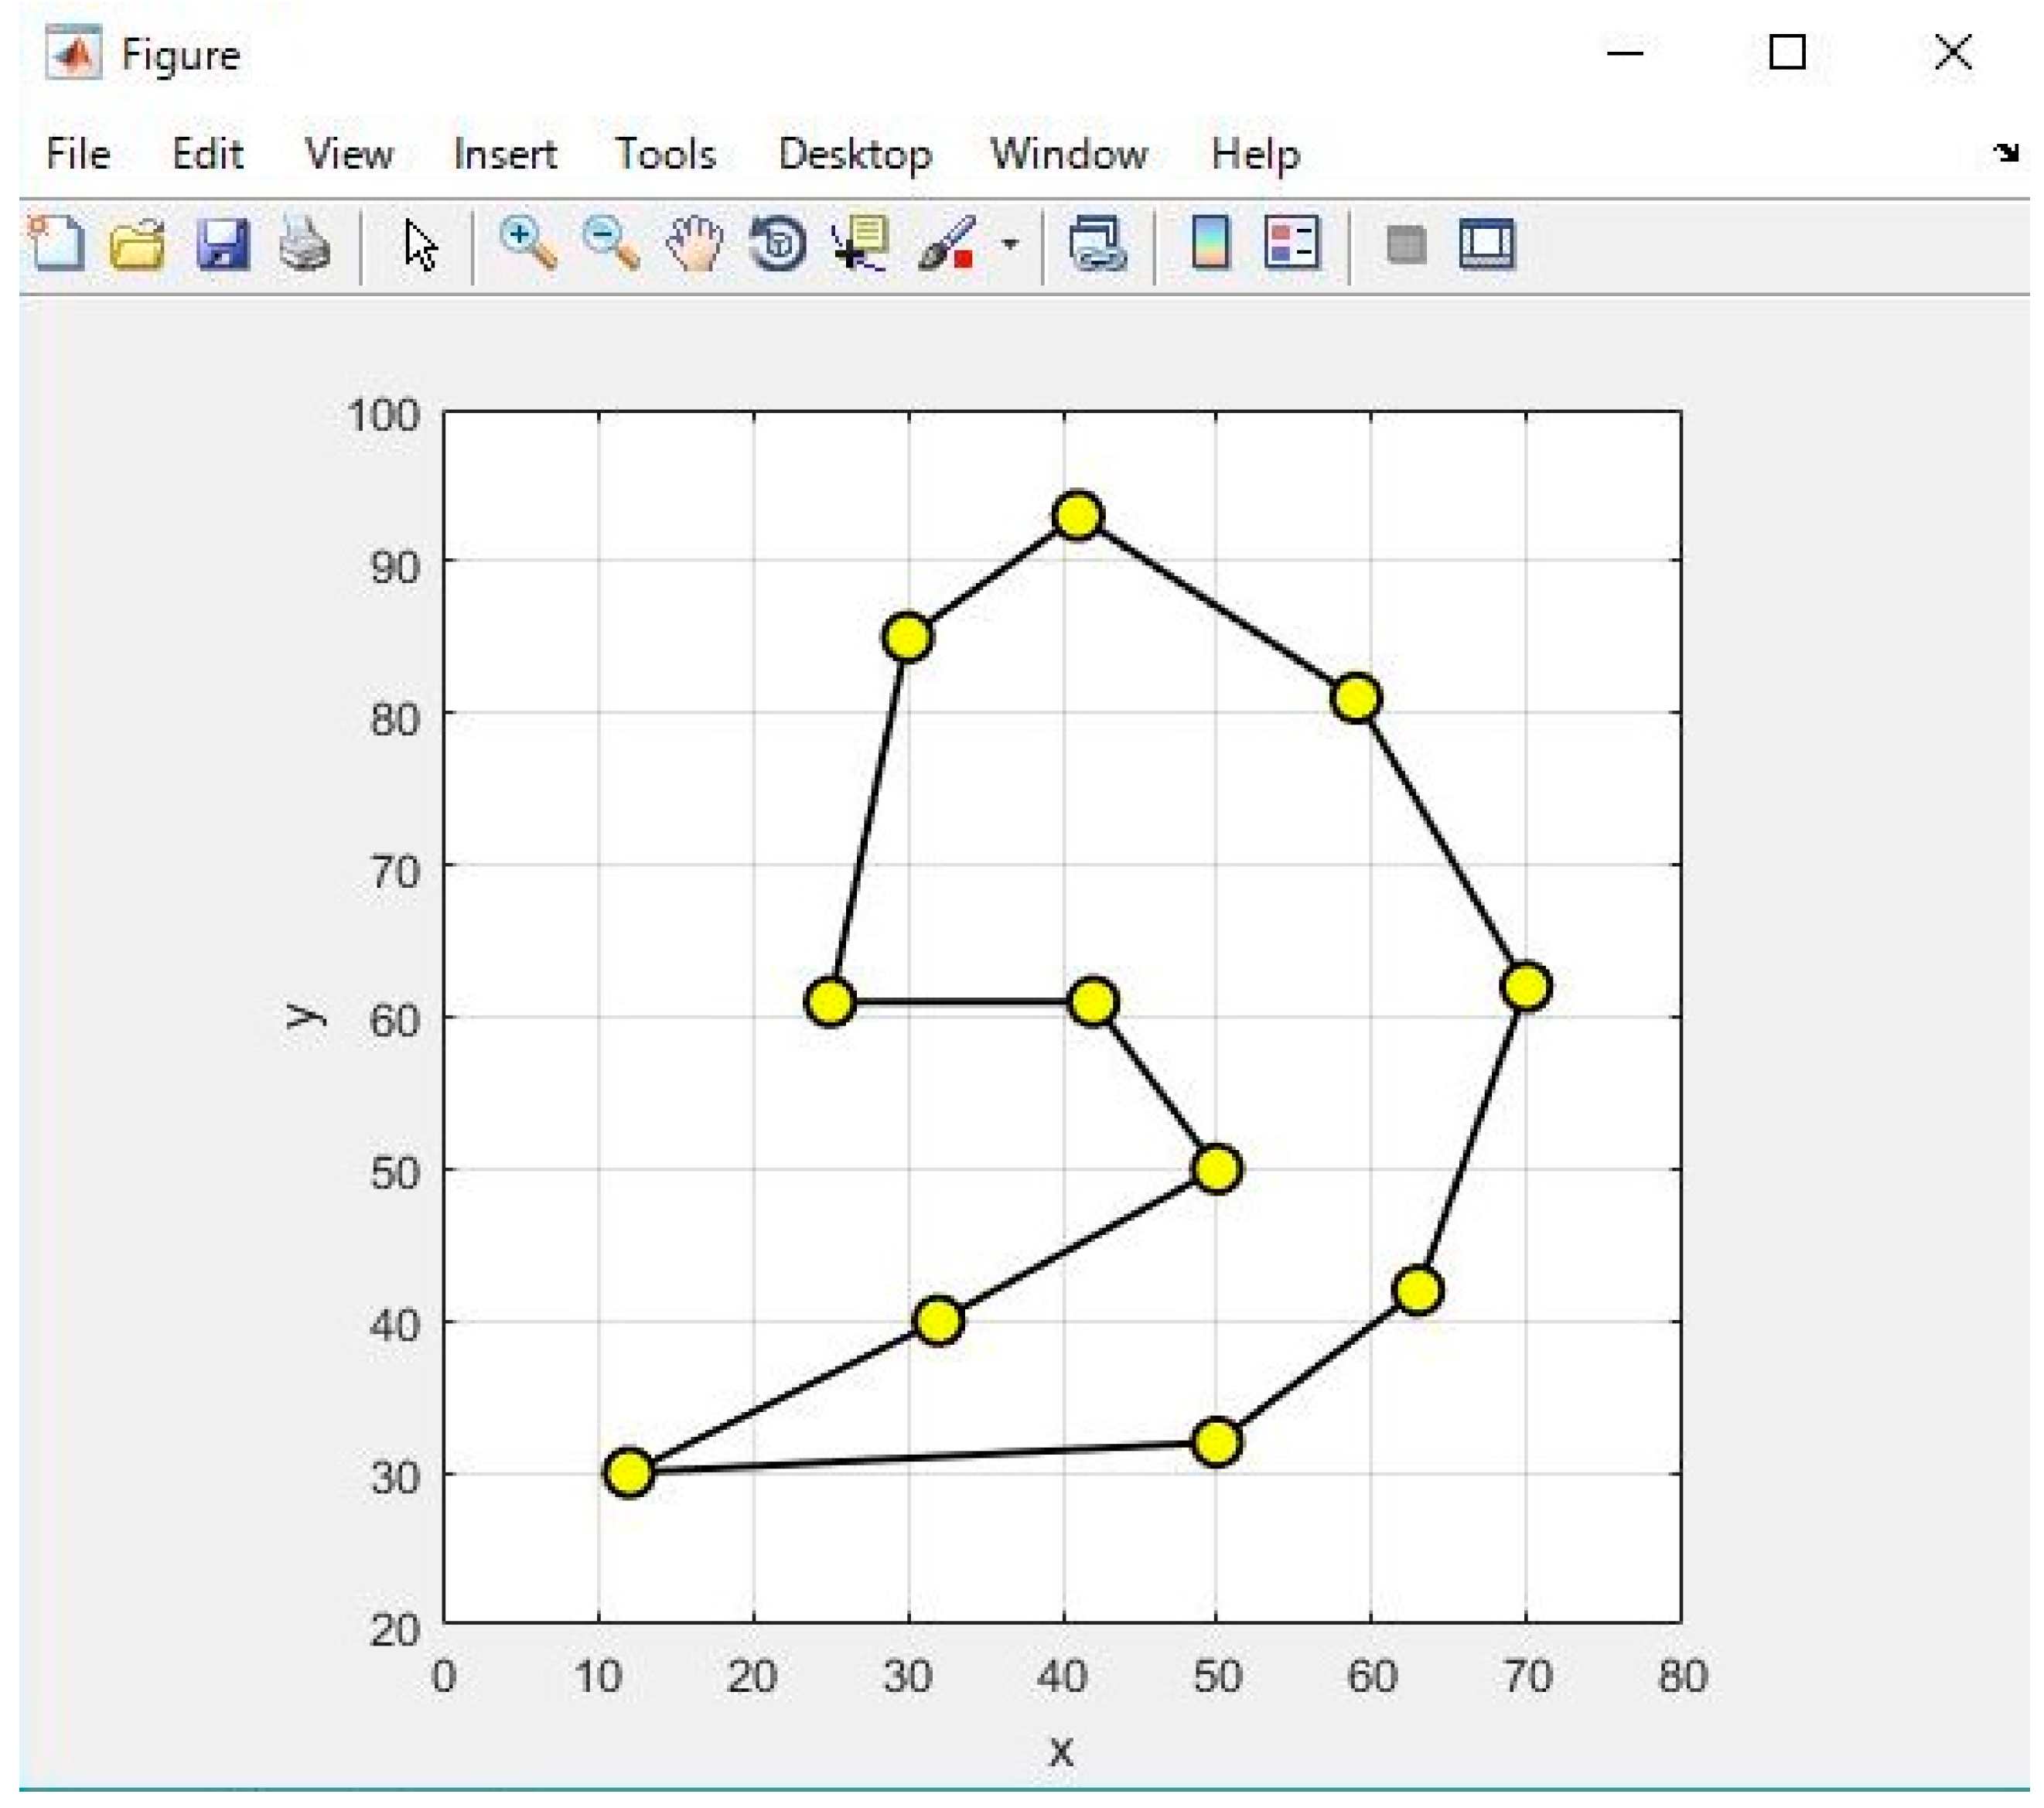
6.2.2. Results and Considerations Concerning the Simulations
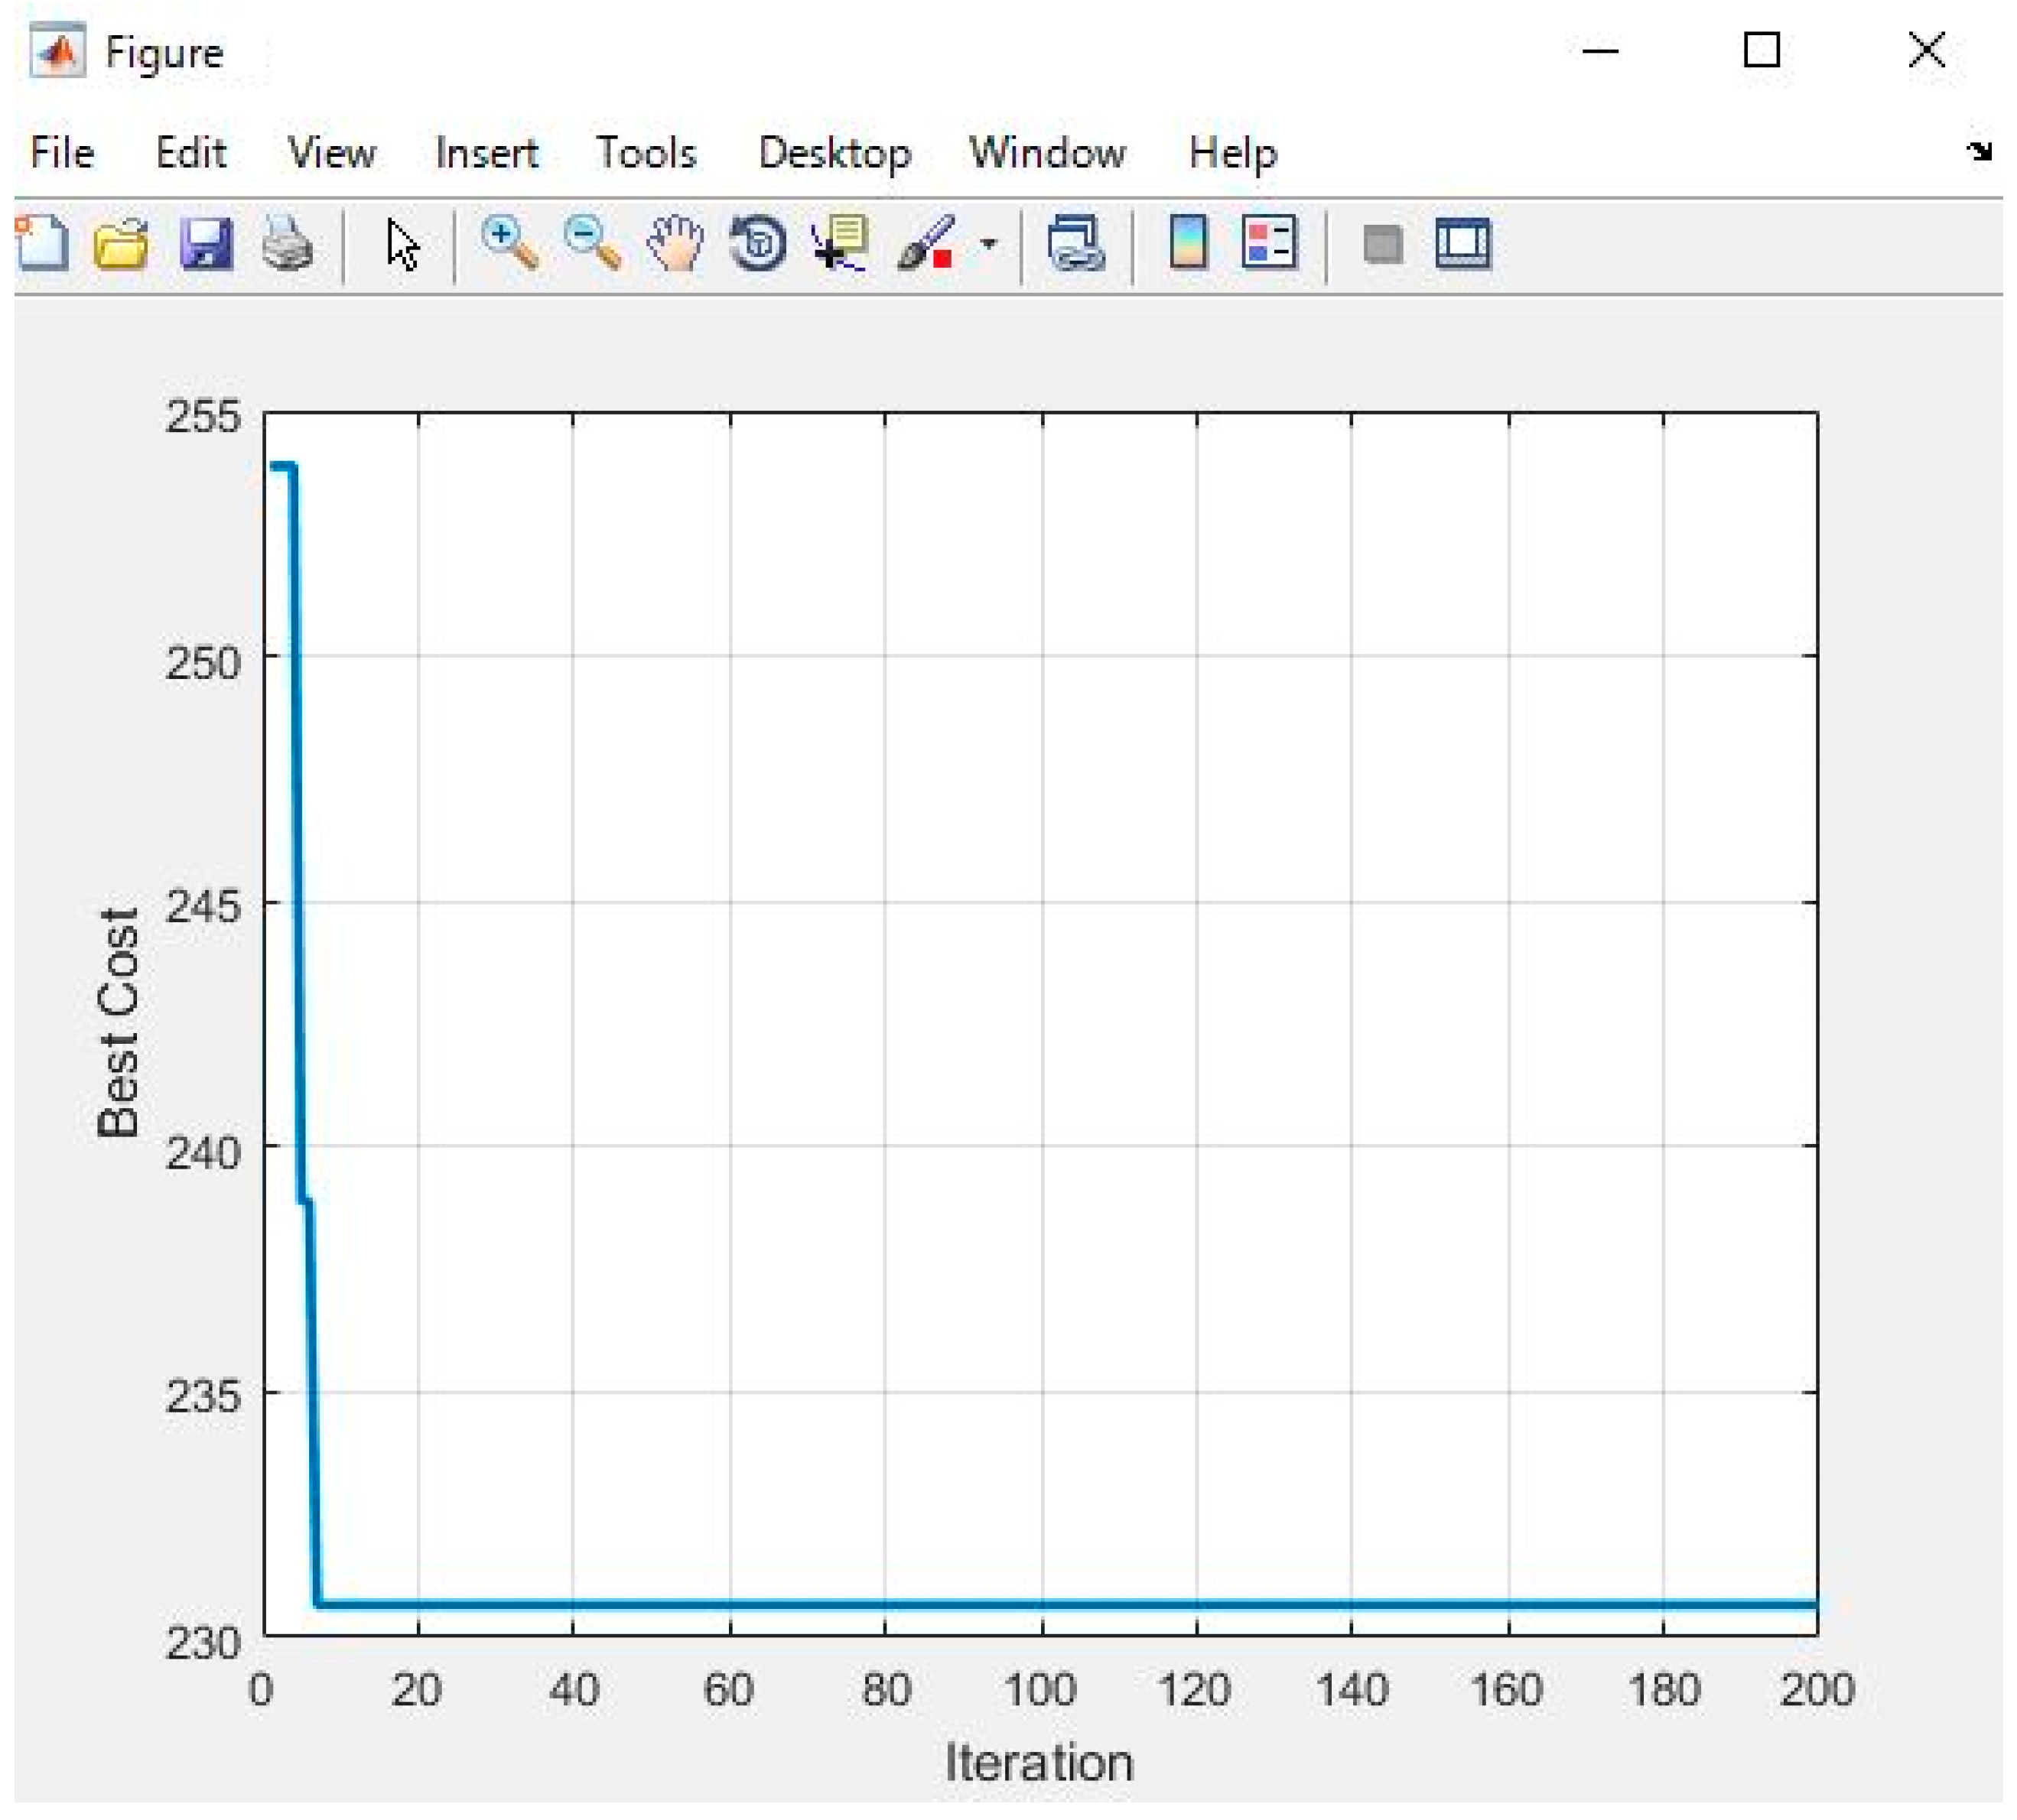
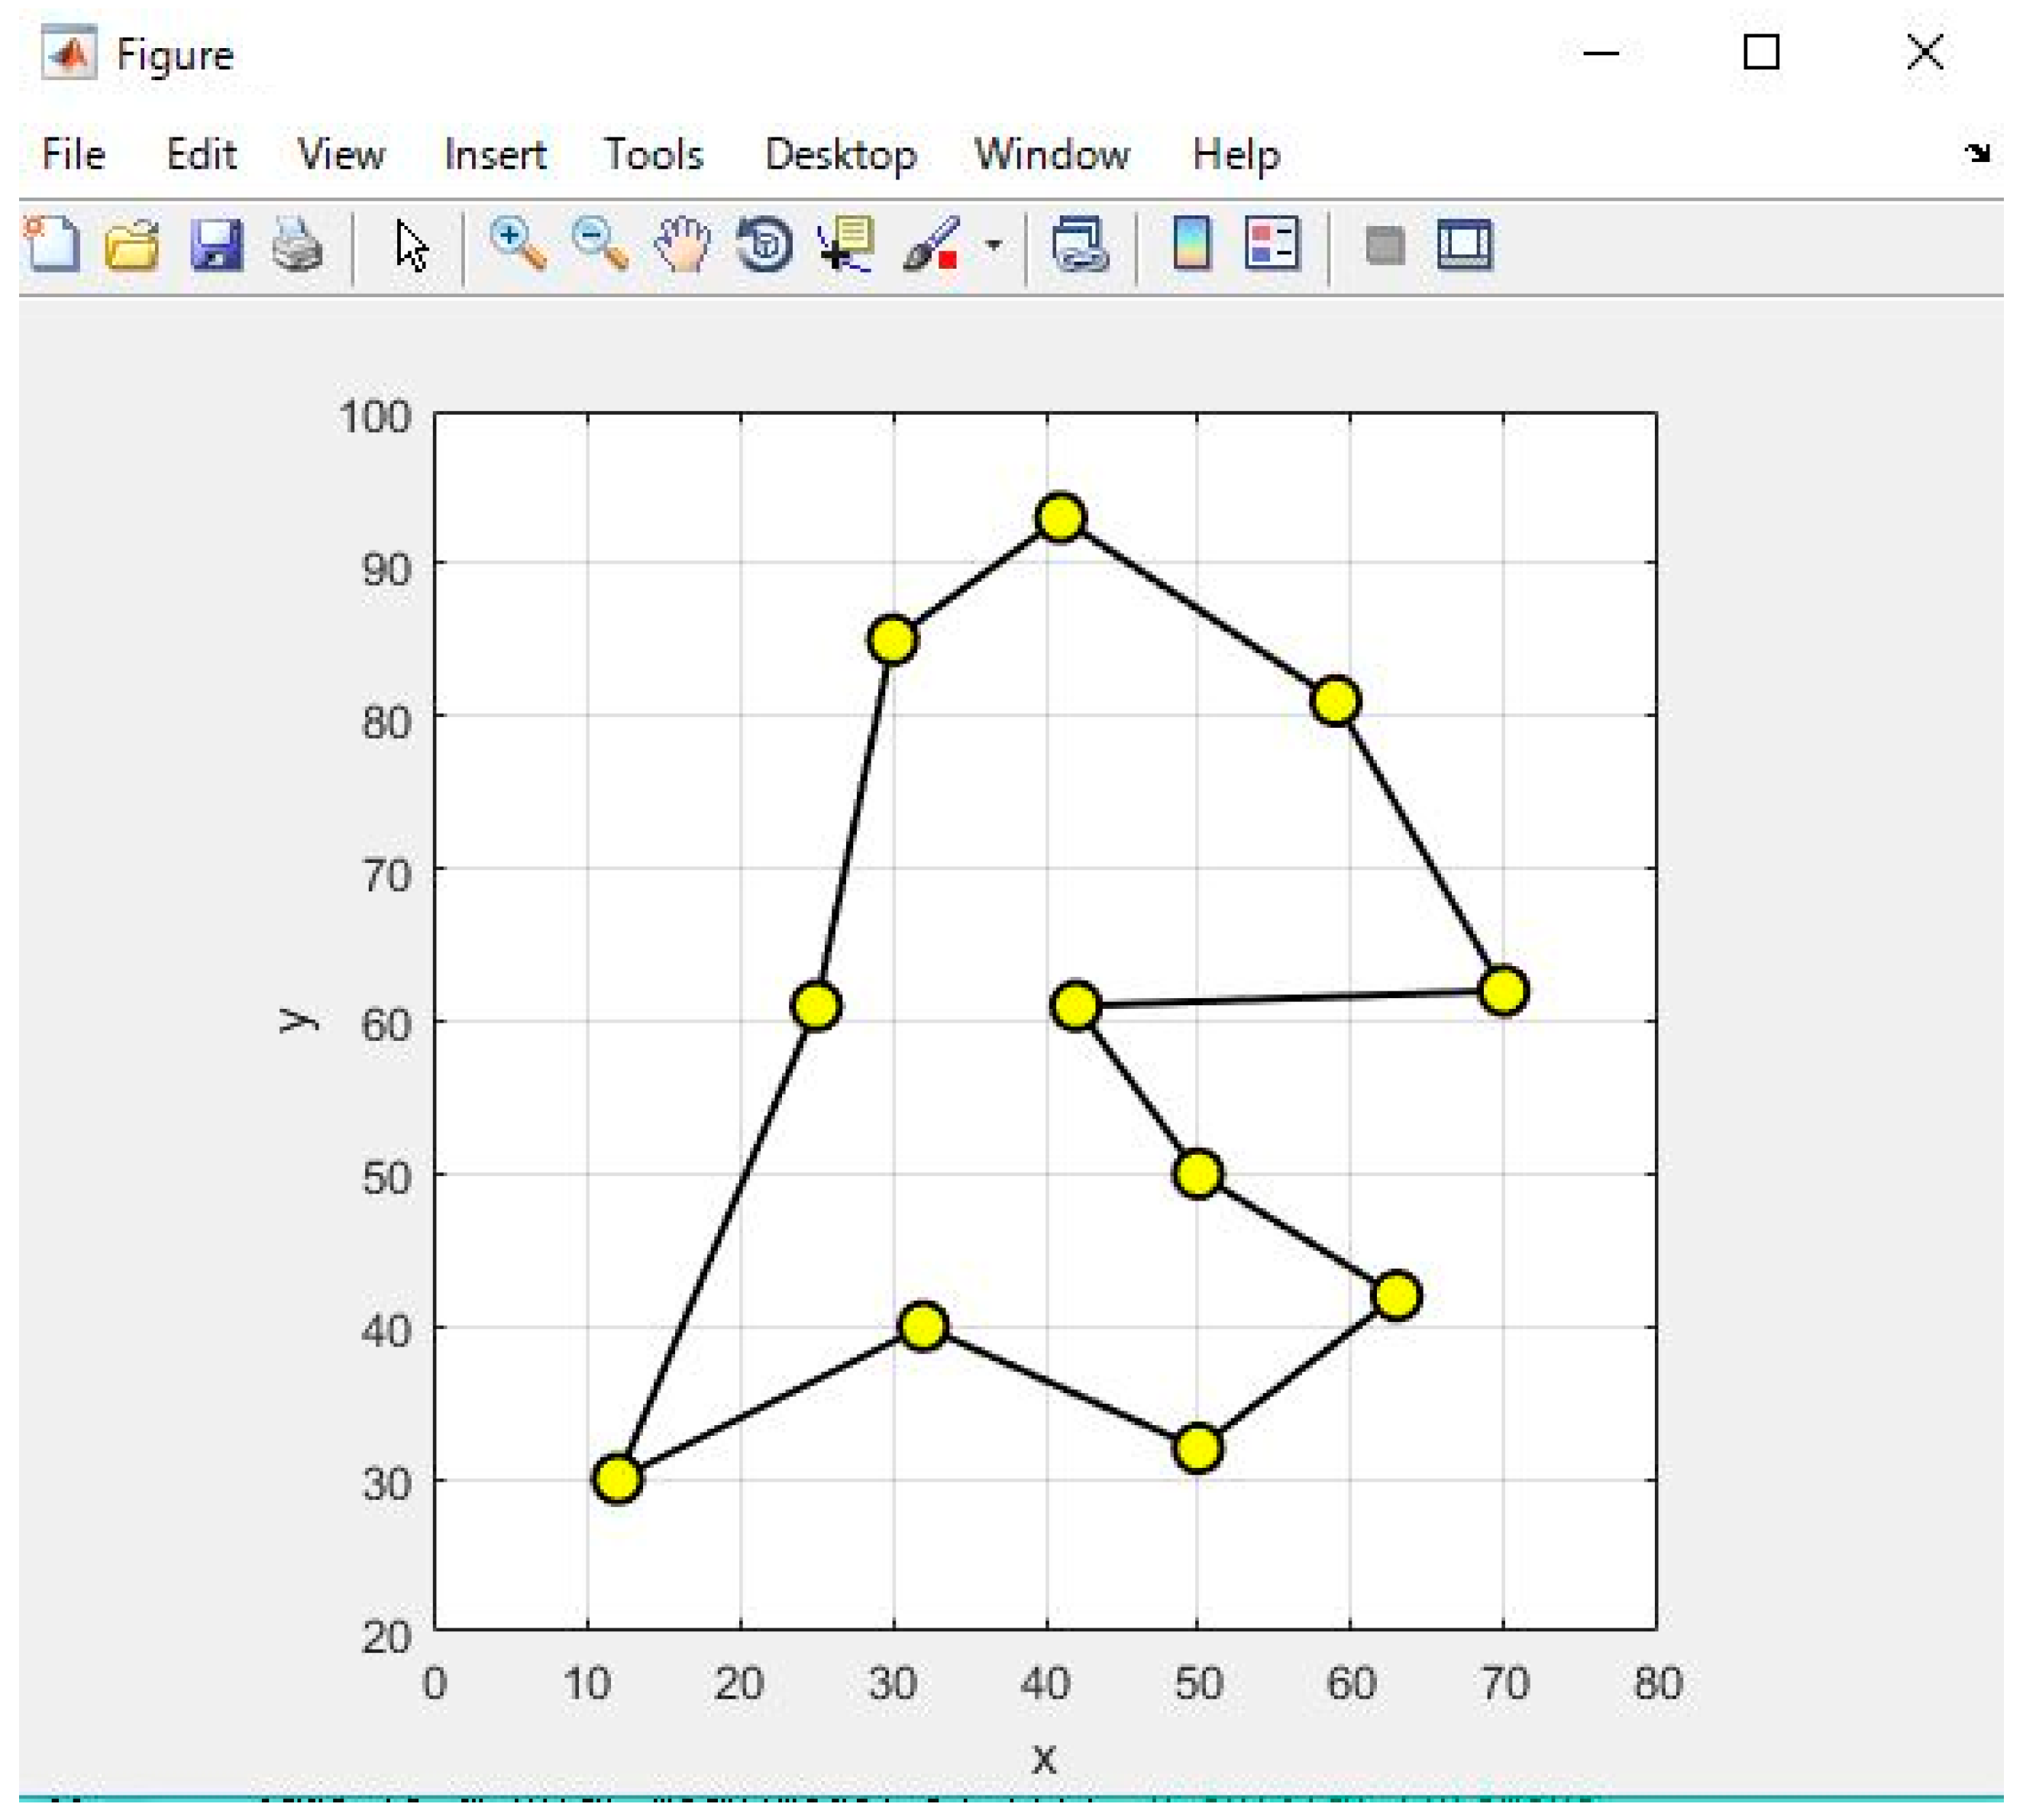
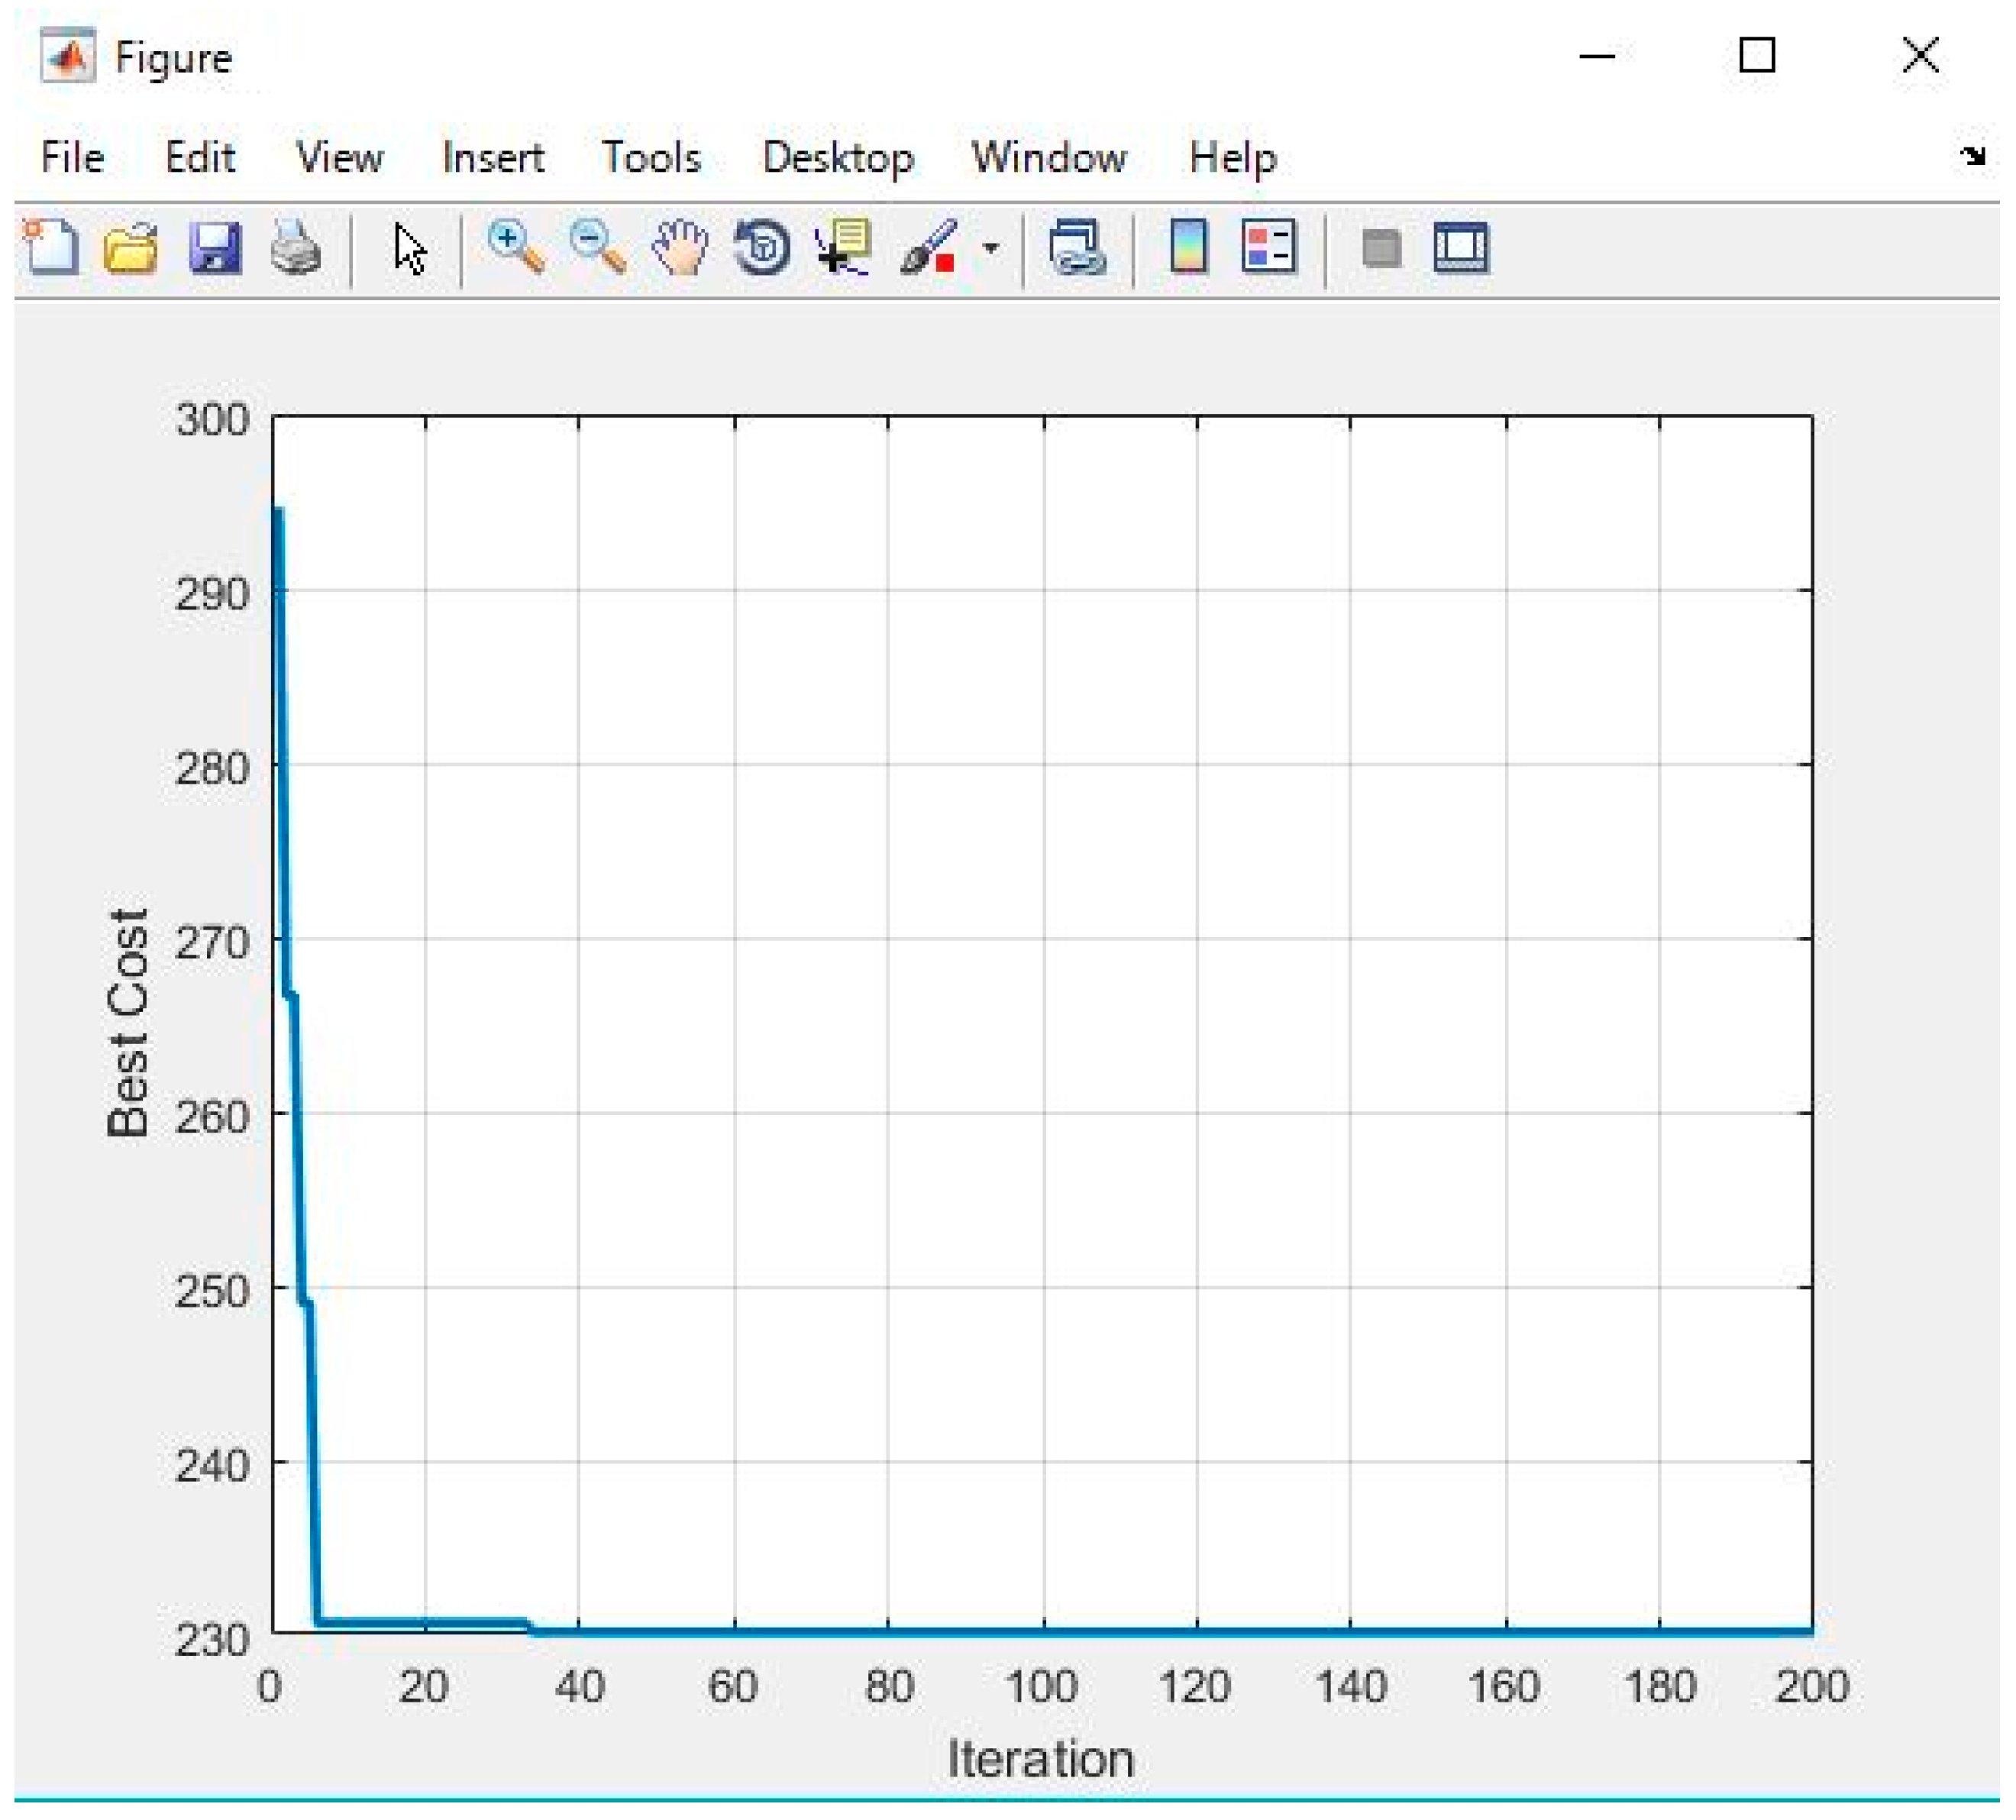
Simulations for cases 1–3 shown in Table 2 were conducted. According to Table 2, Figure 5, Figure 6, Figure 7, Figure 8, Figure 9 and Figure 10 presents the simulation results for the 3 cases. For example, in case 1 as shown in Figure 5, evacuation routes between evacuation sites were selected by 300 ants. According to the simulation of the present study, the ants selected routes with high congestion rates as evacuation routes. Figure 10 presents the convergence situation of the time cost by 300 ants selecting an evacuation route.
7. Safety Evaluation of Evacuation Routes Assuming a Large-Scale Evacuation
7.1. Extraction Conditions of Evacuation Routes with a High Congestion Rate
In this section, the simulation results of the previous section will be applied to the target area, and evacuation routes with high congestion rates will be extracted. From these evacuation routes, those that meet the following three conditions will be extracted with reference to Section 4.2.3. The extracted route will be visualized on digital maps by means of GIS and their safety will be evaluated.
- (i)
- Distance between evacuation sites is less than 1 km
- (ii)
- Evacuation time between evacuation sites is under 0.5 h
- (iii)
- Congestion rate is more than 80%
Considering the congestion rate that represents the difficulty in activity in times of a disaster, each evacuation site will be selected as evacuation starting points. In the present study, in order to estimate the congestion rate of evacuation route between evacuation sites, the closest evacuation site to each evacuation site will be selected as evacuation destinations.
7.2. Safety Evaluation of Evacuation Routes
7.2.1. Extraction of Evacuation Routes with High Congestion Rates
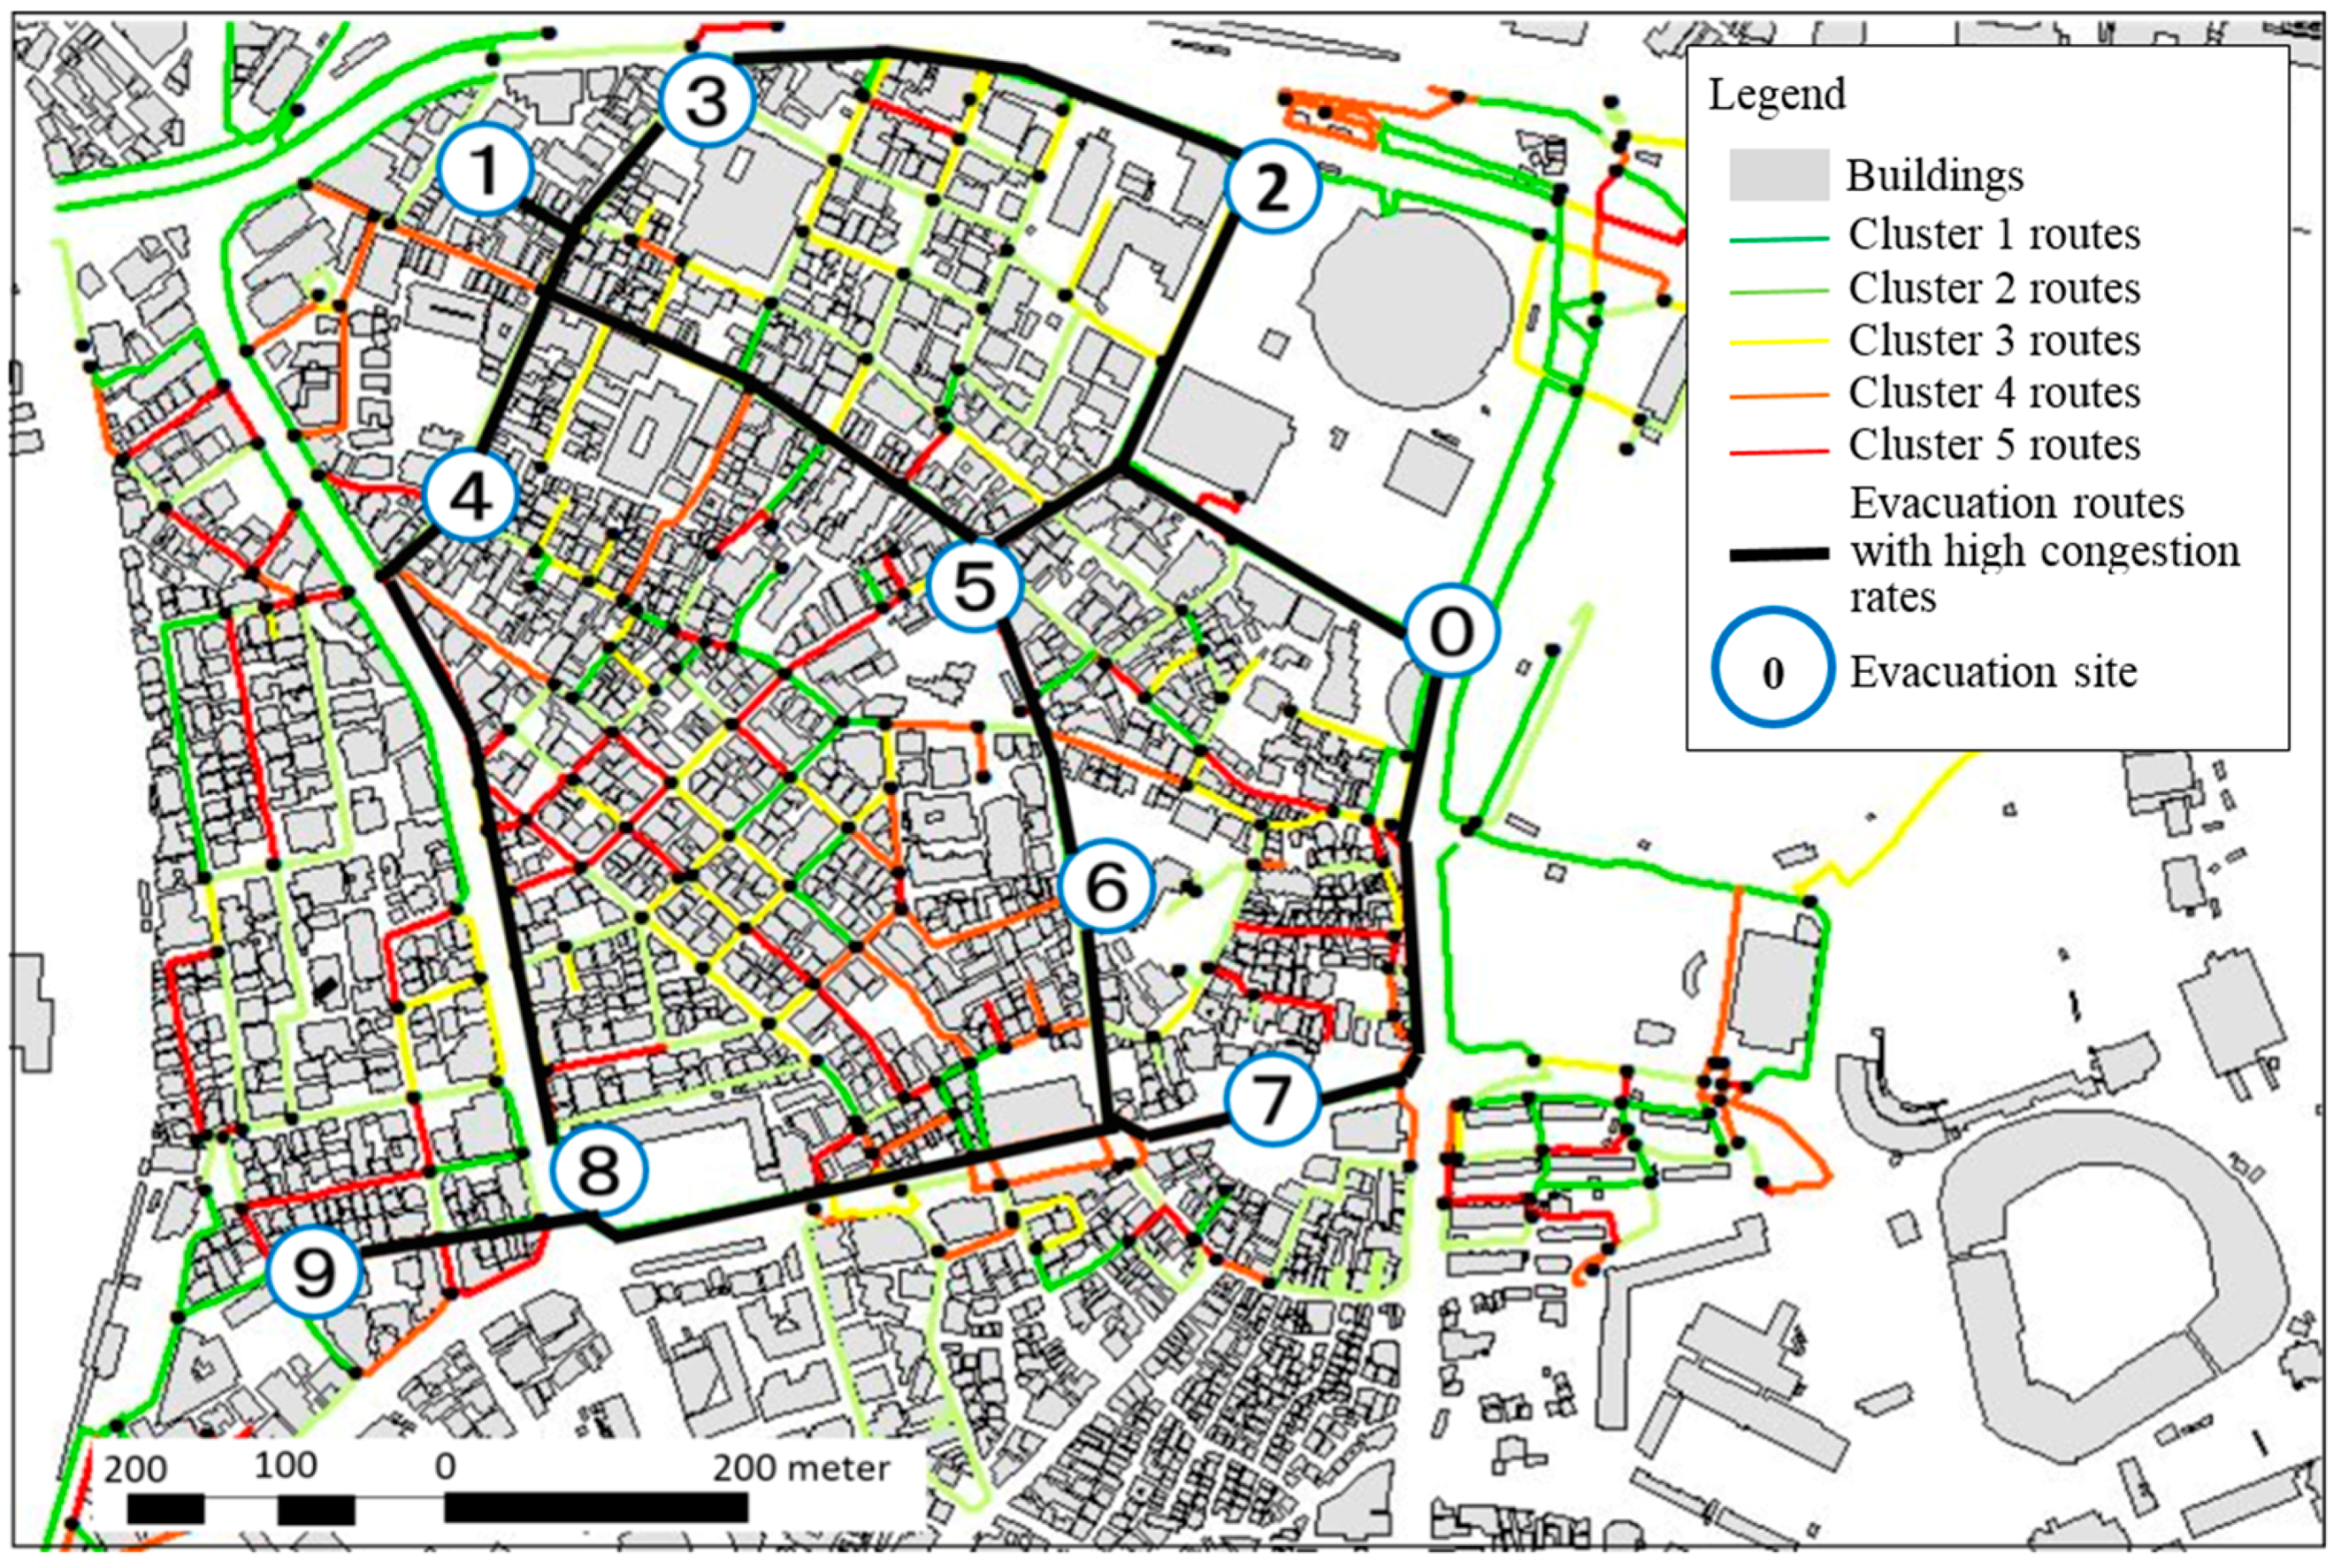
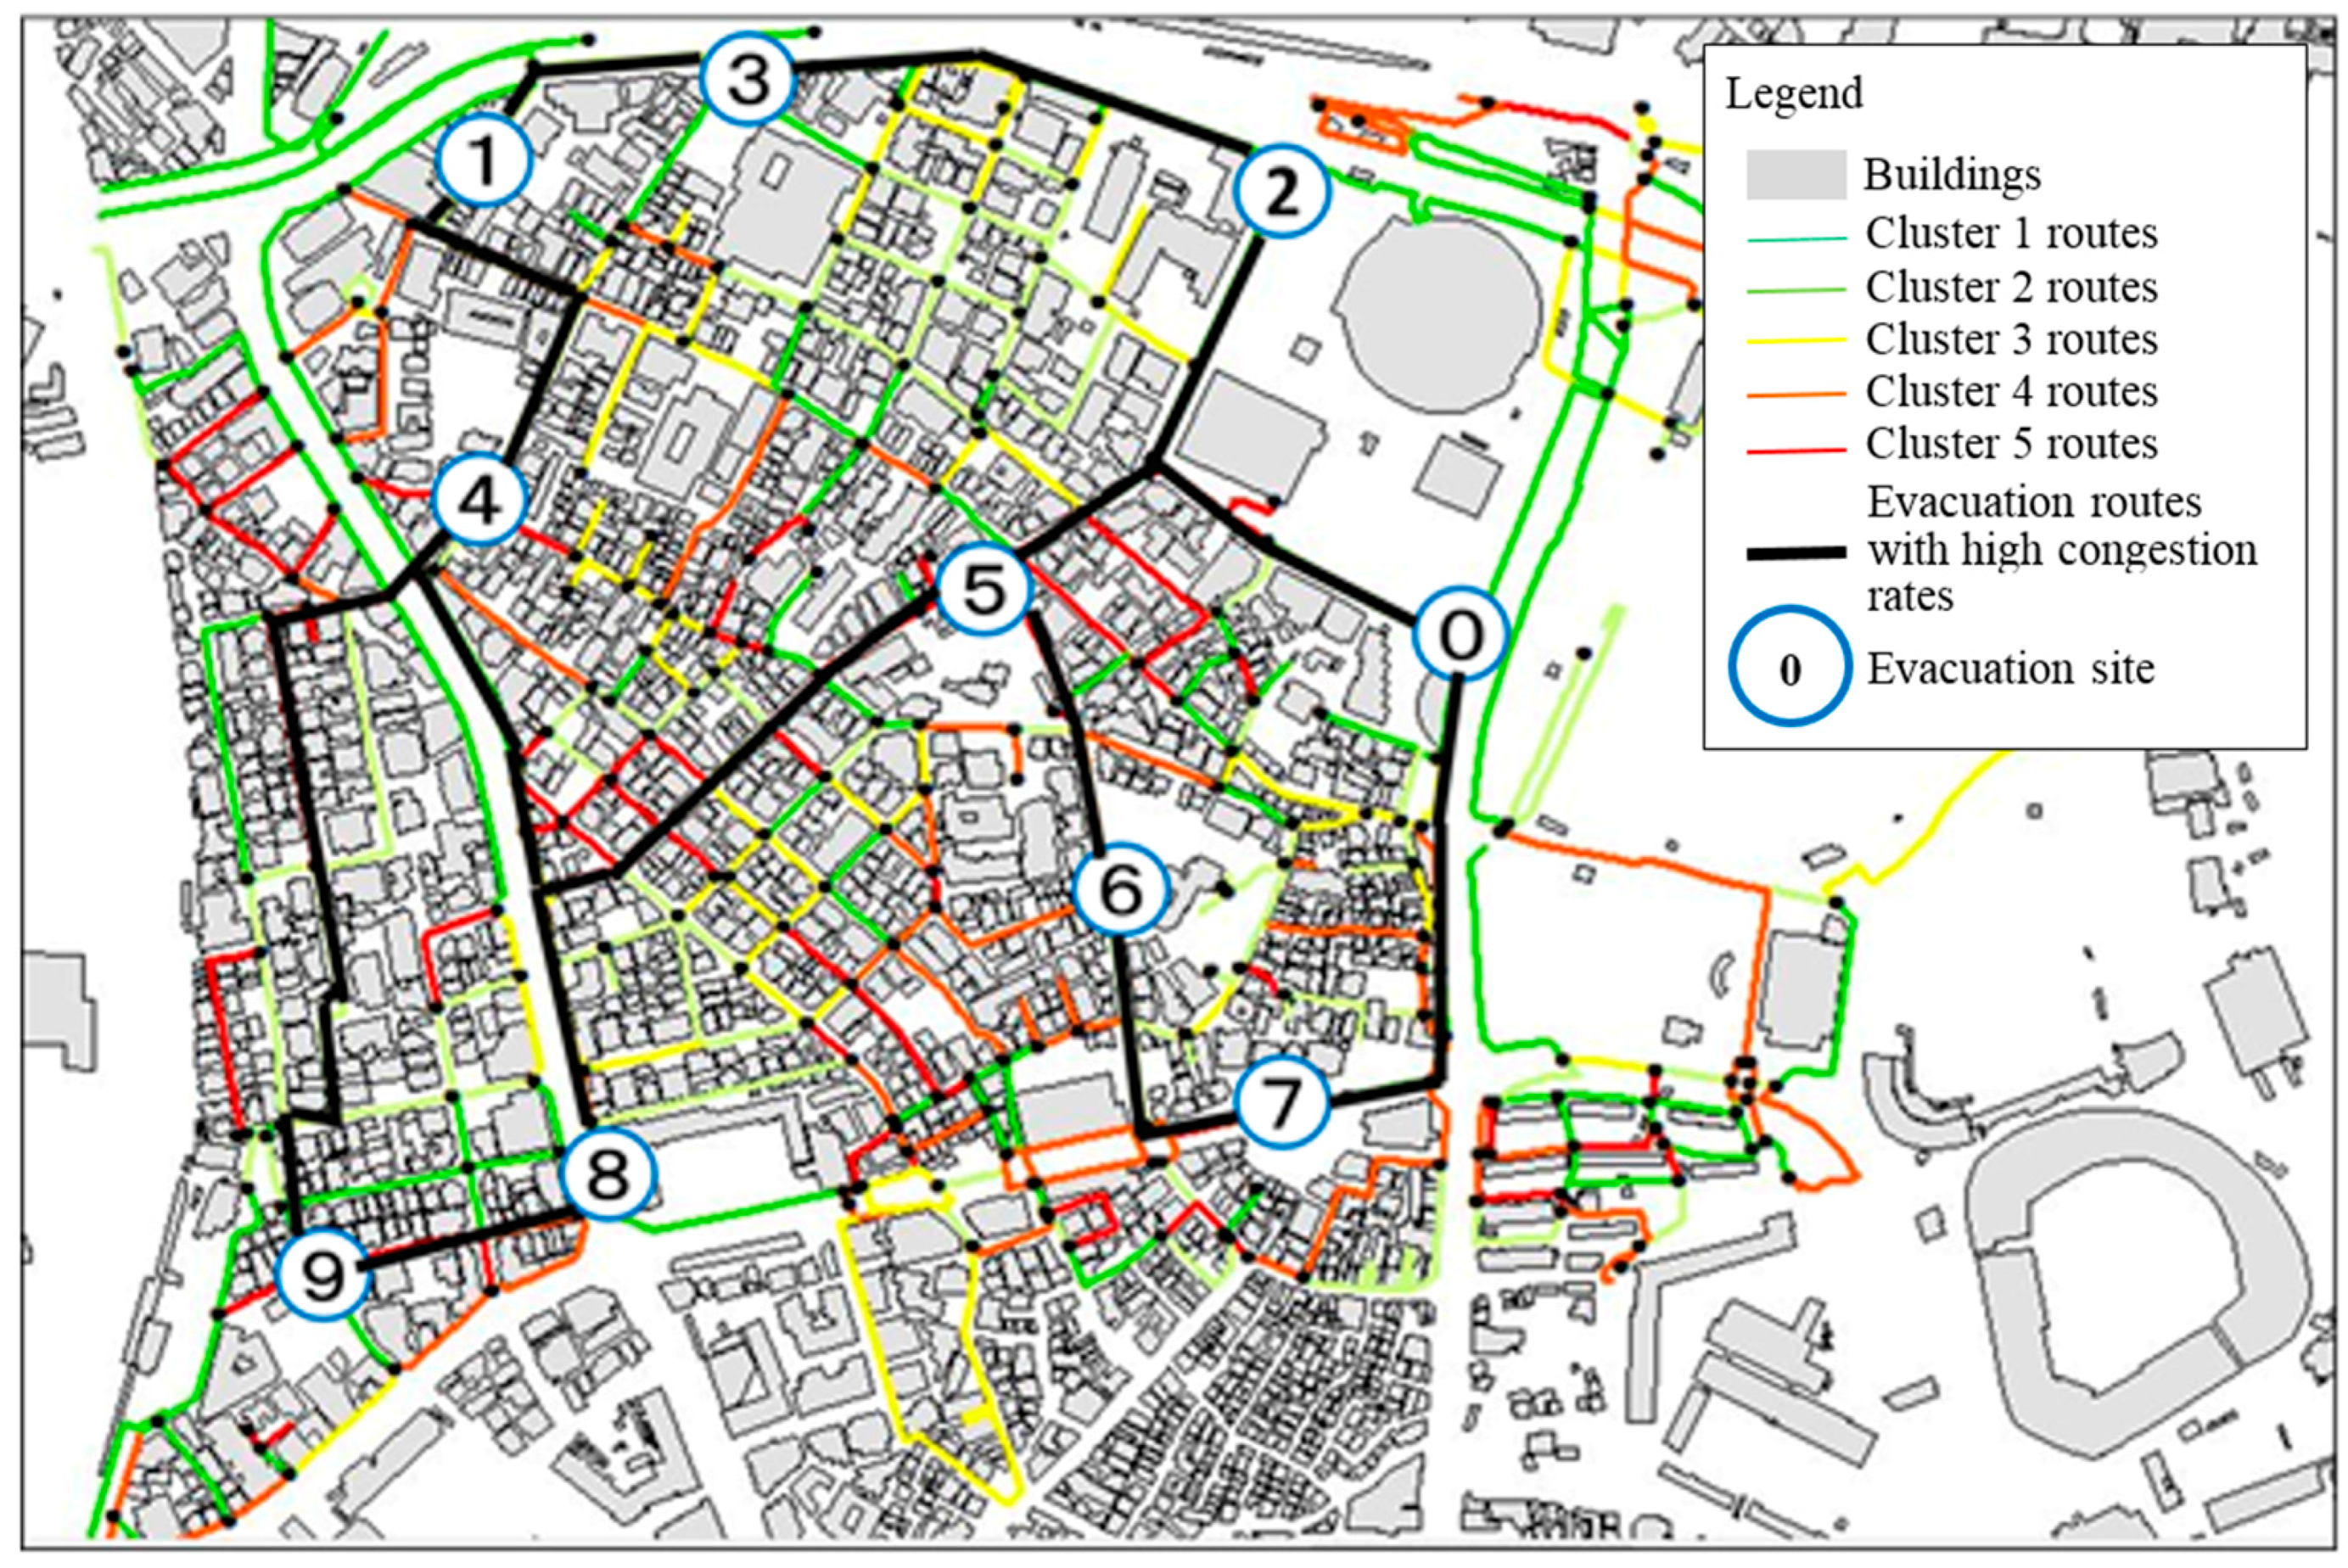
The ACO parameters set in order to conduct the simulations are as shown in Table 3 (daytime evacuation) and Table 4 (nighttime evacuation). Additionally, the results of the simulations conducted in Section 6.2.2 (Figure 5 and Figure 9) were superimposed with the road map classified by the hierarchy cluster analysis (Figure 4), and the evacuation routes with high congestion rates between evacuation sites are shown in Figure 11 (daytime evacuation) and Figure 12 (nighttime evacuation). In Figure 11 and Figure 12, Evacuation Sites 0–9 are evacuation starting points as well as destination points. Additionally, as Evacuation Sites 0 and 2 are close to the New National Stadium, areas around these sites require attention especially when large-scale events are being held. When comparing Figure 11 and Figure 12, it is evident that evacuation routes with high congestion rates differ according to whether it is daytime or nighttime.
7.2.2. Situation of Evacuation Route with High Congestion Rates
Each evaluation value of evacuation routes shown in Figure 11 and Figure 12 are summarized into Table 5 (daytime evacuation) and Table 6 (nighttime evacuation). In Table 5 and Table 6, each evaluation value that matched the extraction conditions in Section 7.1 is colored red. As shown in Table 5 and Table 6, it is clear that evacuation routes with evaluation values which include high congestion rates that exceed the extraction conditions are Route 4–9 in addition to Route 5–8 for daytime evacuations, and Route 1–5 in case of nighttime evacuations.
7.3. Safety Evaluation of Evacuation Route
From Table 5 and Table 6, Routes 4–9 and 5–8 for daytime evacuations, and Route 1–5 for nighttime evacuations, have long evacuation distance and time. Additionally, it can be confirmed that these evacuation routes are dangerous as both the congestion rates and building collapse risk are high. As all evaluation values are high for these evacuation routes, use of these routes must be prohibited when developing evacuation plans. Additionally, regarding Routes 1–4, 4–5 and 5–6 for daytime evacuations, and Routes 4–5, 5–6, 6–7, 6–8 and 7–8 for nighttime evacuations, as some of these routes also have high evaluation values, there is a need to avoid them if possible. For both daytime and nighttime evacuations, Routes 0–2 and 1–3 are evacuation routes with relatively low evaluation values within the target area. Therefore, if the possibility of a large-scale evacuation in case of an earthquake is high, safe evacuation routes such as those mentioned above can be selected.
7.4. Discussion
In this section, the multiple evacuation routes extracted were visualized on digital maps by means of GIS, and their safety was evaluated. Furthermore, the selection of safe evacuation routes between evacuation sites, for cases when the possibility of large-scale evacuation after an earthquake disaster is high, is made possible. Additionally, using the evaluation method in the present study, if all data and research information is updated with the future technology developments and advances in related fields, it will be possible to update and provide even more accurate information. From data of current conditions including building and land use data, road network information which would be an evacuation hindrance in disasters situations was created in the present study. Because the safety evaluation of evacuation routes based on current building and road layout conditions is made possible by estimating evacuation routes with high congestion rates based on such information, it can be said that the evaluation method has high spatial reproducibility. Furthermore, as the evaluation method is based on public information, As the evaluation method is based on public information, by obtaining the same geographic information as the present study, it is effective in other areas, regardless of whether the information is from the past or future. Therefore, in addition to spatial reproducibility, the evaluation method also has high temporal reproducibility. Because safety evaluations are conducted on evacuation routes based on quantified data, the selected highly safe evacuation routes have been quantitatively evaluated, thus serve as an effective indicator when selecting evacuation routes.
However, regarding spatial reproducibility, it is essential to modify the evaluation method, paying attention to the differences concerning types of disasters and secondary disasters between regions. In the present study, assuming a large-scale evacuation in case of an earthquake disaster and targeting a fireproofed area to conduct the safety evaluation of evacuation routes, it is required to just consider building collapse risks. On the other hand, on the same assumption as the present study in the area has a high concentration of wooden dwellings, it is necessary to consider fire risk in addition to building collapse risk.
8. Conclusions
The conclusion of the present study can be summarized into the following three points.
- (1)
- In the present study, the similarity in safety was focused on while taking into consideration road blockage probability, and after classifying roads by means of the hierarchical cluster analysis, the congestion rates of evacuation routes using ACO simulations were estimated. Based on these results, considering the evaluation values of evacuation distance, evacuation time, congestion rates, as well as building collapse risks, the multiple evacuation routes extracted were visualized on digital maps by means of GIS, and their safety was evaluated. Furthermore, the selection of safe evacuation routes between evacuation sites, for cases when the possibility of large-scale evacuation after an earthquake disaster is high, is made possible.
- (2)
- Using the evaluation method in the present study, if all data and research information is updated with the future technology developments and advances in the related fields, it will be possible to update and provide even more accurate information. Additionally, as the evaluation method is based on public information, by obtaining the same geographic information as the present study, it is effective in other areas, regardless of whether the information is from the past or future. Therefore, in addition to spatial reproducibility, the evaluation method also has high temporal reproducibility.
- (3)
- Because safety evaluations are conducted on evacuation routes based on quantified data, highly safe evacuation routes that are selected have been quantitatively evaluated, and thus serve as an effective indicator when selecting evacuation routes. Additionally, if more detailed information can be used as data, the derivation of evacuation routes that more accurately reflect real conditions can be possible.
As for further research tasks, improvement of evaluation precision and additional refinement of road information can be considered.
Author Contributions
Kayoko Yamamoto carried out background work, and developed safety evaluation method of evacuation routes. She also initially drafted the paper. Ximing Li made road network data, and conducted evaluation experiment of the ACO algorithm and evaluation of evacuation routes. All authors contributed to write up and review, and approved the paper manuscript.
Conflicts of Interest
The authors declare no conflict of interest.
References
- Alçada-Almeida, Luís, Lino Tralhao, Luis Santos, and João Coutinho-Rodrigues. 2009. A Multiobjective Approach to Locate Emergency Shelters and Identify Evacuation Routes in Urban Areas. Geographical Analysis 41: 9–29. [Google Scholar] [CrossRef]
- Asou, Toshihiko, Yorikazu Matsumoto, and Kazuhisa Morishita. 2007. A Study on the Optimal Location of Disaster Shelters using Genetic Algorithm. Research Report of Faculty of Engineering, Yamaguchi University 58: 522–533. [Google Scholar]
- Bureau of Urban Development, Tokyo Metropolitan Government. 2013. District-Based Assessment of Vulnerability to Earthquake Disaster (No. 7); Tokyo: Bureau of Urban Development, Tokyo Metropolitan Government.
- Director-General for Disaster Management in the Cabinet Office. Report on Investigation into Wide-Area Disaster Prevention Measures in the "S.K.Y Kouikiken"* Area (*A Large Area centering on the Fuji, Hakone and Izu Areas), Tokyo: Director-General for Disaster Management in the Cabinet Office.
- Dorigo, Marco, Gianni Di Caro, and Luca M. Gambardella. 1999. Ant Algorithms for Discrete Optimization. Artificial Life 5: 137–172. [Google Scholar] [CrossRef] [PubMed]
- Ichikawa, Fusako, Tomohiko Sakata, and Toru Yoshikawa. 2004. An Analysis of Accessibility to Spaces for Disaster Refuge Considering Danger of Street-Blockades Caused by Collapse of Buildings on Evacuation Routes. Theory and Applications of GIS 12: 47–56. [Google Scholar] [CrossRef]
- Imaizumi, Kyoichi, and Yasushi Asami. 2000. A Study on Estimation of Street-Blockades Caused by a Great Earthquake—To improve densely inhabited urban area for disaster prevention. Journal of Architecture and Planning 65: 225–231. [Google Scholar] [CrossRef]
- Inoue, Mika, and Kayoko Yamamoto. 2013. Method for Evaluating the Location of Tourist-Related Public Facilities Using Genetic Algorithms and GIS. Journal of Communication and Computer 10: 496–512. [Google Scholar]
- Koarai, Mamoru, Hiroshi Sato, and Hiroshi Une. 2007. GIS Analysis of the Relationship between Earthquake-Induced Ground Disaster and the Physical Characteristics of Land. Bulletin of the Geospatial Information Authority of Japan 112: 115–123. [Google Scholar]
- Komura, Takashi, and Atsushi Hirano. 1997. Disaster Imagination Game (DIG), A Drill using Maps. Papers of the 7th Annual Conference of the Institute of Social Safety Science, 136–139. [Google Scholar]
- Liu, Yuling, Michinori Hatayama, and Norio Okada. 2006. Development of an Adaptive Evacuation Route Algorithm under Flood Disaster. Annuals of the Disaster Prevention Research Institute, Kyoto University 49B: 189–195. [Google Scholar]
- Mochio, Takashi, and Yoshihiro Kitahara. 2016. Application of Ant Colony Optimization Technique to Real Time Search of Optimal Evacuation Route after Severe Earthquake. Journal of Japan Association for Earthquake Engineering 16: 93–110. [Google Scholar] [CrossRef]
- Nakamichi, Yoshiyuki, and Takaya Arita. 2003. The Effects of Diversity Control Based on Random Selection in Ant Colony Optimization. IPSJ Journal 43: 2939–2947. [Google Scholar]
- Onorati, Teresa, Malizia Alessio, Antonia Diaz, and Aedo Ignacio. 2014. Modeling Ontology on Accessible Evacuation Routes for Emergencies. Expert Systems with Applications 41: 7124–7134. [Google Scholar] [CrossRef]
- Shibuya Ward. 2017. Shibuya Ward Disaster Prevention Map. Available online: https://www.city.shibuya.tokyo.jp/todoke/bosai/hasai/index.html (accessed on 22 May 2017).
- Shimura, Yuichiro, and Kayoko Yamamoto. 2014. Method of Searching for Earthquake Disaster Evacuation Routes using Multi-Objective GA and GIS. Journal of Geographic Information System 6: 492–525. [Google Scholar] [CrossRef]
- Takeuchi, Teruo, and Akio Kondo. 2002. An Analysis of Evacuation Routes Taking into Consideration Road Sections Blocked by Earthquake—A Case Study of Suzaki City. Papers of the 26th Research Meeting on Civil Engineering Planning, Presentation No. 332 (CD-ROM). [Google Scholar]
- Tokyo Metropolitan Government. 2017. Disaster Prevention Facilities, Shelters and Evacuation Areas in Tokyo Metropolis. Available online: http://www.bousai.metro.tokyo.jp/bousai/1000029/index (accessed on 22 May 2017).
- Urban Disaster Prevention Office of the City Bureau, Ministry of Construction. 1997. Practical Handbook of Urban Disaster Prevention—Earthquake Disaster Prevention; Tokyo: Urban Disaster Prevention Office of the City Bureau, Ministry of Construction.
- Yoshikawa, Toru, Keiji Yokota, and Tomohiko Sakata. 2003. A Stochastic Model Basis for Simulation of Road Blockage which Takes into Account Individual Collapsed Buildings in Actual Urban Areas in Great Earthquakes. Summaries of Technical Papers of Annual Meeting Architectural Institute of Japan F-1, 991–992. [Google Scholar]
Figure 1.
Ant Colony Optimization (ACO) flowchart.
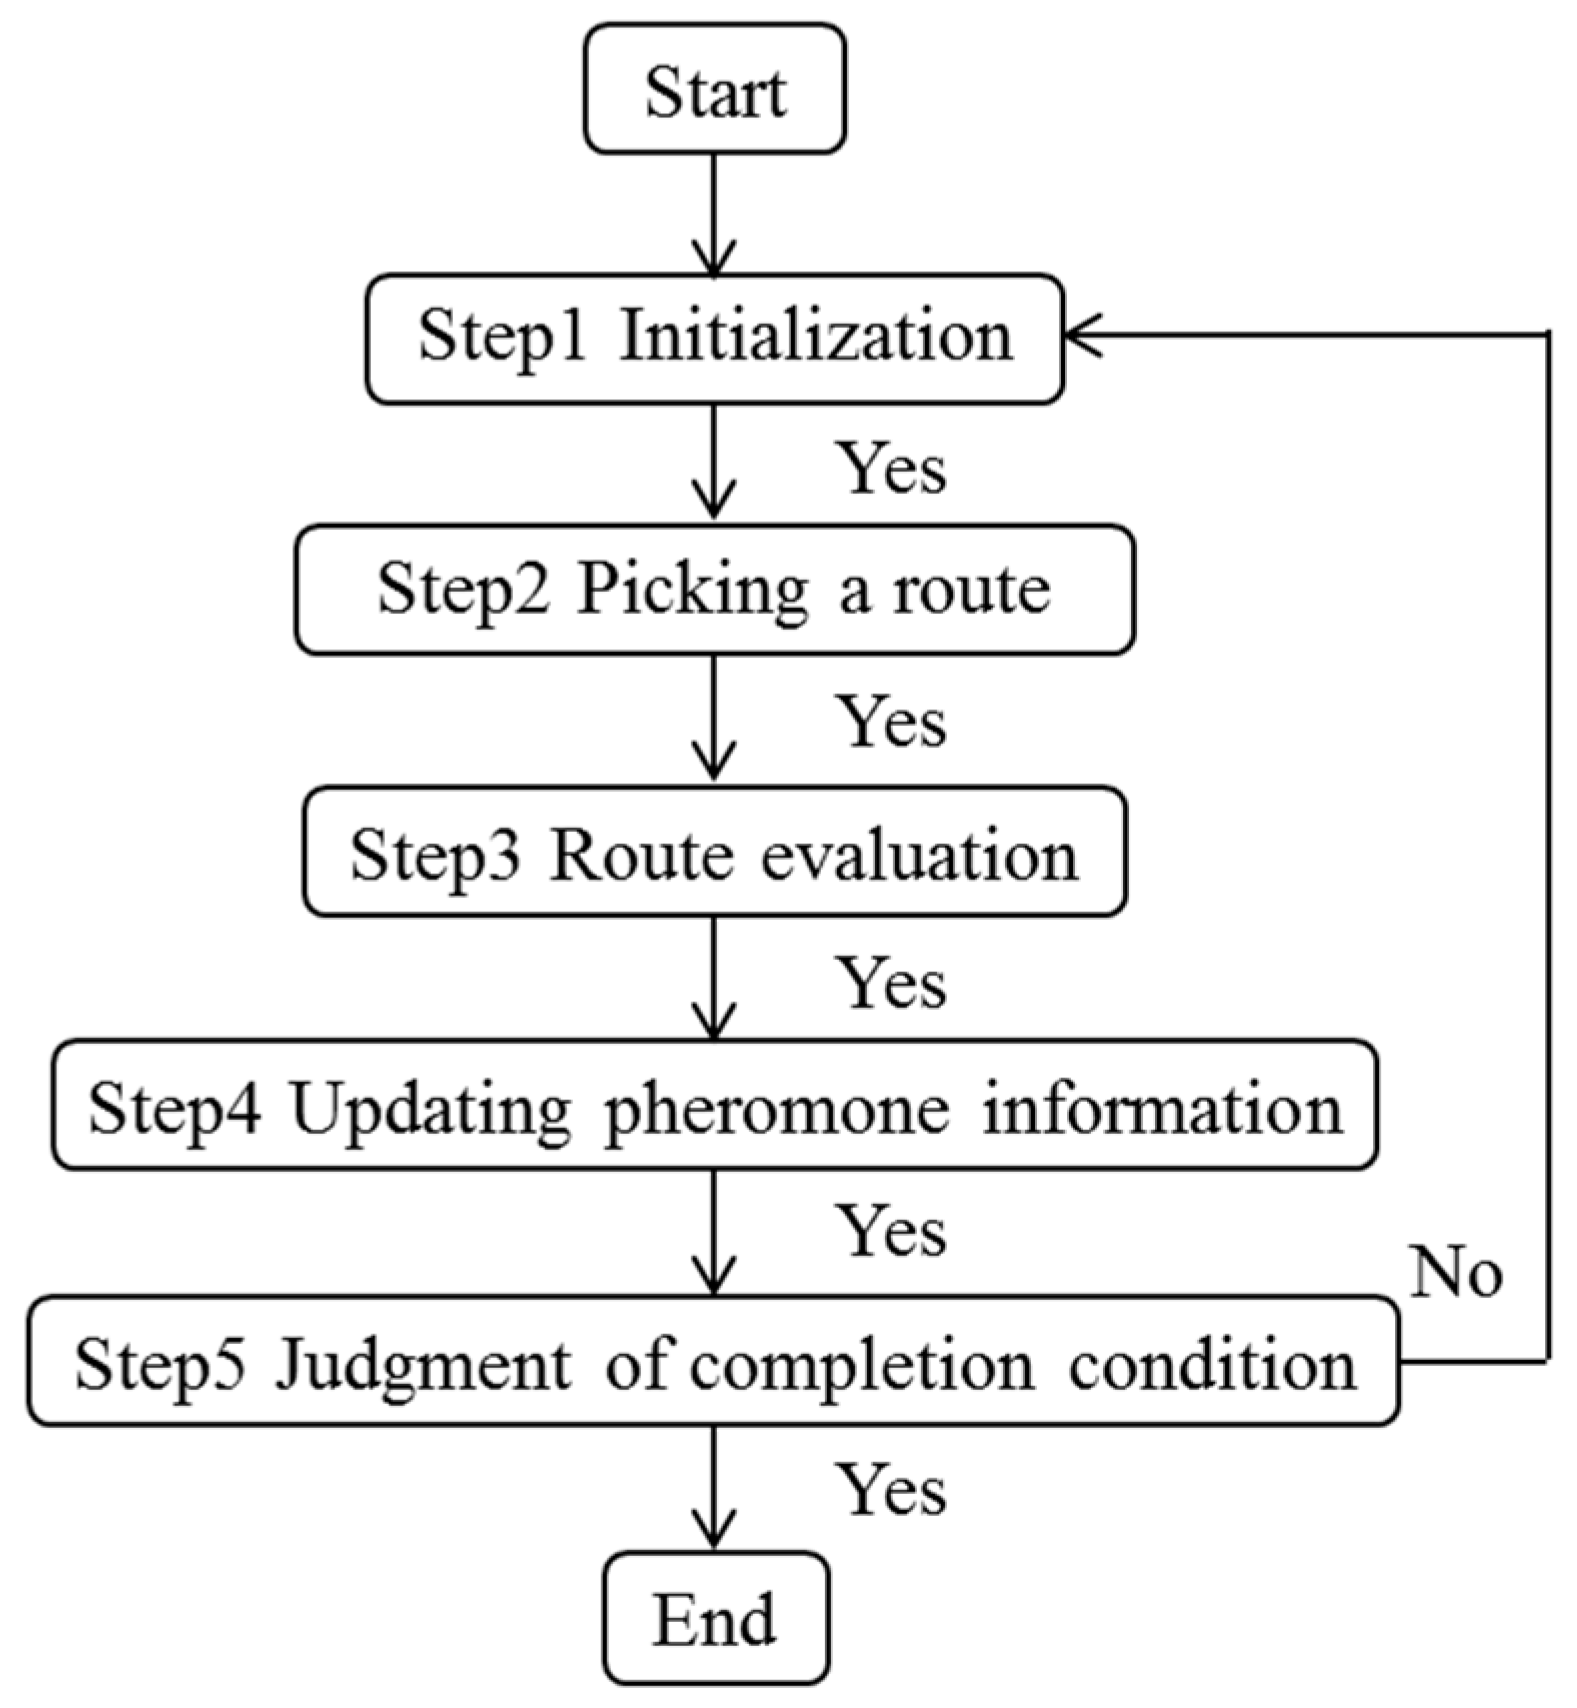
Figure 2.
The location of the target area.
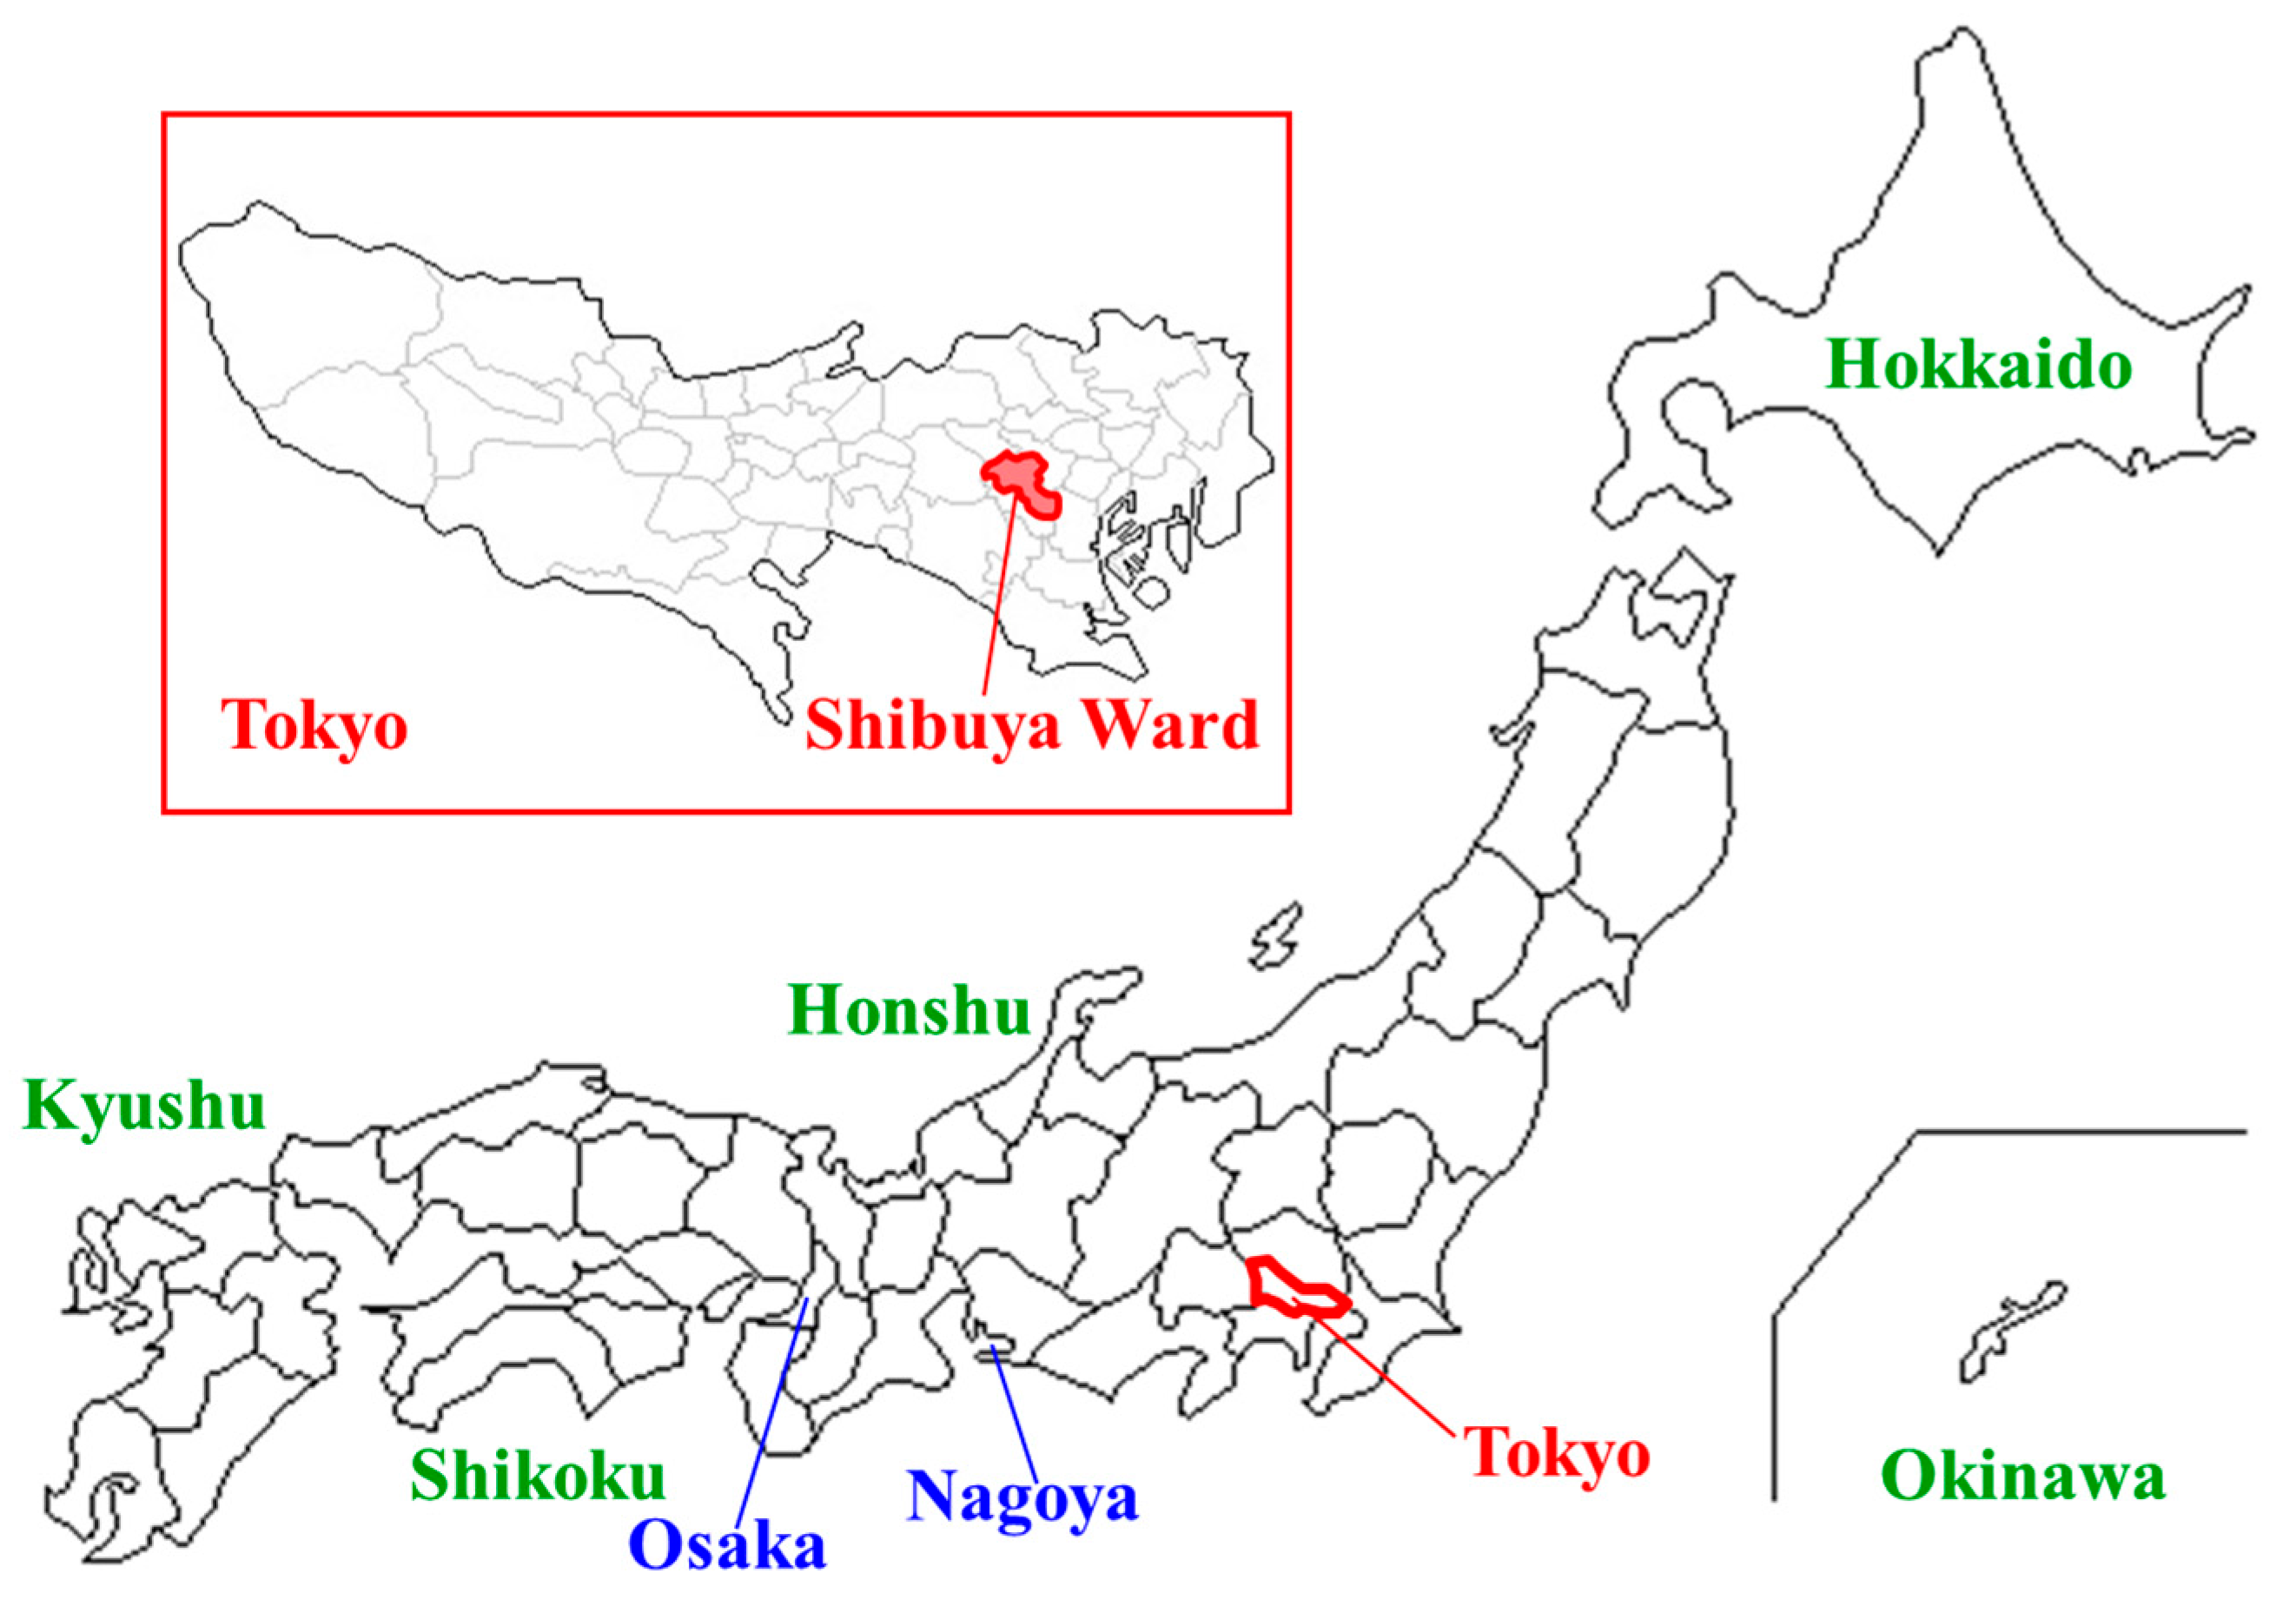
Figure 3.
Road network in the target area.

Figure 4.
Road classification based on the similarity in safety.

Figure 5.
Evacuation routes between each evacuation site (When the number of ants is 300).
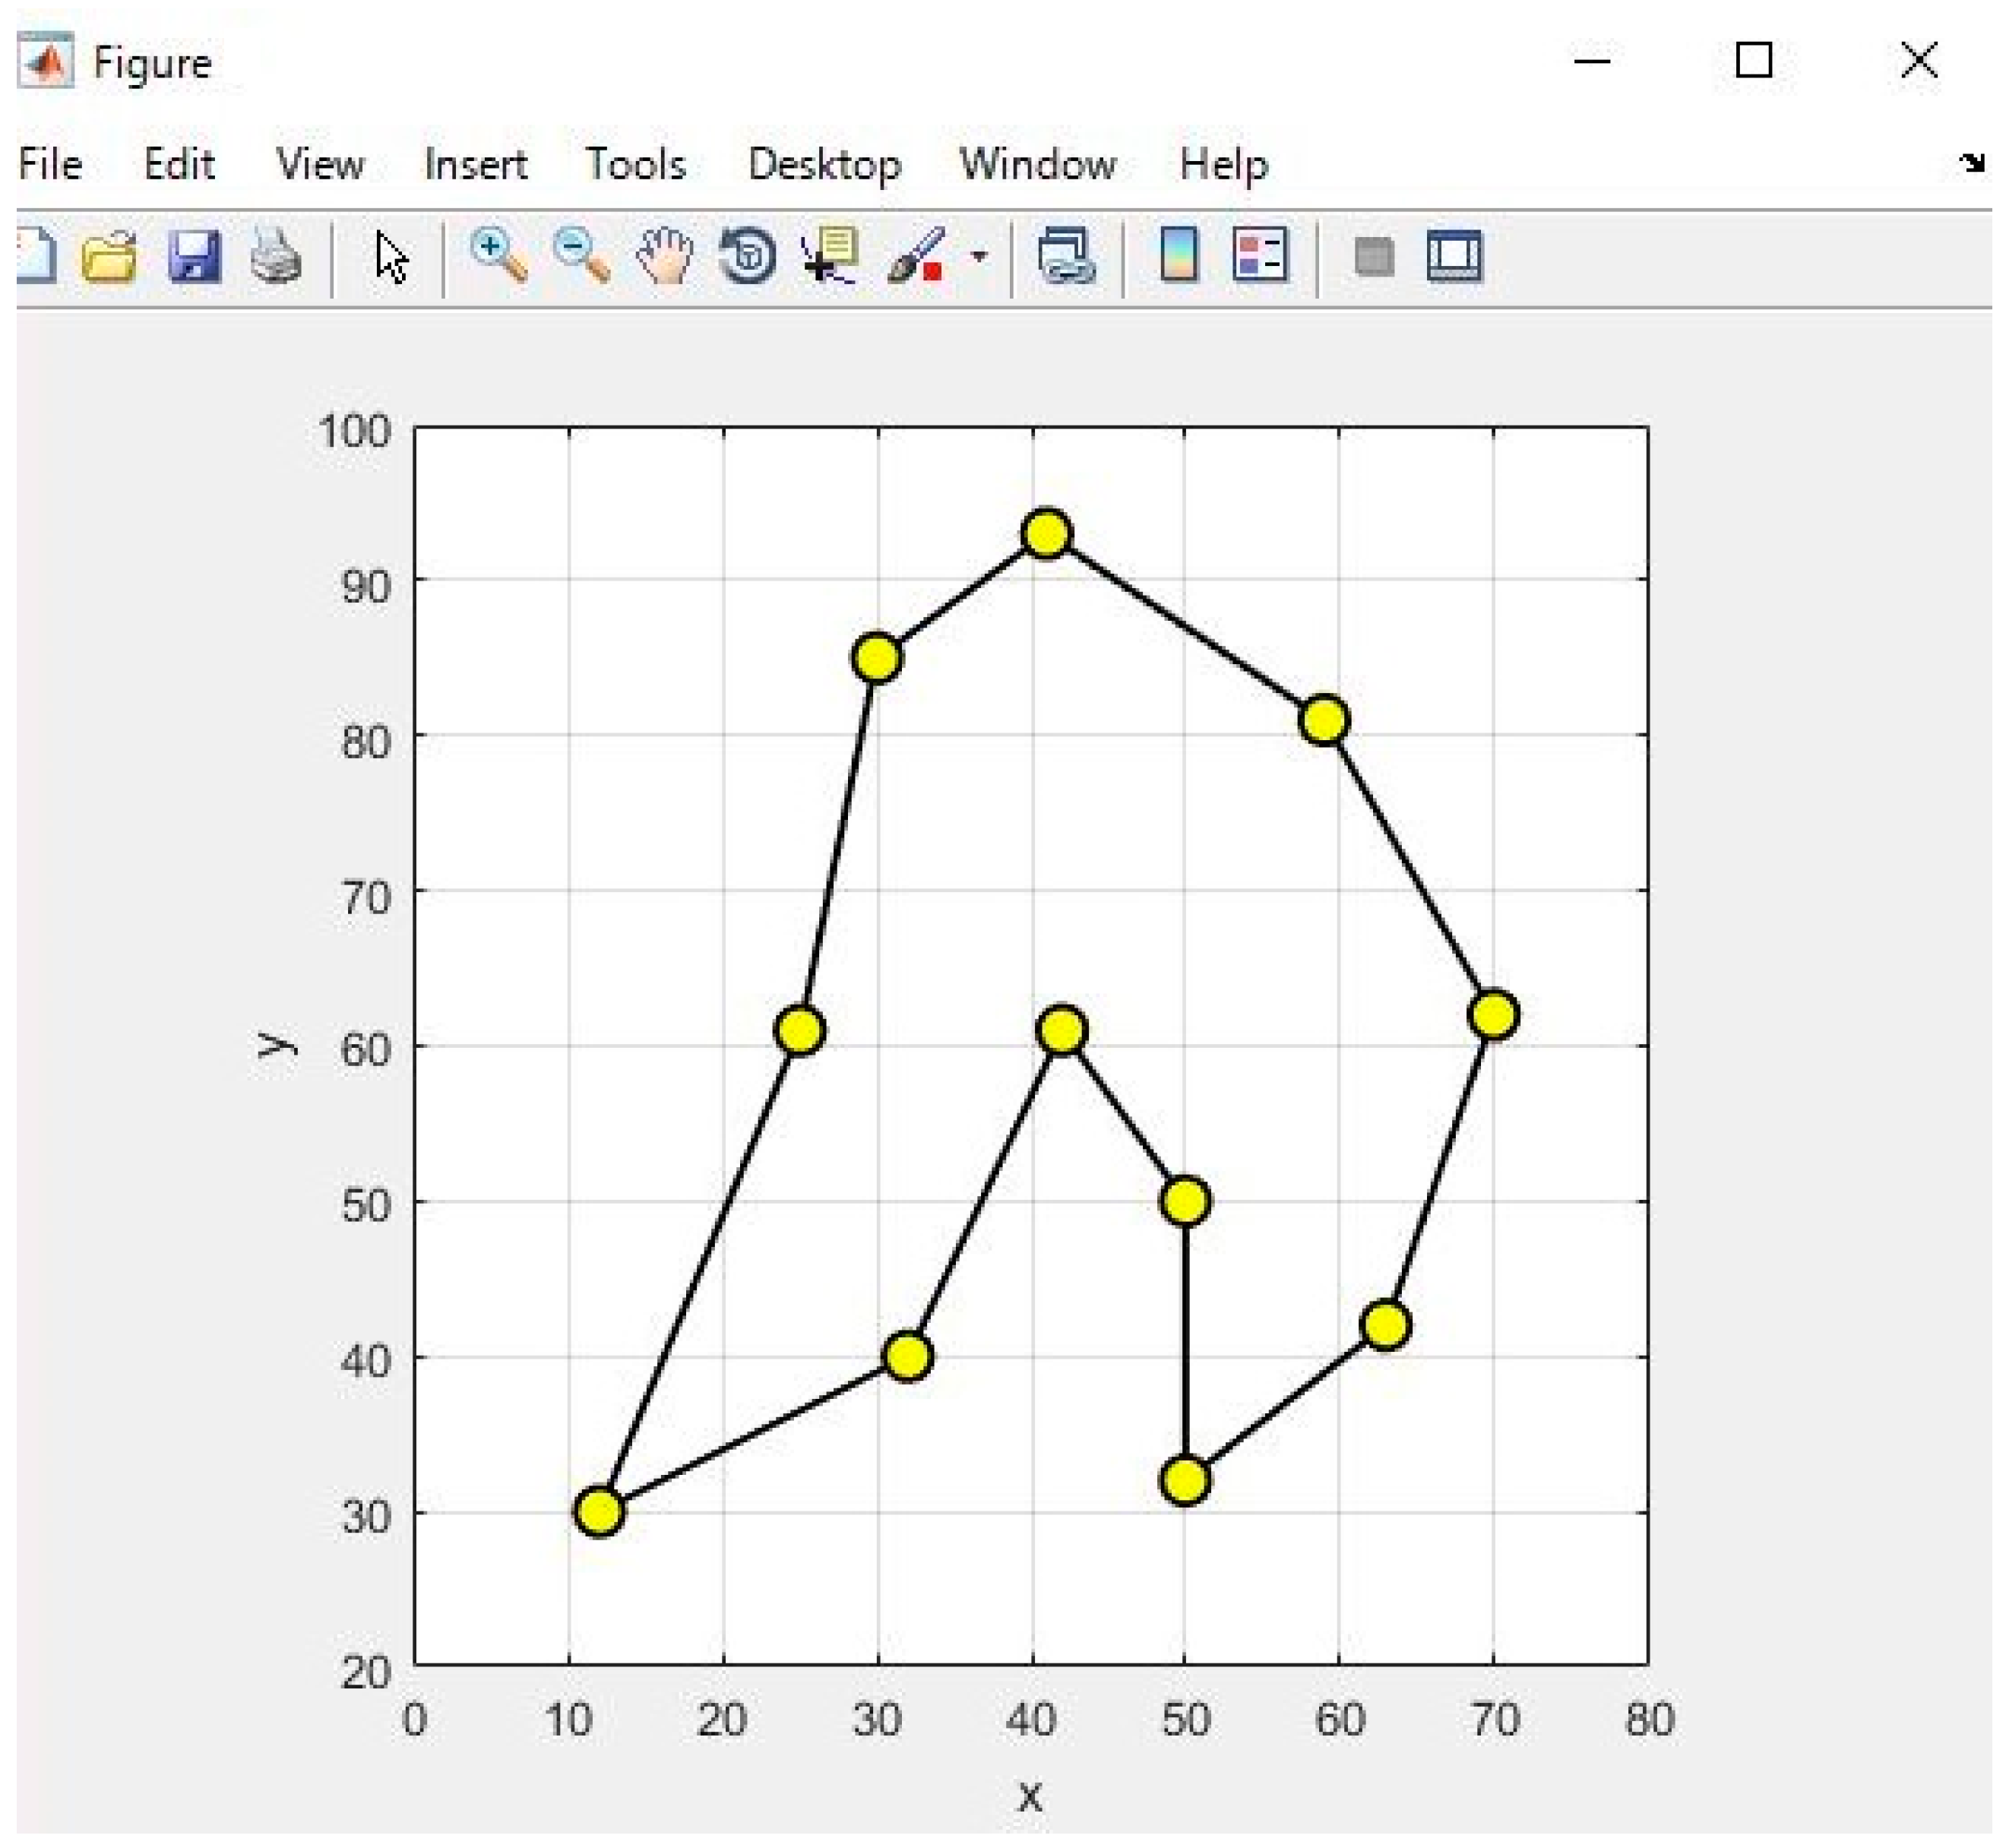
Figure 6.
Convergence situation of evacuation time cost (When the number of ants is 300).
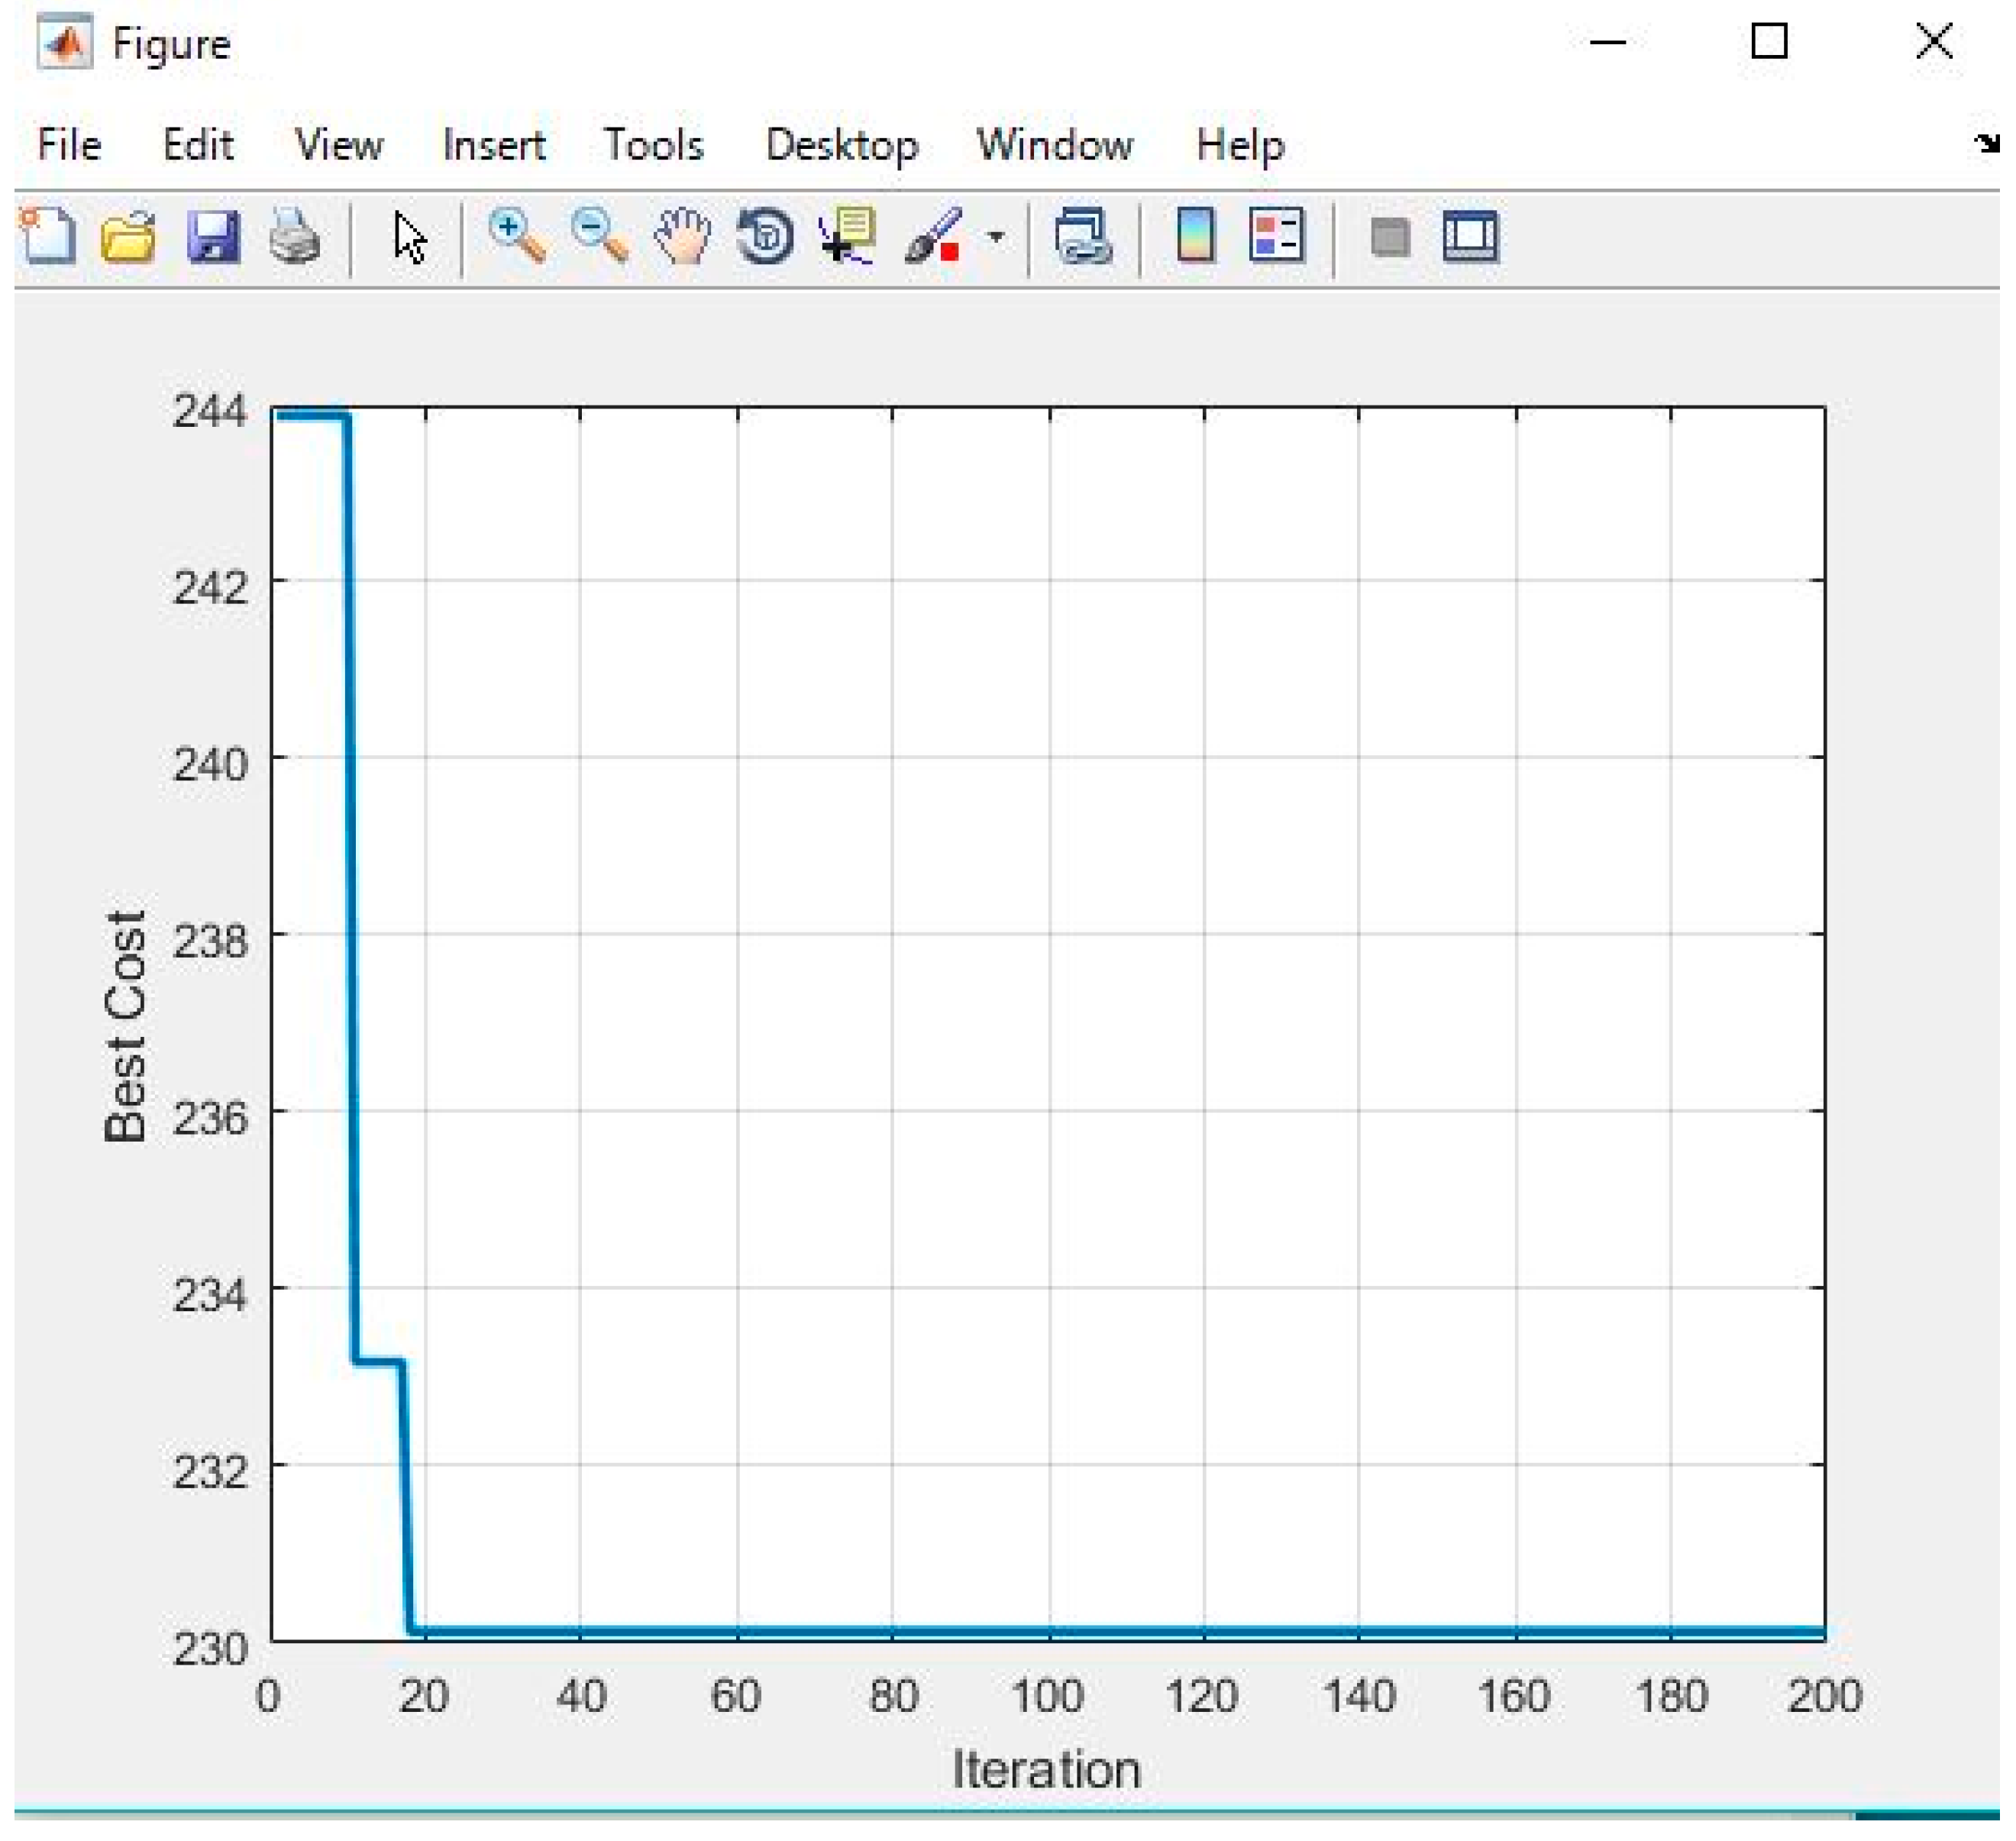
Figure 7.
Evacuation routes between each evacuation site (When the number of ants is 200).

Figure 8.
Convergence situation of evacuation time cost (When the number of ants is 200).

Figure 9.
Evacuation routes between each evacuation site (When the number of ants is 100).

Figure 10.
Convergence situation of evacuation time cost (When the number of ants is 100).

Figure 11.
Evacuation routes between each evacuation site (daytime evacuation).

Figure 12.
Evacuation routes between each evacuation site (nighttime evacuation).

Table 1.
Use Data and Processing Method.
| Use Data | Data Processing Method |
|---|---|
| 2012 current situation of land use (Bureau of Urban Development, Tokyo Metropolitan Government 2013) | Making of road network Measurement of road width |
| 2012 current situation of building use (Bureau of Urban Development, Tokyo Metropolitan Government 2013) Probability of total building collapse sorted by ground area and building type (Bureau of Urban Development, Tokyo Metropolitan Government: “District-based assessment of vulnerability to earthquake disaster (No. 7) in Tokyo Metropolis”) | Calculation of road blockage probability and its addition to the road network |
| Daytime and nighttime populations by the daytime and nighttime populations according to District (Ministry of Internal Affairs and Communications: “2010 National Census by the Statistic Bureau”) 2012 current situation of building use (Bureau of Urban Development, Tokyo Metropolitan Government 2013) | Calculation of estimated population in roads and its addition to the road network |
Table 2.
ACO Parameter Concerning the Simulation.
| Case | 1 | 2 | 3 |
|---|---|---|---|
| Solution options in which pheromones can be updated (evacuation sites) | 10 | 10 | 10 |
| Number of search ants (number of evacuees) | 300 | 200 | 100 |
| Volatilization rate (%) | 100 | 100 | 100 |
| Size of option list (convergence speed) | 110 | 110 | 110 |
| Number of occurrences | 200 | 200 | 200 |
Table 3.
ACO Parameters Used for Simulations (Daytime Evacuations).
| Solution options in which pheromones can be updated (evacuation sites) | 10 |
| Number of search ants (number of evacuees) | 300 |
| Volatilization rate (%) | 100 |
| Size of option list (convergence speed) | 110 |
| Number of occurrences | 200 |
Table 4.
ACO Parameters Used for Simulations (Nighttime Evacuations).
| Solution options in which pheromones can be updated (evacuation sites) | 10 | |
| Number of search ants (number of evacuees) | 100 | |
| Volatilization rate (%) | 100 | |
| Size of option list (convergence speed) | 110 | |
| Number of occurrences | 200 | |
Table 5.
Evaluation Values of Evacuation Routes with High Congestion Rates (Daytime Evacuation).
| Evacuation Routes with High Congestion Rates | Evacuation Distance (m) | Evacuation Time (h) | Congestion Rate (%) | Building Collapse Risk |
|---|---|---|---|---|
| Route 0–2 | 246.3 | 0.260 | 56 | 321.3 |
| Route 0–5 | 213.2 | 0.224 | 72 | 541.2 |
| Route 0–7 | 269.4 | 0.312 | 63 | 477.1 |
| Route 1–3 | 133.4 | 0.152 | 42 | 436.7 |
| Route 1–4 | 189.9 | 0.214 | 89 | 741.5 |
| Route 2–3 | 251.3 | 0.230 | 46 | 523.1 |
| Route 2–5 | 216.8 | 0.231 | 73 | 531.5 |
| Route 4–5 | 469.1 | 0.498 | 88 | 539.1 |
| Route 4–8 | 206.3 | 0.421 | 42 | 489.8 |
| Route 4–9 | 371.4 | 0.502 | 86 | 827.2 |
| Route 5–6 | 183.4 | 0.182 | 92 | 837.2 |
| Route 5–8 | 468.7 | 0.492 | 88 | 799.5 |
| Route 6–7 | 197.0 | 0.190 | 86 | 621.9 |
| Route 8–9 | 142.2 | 0.202 | 73 | 673.2 |
Table 6.
Evaluation Values of Evacuation Routes with High Congestion Rates (Nighttime Evacuation).
| Evacuation Routes with High Congestion Rates | Evacuation Distance (m) | Evacuation Time (h) | Congestion Rate (%) | Building Collapse Risk |
|---|---|---|---|---|
| Route 0–2 | 246.3 | 0.260 | 56 | 321.3 |
| Route 0–5 | 213.2 | 0.224 | 72 | 541.2 |
| Route 0–7 | 269.4 | 0.312 | 63 | 477.1 |
| Route 1–3 | 126.8 | 0.143 | 52 | 436.7 |
| Route 1–4 | 173.7 | 0.194 | 79 | 741.5 |
| Route 1–5 | 431.1 | 0.485 | 80 | 749.2 |
| Route 2–3 | 251.3 | 0.230 | 46 | 523.1 |
| Route 2–5 | 216.8 | 0.231 | 73 | 531.5 |
| Route 4–5 | 469.1 | 0.498 | 88 | 539.1 |
| Route 4–8 | 206.3 | 0.421 | 42 | 489.8 |
| Route 5–6 | 183.4 | 0.182 | 92 | 837.2 |
| Route 6–7 | 197.0 | 0.190 | 86 | 621.9 |
| Route 6–8 | 433.1 | 0.451 | 69 | 782.3 |
| Route 7–8 | 478.4 | 0.492 | 58 | 599.5 |
| Route 8–9 | 142.2 | 0.202 | 73 | 673.2 |
© 2017 by the authors. Licensee MDPI, Basel, Switzerland. This article is an open access article distributed under the terms and conditions of the Creative Commons Attribution (CC BY) license (http://creativecommons.org/licenses/by/4.0/).
Share and Cite
MDPI and ACS Style
Yamamoto, K.; Li, X. Safety Evaluation of Evacuation Routes in Central Tokyo Assuming a Large-Scale Evacuation in Case of Earthquake Disasters. J. Risk Financial Manag. 2017, 10, 14. https://doi.org/10.3390/jrfm10030014
AMA Style
Yamamoto K, Li X. Safety Evaluation of Evacuation Routes in Central Tokyo Assuming a Large-Scale Evacuation in Case of Earthquake Disasters. Journal of Risk and Financial Management. 2017; 10(3):14. https://doi.org/10.3390/jrfm10030014
Chicago/Turabian StyleYamamoto, Kayoko, and Ximing Li. 2017. "Safety Evaluation of Evacuation Routes in Central Tokyo Assuming a Large-Scale Evacuation in Case of Earthquake Disasters" Journal of Risk and Financial Management 10, no. 3: 14. https://doi.org/10.3390/jrfm10030014