Equity Options During the Shorting Ban of 2008


Gabelli School of Business, Fordham University, New York, NY 10458, USA
*
Author to whom correspondence should be addressed.
†
Current address: Fordham University GBA, 113 West 60th St, New York, NY 10023, USA.
J. Risk Financial Manag. 2018, 11(2), 17; https://doi.org/10.3390/jrfm11020017
Submission received: 11 February 2018
/
Revised: 16 March 2018
/
Accepted: 27 March 2018
/
Published: 31 March 2018
(This article belongs to the Special Issue Empirical Asset Pricing)
Abstract
:The Securities and Exchange Commission’s 2008 emergency order introduced a shorting ban of some 800 financials traded in the US. This paper provides an empirical analysis of the options market around the ban period. Using transaction level data from OPRA (The Options Price Reporting Authority), we study the options volume, spreads, pricing measures and option trade volume informativeness during the ban. We also consider the put–call parity relationship. While mostly statistically significant, economic magnitudes of our results suggest that the impact of the ban on the equity options market was likely not as dramatic as initially thought.
1. Introduction
The Securities and Exchange Commission’s (SEC) September 2008 emergency order introduced a near complete shorting ban of some 800 financials traded in the US. The only precedent from the 1930s, the order was controversial across the board. While the proponents of the ban often cited market stability and orderly functioning, the opponents often thought of the ban as an arbitrary intervention with negative effects on the price discovery and the capital allocation process in the economy. Furthermore, while there has been some recent work considering the implications of the ban for the stock market directly (see, for example, Boehmer et al. (2013)), the effects of the shorting ban on the equity options have been much less explored in the literature.
This paper provides an empirical analysis of the equity options market during the three months that include the duration of the ban. Using transaction level data from OPRA (The Options Price Reporting Authority), we study the options prices and market liquidity during the ban. Since we have data for the entire universe of optionable stocks across the exchanges, we are able to compare the options of the banned stocks and non-banned stocks to identify the effects. We have three main findings. First, during the ban period, banned stock effective and quoted option spreads increase as well as the Black and Scholes (1973) and Merton (1973) volatilities and prices relative to non banned stocks. Second, in predictive intraday regressions of future stock returns on lagged signed option trading volume, we find that option volume becomes informative during the ban for the banned stocks. Third, our measure of the violation of American stock put–call parity exhibits a significant increase during the ban period and only for banned stocks. Nevertheless, the economic magnitude and statistical insignificance of some of our findings suggest that the impact on the equity options market is likely less pronounced than initially thought.
The initial ban release states the ban would be effective starting 19 September 2008 for a duration of 10 trading days with a possible extension for a total of 30 calendar days. Eventually, the ban was effective until August 10 2008 for a total of 14 trading days. To consider the impact of the ban, we identify some 199 Initial Ban List and 1998 Never Banned stocks in the OPRA database. However, a broad inspection of data reveals that a large number of stocks have very low volume in their options, thus, to prevent the analysis being driven by these stocks, we require that the stocks have traded options for at least half of the trading days in the period that we consider. This activity measure leaves us with about 80 and 800 stocks for the Initial Ban List and Never Banned stocks. We consider a period of 42 trading days, which includes the 14-trading day ban period of from 19 September 2008 to August 10 2008 in the middle. We combine the two 14-day pre- and post-ban periods into one non-ban period, and contrast results for the non-ban period with during the ban period, for Never Banned stocks and Initial Ban List stocks.
The restriction to have traded options on at least half of the trading days is an important constraint for stocks. If the activity measure is made more stringent requiring a trade every trading day, then the sample size is reduced further. In that case for the largest moneyness range we consider, we would have 33 and 238 (29 and 225) stocks for call (put) options in the Initial Ban List and Never Banned groups. Fortunately, the qualitative results presented in this paper exhibit a considerable degree of robustness to further constraining the activity measure this way.
Boehmer et al. (2013) considered the impact of the ban on stock prices and found that the start of the shorting ban is associated with a pronounced but temporary increase in share prices for the banned stocks.1 Moreover, they found that banned stocks suffer a severe degradation in market quality, as measured by spreads, price impacts and intraday volatility.2 Harris et al. (2013), along similar lines of research, used the four factor model and found that, during the short ban, banned stock prices were inflated by about 10–12% on a risk adjusted basis. Barclay et al. (2008) found evidence for large order imbalances and excess volatility on triple witching days and the initiation of the ban was a triple witching day. We implement a two way fixed effects methodology similar to Boehmer et al. (2013) to understand how option volumes, spreads and pricing statistics change using some 12 variables. Focusing on call options with strike to spot ratios between 0.9 and 1.1, there were about 70 more trades, 1370 more size volume, and about half a million more dollar volume per underlying per day. These quantities are over and above the non-ban period averages of 109 (trades), 2021 (size volume) and 0.7 million dollars (dollar volume), therefore represent economically important increases in trading volume for the call options market. All three changes are statistically significant. Moreover, spreads go up by 3–5% (effective and quoted spreads). These values are over and above the 9 and 16 percent averages during the non-ban period, and therefore can be thought of as rather moderate. The prices go up by about 28 cents and implied volatilities by about 2.5 percent. All these quantities are for Initial Ban List stocks, during the ban relative to the non-ban period and Never Banned stocks. Turning to the put options, the number of trades, size and dollar volume measure changes are statistically insignificant and economically small. Spreads increase by two and three percent (effective and quoted spreads, respectively). The spread increases are over and above the 8 and 14 percent averages during the non-ban period and in this sense can be thought of as moderate. Put option prices go up by about fifty cents and implied volatilities by some six percent. The increase in the number of trades, size and dollar volumes for call options can be interpreted from the lens of Ross (1976). Ross (1976) argued that options written on existing assets can improve welfare by permitting an expansion of contingencies covered by existing securities.3 Therefore, when shorting is prohibited, the contingencies can be argued to be covered by option trades rather than direct short sales. We also present separate sets of results for the same variables for At, In and Out of the money options. Since the hedge ratios are different across the moneyness categories, there is a direct economic channel through which effects of different magnitudes can be expected on the options market. For example, we find that for Out of the money call options, option spreads go up by slightly less than At the money call options. One likely reason might be that delta hedging a long position in an Out of the money call position requires shorting less stock compared with an At the money option.
We also consider how the informativeness of options trades for the stock market changes during the ban. We run minutely overlapping regressions of the next 10, 15 and 30 min cross section of stock returns on the last 30 min of signed relative option volume. The signed relative option volume is defined as the ratio of the buy initiated volume to the sell initiated volume where option trades are marked using the algorithm presented by Lee and Ready (1991). We find that put option relative buy volume negatively predicts future returns during the ban. We are unable to detect any predictability during the non-ban period or using the call option signed relative volumes. These predictive regressions can be interpreted as tests of Semistrong-Form market efficiency (Fama (1970); Roberts (n.d.)). Our results suggest that the Semistrong-Form market efficiency is largely intact within the frame of specifications we employ. Easley et al. (1998) and Chan et al. (2002) used similar regressions in their work. In corroborating results, Kolasinksi et al. (2009)found that during the 2008 shorting ban, the short sales informativeness increased more for optionable stocks.
Lastly, we consider how the put–call parity is affected during the ban. A time series plot of the cross section of put–call parity violations suggest that the violations are most pronounced on 19 September, and drastically shrank immediately after. Measures similar to ours were constructed and studied by Ofek et al. (2004) and Cremers and Weinbaum (2010).
The closest paper to our paper is Battalio and Schultz (2011). Similar to our paper, they considered the impact of the shorting ban on equity options using OPRA data and document that potential short sellers did not migrate to the options market. This result is consistent with our insignificant dollar and size volume results for put options.4 This paper provides information on how the option spreads reacted to the ban, although does not report separate results for the moneyness categories like we do. Similar to our paper, they emphasized how the put–call parity violations likely increased during the ban for the banned stocks though their work does not include intraday predictive regressions of stock returns regressed on lagged option market volume information.
The SEC Initial Ban order included a few clauses to dampen the impact on the options market. For example, a limited exception was granted to “...registered market makers, block positioners, or other market makers obligated to quote in the over-the-counter market, in each case that are selling short a publicly traded security of an Included Financial Firm as part of bona fide market making in such security...”. Option market makers on the other hand were only given a single trading day exception with the purpose of allowing them to hedge for 20 September which is an equity option expiration day. However, with a follow up release on Sunday 21 September, SEC extended the option market maker shorting for the duration of the ban. We think that this extension of the exemption likely reduced the impact of the ban on the option market prices, liquidity, and efficiency to a very significant extent. In fact, in figures depicting the volume, spread and price statistics, we can see that 19 September is quite distinct from all the other days in our sample period. A second feature of the initial release was that SEC provided “...an exception to allow short sales that occur as a result of automatic exercise or assignment of an equity option held prior to effectiveness of this order due to expiration of the option...”, which is a clause that also likely dampened the impact of the ban on the options market. However, another reason why the ban had a dampened effect on the options market is possibly because investment banks can simply reduce their existing long equity positions to hedge their options activities rather than short. In this sense, they do not strictly need to short to cover their options trading.5
2. The Data
We use intraday data available from the OPRA (Options Price Reporting Authority). OPRA data are the quotes and trades disseminated by all U.S. options exchanges. The participating exchanges include AMEX (American Stock Exchange), BSE (Boston Stock Exchange), CBOE (Chicago Board of Options Exchange), ISE (International Securities Exchange), NASDAQ, NYSE, Arca and PHLX (Philadelphia Stock Exchange). OPRA also provides a consolidated list for the underlying securities for every month which includes the underlying names and tickers for which options were traded or quoted during that month. For September 2008, OPRA reports 3239 underlying securities for which an option was traded or quoted. These underlying securities include stocks, ETFs of stock indices and commodities and treasury indices. We try to identify all the underlying names and tickers in the CRSP to determine the precise type of the underlying securities. In Table 1A, we report that 2248 of OPRA underlying securities are stocks (based on CRSP share codes 10 and 11), 865 of OPRA underlying securities are Non-stocks (certificates, ADRs, shares of beneficial interest, units, companies incorporated outside the U.S., Americus Trust components, closed-end funds, preferred stocks and REITS). We are unable to identify the remaining 126 securities since they are not present in CRSP.
The list of banned stocks is available from the SEC (release 34-58592). A few days after the start of the ban, the SEC delegated to the exchanges all decisions about the ban of a listed firm and allowed them to add or remove stocks into the ban list. Using the NYSE EuroNext’s website, we are able to identify a total of 134 additions to and 10 removals from the ban list by the exchanges during the period of the ban. We exclude these later banned securities from our analysis, focusing on the Initial Ban List stocks and stocks that were Never Banned.
In Table 1A, out of a total of 2248, we identify 199 stocks that are in the Initial Ban List and 1998 stocks that were Never Banned. After a broad inspection of the data, we found that many of the options of this set of stocks trade very thinly. Following the empirical equity option literature, we impose some restrictions on the data before we proceed with our analysis. In particular, we provide the restrictions that moneyness (strike to spot ratios) are between 0.9 and 1.1, maturities are between 15 days and 360 days and Black and Scholes (1973) and Merton (1973) volatilities are less than 200%. We implement an activity measure where we require that stocks have at least one option traded in at least half of the trading days in our sample period. This brings our sample size to about 80 and 800 stocks for the Initial Ban List and Never Banned stocks, respectively. In particular, in Table 1B, for All options, we have 83 and 834 (81 and 748) for call (put) options for Initial Ban List and Never Banned stocks. We also consider At the money call options with strike to spot ratios of between 0.98 and 1.02. In the money call options have strike to spot ratios of between 0.90 to 0.98. Out of the money call options have strike to spot ratios of between 1.02 to 1.10. The same cutoff values are used to determine the moneyness of the put options. Since the moneyness range in these cases is more limited, the sample universe of stocks shrinks. For example, for At the money options, we have 34 and 227 (33 and 223) for call (put) options for Initial Ban List and Never Banned stocks, respectively. For Out of the money options, we have 55 and 550 (50 and 431) for call (put) options for Initial Ban List and Never Banned stocks, respectively. Finally, for In the money options, we have 44 and 324 (40 and 335) for call (put) options for Initial Ban List and Never Banned stocks, respectively. These numbers indicate that the sample universe is slightly larger for call options, and is largest for Out of the money, then In the money and finally At the money.
The data periods used in the tables is the 42 trading days which include the ban period in the middle. The ban period covers the 14 trading days from 19 September 2008 to 10 August 2008. Following Boehmer et al. (2013) , we consider the before and after the ban periods jointly, and so the non-ban period consists of the immediate 14 trading days before and after the ban. In particular, the non-ban period covers all the 28 trading days from 29 August 2008 to 18 September 2008 and 9 October 2008 to 28 October 2008. In the figures, however, for sake of completeness, we plot data obtained from all the 65 trading days in August, September and October 2008.
3. Methodology
There are three types of analysis we implement using our data source. First, we explore how volumes, spreads and pricing statistics change using 12 variable definitions, using a similar methodology to Boehmer et al. (2013). Second, we explore how the informativeness of options trading volume change by exploring intraday predictive regressions similar to Easley et al. (1998) and Chan et al. (2002). Third, we consider how the put–call parity relationship is affected by calculating violation measures similar to Ofek et al. (2004) and Cremers and Weinbaum (2010).
For each one of the stocks presented in Table 1, we construct twelve summary statistics for each trading day using transaction level data for that day. We are interested in three broad categories of summary measures: volume, spreads and pricing.
For volume measures, we consider four statistics: First, the number of types of contacts traded, which means that we simply count the unique maturity and strike price pairs across all the trades of the underlying stock during the trading day. Second, we simply count the number of trades regardless of the size of the trade or the dollar amount. Third, we calculate the size volume, which is the number of options contracts traded. Fourth, we calculate the dollar option trading volume for that underlying.
For spread measures, we focus on effective and quoted spreads, size volume and dollar volume weighted for a total of four measures. Quoted spread for a given trade is calculated using,
where Bid and Ask are the prevailing quotes at the time of the trade.6
The effective spread is calculated using,
where the numerator stands for the distance between the trade price and quote midpoint. Once Quoted and Effective spreads are calculated, to arrive a daily value for each stock and each trading day, we calculate weighted spreads by the size volume or the dollar volume of the trade.
Turning finally to the pricing measures, we consider prices directly and Black and Scholes (1973) and Merton (1973) volatilities, again prices can be equal weighted across trades or by size volume and Black and Scholes (1973) and Merton (1973) volatilities can be weighted by dollar or size volume for a total of four measures. Our choice for implied volatility calculations is driven by simplicity. Implied volatilities that come from alternative options pricing models which explicitly incorporate stock borrowing fees would have been more appropriate (see, for example, papers by Avellaneda and Lipkin (2009) and Ma and Zhu (2017)).
For each stock the daily values for each of the 12 variables are equally weighted across trading days for that stock in the ban and the no ban periods to arrive at the average values for the ban and the non-ban periods. The resulting cross sectional average values for the variables for the ban and the non-ban periods can be used to construct a t-statistic for testing if the cross sectional means are the same. If a stock does not have an option that satisfies the implied volatility, moneyness and maturity criteria, the ban or the non-ban period average is calculated across the days for which that stock actually had an option that satisfies the criteria. In particular, the following regressions are run:
In the above equations, and mean the variable value for the stock for the ban period and the non-ban period, respectively, and is a stock specific dummy value which assumes the value of unity, if the stock is in the Initial Ban List and zero otherwise.
Equations (3) and (4) allow us to focus on the difference the ban period makes for the Initial Ban List stocks and Never Banned stocks. Equation (5) allows us to focus on the difference the ban makes for the Initial Ban List stocks over and above the change in the Never Banned stocks. By construction, Equation (5) implies that the OLS estimate of is equal to , where and stand for the cross sectional expectations taken over the Initial Ban List stocks and Never Banned stocks. Therefore, while Equation (5) is a difference-in-difference construct, Equations (3) and (4) focus on the within group differences between the non-ban period and during the ban.
We also employ a two-way fixed effect regression to explore how the same 12 variables change during the ban period. In particular,
In addition to a firm fixed effect , the specification has calendar dummies for each trading day, and is a variable set equal to one if and only if the shorting ban is in effect for stock i on day t.
The specification allows us to identify the effect of a particular quantity, y, using the cross sectional information, by comparing ban and non-banned stocks on the same trading day, removing any differences between Initial Ban List stocks and Never Banned stocks that might exist when there is no ban on short sales.
Second, to explore the informativeness of options trading volume, we run intraday predictive regressions similar to Easley et al. (1998) and Chan et al. (2002). In particular, we consider a linear specification,
where is the return on the underlying stock i from time t to (holding period) and is the log of the ratio of the buyer to seller initiated dollar option trade volume from time to t (estimation period), using transaction level option trade data from OPRA. Buyer and seller initiated option trades are defined using the algorithm described in Lee and Ready (1991). is calculated for call and put option trades of the underlying stocks provided in Table 1 when they happen to trade in the estimation period. The cross-sectional regression is run on a rolling minutely basis for various holding periods and an estimation period of 30 min. The minutely cross-sectional regression coefficients ’s are calculated for each of the trading days during the ban and the non-ban periods. Parameter estimates and standard errors come from the Fama and MacBeth (1973) procedure, with a Newey and West (1987) correction where we use as many lags as the sum of the minutes in the estimation and holding periods.
Third, we consider how the put–call parity relationship is affected by considering a violation measure of the put–call parity. In particular, it is well known that, for American options on dividend paying stocks where the dividend is paid continuously, an arbitrage relationship is
As usual C is the call price, P is the put price, S is the stock price, q is the continuous dividend yield, T is the time to maturity, and K is the strike price. Notice that to arbitrage away any violation of the inequality, investors would short the stock. Thus, larger negative values of the quantity would likely indicate shorting difficulties.
To explore the extent to which this inequality holds, we calculate the quantity for matched trades for call and puts for Initial Ban List and Never Banned stocks and during the ban period and the non-ban period.
4. Results
We next report results of the regression Equations (3)–(5) for understanding how volumes, spreads and pricing statistics change for our moneyness categories: first, All options taken together, and then for each of At, Out and In the money options. All options have strike to spot ratios between 0.9 and 1.1. We further define At the money call options with strike to spot ratios of between 0.98 and 1.02. In the money call options have strike to spot ratios of between 0.90 to 0.98. Out of money call options have strike to spot ratios of between 1.02 to 1.10. The same cutoff values are used to determine the moneyness of the put options.
Focusing on Table 2, the first three columns report the results for the Initial Ban List stocks and the second three columns report for the Never Banned stocks. For each category of stocks, we report the non-ban period and during the ban period means and the t-statistic for the regression intercept, in the regression Equation (3) or Equation (4). The two last columns of the table reports the coefficient estimates and the t-statistics for the regression intercept in the regression Equation (5). Notice that the first two specifications are equivalent to a usual t-test for same means of the matched sample of stocks. The third specification is a difference in difference methodology with one implicit time dummy and one explicit ban dummy. Later, we also use a two way fixed effect methodology, allowing for firm level and trading day fixed effects. All errors are ordinary OLS errors. Table 2A reports the All call options and Table 2B reports the All put options results.
Focusing on the call options for Initial Ban List stocks, on the left half of Table 2A , we see that on average about one more contract type gets offered (compare 6.65 to 5.73 for a difference of 0.92). Average number of trades go from 109 to 183. Size volume increases from around two thousand to around three thousand three hundred and daily dollar volume goes up from about seven hundred thousand to slightly more than a million dollars. Volume measures are reported per stock and per day. Dollar weighted quoted spreads go up from around 15 percent to 24 percent and effective spreads go from about 9 percent to 14 percent. Prices of call options go up about a quarter dollar from 3.5 dollars yet the implied volatilities fall slightly, from around 74 percent to 73 percent; however, the difference has no statistical significance. All variables presented, except for the implied volatility, are statistically significant.
Turning to the call options for Never Banned Stocks, the number of types of contracts and number of trades and size volume are fairly stable and show no big change going from the non-ban period to during the ban (though they all slightly go up). Quoted spreads go from around 15 percent to 18 percent and effective spreads go from around 8 percent to 10 percent. Prices significantly fall a few cents from around 2.80 dollars and implied volatilities fall from around 64 percent to 60 percent. Spreads, prices and implied volatilities exhibit statistical significance. The option market for the Never Banned Stocks were likely effected because of the risk that any one of these stocks could later be banned in the subsequent days abruptly.
The within group changes are often of the same direction in both groups are stocks, thus Equation (5) results are needed, which provide incremental effects for Initial Ban List stocks relative to Never Banned, going from the non-ban period to during the ban. The findings are in the last two columns of Table 2, where the point estimate and statistical significance of the mean changes relative to the control group is provided, i.e., the t-statistics of the coefficient of the ban dummy in the regression. Brief inspection of the last two columns of Table 2A results for call options imply that relative to non-banned stocks, all of the variables discussed thus far experienced an significant increase for the Initial Ban List stocks, going from the non-ban period to during the ban period. All the t-statistics are well above 2. In particular, going in to the ban period, and relative to the Never Banned Stocks, the Initial Ban List stocks experienced about 0.6 more types of contracts traded, 67 more trades with a size volume of 1313 more. Dollar volume goes up about half a million dollars. These indicate meaningful increases in the trading volume of call options. The intuition is that the short ban likely effectively truncated the downside of the stock return distribution and so the market participants traded calls to resolve the upside of stock return distribution. Quoted spreads go up about 5.5 percent and effective spreads go up about 3.5 percent. Again, these increases come on top of 16 percent and 9 percent averages during the non-ban period so can almost be regarded as moderate. Prices go up by about 28 cents and implied implied volatilities go up by a small 2.5%. All of the changes reported are statistically significant.
Table 2B reports the same set of results for put options. First, we consider Initial Ban List stocks and then turn our attention to Never Banned Stocks. For Initial Ban List stocks, within the group, we are unable to detect any significant change in number of trades, size volume or dollar volume. Spreads, quoted and effective, go up significantly. Quoted spreads go from about 14 percent to 20 percent and effective spreads go from 8 percent to 12 percent. All four spread measure changes are significant. Prices go up from around 3.80 to 4.30 dollars, and implied volatilities go up from around 80 to 82 percent. Statistical significance for price changes is strong and for the implied volatility changes is only borderline.
For the Never Banned Stocks, on the other hand, number of trades, size and dollar volume all increase statistically significantly, but the economic magnitude of changes are small. Quoted spreads go from around 13 percent to 15 percent and effective spreads go from around seven percent to nine percent. The spread changes are statistically significant. Prices go up a few cents, although the change is not significant. The large drop is in implied volatilities, they go from about 67 percent to 63 percent and the drop is highly statistically significant. Again, spreads going up for both groups call for the difference in difference results from the estimation of Equation (5), and these are reported in the last two columns. Relative to non-banned stocks, Initial Ban List stocks, experienced statistically significant increases in the spreads (quoted and effective), prices and implied volatilities. Spreads go up around 3% for quoted and 2.5% for effective, prices go up by about half a dollar and implied volatilities go up by some 6%. While the statistical significance is there, the economic significance on the spreads can be regarded as moderate though, since spreads increase on top of non-ban period averages of 14 and 8 percent. Likewise, the six percent drop in the implied volatilities is from a non-ban period average of a sizeable 80 percent. None of the volume measure changes exhibit statistical significance for put options.
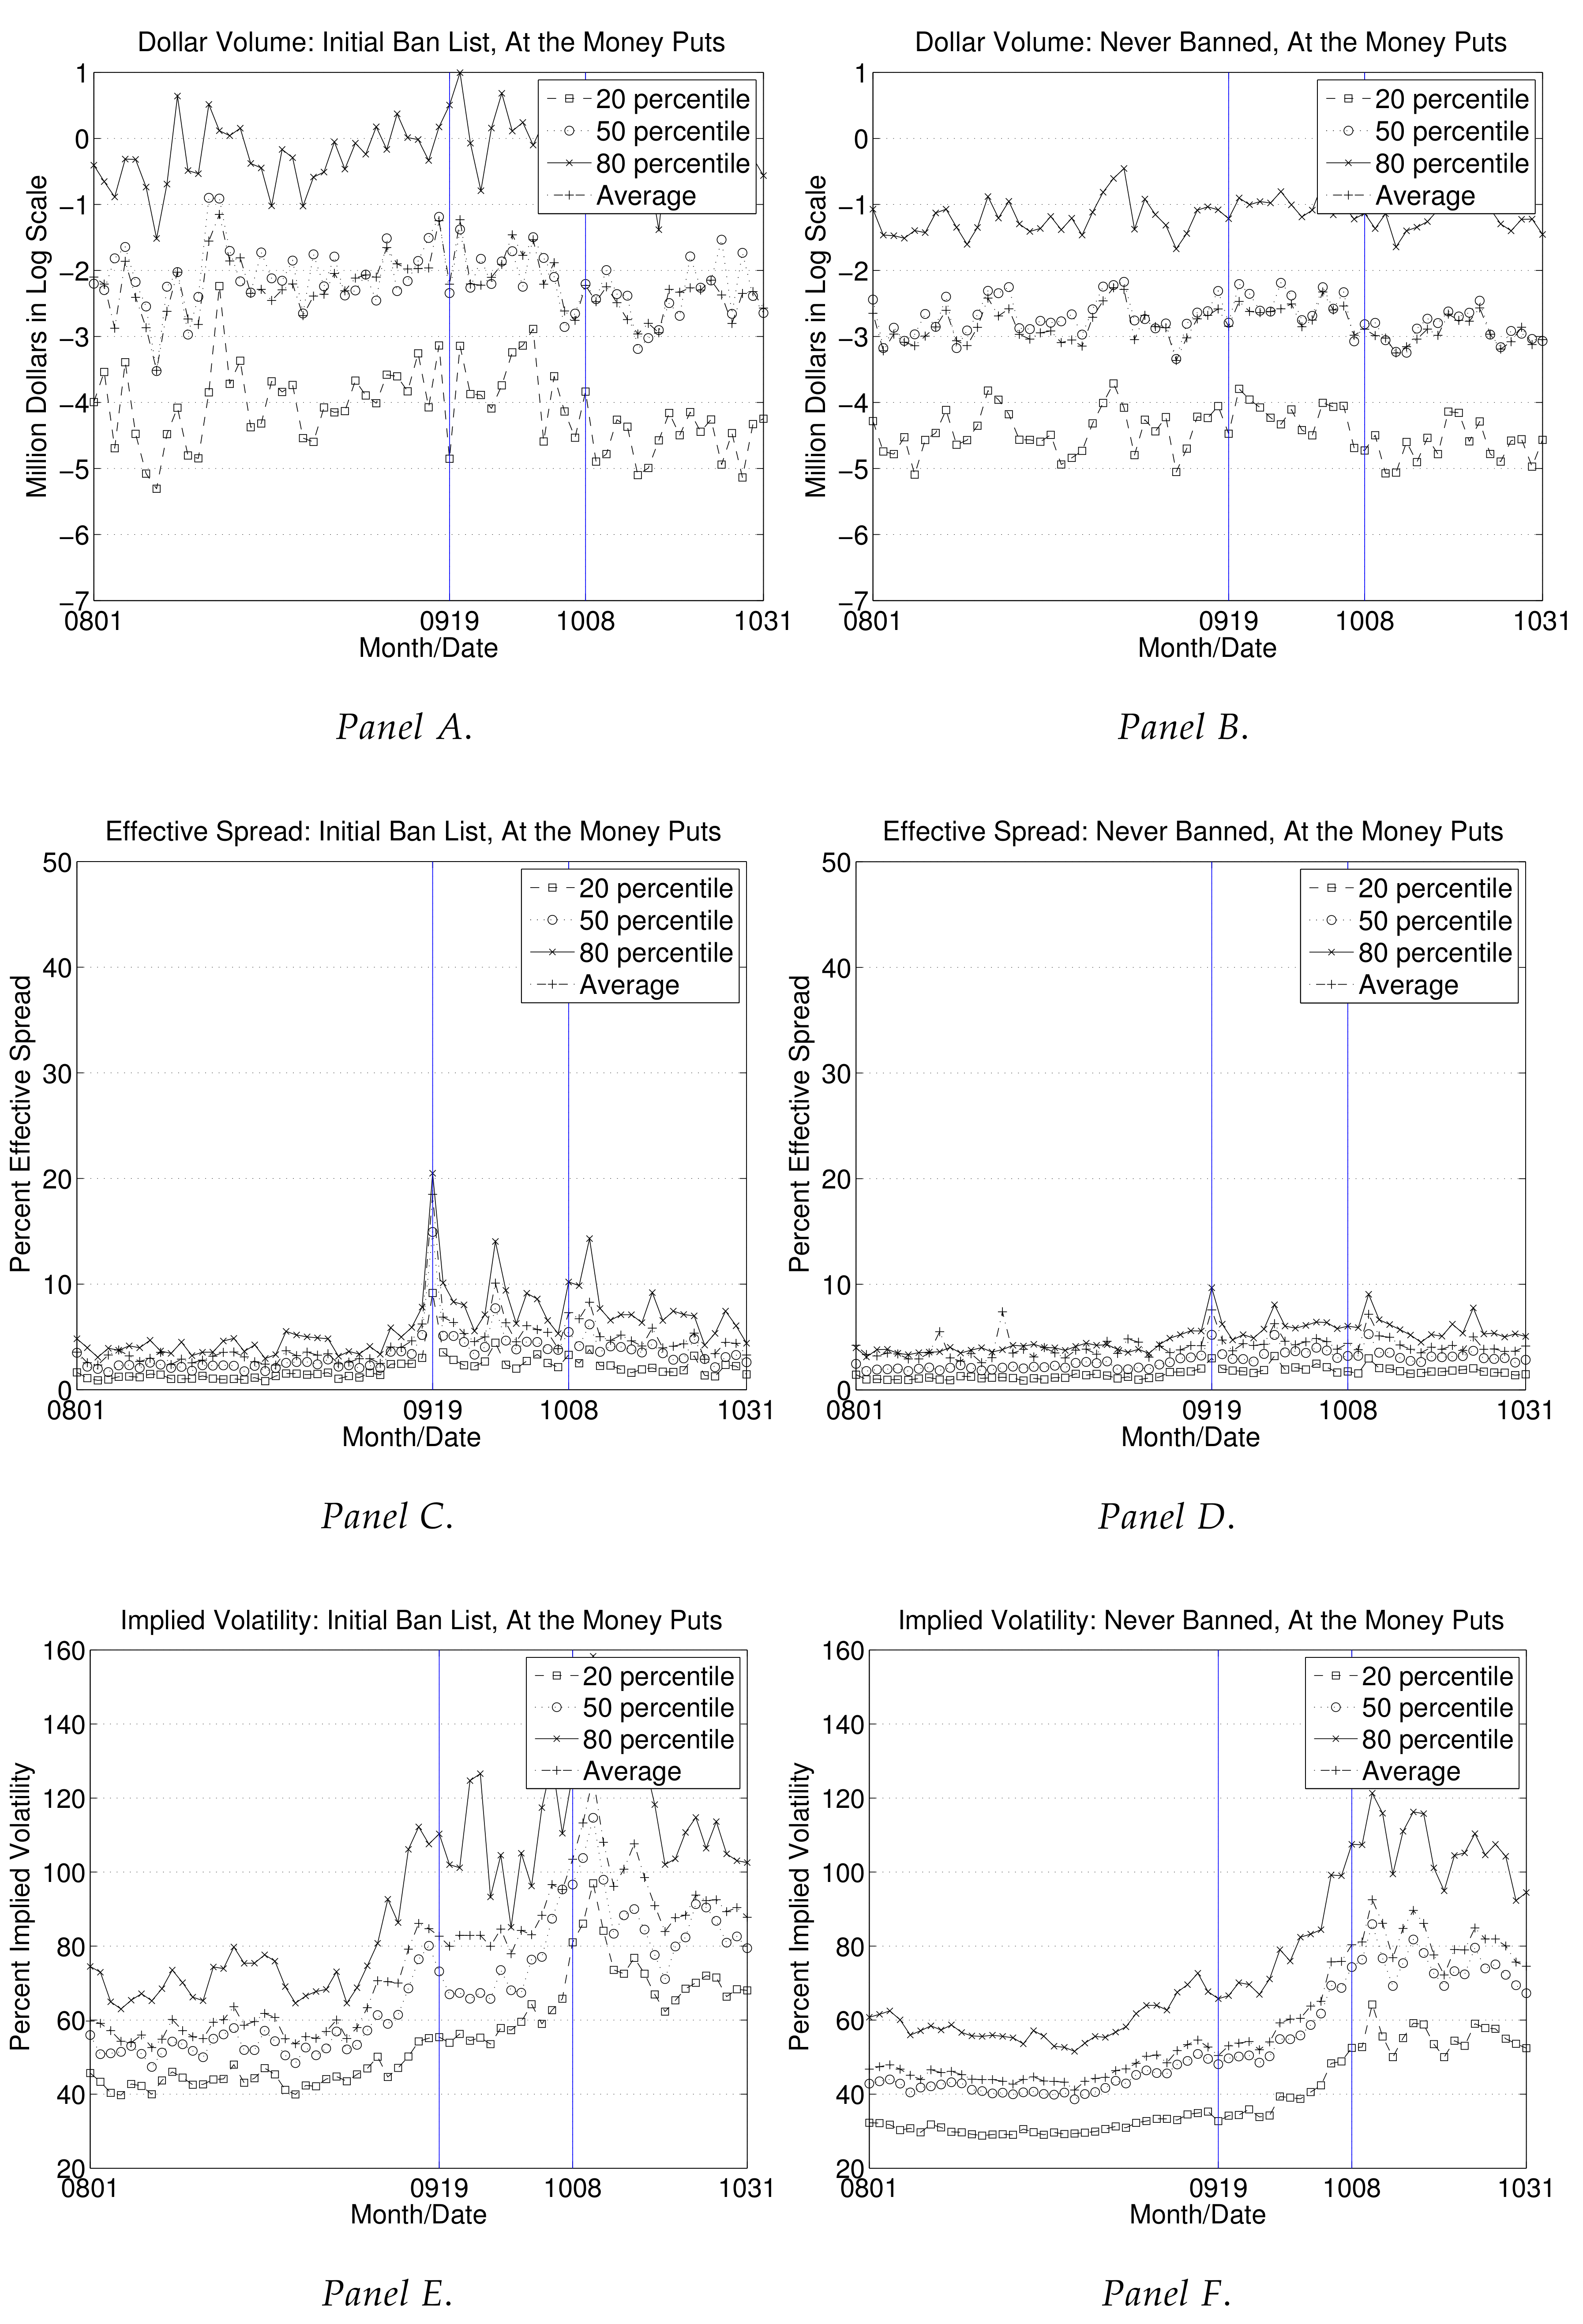
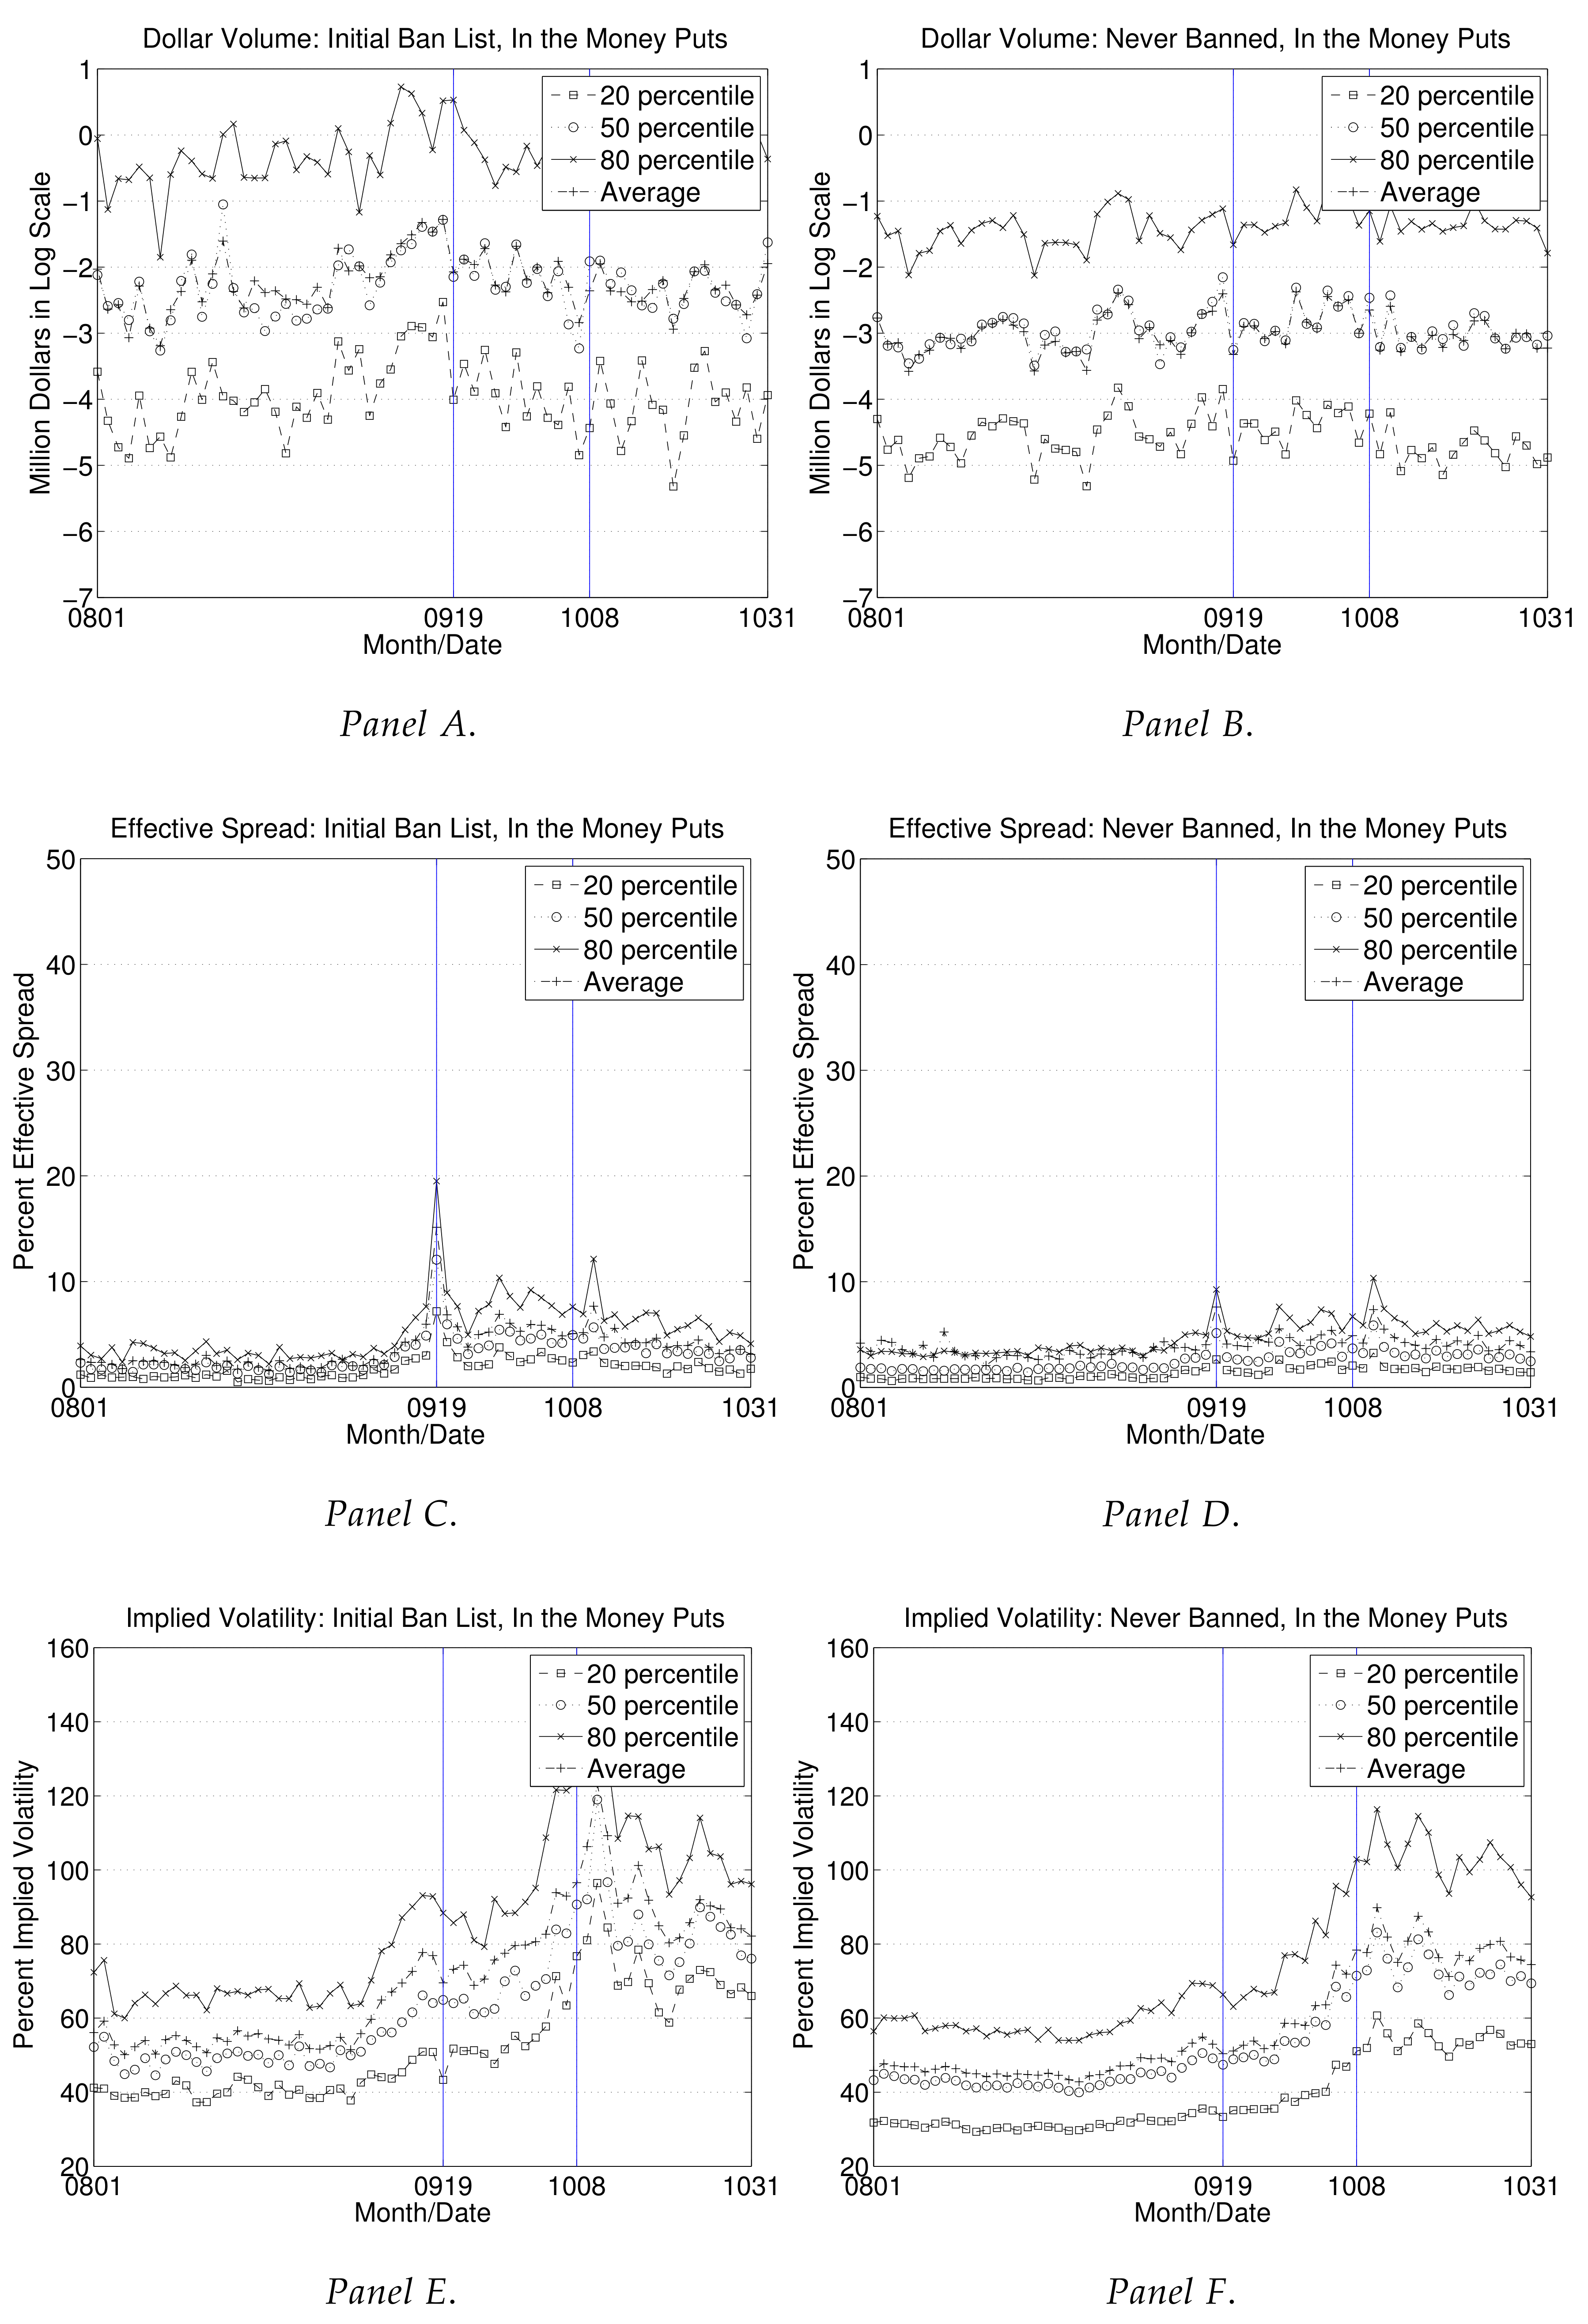
Figure 1 plots the cross sectional means and 20th, 50th and 80th percentile values of dollar volume, percent effective spread and percent implied volatilities through August, September and October 2008 for call options. Spreads and implied volatilities are calculated dollar weighted within the trades of a stock during the day and the cross sectional summary statistics are reported. Figure 1A,C,E reports for Initial Ban List and Figure 1B,D,F for Never Banned Stocks. Figure 1 provides results that support Table 2A. Figure 1A shows that call dollar volumes slightly declined with the introduction of the ban and during the ban, and were especially low during the post-ban period when compared with the pre-ban period. Figure 1B portrays a similar trend for Never Banned Stocks. In particular, comparing the pre-ban period with during the ban in Figure 1A,B, it is hard to conclude that the call options of the two groups of stocks were dramatically differently affected. Figure 1C shows how call spreads increase considerably on 19 September, the first day of the ban, and then drop dramatically, although still to a higher level than before the ban. The reason for the spike is likely that option market makers thought they would never be able to hedge until the end of the ban, while eventually they were able to, since their one day (Friday) exemption was extended during that weekend. We understand that the SEC extension release (34-58611) was very helpful in lowering the spreads. Figure 1D shows that Never Banned Stock call option spreads were affected similarly but the effects are much less pronounced. One reason for the presence of any effect might be the regulatory uncertainty that introduced the risk of a ban to just about any stock. Figure 1E,F shows that implied call volatilities of both categories of stocks increased steadily during the ban and settled at level in the after the ban period that is much higher than before ban or during the ban. The trends and magnitudes are very similar for the two categories of stocks. The incremental impact on the Initial Ban List stock option implied volatilities is a small 2.5%. From the view point of this Equation (5) result and visually from Figure 1E,F, it is hard to conclude that the call option implied volatilities were drastically different across the two categories of stocks. Figure 2 provides results that support Table 2B. Figure 2A,B visually presents why we find insignificant dollar volume changes for put options in Table 2B. There is hardly any discernable clear pattern in the put dollar volume for either group of stocks. Figure 2C,D shows the impact on the put spreads for the two groups. For both groups, there is a stark increase on 19 September, and spreads come down immediately after, although remain higher when compared to the pre-ban period. The increases and the levels are lower than the call options. Figure 2E,F shows the impact on the implied volatilities. The difference-in-difference change for the Initial Ban List stocks reported in Table 2 is about six percent over and above a non-ban period average of 80 percent. Visually, it is hard to discern the obvious dramatic way in which one of the group’s put option implied volatilities behaved differently than the other’s.
Table 3 reports the same results but constraining attention to only At the money options, where the strike to spot ratios are between 0.98 and 1.02. For sake of brevity, we will only focus on the last two columns of results which provide incremental information for Initial Ban List stocks going from the non-ban period to during the ban, relative to the Never Banned. For call options, number of types of contracts, number of trades, size volume, dollar volume and spreads (quoted and effective) and prices go up in statistically and economically significant ways. No significant relative change happens in terms of the implied volatilities. Comparing Table 2A and Table 3A, for All call options, the results appear less pronounced, consistent with the idea that at the money options are often the most liquid and attract the most demand (and supply).
For At the money put options, size volume, spreads, prices and implied volatilities go up and these changes are statistically significant. Though the size of the economic magnitudes can be thought of as moderate. For example, size volume goes up by 329 on top of a non-ban period average of 1463. Spreads go up by about 3.5% and 2% (quoted and effective) on top of non-ban period averages of about 8.5% and 4.5%. Prices and implied volatilities go up by about sixty cents and 8% on top of non-ban period averages of five dollars and 83%.
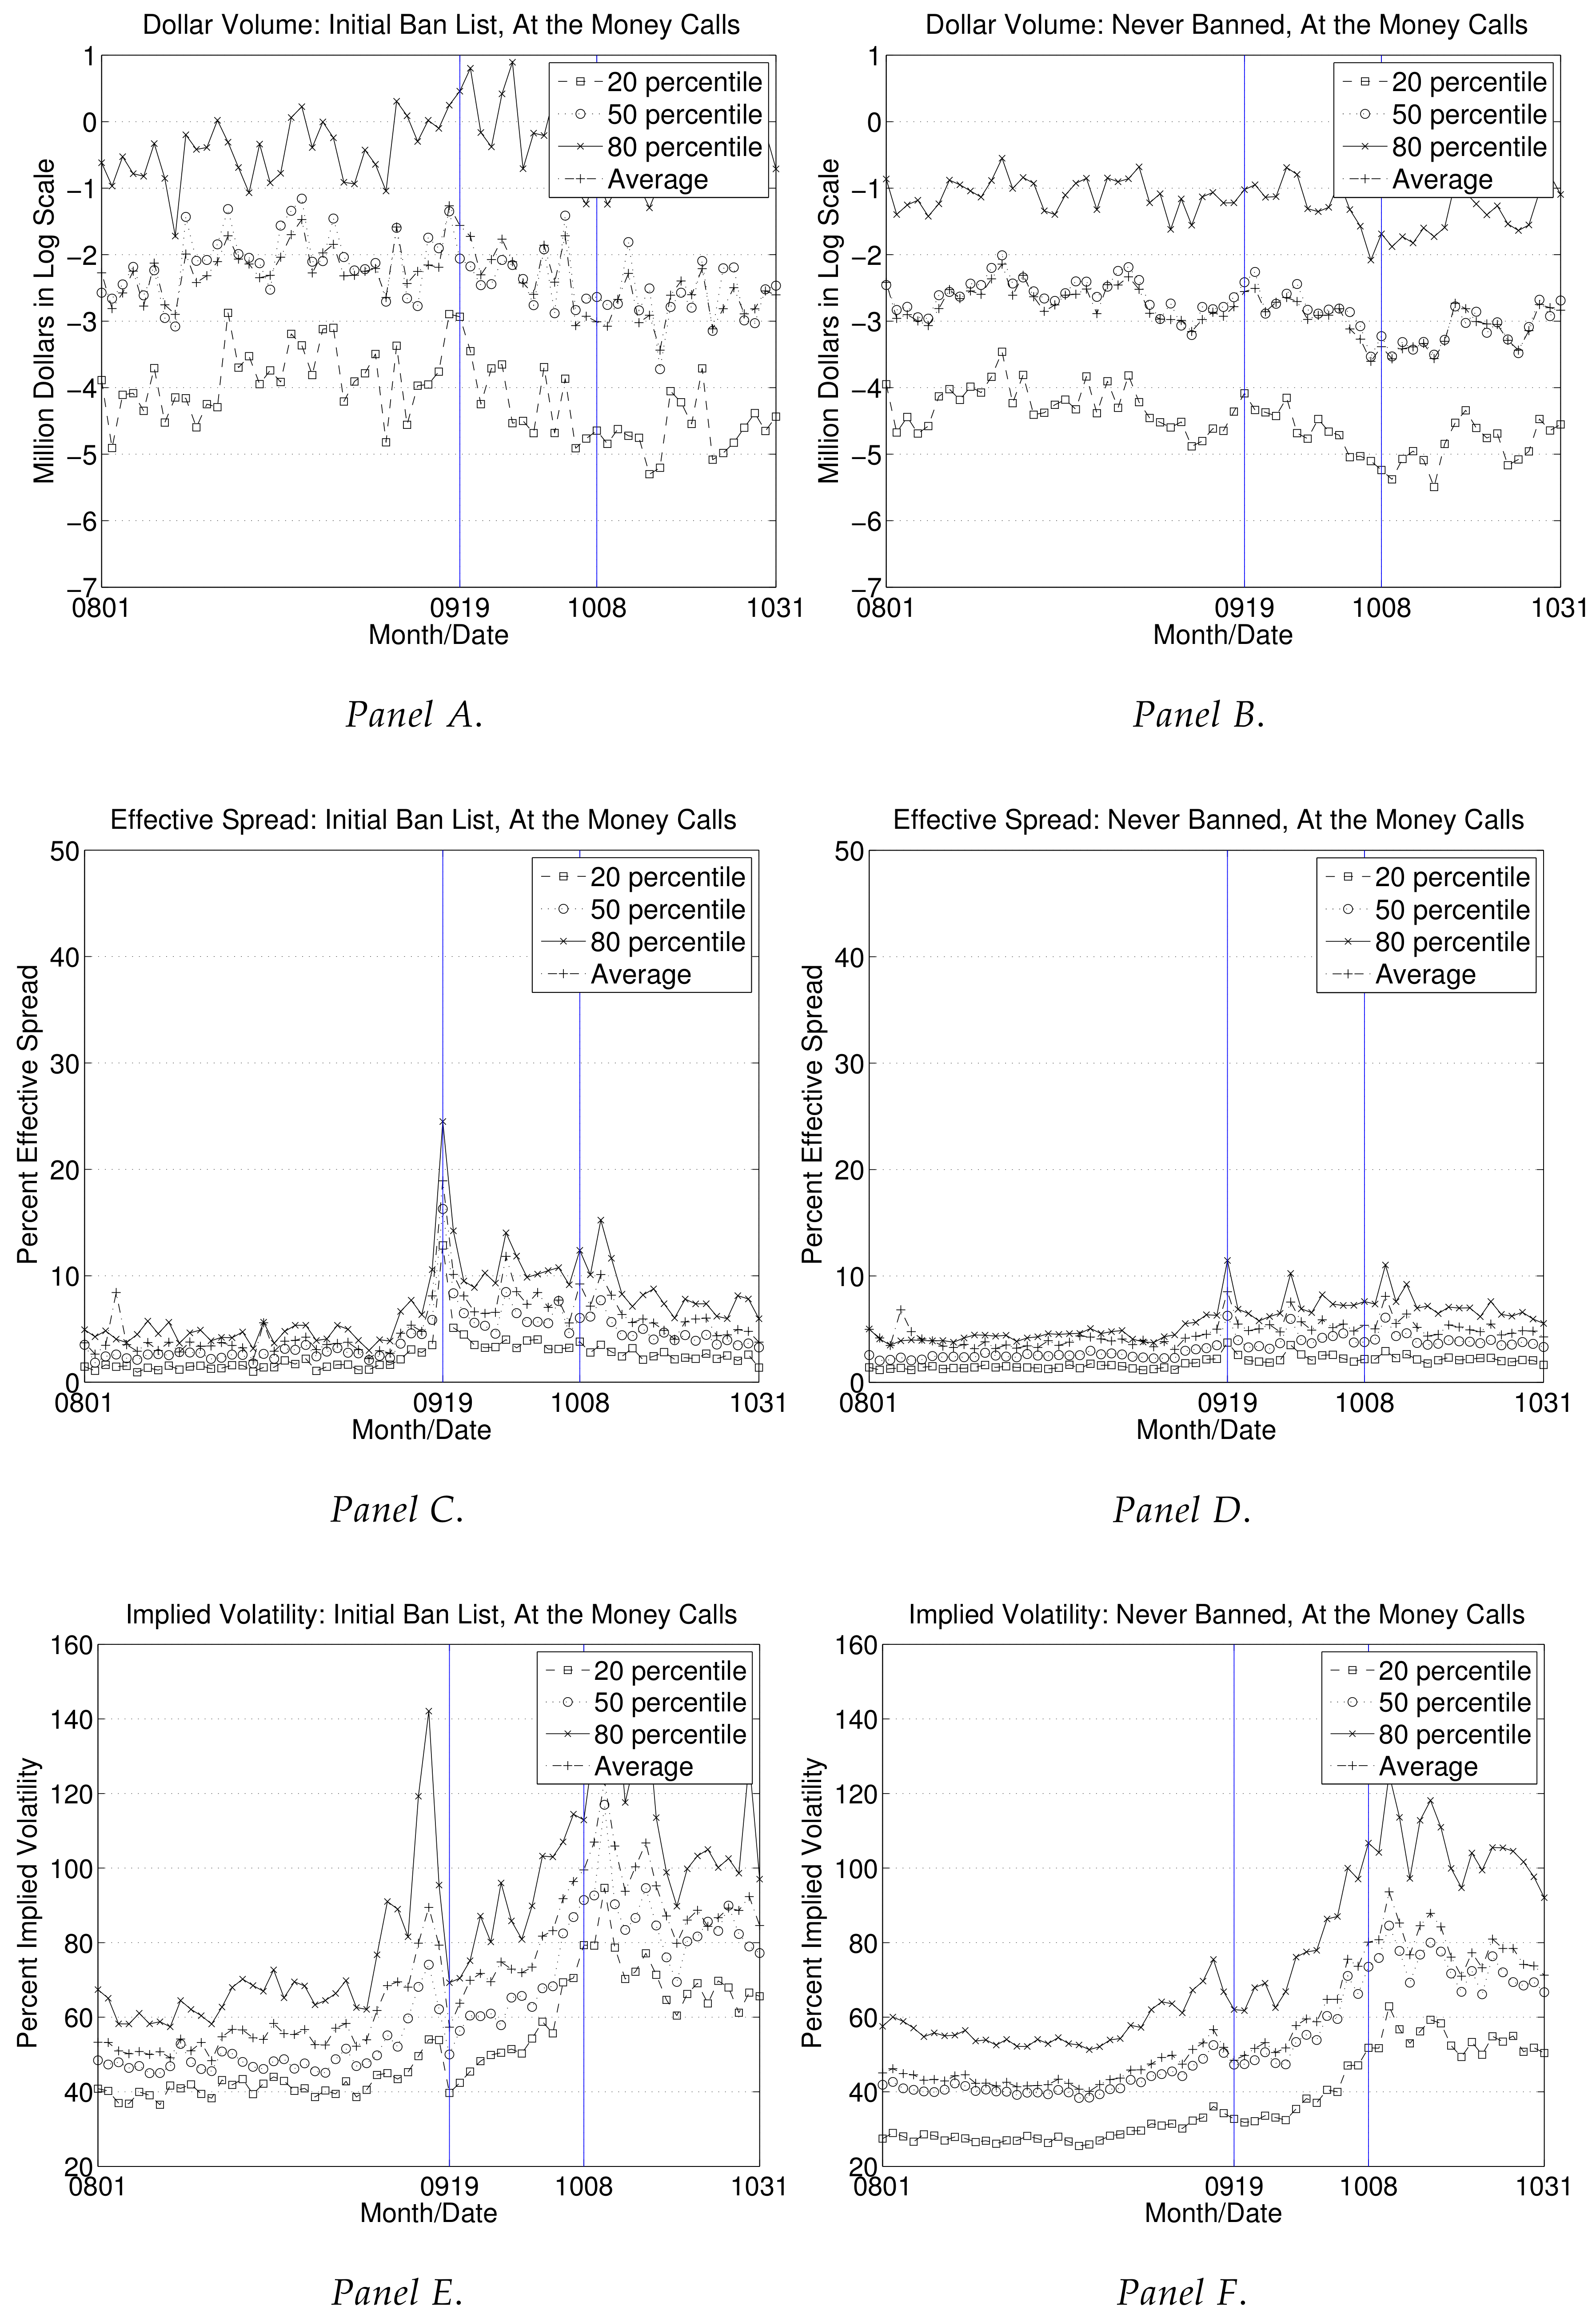
Figure 3 and Figure 4 plot the associated cross sectional means and the 20th, 50th and 80th percentile values of dollar volume, percent effective spread and percent implied volatilities through August, September and October 2008 for calls and puts. Comparing Figure 3A,B help us understand the positive relative dollar volume change for at the money Call options (some three hundred and twenty thousand dollars per underlying per day as reported in Table 3A). The volume after the ban period is particularly low for Initial Ban List stocks, with little change for either of the two groups of stocks entering the ban period. Figure 4A,B for put options seems to show that, entering the ban period, there is little change in either groups’ dollar volume though, exiting the ban period the dollar volumes seem to fall for both. The relative effect for dollar volume reported for put options in Table 3B is statistically insignificant. Comparing Figure 3C,D with Figure 1C,D for All call options, we understand that spreads are in general smaller and had a smaller spike on 19 September. Comparing Figure 4C,D with Figure 2C,D for All put options reveals a similar result. Focusing on implied volatilities of put options, Figure 4E shows that the ban has the effect of stopping the upward trend for the Initial Ban List stocks. For Never Banned Stocks, on the other hand, Figure 4F shows that implied volatilities continued to trend up during the ban period and stabilize and start falling only after the ban period. Figure 3E,F portray a slightly different picture for calls. As Figure 3E shows for the Initial Ban List stocks, the ban had the effect of reducing the implied volatilities especially early in the ban, although the implied volatilities have an up trend during the ban similar to the implied volatilities of the Never Banned stocks, as Figure 3F shows.
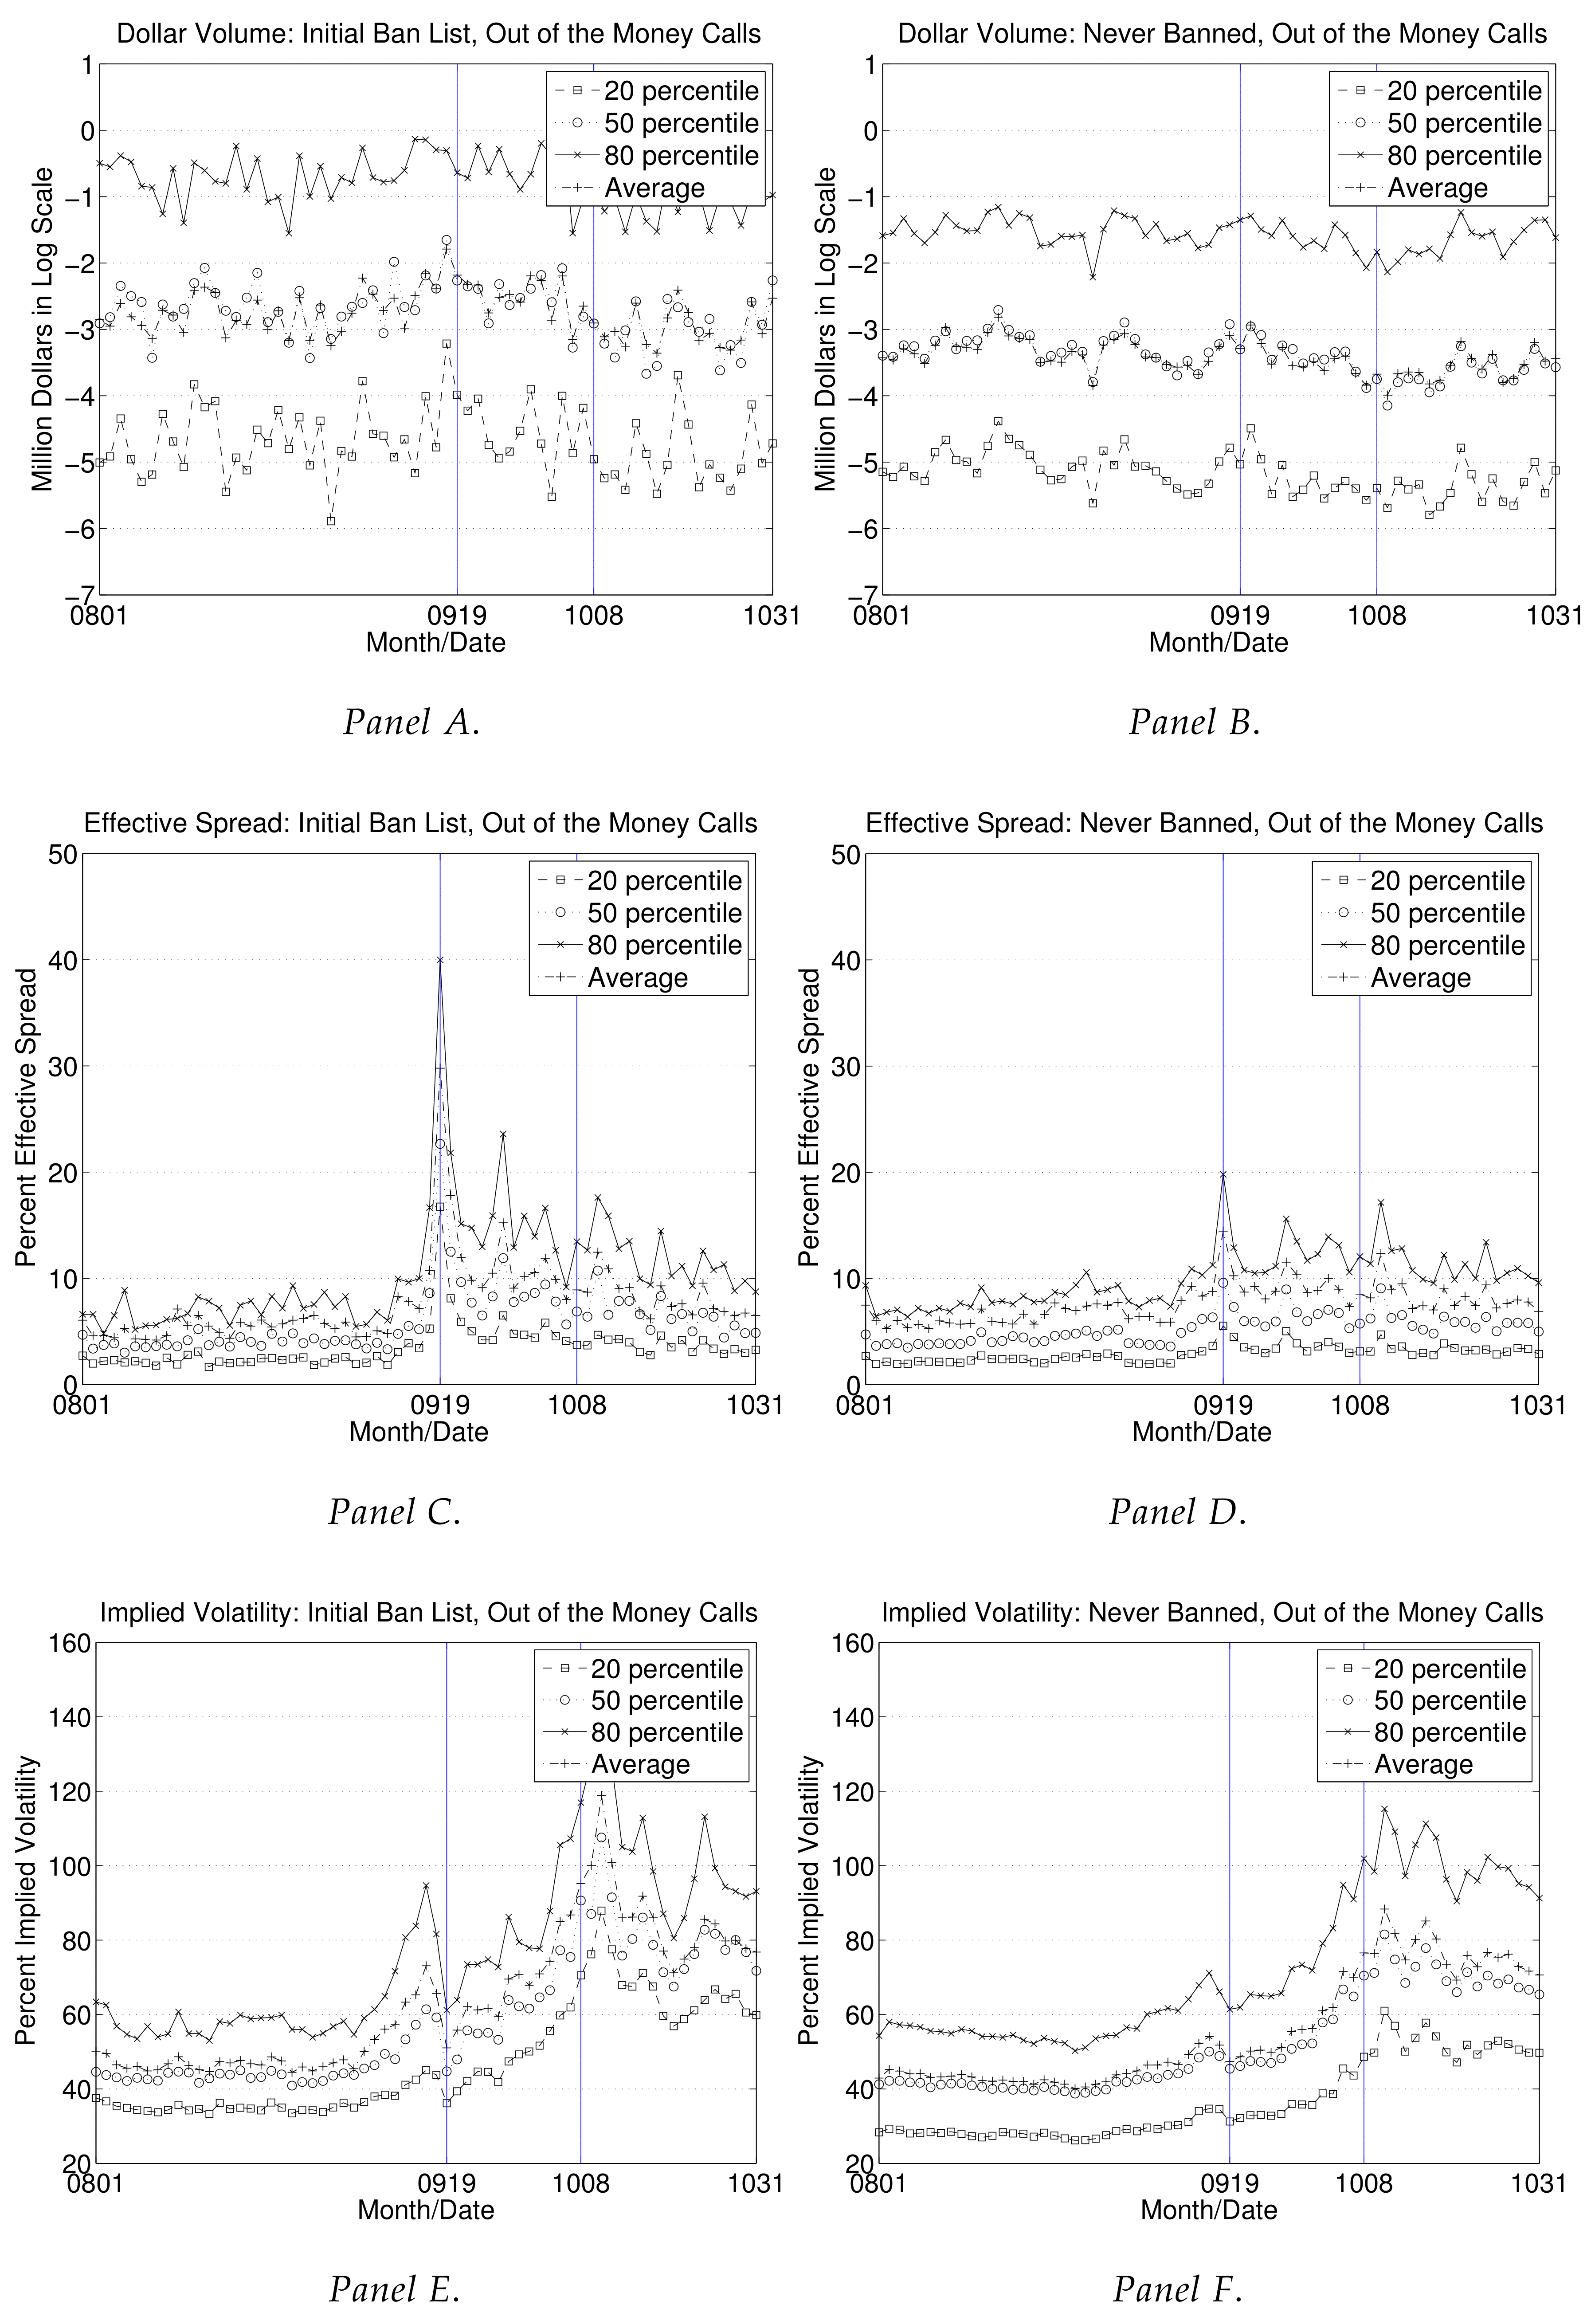
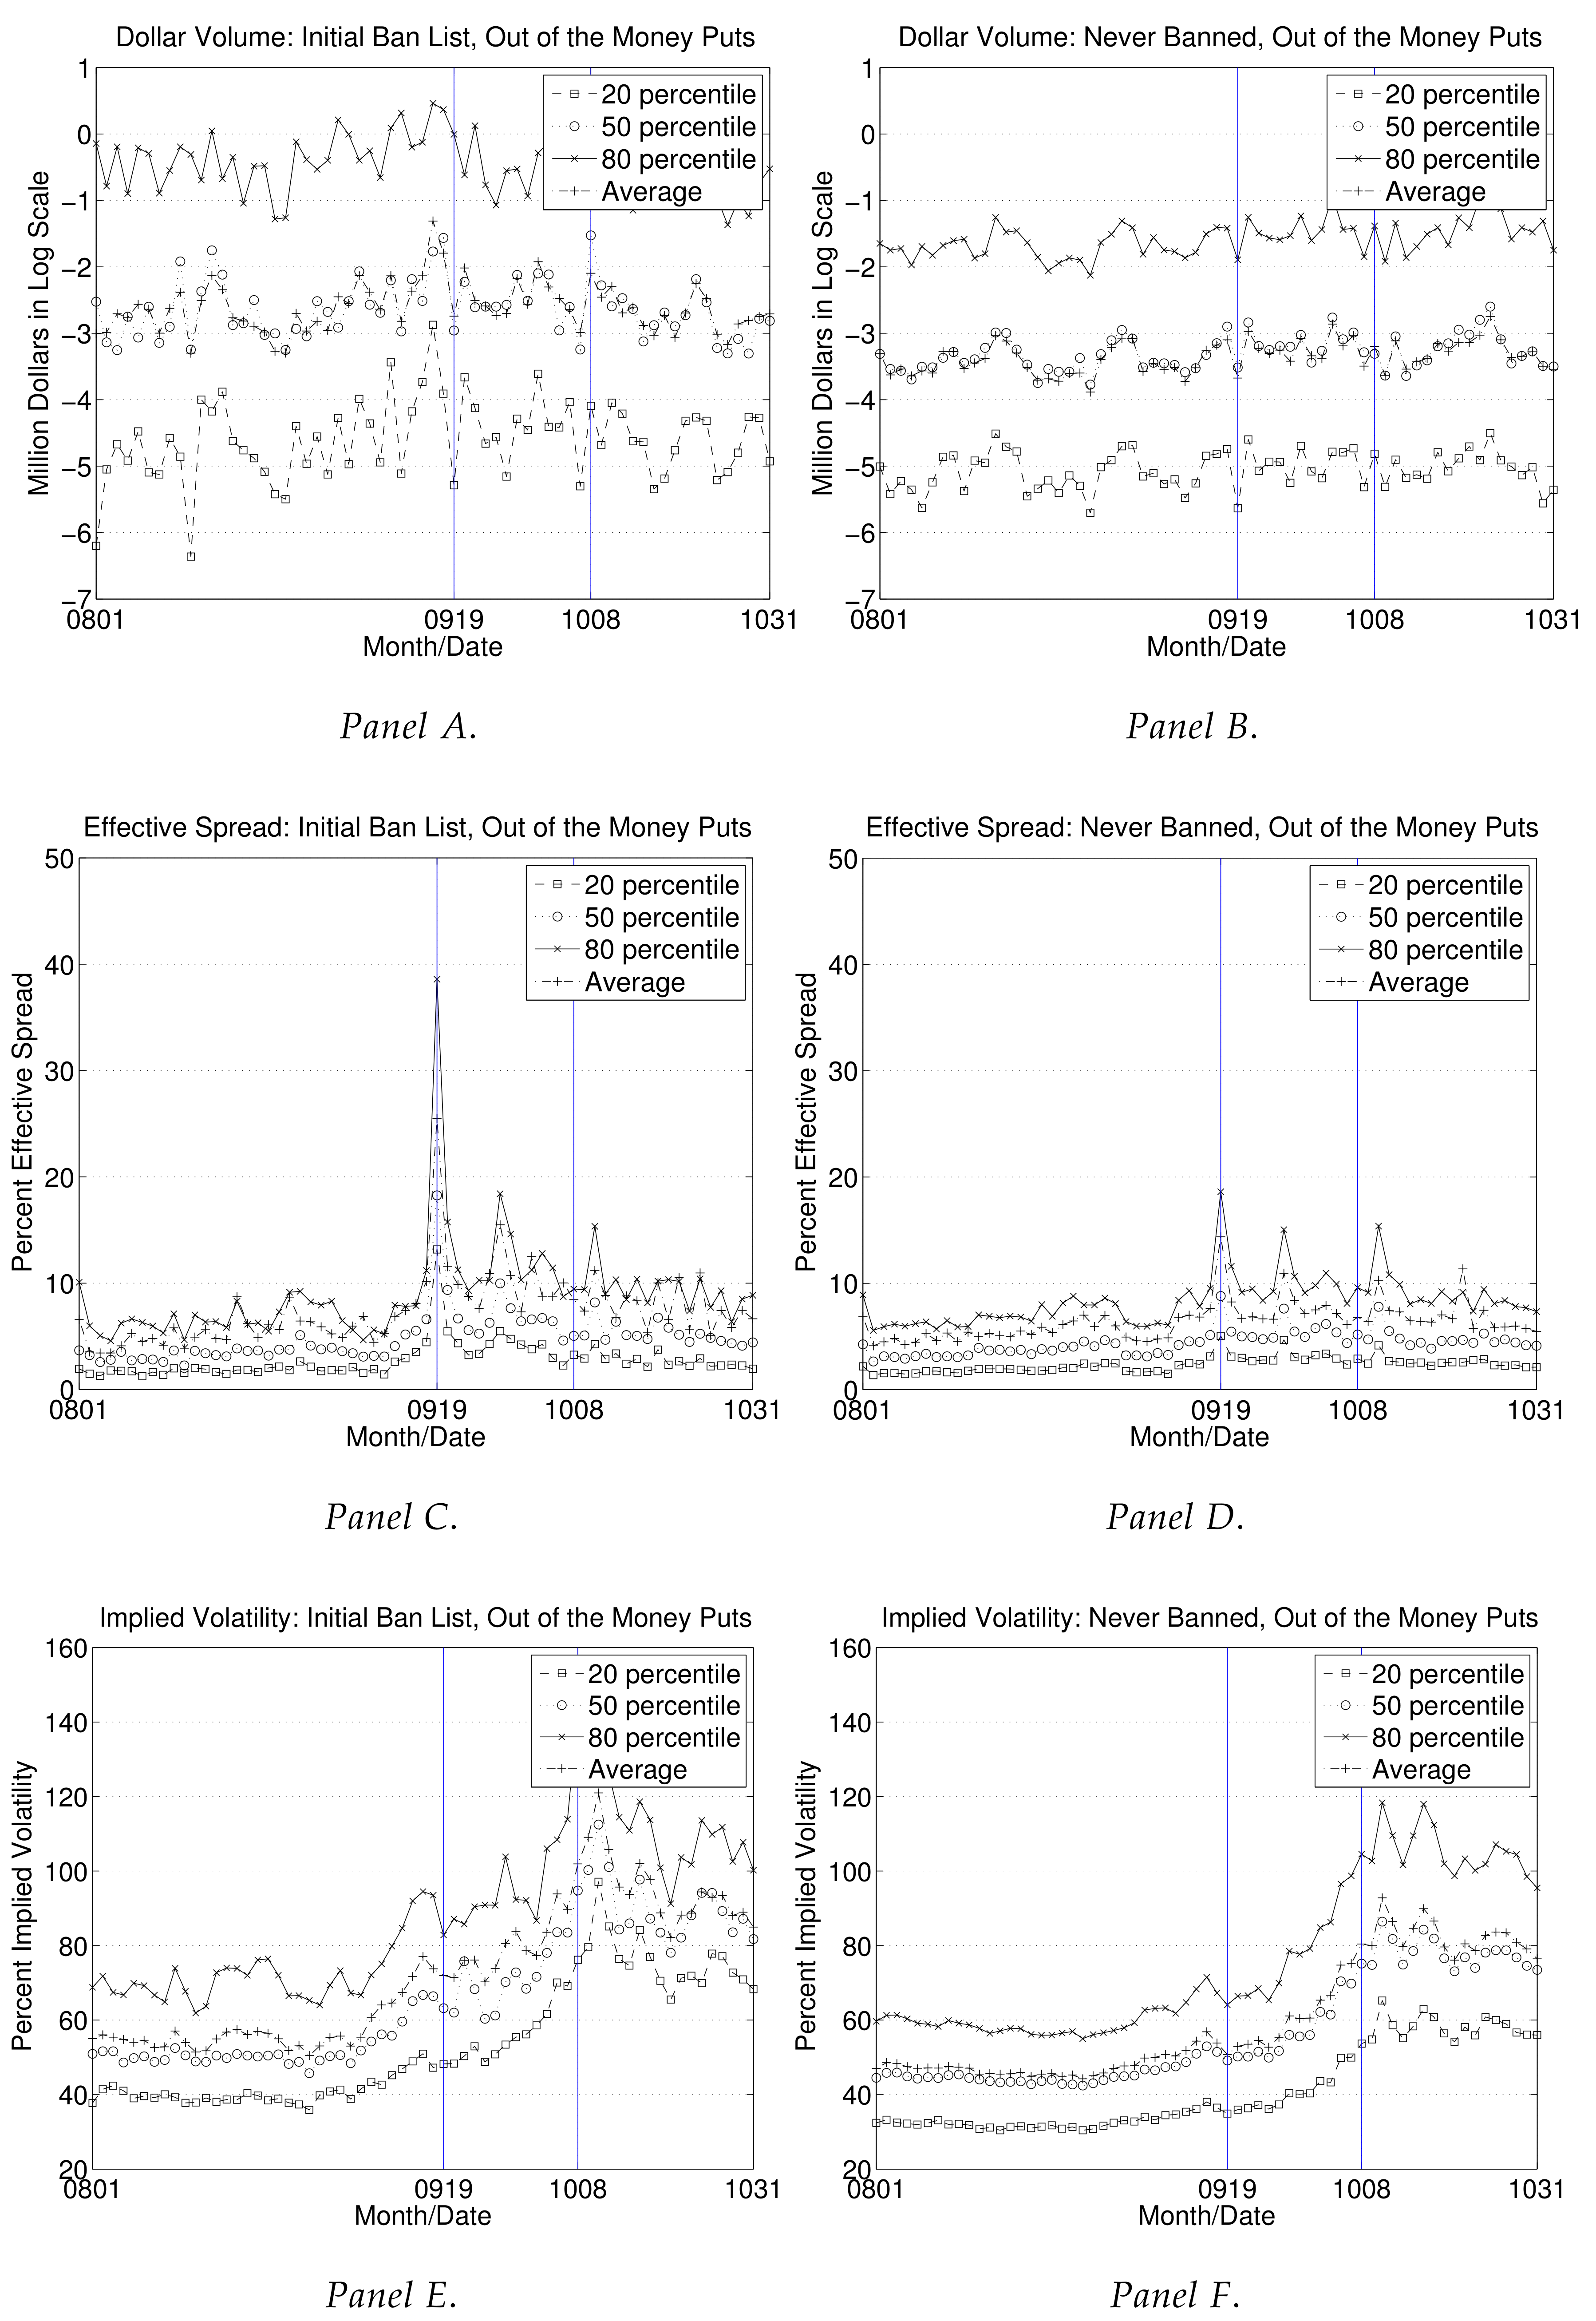
Table 4 reports the results for Out of the money options. Focusing on the relative effects reported in the last two columns of Table 4A for call options, all 12 variables increase and exhibit statistical significance. Spreads go up by slightly less than At the money call options. One reason might be that delta hedging a long position in an out of the money call position requires shorting less stock compared with an at the money option. Turning to the put option results reported in Table 4B, spreads, prices and implied volatilities go up and are statistically significant. Dollar volume is statistically insignificant. Spreads go up by about 3% and 2% (quoted and effective, respectively), prices by slightly less than 50 cents and implied volatilities by about 6%. When compared to the averages in the non-ban period, these magnitudes appear modest. Figure 5 and Figure 6 are the supporting figures for Out of the money calls and puts. It is hard to find a large difference in the way the ban affected the Out of the money call dollar volumes by considering Figure 5A,B. Figure 6A,B portrays a similar picture for the puts. Focusing on spreads, Figure 5C shows that on 19 September spreads skyrocketed for calls of the Initial Ban List stocks. Figure 5D shows that the spreads of the Never Banned Stocks were also affected in a similar way but the magnitudes are much smaller. Figure 6C,D reports the spreads for the put options. Comparing Figure 5C and Figure 6C, the size of the 19 September effect and the overall effect appears slightly smaller for puts than calls. Turning to the implied volatilities, Figure 5E,F and Figure 6E,F show that the impact is fairly similar to the impact for the At the money options (compare the same plots across Figure 3 and Figure 4 with Figure 5 and Figure 6). In particular, the Never Banned Stock option implied volatilities has an upward trend during the ban for calls and puts. For the Initial Ban List stocks, the upward trend flattens for the put options with the ban and drops initially then continues to increase for calls.
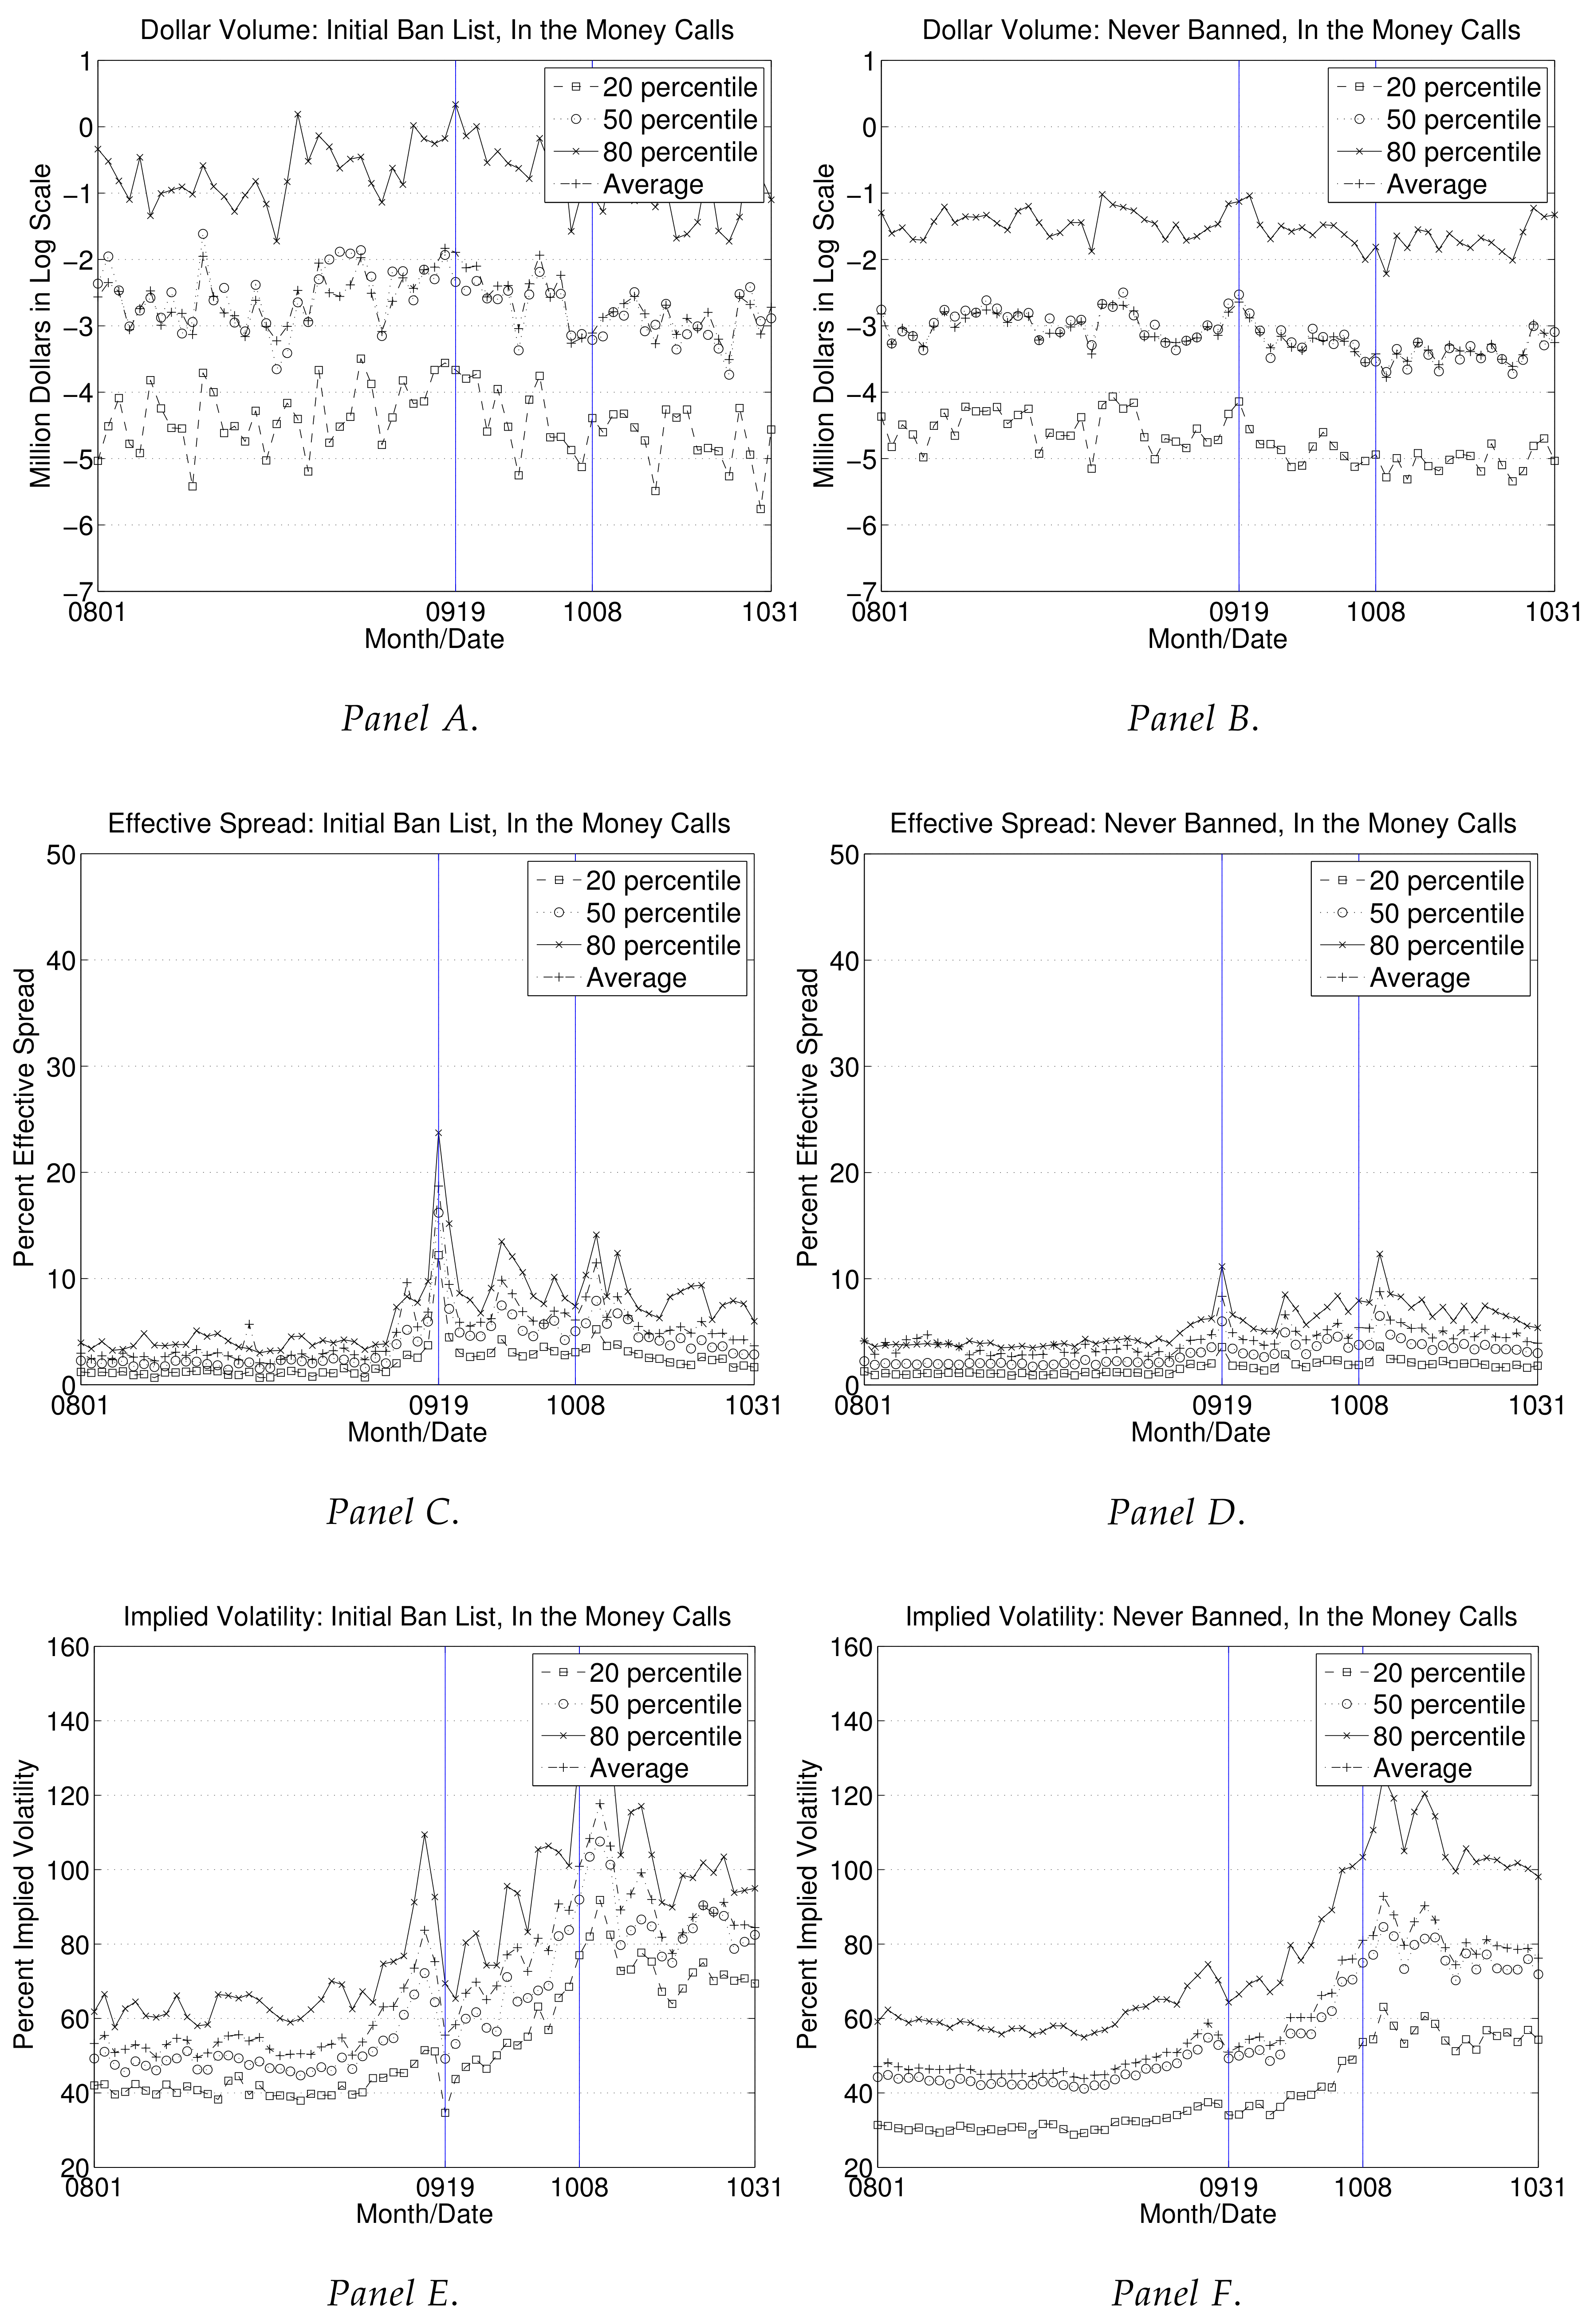
Table 5 focuses on In the money options. Focusing on the relative effects reported in the last two columns of Table 5A for call options, 11 out of the 12 variables (except for the size volume weighted implied volatility) increase and exhibit statistical and economic significance. Spreads go up by slightly more than At the money or Out of the money call options. One reason might be that delta hedging a long position in an In the money call position requires shorting more stock compared with Out or At the money calls. Turning to the results for put options in Table 5B, only the spreads, prices and implied volatilities go up and exhibit statistical significance, while size volume or dollar volume does not. Figure 7 and Figure 8 are the supporting figures. Figure 7C,D and Figure 8C,D show that spreads increased dramatically for the Initial Ban List stocks, more so for calls and also increased but in a much smaller way for the Never Banned Stocks. The drastic affect fast disappears after 19 September.
We next turn to the results that explore how the same twelve variables change during the ban period by means of a two way fixed effects specification introduced in Equation (6). The results are given in Table 6 and are very similar to the OLS regression results in Equation (5). In particular, the coefficient estimates in the regression Equation (5) are very similar to the coefficients in the regression Equation (6) (compare the estimates in Table 2, Table 3, Table 4 and Table 5 to the estimates reported in Table 6). For each of the twelve variables introduced earlier, coefficient estimates, , of the ban dummy, and the associated t-statistics are reported for All, At the money, Out of the money and In the money options. Standard errors are the usual OLS errors and the specification is estimated directly as a pooled OLS regression. Table 6A reports for calls and Table 6B reports for puts.
Focusing on All call options, strike-to-spot ratios between 0.9 and 1.1, 70 more trades happen and size volume goes up by 1370, dollar volume goes up by about half a million per day, spreads go up around 5.3% and 3.5% for quoted and effective spreads respectively. Whether the spread values are size volume weighted or dollar volume weighted makes little difference. Prices go up by about 28 cents and implied volatilities go up by 2.5%. All of these numbers can be interpreted as difference in difference values, relative values for the Initial Ban List stocks in relation to the Never banned and during the ban period relative to in the non-ban period. All the t-statistics are significant. Moreover, the t-statistic significance and the signs of the ban dummy coefficients remain the same turning to the At the money calls, Out of the money calls and In the money calls.
Turning to All put options (Table 6B), the results are similar in sign and in terms of statistical significance with the call options, although the number of trades, size volume and dollar volume coefficients are insignificant. Spreads go up around 3.05% and 2.28% for quoted and effective spreads respectively. Put prices go up by around fifty cents and implied volatilities by about 6%. The increase in implied volatility is much higher for puts than calls, indicative of the fact the put pricing for banned stocks were more effected by the ban. Similar to the call options, for the subset of variables that are significant for All put options, significances and coefficient magnitudes carry over to At, Out or In the money options. A notable aspect of the results is that the implied volatilities for Out of the money puts increase more than In the money puts (6.02% and 5.66% for dollar volume weighted implied volatilities, respectively, for Out and In the money), reinforcing the volatility skew in the market. A second notable aspect is how the dollar volume declines by about 0.110 million dollars per day for in the money puts. Since prices go up, this effect is linked to the lower size volume (negative but insignificant by itself).
Next, we turn to the option volume informativeness results. Several papers have explored the informativeness of option trading volume for future stock prices. Easley et al. (1998) using transaction level option trade data on the fifty most actively traded firms on the CBOE during a two-month period in 1990 and find that signed option volumes are informative when the contemporaneous volume is included in the regressions of stock returns on lagged signed volumes. This finding is consistent with a pooling equilibrium where there are informed traders in the options market. Volumes are signed as buyer or seller initiated using the algorithm in Lee and Ready (1991) but they use the live quote rather than the quote prevailing five seconds before the transaction, since quote revisions in the CBOE is less than five seconds.
To explore the informativeness of the option trading volume for stock prices during the ban period, we employ the regression Equation (7). The cross-sectional regression is run on a rolling minutely basis for a holding periods of 5, 10, 15 and 30 min and an estimation period of 30 min. The minutely cross-sectional regression coefficient s are calculated for each of the trading days during the ban and the non-ban periods. The standard errors are calculated using the Newey and West (1987) procedure with the number of lags as the sum of the minutes in the estimation and holding periods.
Table 7 reports the Fama and MacBeth (1973) coefficient estimates and standard error estimates. The table also reports the average number of stocks in the minutely rolling regressions in the non-ban and ban periods for calls and puts and for Initial Ban List stocks and Never Banned Stocks. In particular, Table 7A reports for the Initial Ban List stocks and Table 7B reports for the Never Banned Stocks. Table 7A and Table 7B report results for call and put options.
Notice that for the Initial Ban List stocks, for call options the average number of stocks in the minutely cross sectional regressions is 23 and 26 in the non-ban period and during the ban. For puts, the numbers are 20 and 21. This is because we start with 83 and 81 stocks for calls and puts in Table 1, which are in the Initial Ban List and for each minutely rolling regression use only the ones which has traded within the estimation period of 30 min. For the Never Banned Stocks, we end up using 161 and 176 stocks on average for calls in the non-ban period and during the ban periods. The numbers are 139 and 151, respectively, for puts. Again, we start with 834 and 748 stocks in Table 1 and focus on the ones that trade within the estimation period of 30 min in the minutely rolling regressions.
The main point of Table 7 is straightforward: put option net buy volume in the last 30 min predicts banned stock returns in the next 10, 15 and 30 min during the ban, statistically significant at the 10% level. With the exception of one, all other t-statistics are insignificant.7 We understand that the put volume becomes informative and relative abundance of buyer initiated put volume relative to seller initiated in the last 30 min means lower returns in the next 10, 15 and 30 min for the stocks. That is, during the ban period and for the Initial Ban List stocks, there is evidence for informed trading in the options markets which also supports the hypothesis of a pooled equilibrium in terms of where the informed traders trade. Moreover, of the 32 t-statistics reported in Table 7 for the estimation period, holding period and option type combinations, only four of them exhibit statistical significance which would be expected if there is no predicability. Since these predictive regressions can be interpreted as tests of Semistrong-Form market efficiency (Fama (1970); Roberts (n.d.)), our results suggest that the Semistrong-Form market efficiency is largely intact within the frame of specifications we employ. With the important exception just noted, the results are otherwise consistent with earlier studies such as Chan et al. (2002) and Easley et al. (1998), which found small predictive ability especially when no contemporaneous volume is included in the regressions.
Motivated by the strand of literature considering the relationship between the put–call parity and short-sales restrictions, we construct a measure of short sales violations during the shorting ban of financial stocks in 2008.
It is well known that, for American options on dividend paying stocks where the dividend is paid continuously, an arbitrage relationship is
The quantity, , should be greater or equal to zero if the put–call parity for a continuous dividend yield holds. As usual C is the call price, P is the put price, S is the stock price, q is the continuous dividend yield, and K is the strike price. q is the continuous dividend yield. Notice that to arbitrage away the violation, investors would short the stock. Thus, lower or negative values of the quantity would likely indicate shorting difficulties.
To explore the extent to which this inequality holds, we calculate the quantity for matched trades for call and puts for Initial Ban List and Never Banned Stocks and during the ban period and the non-ban period.
For each trading day, we pair put and call trades that happen in the same minute of the hour across their underlying stock, expiration date and exercise price and calculate the percentile values and the mean violation for that trading day. The mean is calculated equally weighted across matched trades. Table 8 reports the average of the percentile values and the means across the trading days during the ban and in the non-ban period. t-statistics are reported for testing if the across the trading days average means are the same for the Initial Ban List and Never Banned Stock option trades. The table also reports the average number of matched trade pairs and the number of underlying stocks across the trading days during the ban and in the non-ban period. All options considered have strike-to-spot ratios in between 0.9 and 1.1, time to expirations of between 15 and 360 days and all values are calculated for the common set of underlying stocks (across calls and puts) for the Never Banned and Initial Ban List stocks described in Table 1. The dividend yields for individual stocks are calculated using holding period returns with and without dividends using the 12 monthly returns from August 2007 to July 2008 available from the CRSP. We use actual trade prices for calls and puts and the quote midpoint for the underlying stock price.
We report the percentile values as well as the means, first calculated per day then averaged across trading days. Considering the non-ban period, the 20th percentile value for Never Banned Stocks is 0.05 cents, meaning that the violations are likely existent for less than 20 percent of the sample stocks. On the other hand, for Initial Ban List stocks, the percentile value is 7.22 cents (negative) meaning that the violations are likely existent for more than 20 percent of the sample stocks. During the ban period, all percentile values drop, but much more so for the Initial Ban List stocks. For example, for the Initial Ban List stocks the 20th percentile value is now 24.14 cents (negative) and 0.32 cents (negative) for Never Banned. During the ban period, the percentile values indicate that violations likely exist for more than 40 percent of all Initial Ban List stocks and more than 20 percent of Never Banned Stocks. That is, violations increase during the ban period for Initial Ban List and Never Banned Stocks. A simple t-test for whether the daily means have the same average value across trading days during the ban and the non-ban periods reveals a t-statistic of 2.16 for the Initial Ban List stocks, meaning the average is significantly higher during the non-ban period compared to the ban period. The corresponding t-statistic of 1.26 for the Never Banned Stocks show that, while the average is higher during the non-ban period compared to the ban period, the difference appears statistically insignificant. The bottom line of Table 8 is that, during the ban period, while violations significantly increased for Initial Ban List stocks, it stayed roughly the same for Never Banned Stocks.
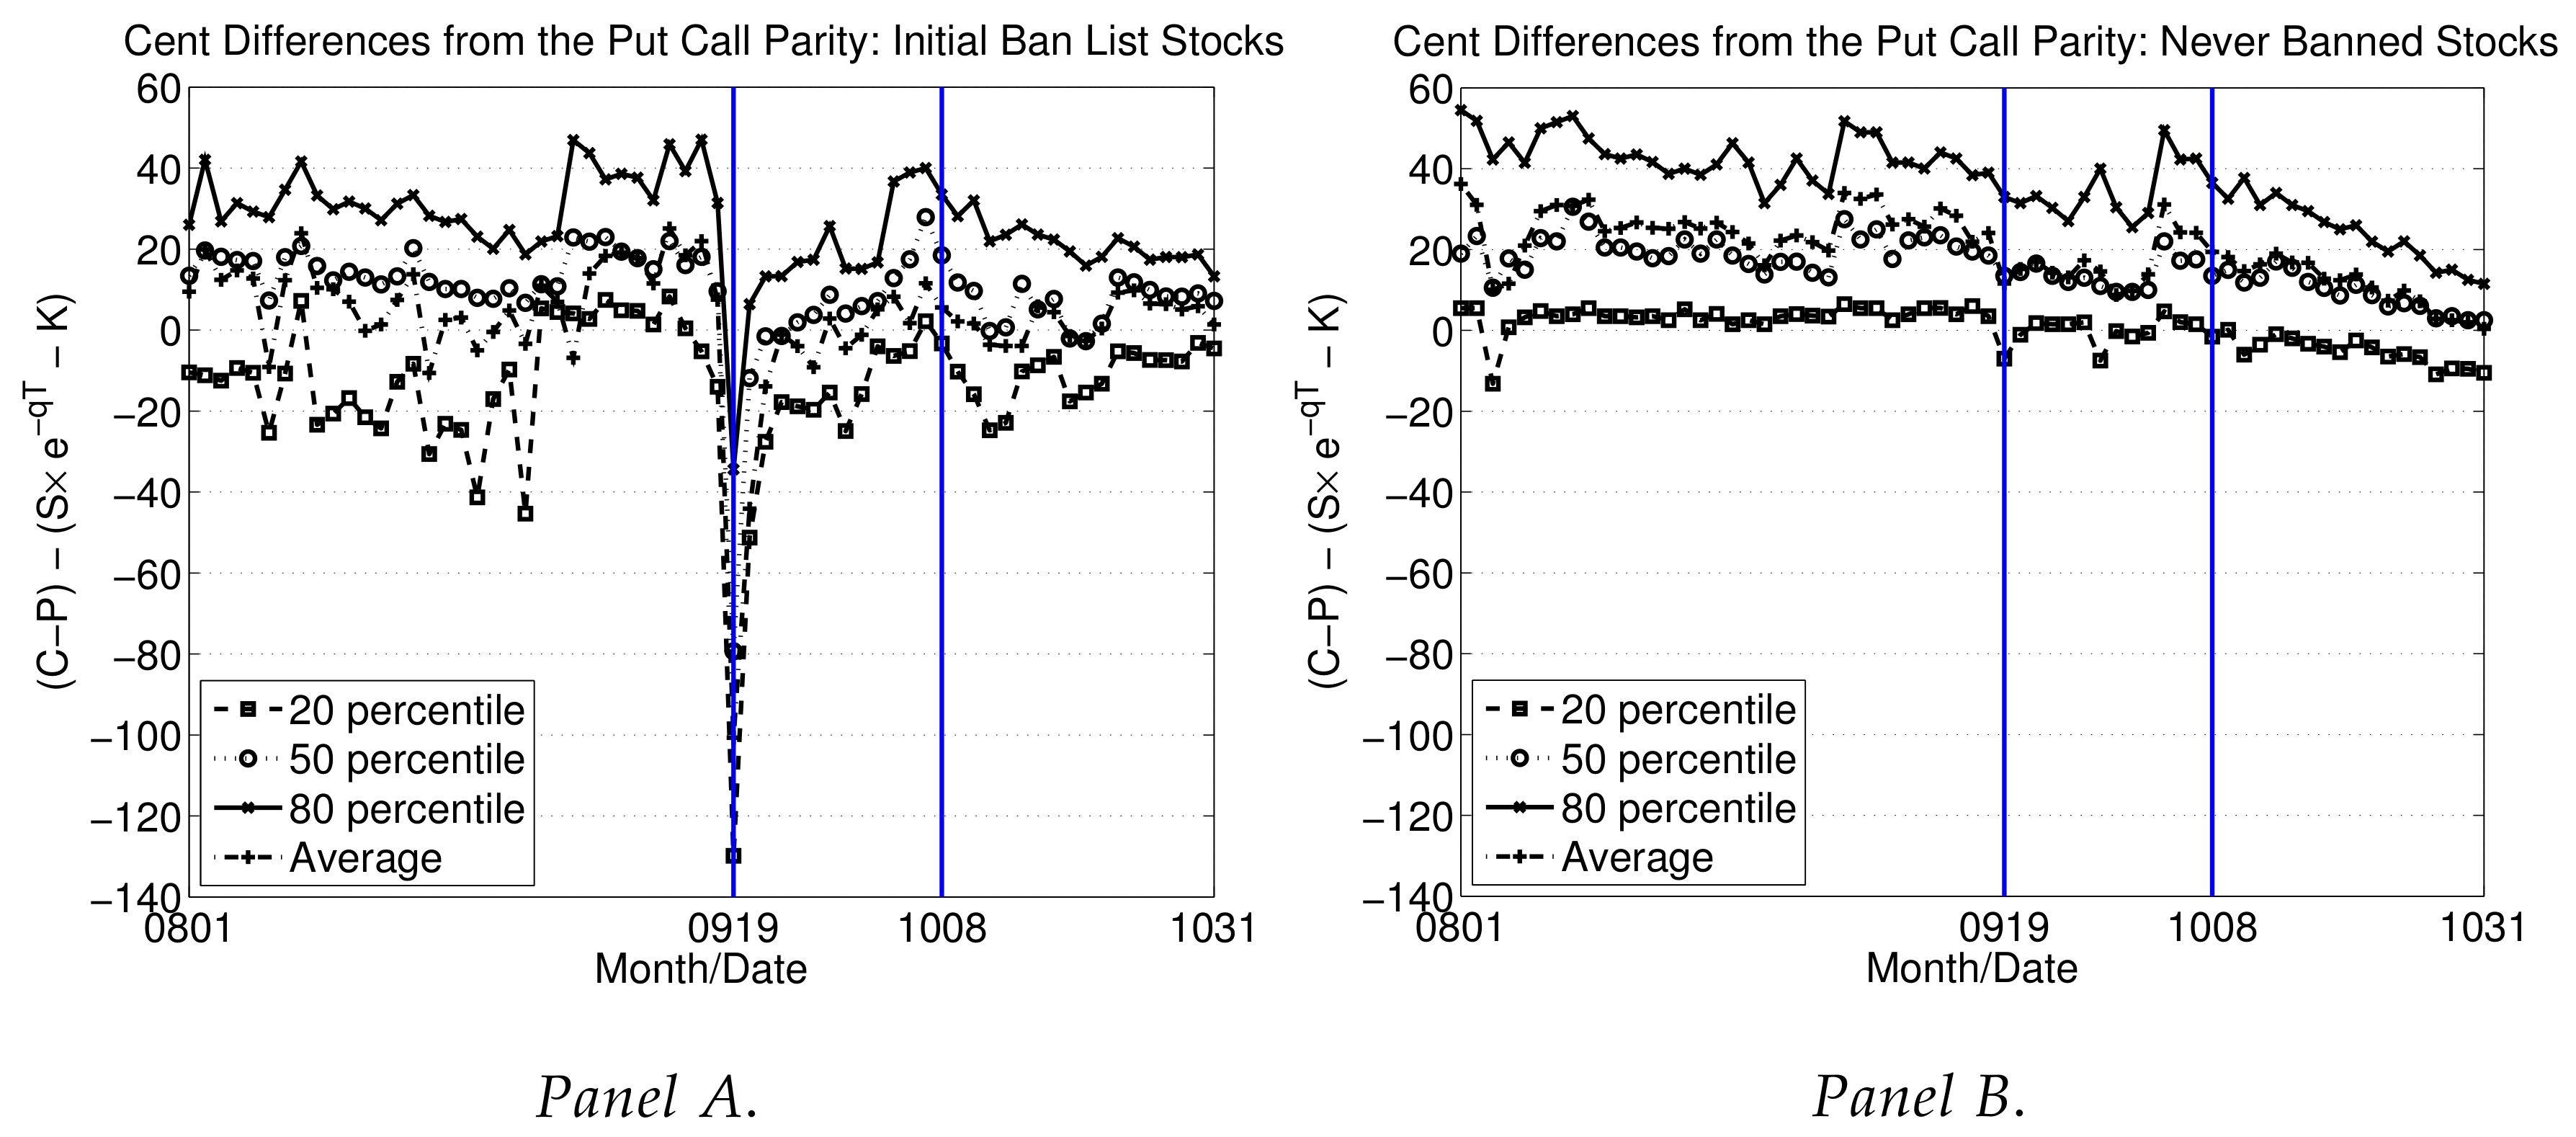
Figure 9 plots the 20th, 50th and 80th percentile values as well as the cross sectional means of the quantity, , from August 1st to October 31st 2008 in cents for each trading day. Figure 9A plots for Initial Ban List stocks, while Figure 9B plots for the Never Banned Stocks. Visually, it is easy to notice that for Never Banned Stocks, while the percentile values and means run positive and flat from 1 August tol the end of the ban on 8 October 2008, with the calming of the market after then end of the ban all head towards closer to zero. For the Initial Ban List stocks, on the other hand, with the first day of trading during the ban, 19 September, there is a big move towards the negative territory indicative of violations. In the following days, the values recover towards the positive territory rapidly though stay remarkably lower during the ban period compared to before the ban. After the ban period, similar to Never Banned Stocks, the percentile values and the mean heads closer towards zero. The big drop on 19 September (Friday) is likely because this is a day where option market makers thought they would never be able to short again, while ex-post they were allowed to by a special extension by the SEC with an order released during that weekend. The 19 September outlier and swift recovery in the aftermath makes it hard to generalize the violations to the duration of the ban.
5. Robustness
The restriction to have option trades on at least half of the 42 trading days considered can be considered too lax. If the constraint is made more stringent requiring stocks to have options that trade every trading day, then the sample size is reduced. In that case, we have, for All options, 33 and 238 (29 and 225) for call (put) options for the Initial Ban List and Never Banned Stocks, respectively. Unreported results available from the authors presents all tables of the main body of the paper, but recalculated, for the smaller sets of stocks resulting from the additional constraint. Comparing the results across the tables, we establish that the results presented in this paper are robust to using the smaller sample of stocks.
6. Conclusions
The Securities and Exchange Commission’s September 2008 emergency order surprised the market with a near complete shorting ban of some 800 financials traded in the US. While there is some work considering the affect of the ban on stocks, such as Boehmer et al. (2013) and Barclay et al. (2008), the impact on the equity options market is a lot less studied.
We have three main findings. First, during the ban period, banned stock effective and quoted option spreads increase as well as the Black and Scholes (1973) and Merton (1973) volatilities and prices relative to non-banned stocks. Second, in predictive intraday regressions of future stock returns on lagged signed option trading volume, we find that option volume becomes informative during the ban for the banned stocks. Third, our measure of the violation of American stock put–call parity exhibits a significant increase during the ban period and only for banned stocks. Nevertheless, the economic magnitude and statistical insignificance of some of our findings suggest that the impact on the equity options market is likely less pronounced than initially thought.
We implement a two way fixed effects methodology to understand how option volumes, spreads and pricing statistics change using some 12 variables. We focus on changes in the variables for the Initial Ban List stocks, during the ban relative to the non-ban period and Never Banned Stocks. Focusing on call options with strike to spot ratios between 0.9 and 1.1, there were about 70 more trades, 1370 more size volume, about half a million more dollar volume per underlying per day. These quantities are over and above the non-ban period averages of 109 (trades), 2021 (size volume) and 0.7 million dollars (dollar volume), therefore represent economically important increases in trading volume for the call options market. All three changes are statistically significant. Moreover, call spreads go up by three and five percent (effective and quoted spreads, respectively). These values are over and above the 9 and 16 percent averages during the non-ban period, and therefore can be thought of as rather moderate. Call prices go up by about 28 cents and implied volatilities by about 2.5 percent. Turning to the put options, the number of trades, size and dollar volume measure changes are statistically insignificant and appear economically small. Spreads increase by two and three percent (effective and quoted spreads, respectively). The spread increases are over and above the 8 and 14 percent averages during the non-ban period and in this sense can be thought of as moderate. Put option prices go up by about fifty cents and implied volatilities by some six percent.
In our second set of results, we explore the informativeness of the option trading volume for stock prices during the ban period by means of an intraday regression equation. The cross section of intraday future stock returns is on the left hand side and the historical log of the ratio of the buyer to seller initiated dollar option trade volume is on the right hand side of the regression. The cross-sectional regression is run on a rolling minutely basis for a future stock holding periods of 5, 10, 15 and 30 min and historical option volume calculation period of 30 min. We find that put option relative buy volume negatively predicts future returns during the ban. We are unable to detect any predictability during the non-ban period or using the call option signed relative volumes.
Finally, we consider the violations of the American put–call parity which can be arbitraged away by shorting the physical stock. Using matched pairs of trades, we find that only for the Initial Ban List stocks there is a marked increase in the magnitude of the violations during the ban period, consistent with the shorting difficulties with these stocks. However, violations are concentrated on 19 September, which makes it hard to generalize the violations to the entire ban period.
Acknowledgments
The authors would like to thank Ren Raw Chen, Yuewu Xu, colleagues at the Fordham Graduate School of Business, Finance Department and the workshop participants at the Rising Stars Conference, Lally School of Business, RPI for the helpful comments and suggestions.
Author Contributions
The authors contributed equally to this work.
Conflicts of Interest
The authors declare no conflict of interest.
References
- Avellaneda, Marco, and Mike Lipkin. 2009. A dynamic model for hard-to-borrow stocks. Risk 22: 92–97. [Google Scholar]
- Barclay, Michael J., Terrence Hendershott, and Charles M. Jones. 2008. Order consolidation, price efficiency, and extreme liquidity shocks. Journal of Financial and Quantitative Analysis 43: 93–122. [Google Scholar] [CrossRef]
- Battalio, Robert H., and Paul H. Schultz. 2011. Regulatory Uncertainty and Market Liquidity: The 2008 Short Sale Ban’s Impact on Equity Option Markets. Journal of Finance 66: 2013–53. [Google Scholar] [CrossRef]
- Black, Fischer, and Myron Scholes. 1973. The pricing of options and corporate liabilities. Journal of Political Economy 81: 637–54. [Google Scholar] [CrossRef]
- Boehmer, Ekkehart, Charles M. Jones, and Xiaoyan Zhang. 2013. Shackling Short Sellers: The 2008 Shorting Ban. The Review of Financial Studies 26: 1363–400. [Google Scholar] [CrossRef]
- Cao, Charles, and Jing-Zhi Huang. 2007. Determinants of S&P 500 index option returns. Review of Derivatives Research 10: 1–38. [Google Scholar]
- Chan, Kalok, Y. Peter Chung, and Wai-Ming Fong. 2002. The informational role of stock and option volume. The Review of Financial Studies 4: 1049–75. [Google Scholar] [CrossRef]
- Cremers, Martijn, and David Weinbaum. 2010. Deviations from Put-Call Parity and Stock Return Predictability. Journal of Financial and Quantitative Analysis 45: 335–67. [Google Scholar] [CrossRef]
- Easley, David, Maureen O’Hara, and Padaki Srinivas. 1998. Option volume and stock prices: Evidence where informed traders trade. The Journal of Finance 53: 431–65. [Google Scholar] [CrossRef]
- Fama, Eugene F. 1970. Efficient capital markets: A review of theory and empirical work. The Journal of Finance 25: 383–417. [Google Scholar] [CrossRef]
- Fama, Eugene F., and James D. MacBeth. 1973. Risk return and equilibrium: Empirical tests. Journal of Political Economy 71: 607–36. [Google Scholar] [CrossRef]
- Grundy, Bruce D., Bryan Lim, and Patrick Verwijmeren. 2012. Do option markets undo restrictions on short sales? Evidence from the 2008 short sale ban. Journal of Financial Economics 106: 331–48. [Google Scholar] [CrossRef]
- Harris, Lawrence, Ethan Namvar, and Blake Phillips. 2013. Price inflation and wealth transfer during the 2008 SEC short sale ban. Journal of Investment Management 11: 1–23. [Google Scholar] [CrossRef]
- Hasan, Iftekhar, Nadia Massoud, Anthony Saunders, and Keke Song. 2010. Should Short-Selling be Restricted During a Financial Crisis? Available online: https://ssrn.com/abstract=1572106 (accessed on 3 March 2018).
- Jones, Charles M. 2012. Shorting Restrictions: Revisiting the 1930s. Financial Review 47: 1–35. [Google Scholar] [CrossRef]
- Kolasinksi, Adam C., Adam V. Reed, and Jacob R. Thornock. 2009. Prohibitions versus constraints: The 2008 short sales regulations. SSRN Electronic Journal. [Google Scholar] [CrossRef]
- Lee, Charles M. C., and Mark J. Ready. 1991. Inferring trade direction from intraday data. The Journal of Finance 46: 733–46. [Google Scholar] [CrossRef]
- Ma, Guiyuan, and Song-Ping Zhu. 2017. Pricing American call options under a hard-to-borrow stock model. European Journal of Applied Mathematics, 1–21. [Google Scholar] [CrossRef]
- Merton, Robert C. 1973. Theory of rational option pricing. Bell Journal of Economics and Management Science 4: 141–83. [Google Scholar] [CrossRef]
- Newey, Whitney K., and Kenneth D. West. 1987. A simple, positive semi-definite, heteroskedasticity and autocorrelation consistent covariance matrix. Econometrica 55: 703–8. [Google Scholar] [CrossRef]
- Ofek, Eli, Matthew Richardson, and Robert F. Whitelaw. 2004. Limited arbitrage and short sales restrictions: Evidence from the options markets. Journal of Financial Economics 74: 305–42. [Google Scholar] [CrossRef]
- Ross, Stephen A. 1976. Options and efficiency. Quarterly Journal of Economics 90: 75–89. [Google Scholar] [CrossRef]
- Roberts, H. Statistical Versus Clinical Predication of the Stock Market. University of Chicago, Chicago, IL, USA: Center for Research in Security Prices, Unpublished Working Paper.
| 1. | Hasan et al. (2010) found that during the ban financial stock shorting activity was mostly concentrated on the stocks with heavy subprime and credit risk exposures, thus can be thought of as a rational response rather than speculation. They argued therefore that the shorting ban likely obstructed the market’s disciplinary forces. |
| 2. | |
| 3. | Cao and Huang (2007) provided recent evidence that options are not redundant by means of a spanning result for in the money options. |
| 4. | Grundy et al. (2012), using daily closing options data, provided corroborating results and argued that options spreads increased and put volumes did not increase. |
| 5. | We are grateful to the referee for making this point. |
| 6. | Following Easley et al. (1998), we directly use the live quote rather than quote prevailing five seconds before the transaction (see, for example, Lee and Ready (1991)), since quote revisions in the CBOE is less than five seconds. |
| 7. | The only significant coefficient is for call options of the Initial Ban List stocks when the estimation and holding periods are both 30 min. |
Figure 1.
Time series of cross sectional options summary statistics. All call options of Initial Ban List and Never Banned Stocks during the ban and non-ban periods: (A,C,E) results for the three variables for Initial Ban List Stocks; and (B,D,F) results for the three variables for Never Banned stocks.
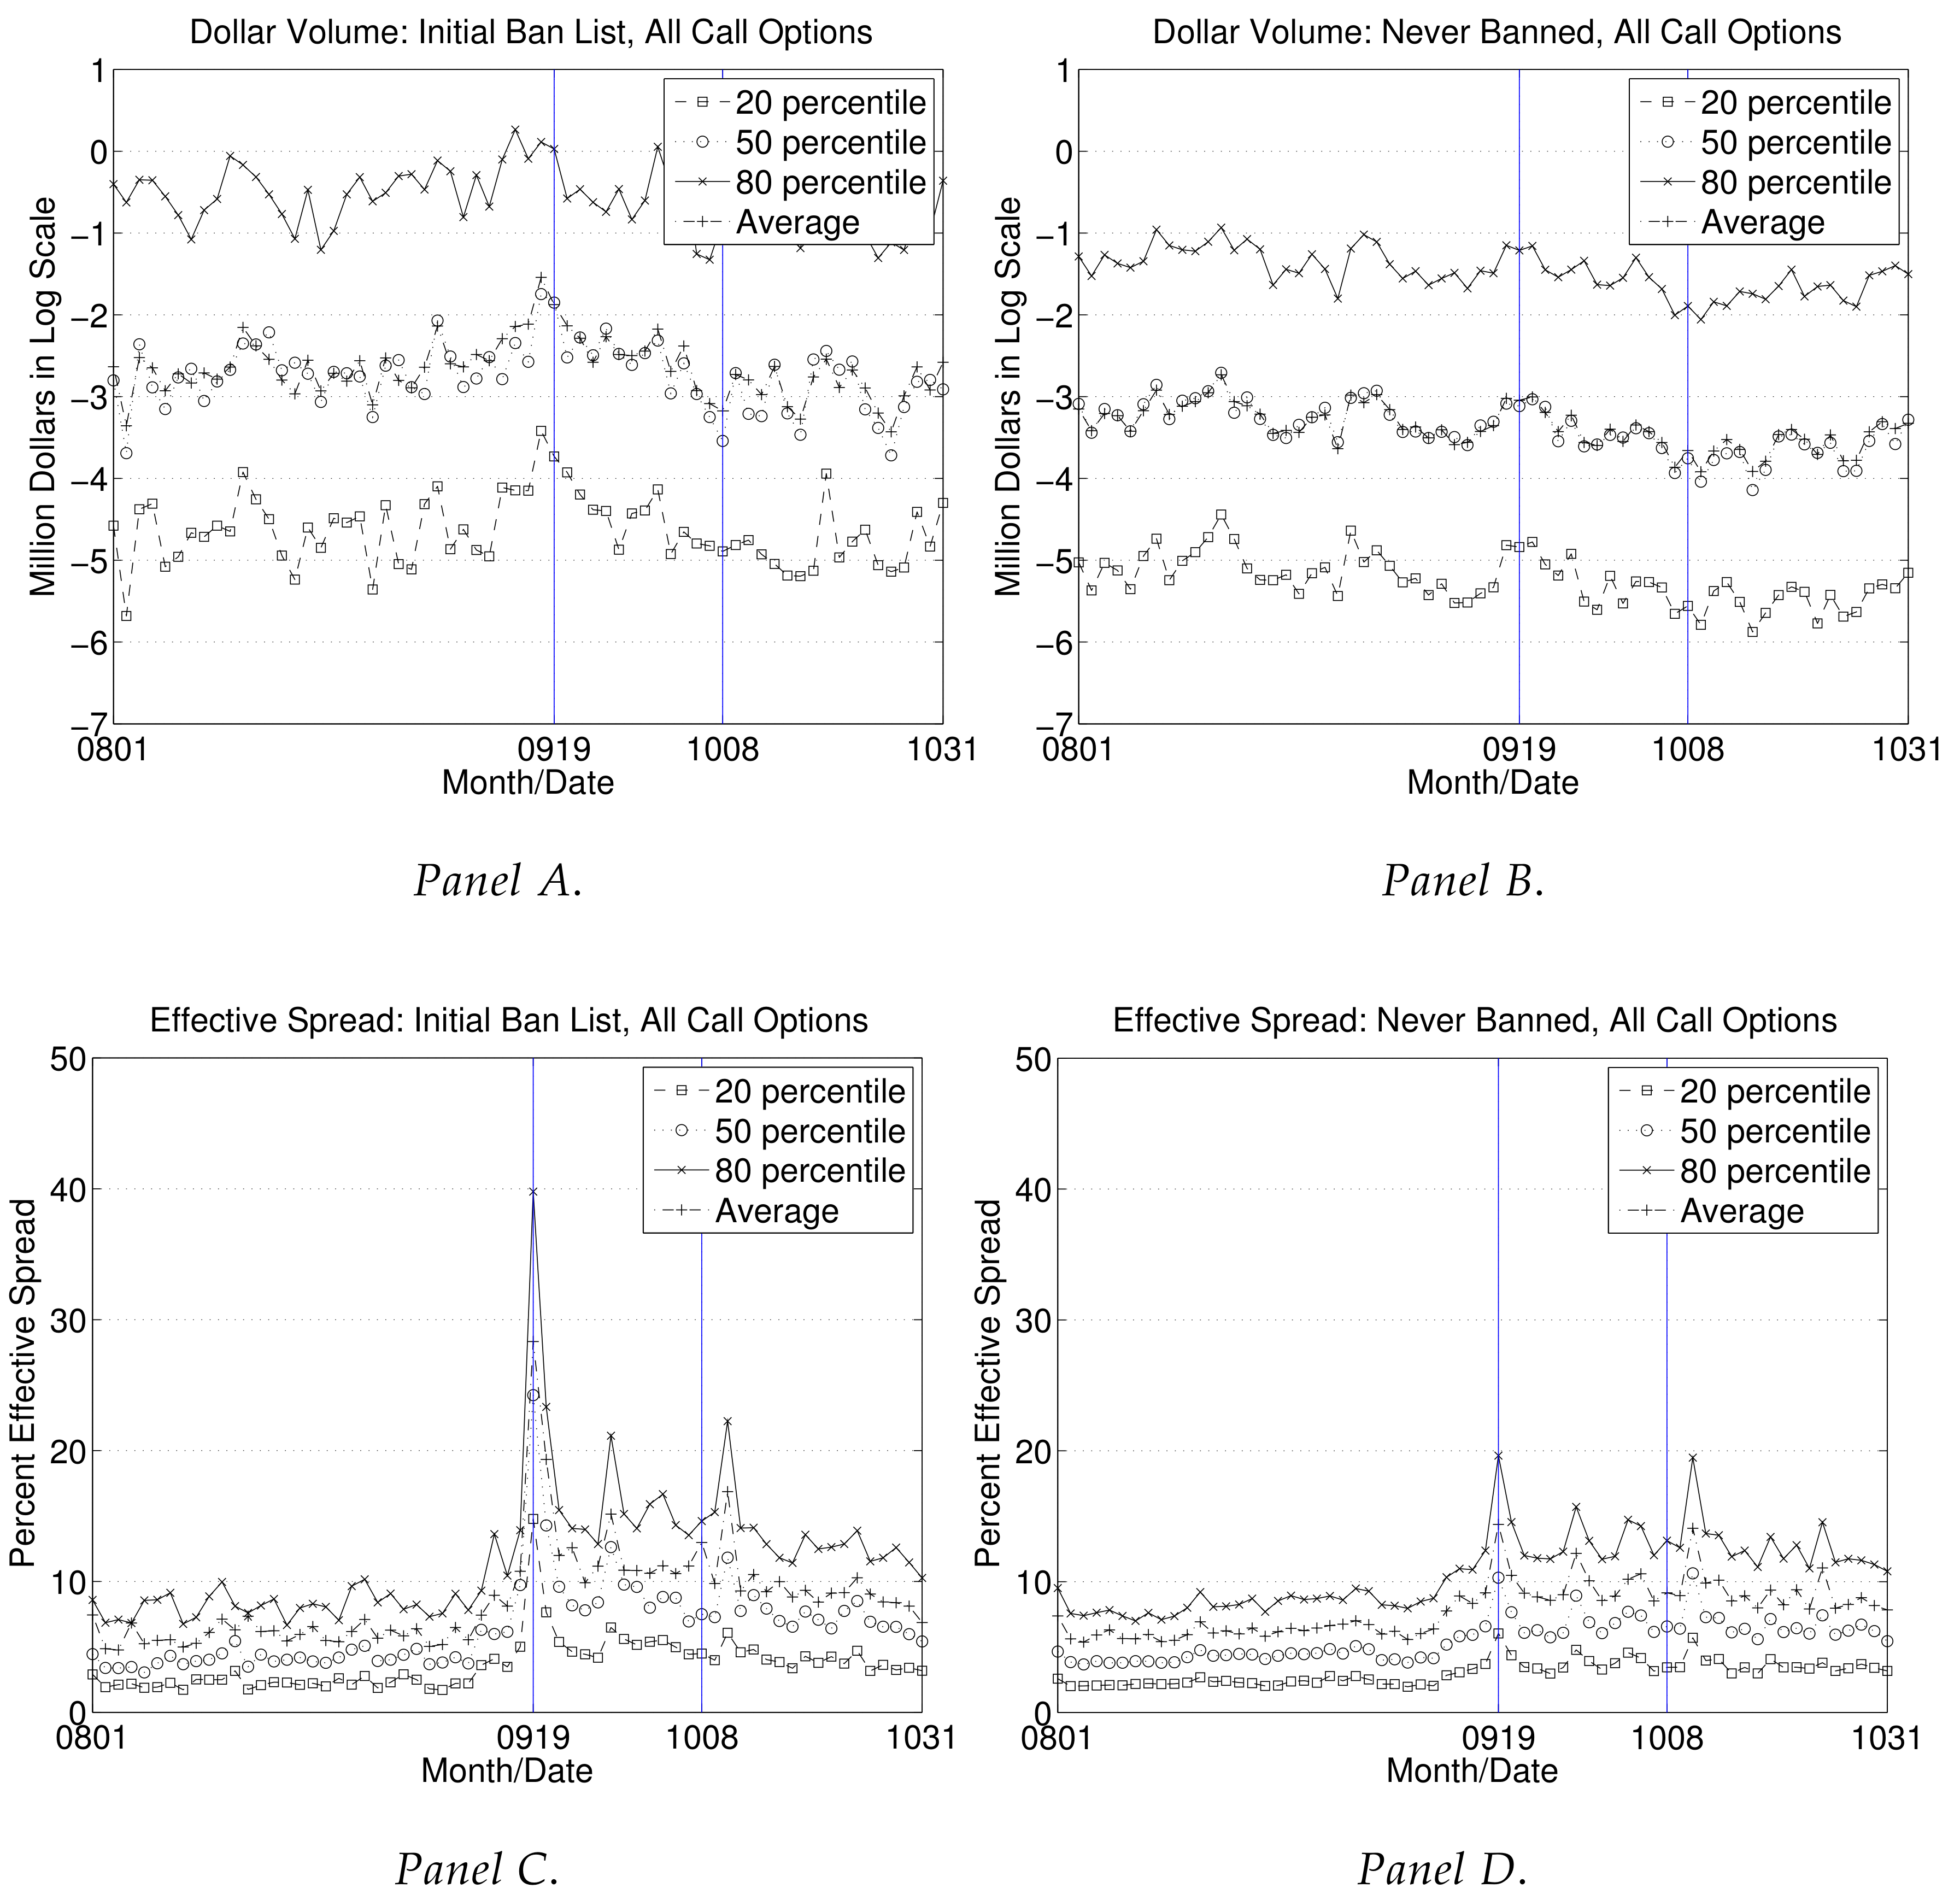
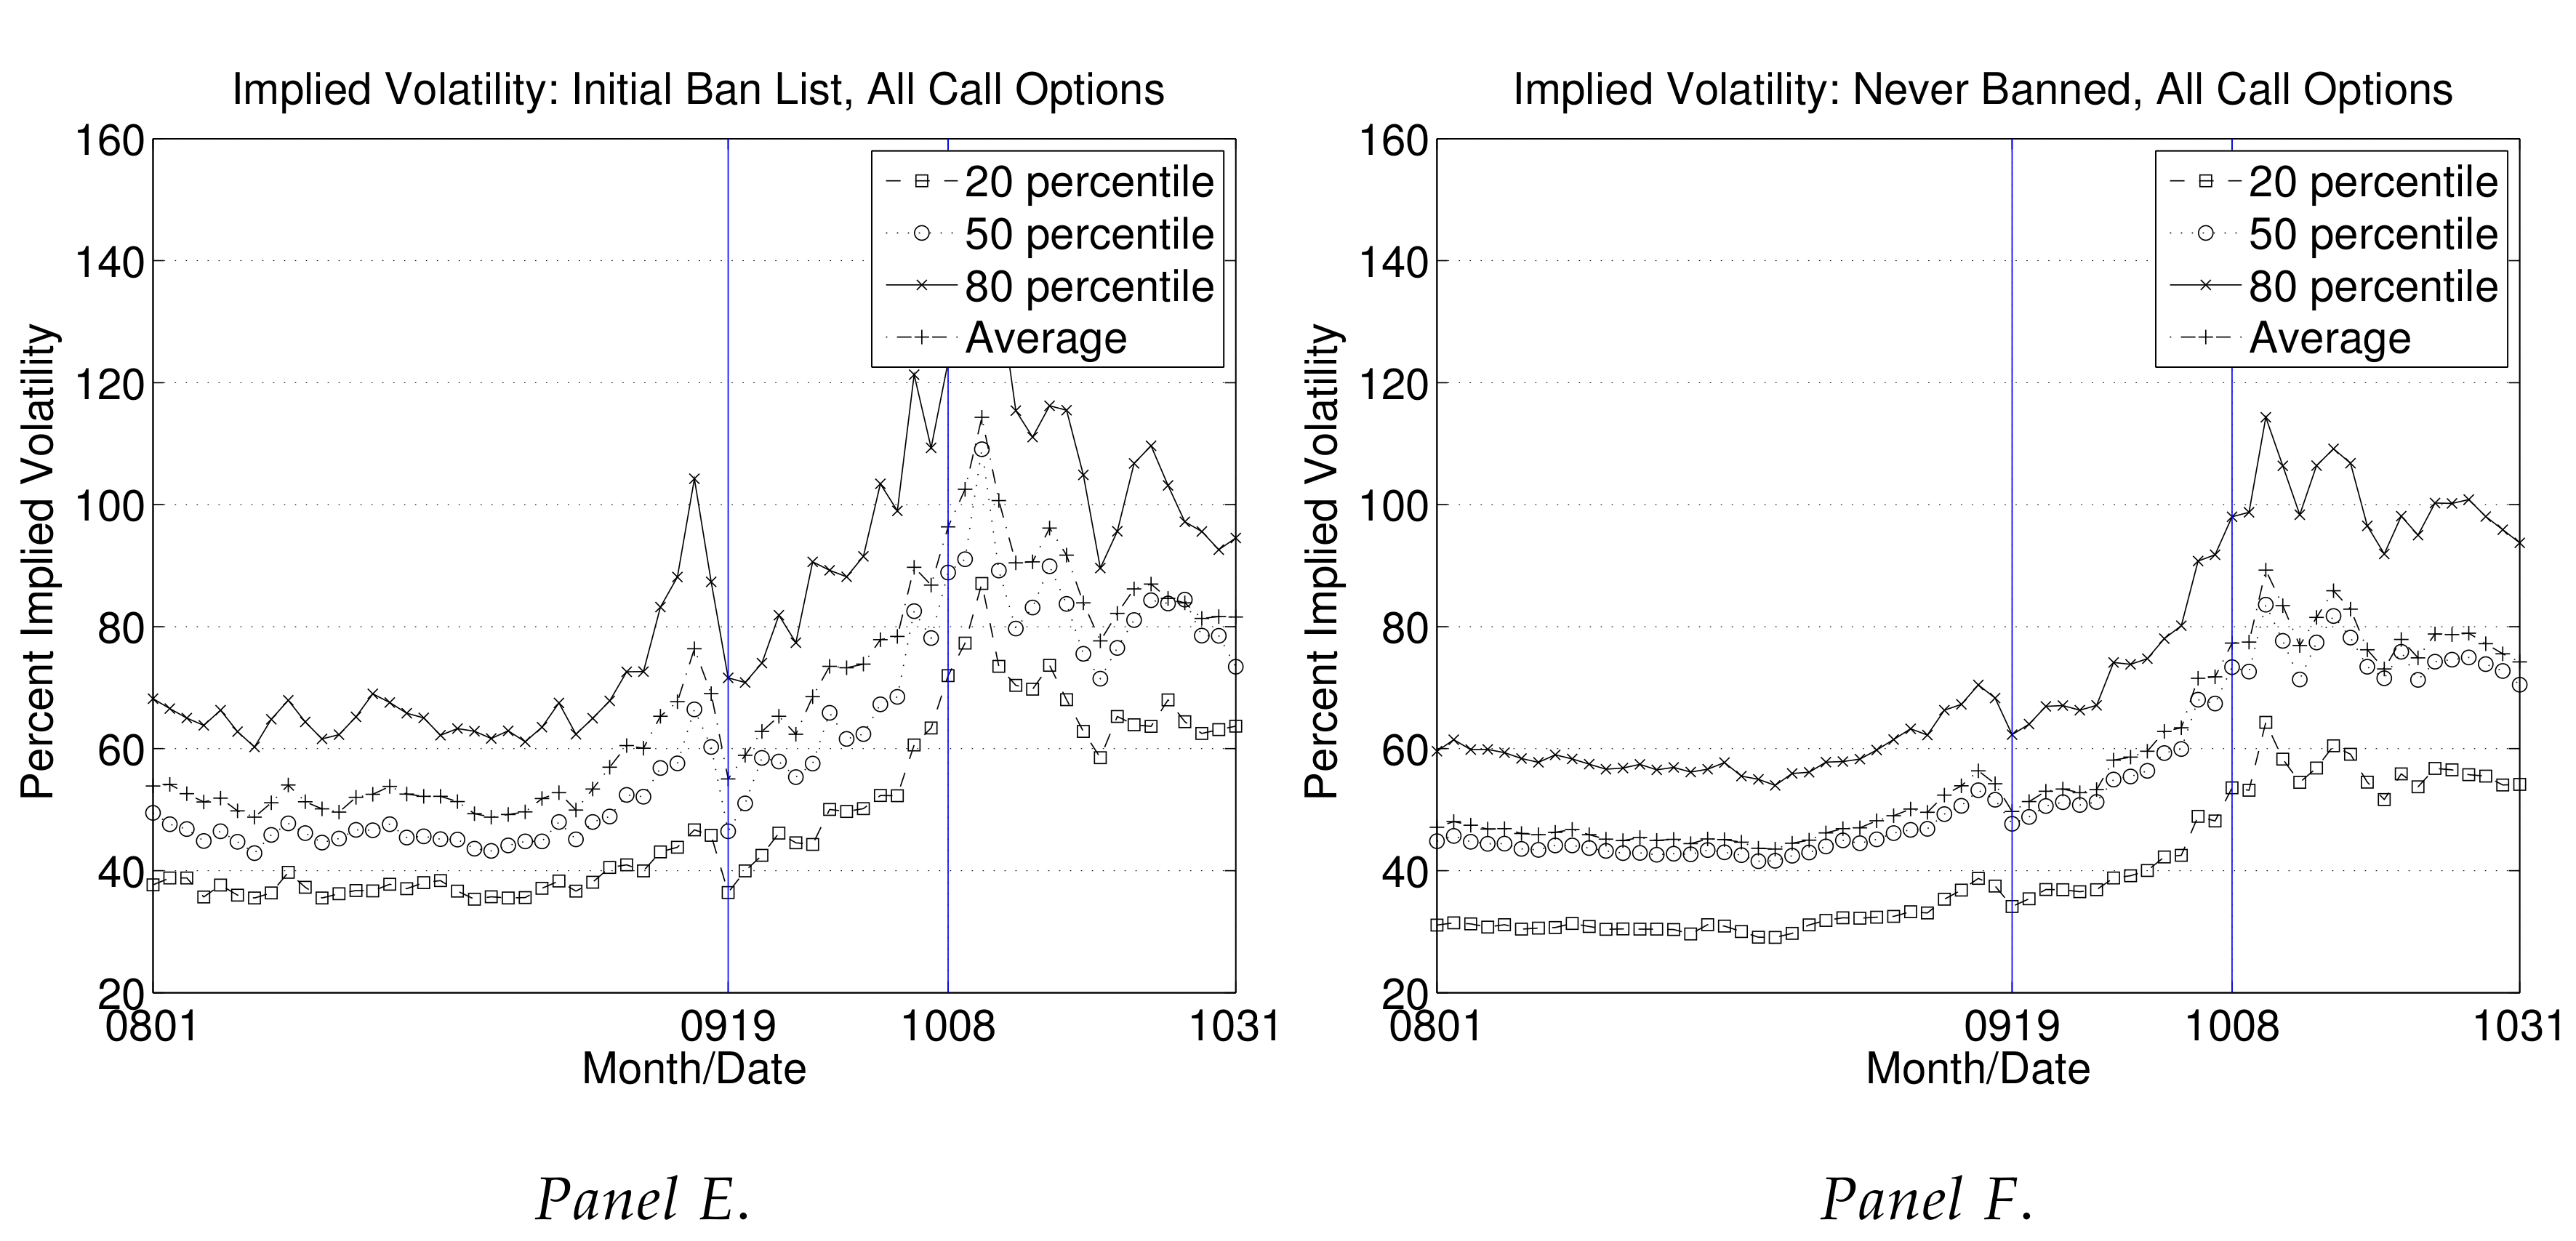
Figure 2.
Time series of cross sectional options summary statistics. All put options of Initial Ban List and Never Banned Stocks during the ban and non-ban periods: (A,C,E) results for the three variables for Initial Ban List Stocks; and (B,D,F) results for the three variables for Never Banned Stocks.
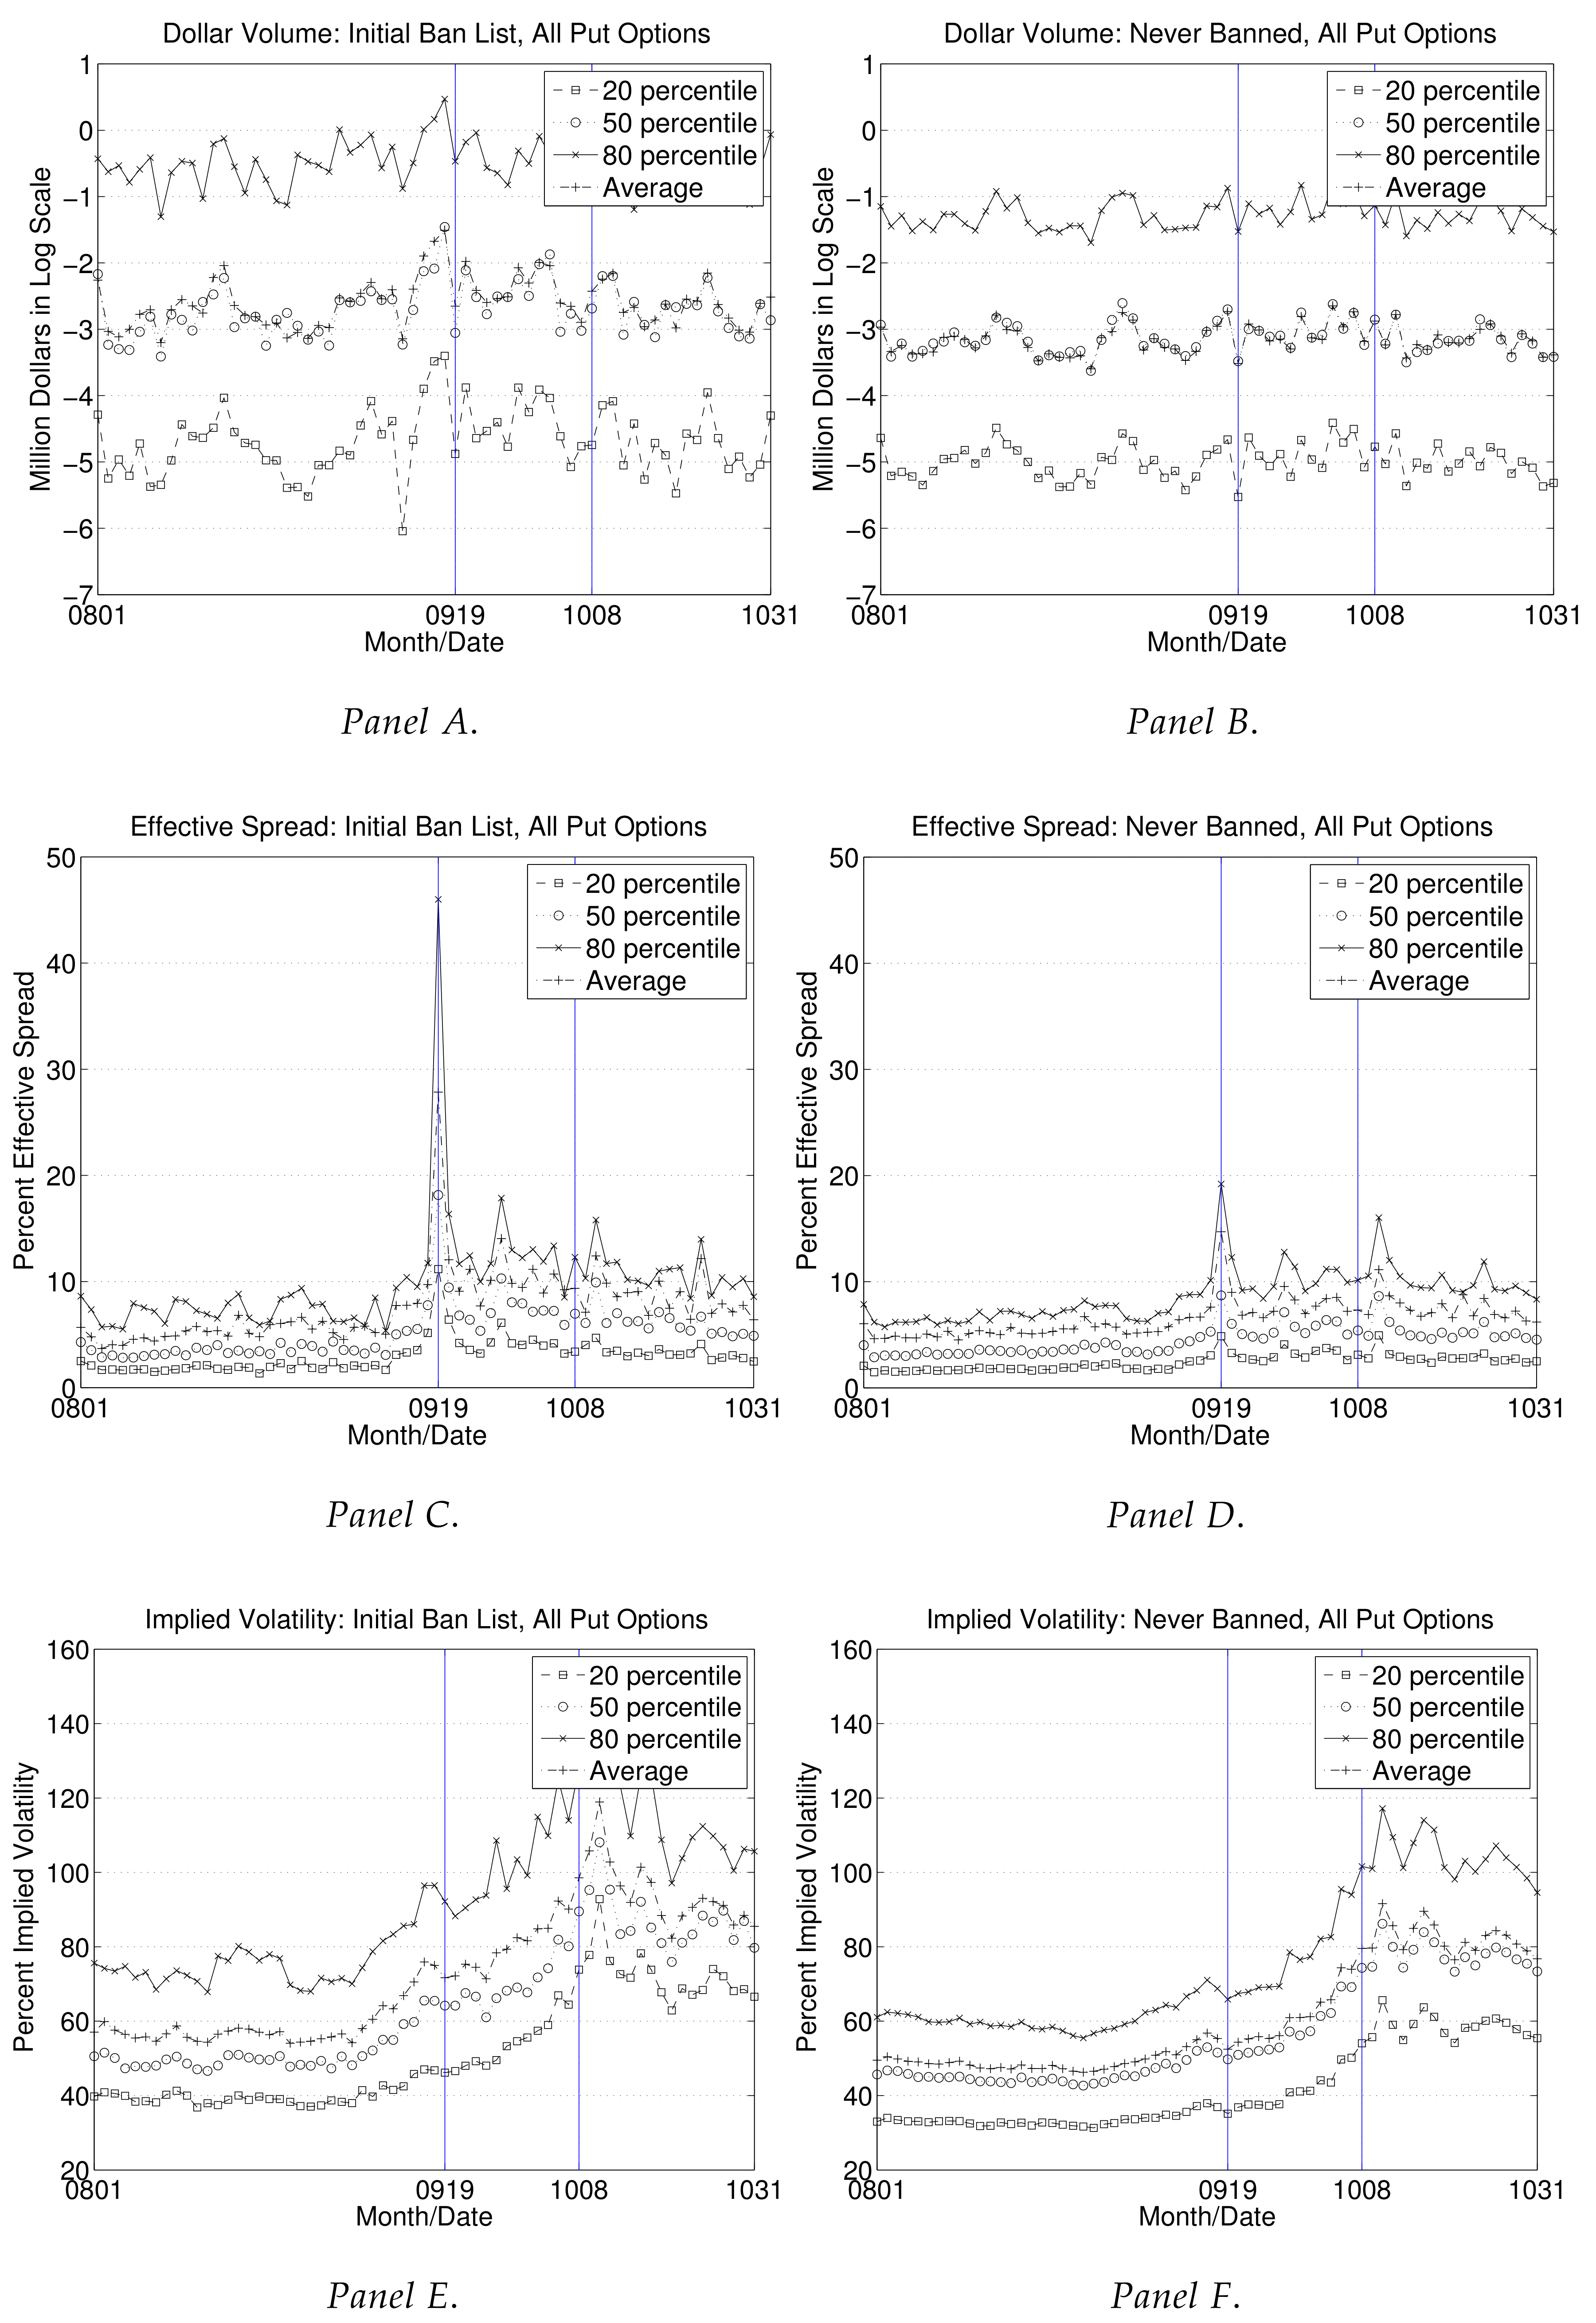
Figure 3.
Time series of cross sectional options summary statistics: At the money call options of Initial Ban List and Never Banned Stocks during the ban and non-ban periods: (A,C,E) results for the three variables for Initial Ban List Stocks; and (B,D,F) results for the three variables for Never Banned Stocks.

Figure 4.
Time series of cross sectional options summary statistics. At the money put options of Initial Ban List and Never Banned Stocks during the ban and non-ban periods: (A,C,E) results for the three variables for Initial Ban List Stocks; and (B,D,F) results for the three variables for Never Banned Stocks.

Figure 5.
Time series of cross sectional options summary statistics: Out of the money call options of Initial Ban List and Never Banned Stocks during the ban and non-ban periods: (A,C,E) results for the three variables for Initial Ban List Stocks; and (B,D,F) results for the three variables for Never Banned Stocks.

Figure 6.
Time series of cross sectional options summary statistics: Out of the money put options of Initial Ban List and Never Banned Stocks during the ban and non-ban periods: (A,C,E) results for the three variables for Initial Ban List Stocks; and (B,D,F) results for the three variables for Never Banned Stocks.

Figure 7.
Time series of cross sectional options summary statistics: In the money call options of Initial Ban List and Never Banned Stocks during the ban and non-ban periods: (A,C,E) results for the three variables for Initial Ban List Stocks; and (B,D,F) results for the three variables for Never Banned Stocks.

Figure 8.
Time series of cross sectional options summary statistics: In the money put options of Initial Ban List and Never Banned Stocks during the ban and non-ban periods: (A,C,E) results for the three variables for Initial Ban List Stocks; and (B,D,F) results for the three variables for Never Banned Stocks.

Figure 9.
The figure reports the 20th, 50th and 80th percentile values and the average for the quantity in cents for: (A) the Initial Ban List stocks; and (B) Never Banned Stocks.
Figure 9.
The figure reports the 20th, 50th and 80th percentile values and the average for the quantity in cents for: (A) the Initial Ban List stocks; and (B) Never Banned Stocks.


Table 1.
OPRA underlying stocks and short sales ban status.
| Panel A: OPRA Underlying Securities | |||||
|---|---|---|---|---|---|
| Ban Status | Stocks | Non-Stocks | Non-Present in CRSP | ||
| Initial Ban List | 199 | 39 | 0 | ||
| Later | 51 | 33 | 4 | ||
| Never Banned | 1998 | 793 | 122 | ||
| Total | 2248 | 865 | 126 | ||
| Panel B: OPRA Stocks after the Filters | |||||
| Call Options | Put Options | ||||
| Moneyness | Initial Ban List | Never Banned | Initial Ban List | Never Banned | |
| All | 83 | 834 | 81 | 748 | |
| At | 34 | 227 | 33 | 223 | |
| Out | 55 | 500 | 50 | 431 | |
| In | 44 | 324 | 40 | 335 | |
Table 2.
Cross sectional means and t-statistics for option trade summary statistics: All options.
| Initial Ban List | Never Banned | All | ||||||||
|---|---|---|---|---|---|---|---|---|---|---|
| Means | Means | |||||||||
| Period | Non Ban Period | During | t-stat | Non Ban Period | During | t-Stat | t-Stat | |||
| Panel A: Call Options | ||||||||||
| types of contracts | 5.73 | 6.65 | 5.03 | 4.41 | 4.72 | 10.16 | 0.62 | 5.56 | ||
| trades | 109 | 183 | 3.02 | 55 | 61 | 3.67 | 67 | 6.96 | ||
| size volume | 2021 | 3342 | 2.43 | 1008 | 1016 | 0.26 | 1313 | 6.69 | ||
| dollar volume | 0.69 | 1.14 | 2.72 | 0.31 | 0.32 | 0.54 | 0.45 | 7.04 | ||
| dollar volume weighted quoted | 15.66 | 23.79 | 10.84 | 14.71 | 17.33 | 14.08 | 5.51 | 8.65 | ||
| size volume weighted quoted | 16.63 | 25.17 | 10.52 | 15.88 | 18.84 | 14.70 | 5.58 | 8.11 | ||
| dollar volume weighted effective | 8.65 | 13.92 | 11.04 | 8.42 | 10.18 | 12.94 | 3.51 | 7.69 | ||
| size volume weighted effective | 9.12 | 14.93 | 10.47 | 9.08 | 11.08 | 13.86 | 3.81 | 7.77 | ||
| size volume weighted price | 3.54 | 3.75 | 3.68 | 2.78 | 2.71 | −4.92 | 0.28 | 5.76 | ||
| equal weighted price | 3.55 | 3.77 | 3.89 | 2.81 | 2.74 | −5.12 | 0.28 | 6.06 | ||
| dollar volume weighted implied vol | 74.17 | 72.71 | −1.09 | 63.98 | 59.91 | −21.39 | 2.62 | 3.56 | ||
| size volume weighted implied vol | 74.19 | 72.59 | −1.21 | 63.96 | 59.92 | −21.02 | 2.44 | 3.31 | ||
| Panel B: Put Options | ||||||||||
| types of contracts | 5.54 | 6.05 | 2.91 | 4.47 | 4.77 | 9.35 | 0.21 | 1.91 | ||
| trades | 111 | 118 | 0.74 | 50 | 55 | 2.95 | 1 | 0.22 | ||
| size volume | 2544 | 2706 | 0.60 | 1047 | 1114 | 2.03 | 96 | 0.71 | ||
| dollar volume | 1.03 | 1.11 | 0.56 | 0.37 | 0.43 | 2.40 | 0.02 | 0.17 | ||
| dollar volume weighted quoted | 13.72 | 19.35 | 9.10 | 12.24 | 14.70 | 17.04 | 3.18 | 6.59 | ||
| size volume weighted quoted | 14.49 | 20.08 | 9.14 | 13.13 | 15.70 | 16.58 | 3.02 | 5.89 | ||
| dollar volume weighted effective | 7.92 | 11.83 | 8.16 | 7.06 | 8.49 | 9.47 | 2.48 | 5.13 | ||
| size volume weighted effective | 8.39 | 12.32 | 8.20 | 7.49 | 9.06 | 10.77 | 2.37 | 5.05 | ||
| size volume weighted price | 3.86 | 4.37 | 4.15 | 3.07 | 3.09 | 0.96 | 0.49 | 6.89 | ||
| equal weighted price | 3.87 | 4.32 | 3.92 | 3.08 | 3.10 | 1.12 | 0.43 | 6.78 | ||
| dollar volume weighted implied vol | 79.31 | 81.65 | 1.66 | 66.89 | 62.94 | −18.95 | 6.28 | 8.02 | ||
| size volume weighted implied vol | 79.83 | 82.00 | 1.53 | 67.27 | 63.26 | −18.96 | 6.18 | 7.79 | ||
Table 3.
Cross sectional means and t-statistics for option trade summary statistics: At the money options.
Table 3.
Cross sectional means and t-statistics for option trade summary statistics: At the money options.
| Initial Ban List | Never Banned | All | ||||||||
|---|---|---|---|---|---|---|---|---|---|---|
| Means | Means | |||||||||
| Period | Non Ban Period | During | t-Stat | Non Ban Period | During | t-Stat | t-Stat | |||
| Panel A: Call Options | ||||||||||
| types of contracts | 4.06 | 4.74 | 3.36 | 3.18 | 3.38 | 5.33 | 0.48 | 3.87 | ||
| trades | 66 | 116 | 2.95 | 42 | 46 | 2.55 | 46 | 5.74 | ||
| size volume | 1160 | 2235 | 2.29 | 706 | 727 | 0.58 | 1054 | 5.21 | ||
| dollar volume | 0.45 | 0.79 | 2.46 | 0.28 | 0.29 | 1.00 | 0.32 | 5.00 | ||
| dollar volume weighted quoted | 9.64 | 15.28 | 7.45 | 8.58 | 10.24 | 9.31 | 3.98 | 7.32 | ||
| size volume weighted quoted | 9.81 | 15.47 | 7.37 | 8.77 | 10.50 | 9.61 | 3.93 | 7.13 | ||
| dollar volume weighted effective | 5.16 | 8.91 | 7.48 | 4.74 | 5.84 | 8.37 | 2.65 | 6.80 | ||
| size volume weighted effective | 5.21 | 9.12 | 7.52 | 4.83 | 5.99 | 8.63 | 2.74 | 6.82 | ||
| size volume weighted price | 4.95 | 5.09 | 1.50 | 4.17 | 4.16 | −0.31 | 0.15 | 1.63 | ||
| equal weighted price | 4.91 | 5.09 | 2.20 | 4.17 | 4.15 | −0.70 | 0.20 | 2.42 | ||
| dollar volume weighted implied vol | 80.60 | 77.65 | −1.10 | 63.71 | 60.39 | −8.30 | 0.37 | 0.25 | ||
| size volume weighted implied vol | 80.94 | 77.80 | −1.17 | 63.93 | 60.57 | −8.34 | 0.21 | 0.14 | ||
| Panel B: Put Options | ||||||||||
| types of contracts | 4.00 | 4.28 | 1.66 | 3.06 | 3.28 | 6.04 | 0.07 | 0.57 | ||
| trades | 69 | 77 | 0.88 | 37 | 42 | 3.53 | 3 | 0.51 | ||
| size volume | 1463 | 1850 | 1.20 | 750 | 808 | 1.61 | 329 | 2.13 | ||
| dollar volume | 0.66 | 0.77 | 1.00 | 0.30 | 0.36 | 2.65 | 0.06 | 0.89 | ||
| dollar volume weighted quoted | 8.40 | 13.26 | 7.79 | 7.53 | 9.07 | 7.07 | 3.33 | 5.42 | ||
| size volume weighted quoted | 8.49 | 13.50 | 7.74 | 7.71 | 9.29 | 7.51 | 3.43 | 5.73 | ||
| dollar volume weighted effective | 4.34 | 7.20 | 7.10 | 4.18 | 4.88 | 3.63 | 2.16 | 4.11 | ||
| size volume weighted effective | 4.39 | 7.29 | 7.10 | 4.27 | 4.99 | 3.72 | 2.17 | 4.09 | ||
| size volume weighted price | 5.18 | 5.82 | 3.56 | 4.30 | 4.35 | 1.22 | 0.59 | 4.79 | ||
| equal weighted price | 5.11 | 5.71 | 3.62 | 4.26 | 4.31 | 1.25 | 0.55 | 4.84 | ||
| dollar volume weighted implied vol | 83.09 | 87.58 | 1.84 | 65.67 | 62.27 | −9.02 | 7.89 | 5.84 | ||
| size volume weighted implied vol | 83.39 | 87.79 | 1.81 | 65.87 | 62.44 | −9.00 | 7.82 | 5.77 | ||
Table 4.
Cross sectional means and t-statistics for option trade summary statistics: Out of the money options.
Table 4.
Cross sectional means and t-statistics for option trade summary statistics: Out of the money options.
| Initial Ban List | Never Banned | All | ||||||||
|---|---|---|---|---|---|---|---|---|---|---|
| Means | Means | |||||||||
| Period | Non Ban Period | During | t-Stat | Non Ban Period | During | t-Stat | t-Stat | |||
| Panel A: Call Options | ||||||||||
| types of contracts | 4.46 | 5.20 | 5.22 | 3.41 | 3.66 | 8.82 | 0.49 | 5.06 | ||
| trades | 84 | 128 | 3.06 | 48 | 56 | 3.69 | 36 | 4.57 | ||
| size volume | 1621 | 2364 | 2.38 | 931 | 940 | 0.31 | 734 | 5.36 | ||
| dollar volume | 0.45 | 0.63 | 2.48 | 0.22 | 0.23 | 0.11 | 0.18 | 4.83 | ||
| dollar volume weighted quoted | 14.04 | 21.70 | 9.23 | 14.06 | 16.88 | 12.62 | 4.84 | 6.65 | ||
| size volume weighted quoted | 14.87 | 22.41 | 9.01 | 15.11 | 18.19 | 12.54 | 4.46 | 5.65 | ||
| dollar volume weighted effective | 7.55 | 12.82 | 9.57 | 8.05 | 9.82 | 9.89 | 3.50 | 6.16 | ||
| size volume weighted effective | 7.95 | 13.30 | 9.26 | 8.58 | 10.53 | 10.68 | 3.40 | 5.84 | ||
| size volume weighted price | 3.03 | 3.16 | 2.39 | 2.51 | 2.41 | −5.08 | 0.23 | 3.77 | ||
| equal weighted price | 3.02 | 3.12 | 1.85 | 2.50 | 2.41 | −4.96 | 0.19 | 3.33 | ||
| dollar volume weighted implied vol | 70.77 | 68.90 | −1.37 | 61.57 | 58.13 | −14.93 | 1.57 | 1.90 | ||
| size volume weighted implied vol | 71.04 | 69.04 | −1.46 | 61.75 | 58.30 | −14.86 | 1.45 | 1.74 | ||
| Panel B: Put Options | ||||||||||
| types of contracts | 4.22 | 4.58 | 1.99 | 3.26 | 3.39 | 4.46 | 0.24 | 2.25 | ||
| trades | 81 | 84 | 0.49 | 38 | 43 | 2.65 | −3 | −0.41 | ||
| size volume | 2063 | 1874 | −0.89 | 826 | 861 | 1.07 | −224 | −1.88 | ||
| dollar volume | 0.66 | 0.65 | −0.07 | 0.22 | 0.25 | 1.74 | −0.03 | −0.61 | ||
| dollar volume weighted quoted | 13.13 | 18.57 | 9.57 | 11.98 | 14.25 | 10.69 | 3.17 | 4.86 | ||
| size volume weighted quoted | 13.67 | 19.09 | 9.71 | 12.80 | 15.05 | 10.31 | 3.16 | 4.73 | ||
| dollar volume weighted effective | 7.82 | 11.46 | 10.83 | 6.77 | 8.17 | 6.49 | 2.24 | 3.49 | ||
| size volume weighted effective | 8.15 | 11.75 | 10.63 | 7.12 | 8.53 | 8.22 | 2.20 | 4.26 | ||
| size volume weighted price | 3.43 | 3.85 | 4.09 | 2.68 | 2.63 | −2.44 | 0.47 | 6.46 | ||
| equal weighted price | 3.39 | 3.76 | 3.70 | 2.67 | 2.62 | −2.57 | 0.42 | 6.12 | ||
| dollar volume weighted implied vol | 78.60 | 81.15 | 1.35 | 66.12 | 62.77 | −12.21 | 5.89 | 5.74 | ||
| size volume weighted implied vol | 79.04 | 81.45 | 1.26 | 66.41 | 63.00 | −12.28 | 5.81 | 5.60 | ||
Table 5.
Cross sectional means and t-statistics for option trade summary statistics: In the money options.
Table 5.
Cross sectional means and t-statistics for option trade summary statistics: In the money options.
| Initial Ban List | Never Banned | All | ||||||||
|---|---|---|---|---|---|---|---|---|---|---|
| Means | Means | |||||||||
| Period | Non Ban Period | During | t-Stat | Non Ban Period | During | t-Stat | t-Stat | |||
| Panel A: Call Options | ||||||||||
| types of contracts | 4.11 | 4.79 | 3.19 | 3.21 | 3.28 | 2.06 | 0.60 | 5.03 | ||
| trades | 47 | 84 | 2.97 | 26 | 27 | 1.01 | 36 | 6.83 | ||
| size volume | 786 | 1416 | 2.78 | 432 | 419 | −0.48 | 643 | 5.85 | ||
| dollar volume | 0.38 | 0.72 | 2.90 | 0.21 | 0.21 | −0.01 | 0.35 | 6.78 | ||
| dollar volume weighted quoted | 9.43 | 15.07 | 8.56 | 8.21 | 9.63 | 10.61 | 4.22 | 9.67 | ||
| size volume weighted quoted | 9.48 | 15.26 | 8.69 | 8.29 | 9.77 | 10.86 | 4.30 | 9.74 | ||
| dollar volume weighted effective | 5.21 | 7.97 | 9.12 | 4.42 | 5.21 | 5.87 | 1.97 | 5.15 | ||
| size volume weighted effective | 5.23 | 8.13 | 8.85 | 4.48 | 5.30 | 5.93 | 2.07 | 5.27 | ||
| size volume weighted price | 5.85 | 6.11 | 2.37 | 5.15 | 5.21 | 1.75 | 0.20 | 2.17 | ||
| equal weighted price | 5.80 | 6.06 | 2.56 | 5.14 | 5.22 | 2.24 | 0.19 | 2.01 | ||
| dollar volume weighted implied vol | 76.11 | 74.55 | −0.79 | 65.59 | 62.06 | −11.42 | 1.96 | 1.77 | ||
| size volume weighted implied vol | 76.42 | 74.68 | −0.87 | 65.76 | 62.19 | −11.47 | 1.83 | 1.64 | ||
| Panel B: Put Options | ||||||||||
| types of contracts | 4.50 | 4.65 | 0.96 | 3.28 | 3.47 | 5.92 | −0.04 | −0.40 | ||
| trades | 64 | 61 | −0.64 | 28 | 29 | 0.79 | −5 | −1.10 | ||
| size volume | 1327 | 1379 | 0.46 | 548 | 600 | 1.66 | 1 | 0.01 | ||
| dollar volume | 0.74 | 0.69 | −0.40 | 0.30 | 0.36 | 2.07 | −0.11 | −1.13 | ||
| dollar volume weighted quoted | 7.37 | 11.49 | 9.48 | 7.11 | 8.53 | 10.52 | 2.70 | 6.46 | ||
| size volume weighted quoted | 7.46 | 11.62 | 9.39 | 7.20 | 8.65 | 10.63 | 2.71 | 6.40 | ||
| dollar volume weighted effective | 3.84 | 6.37 | 10.26 | 4.02 | 4.88 | 6.84 | 1.67 | 4.47 | ||
| size volume weighted effective | 3.88 | 6.45 | 10.13 | 4.06 | 4.93 | 6.57 | 1.69 | 4.29 | ||
| size volume weighted price | 6.29 | 6.89 | 4.61 | 5.35 | 5.46 | 3.03 | 0.49 | 4.23 | ||
| equal weighted price | 6.23 | 6.81 | 5.18 | 5.30 | 5.41 | 3.12 | 0.48 | 4.51 | ||
| dollar volume weighted implied vol | 78.66 | 81.00 | 1.26 | 64.29 | 61.09 | −11.17 | 5.54 | 5.29 | ||
| size volume weighted implied vol | 78.90 | 81.23 | 1.24 | 64.44 | 61.23 | −11.09 | 5.55 | 5.25 | ||
Table 6.
Two way fixed effect specification results.
| All | At | Out | In | ||||||||
|---|---|---|---|---|---|---|---|---|---|---|---|
| Coef. | t-Stat | Coef. | t-Stat | Coef. | t-Stat | Coef. | t-Stat | ||||
| Panel A: Call Options | |||||||||||
| types of contracts | 0.64 | 8.82 | 0.49 | 5.27 | 0.63 | 7.78 | 0.49 | 6.81 | |||
| trades | 70 | 11.62 | 46 | 8.26 | 38 | 11.35 | 37 | 6.50 | |||
| size volume | 1370 | 12.48 | 1065 | 9.45 | 679 | 9.03 | 748 | 6.55 | |||
| dollar volume | 0.47 | 11.92 | 0.34 | 7.34 | 0.37 | 10.32 | 0.19 | 5.85 | |||
| dollar volume weighted quoted | 5.36 | 13.57 | 4.18 | 11.01 | 4.14 | 12.87 | 4.72 | 9.62 | |||
| size volume weighted quoted | 5.38 | 12.71 | 4.13 | 10.68 | 4.22 | 13.01 | 4.30 | 8.27 | |||
| dollar volume weighted effective | 3.40 | 10.58 | 2.78 | 6.78 | 2.03 | 7.07 | 3.40 | 7.79 | |||
| size volume weighted effective | 3.65 | 10.93 | 2.87 | 6.94 | 2.13 | 7.15 | 3.27 | 7.63 | |||
| size volume weighted price | 0.28 | 6.24 | 0.20 | 2.26 | 0.22 | 2.92 | 0.26 | 4.96 | |||
| equal weighted price | 0.28 | 6.87 | 0.25 | 3.13 | 0.22 | 2.96 | 0.22 | 4.62 | |||
| dollar volume weighted implied vol | 2.68 | 6.64 | 1.33 | 1.89 | 2.46 | 4.05 | 2.26 | 4.56 | |||
| size volume weighted implied vol | 2.51 | 6.22 | 1.19 | 1.70 | 2.33 | 3.82 | 2.15 | 4.34 | |||
| Panel B: Put Options | |||||||||||
| types of contracts | 0.20 | 2.78 | 0.10 | 1.03 | 0.25 | 3.47 | −0.04 | −0.41 | |||
| trades | 1 | 0.18 | 2 | 0.43 | −3 | −0.68 | −5 | −1.42 | |||
| size volume | 87 | 0.83 | 337 | 2.79 | −231 | −2.31 | −7 | −0.08 | |||
| dollar volume | 0.01 | 0.17 | 0.06 | 1.11 | −0.04 | −0.99 | −0.11 | −1.94 | |||
| dollar volume weighted quoted | 3.05 | 8.62 | 3.17 | 8.59 | 3.07 | 6.78 | 2.76 | 9.50 | |||
| size volume weighted quoted | 2.88 | 7.72 | 3.25 | 8.74 | 3.04 | 6.41 | 2.77 | 9.49 | |||
| dollar volume weighted effective | 2.38 | 5.48 | 2.02 | 4.58 | 2.16 | 2.87 | 1.71 | 3.84 | |||
| size volume weighted effective | 2.26 | 6.92 | 2.02 | 4.56 | 2.11 | 4.46 | 1.73 | 3.94 | |||
| size volume weighted price | 0.51 | 10.43 | 0.62 | 6.63 | 0.49 | 8.15 | 0.50 | 6.13 | |||
| equal weighted price | 0.45 | 10.23 | 0.58 | 6.66 | 0.43 | 7.94 | 0.48 | 6.31 | |||
| dollar volume weighted implied vol | 6.25 | 15.32 | 7.02 | 9.89 | 6.02 | 11.41 | 5.66 | 9.53 | |||
| size volume weighted implied vol | 6.15 | 15.03 | 6.95 | 9.77 | 5.94 | 11.23 | 5.66 | 9.48 | |||
Table 7.
Information in option trading volume for underlying stock prices.
| Estimation | Holding | Non Ban Period | During The Ban | |||||
|---|---|---|---|---|---|---|---|---|
| Period | Period | Coef. | t-Stat | Stocks | Coef. | t-Stat | Stocks | |
| Panel A: Initial Ban List | ||||||||
| Call Options | ||||||||
| 30 | 5 | −0.65 | −0.32 | 23 | −0.08 | −0.02 | 26 | |
| 30 | 10 | −2.50 | −0.64 | 23 | −1.86 | −0.28 | 26 | |
| 30 | 15 | −6.22 | −1.07 | 23 | −7.88 | −0.83 | 26 | |
| 30 | 30 | −22.00 | −2.22 | 23 | −20.91 | −1.36 | 26 | |
| Put Options | ||||||||
| 30 | 5 | −1.51 | −0.73 | 20 | −5.66 | −1.40 | 21 | |
| 30 | 10 | −2.49 | −0.68 | 20 | −13.96 | −1.92 | 21 | |
| 30 | 15 | −3.88 | −0.76 | 20 | −20.87 | −1.95 | 21 | |
| 30 | 30 | −3.43 | −0.38 | 20 | −36.51 | −2.08 | 21 | |
| Panel B: Never Banned | ||||||||
| Call Options | ||||||||
| 30 | 5 | 0.06 | 0.15 | 161 | 0.88 | 1.47 | 176 | |
| 30 | 10 | 0.19 | 0.25 | 161 | 1.77 | 1.56 | 175 | |
| 30 | 15 | 0.59 | 0.56 | 161 | 2.28 | 1.34 | 175 | |
| 30 | 30 | 0.38 | 0.20 | 160 | 1.63 | 0.55 | 175 | |
| Put Options | ||||||||
| 30 | 5 | 0.00 | 0.01 | 139 | −0.42 | −0.80 | 151 | |
| 30 | 10 | −0.21 | −0.24 | 139 | −0.89 | −0.89 | 151 | |
| 30 | 15 | −0.67 | −0.58 | 139 | −1.77 | −1.22 | 150 | |
| 30 | 30 | −2.56 | −1.39 | 138 | −1.94 | −0.74 | 150 | |
Table 8.
The differences from the put–call parity.
| Panel A: Summary Statistics | ||||||||
|---|---|---|---|---|---|---|---|---|
| Percentile | 20 | 40 | 50 | 60 | 80 | Mean | Matched Pairs | Stocks |
| Non-Ban Period | ||||||||
| Initial Ban List | −7.22 | 6.55 | 11.08 | 16.27 | 28.49 | 7.03 | 1033 | 37 |
| Never Banned | 0.05 | 9.79 | 15.24 | 20.55 | 34.13 | 19.63 | 3083 | 275 |
| During the Ban | ||||||||
| Initial Ban List | −24.14 | −4.76 | 0.99 | 6.40 | 18.18 | −10.27 | 1469 | 37 |
| Never Banned | −0.32 | 9.00 | 13.81 | 19.01 | 34.55 | 16.74 | 3093 | 276 |
| Panel B: t-statistics for Same Means: Non-Ban Period and During the Ban | ||||||||
| Initial Ban List | 2.16 | |||||||
| Never Banned | 1.26 | |||||||
© 2018 by the authors. Licensee MDPI, Basel, Switzerland. This article is an open access article distributed under the terms and conditions of the Creative Commons Attribution (CC BY) license (http://creativecommons.org/licenses/by/4.0/).
Share and Cite
MDPI and ACS Style
Cakici, N.; Goswami, G.; Tan, S. Equity Options During the Shorting Ban of 2008. J. Risk Financial Manag. 2018, 11, 17. https://doi.org/10.3390/jrfm11020017
AMA Style
Cakici N, Goswami G, Tan S. Equity Options During the Shorting Ban of 2008. Journal of Risk and Financial Management. 2018; 11(2):17. https://doi.org/10.3390/jrfm11020017
Chicago/Turabian StyleCakici, Nusret, Gautam Goswami, and Sinan Tan. 2018. "Equity Options During the Shorting Ban of 2008" Journal of Risk and Financial Management 11, no. 2: 17. https://doi.org/10.3390/jrfm11020017