Article

A Causal and Real-Time Capable Power Management Algorithm for Off-Highway Hybrid Propulsion Systems

by
Johannes Schalk
1,* and
Harald Aschemann
2
1
MTU Friedrichshafen GmbH, Maybachplatz 1, 88045 Friedrichshafen, Germany
2
Chair of Mechatronics, Rostock University, Justus-von-Liebig Weg 6, 18059 Rostock, Germany
*
Author to whom correspondence should be addressed.
Energies 2017, 10(1), 10; https://doi.org/10.3390/en10010010
Submission received: 28 September 2016 / Revised: 8 December 2016 / Accepted: 16 December 2016 / Published: 26 December 2016

Abstract

:
Hybrid propulsion systems allow for a reduction of fuel consumption and pollutant emissions of future off-highway applications. A challenging aspect of a hybridization is the larger number of system components that further increases both the complexity and the diversification of such systems. Hence, beside a standardization on the hardware side for off-highway systems, a high flexibility and modularity of the control schemes is required to employ them in as many different applications as possible. In this paper, a causal optimization-based power management algorithm is introduced to control the power split between engine and electric machine in a hybrid powertrain. The algorithm optimizes the power split to achieve the maximum power supply efficiency and, thereby, considers the energy cost for maintaining the battery charge. Furthermore, the power management provides an optional function to control the battery state of charge in such a way that a target value is attained. In a simulation case study, the potential and the benefits of the proposed power management for the hybrid powertrain—aiming at a reduction of the fuel consumption of a DMU (diesel multiple unit train) operated on a representative track—will be shown.

1. Introduction

1.1. Motivation

In the automotive industry, hybrid electric and full electric vehicles play a significant role in efforts to meet future legislated emission targets. Beside stricter limits for pollutant emissions of nitrogen oxides and particulates, European regulations also aim at reducing the average CO2 emissions of passenger cars to 95 g/km [1]. For off-highway applications—such as diesel multiple unit trains (DMUs) or marine applications—so far no legislative regulation to reduce CO2 emissions has been implemented. Nevertheless, lowering fuel consumption and thus CO2 emissions is the major goal in developing future off-highway propulsion systems. This is comprehensible considering that the fuel share of total life cycle costs for off-highway applications can be up to over 90% and, additionally, fuel prices are very likely to increase in the mid- and long-term future [2]. Hybrid powertrain technology can help to significantly lower fuel consumption of rail and marine applications [3,4,5,6]. Compared to conventional non-hybrid powertrains, additional operational functionalities of hybrids like recuperation of kinetic energy, engine operation point shifting or electric boosting improve the system performance and reduce pollutant emissions [7]. Figure 1 shows an overview of the functionalities of hybrid powertrains and their impact on emissions, fuel consumption and system performance.
On the other hand, electrification of propulsion systems further increases the number of system components and, therefore, the complexity of already highly sophisticated off-highway architectures consisting of multiple engines, generators, gearboxes, etc. This leads to an even higher diversification of system configurations. To cope with this variety in series production, it is compulsory to standardize components of hybrid propulsion systems and to use them for various applications. Besides the hardware standardization, it is also necessary to harmonize software functions and control algorithms in order to apply them to as many different system configurations and architectures as possible. Therefore, a power management algorithm (PMA) is required to control the power split between combustion engine and electric motor in a hybrid propulsion system. The PMA has to offer the flexibility and modularity to be applicable to a vast variety of systems, including multi-engine system topologies.

1.2. Classification of Power Management Algorithms

In the past, a wide range of different academic approaches of PMAs to optimize the power split in hybrid propulsion systems for on- and non-road applications have been published in the literature. In order to classify multiple PMAs by the basis of their data, one can differentiate between causal and non-causal strategies [8,9]. In causal strategies, the decisions made by the PMAs are based upon present and past state variables. On the contrary, in a non-causal approach, knowledge of the whole drive cycle is processed. Considering data of the complete drive cycle enables an optimization of the fuel consumption for a global optimum [9,10]. For DMUs, where a detailed knowledge of the track and timetable is available, a non-causal PMA in combination with a predictive strategy is feasible. From a functional perspective, heuristic, often called rule-based or sub-optimal, and optimization-based, or also known as optimal, algorithms can be distinguished [9,11,12,13]. Heuristic strategies include deterministic rule-based and fuzzy logic control algorithms [14,15,16,17]. Those approaches are state of the art in most prototype and production hybrid vehicles [9]. They are real-time capable and are processed online. The optimization-based or optimal PMAs are mainly processed offline. Those strategies are normally non-causal and, therefore, process information about the whole drive cycle. The optimal PMAs are divided into numerical methods such as dynamic programming (DP) and analytical approaches, like Pontryagins minimum principle [11,18,19]. DP enables to find a global optimum but is not real-time capable and, therefore, frequently used as benchmark PMA. Other optimization-based PMAs are the so called equivalent consumption minimization strategies (ECMS) [9,12]. The approach associates the stored electric energy to a future increase or decrease of fuel consumption. Therefore, usually an equivalence factor is imposed to convert battery into fuel power, and based on that into an equivalent fuel consumption. In the meantime, many different ECMS approaches, primarily for automotive applications, were introduced. They use rule- or map-based routines as well as online adaption to determine the equivalent factor and optimize power split [20,21,22,23,24].

1.3. Requirements for the Off-Highway Application Power Management

In this paper a new power management algorithm (PMA) which controls the power split between combustion engine and electric motor in a hybrid propulsion system is presented. It is an online optimization-based causal strategy. Only present and past state variables are used, and no knowledge of the whole drive cycle is necessary. The PMA is developed to be applied to various applications and system configurations, including systems with multiple engines and a variety of electrical components. It is suited for use in hardware-in-the-loop (HiL) experiments as well as field testing of systems for off-highway applications. Furthermore it has to fulfill, amongst others, the following requirements:
  • Modular structure
  • Real-time capability
  • Compatibility to series production propulsion system control units
  • Suitability for different mission scenarios and velocity/load control modes (including driver-controlled traction torque demand and automatically controlled drive strategies)
  • Consideration of variable auxiliary or external load requests in the PMA.
It is important to point out that some of these requirements significantly differ from demands for PMAs used in automotive applications. Especially the necessity of a high modularity and the flexibility of the algorithm for various applications, topologies and system components are challenging concerning algorithm development and code implementation.
The paper comprises a simulation case study where the PMA is exemplarily applied to control a hybrid propulsion system for a DMU application. In Section 2, boundary conditions for the simulation case study are presented, including the specification of the system hardware in Section 2.1, as well as a short description of the drive strategies in Section 2.2, which are used for the simulations. Afterwards, in Section 3, a brief overview over the simulation model approach is given along with examples for a model validation. For the model validation, measured data from a hardware-in-the-loop (HiL) test rig is used. It represents a realistic prototype of a hybrid propulsion system driving a virtual vehicle model of the DMU. In Section 4, the PMA is described comprehensively. At first, the general problem for the control of hybrid systems is defined. Section 4.2 points out the possible operation modes of parallel hybrid powertrains which are relevant for the PMA. Thereafter, Section 4.3 presents the different functions and their interaction with the PMA. The results of the simulation case study are finally discussed in Section 5.

2. Boundaries of the Simulation Case Study

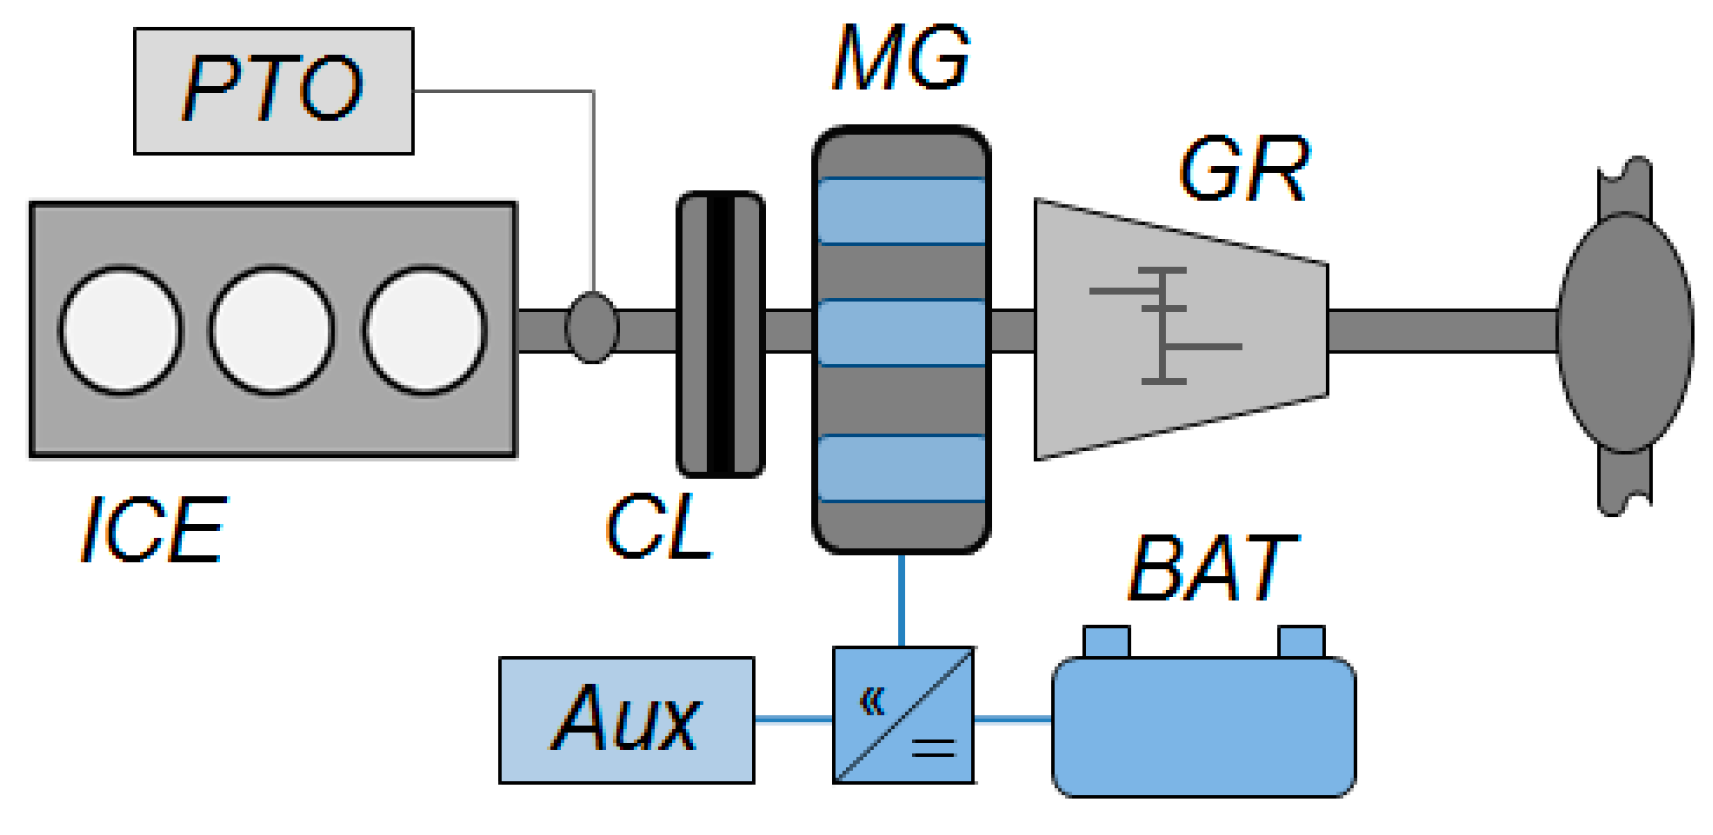
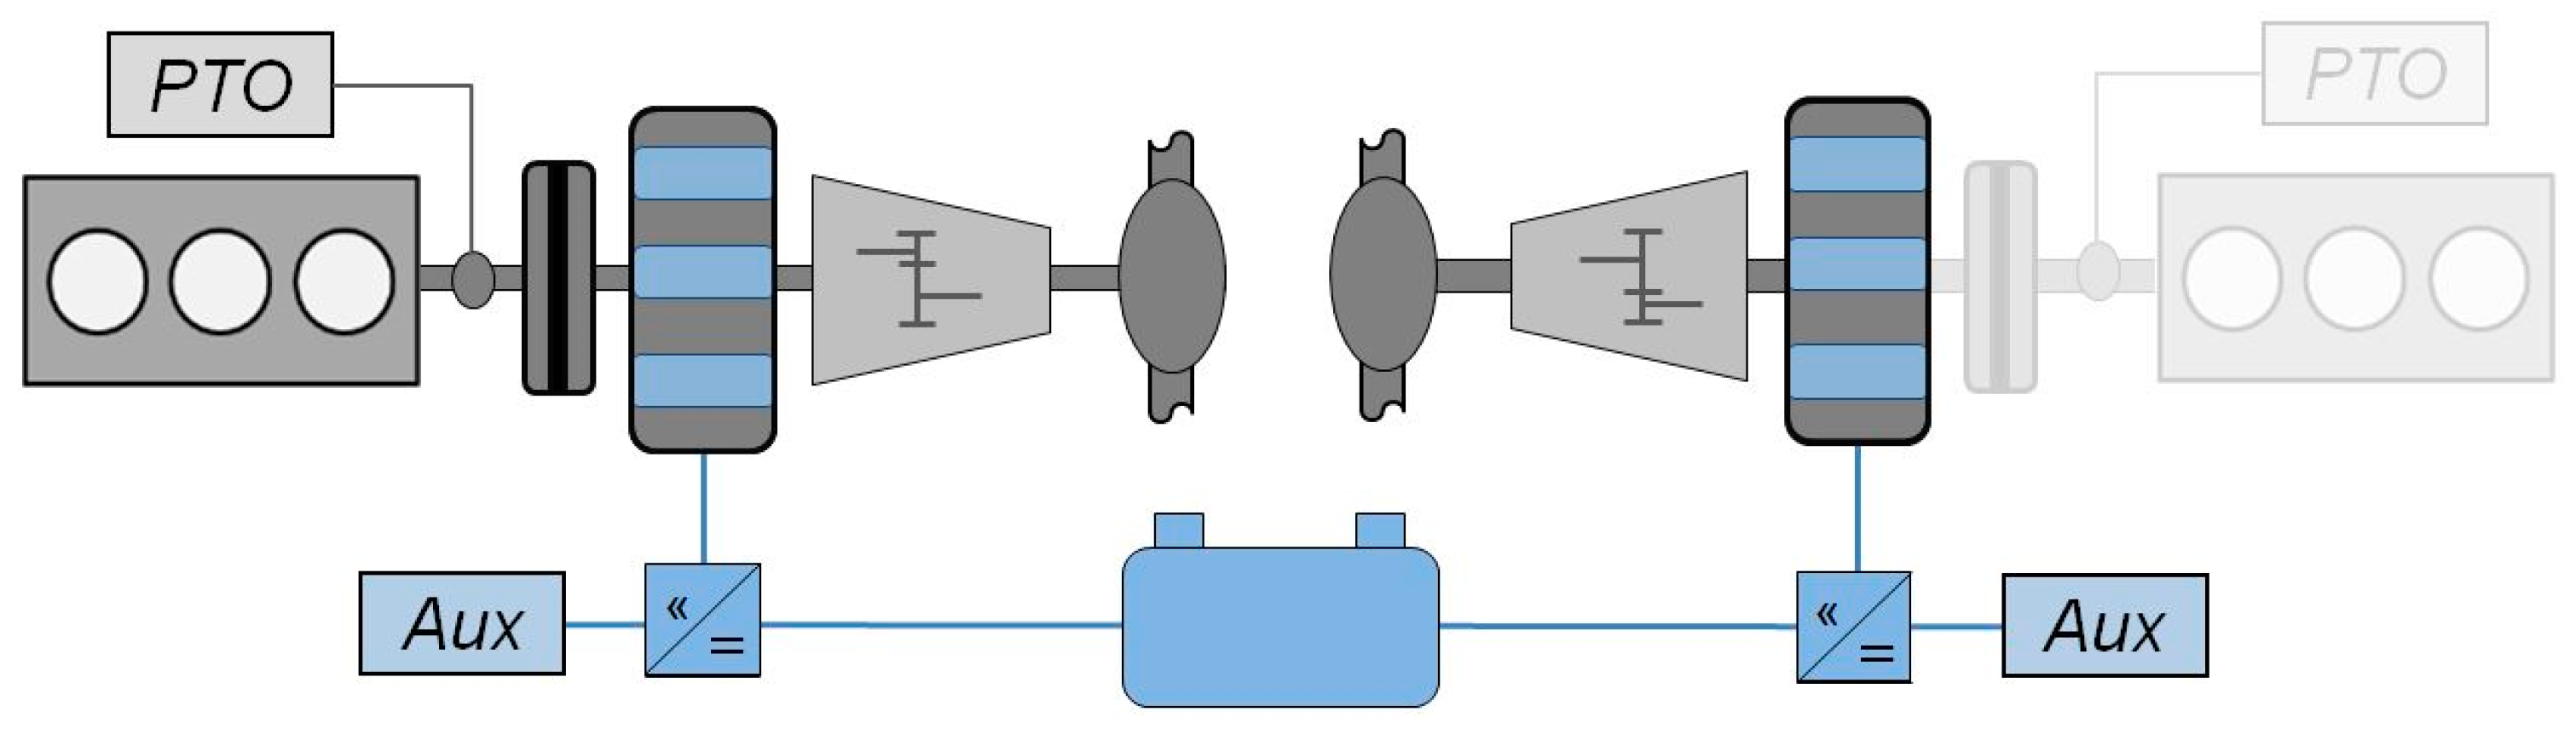
2.1. Hybrid Diesel Multiple Unit Train (DMU) System Specification

The PMA introduced in this paper has been developed for a Siemens Desiro VT642 DMU dedicated for regional passenger transportation. In a simulation case study, the vehicle is equipped with two identical parallel hybrid power units (PU), which form the propulsion system. Each PU consists of a diesel internal combustion engine (ICE) and an electric motor/generator unit (MG), which is placed on the engine output shaft center, see Figure 2. The angular velocities of ICE and MG can be decoupled by a clutch (CL). The gearbox (GR) is a six-speed automatic transmission with a hydrodynamic torque-converter on its input shaft. As energy storage unit, an electrochemical lithium-ion accumulator (BAT) is used in each PU. Furthermore, Figure 2 shows the arrangement of the auxiliary loads, comprising electric auxiliaries (AUX) and mechanical power take-offs (PTO) at the ICE, like the hydraulic fan. Table 1 shows a more detailed specification of the vehicle and system components.
In the simulation case study, a system configuration is analyzed, where two identical PUs operate synchronously. It means, for example, that the power demand for the ICE calculated by the PMA is identical in both PUs. It is possible and, moreover, from an efficiency perspective rather beneficial to consider two PUs that are logically linked but operated individually. Such an operation strategy, however, is not state-of-the-art yet because a high voltage link between the electric circuits of both PUs would be required. Figure 3 outlines a system configuration with two PUs, which are linked on their electric circuit and share a joint battery. The second combustion engine is masked, which implies that such systems enable to restore one ICE. This is possible because—compared to a conventional non-hybrid system—the hybridization increases the system power considerably. Thus, considering track profiles and mission scenarios with a relatively low traction power demand, it is feasible to remove one of the ICEs and compensate the loss of traction power with the MGs. It becomes clear that even quite conventional propulsion system configurations of DMUs with two PUs can differ significantly by their design and operation, not to mention systems layouts with more than two PUs. This shows the necessity of a highly flexible PMA approach for off-highway hybrid systems.

2.2. Drive Strategy

Optimizations of the drive strategy to operate a DMU on a given track are the object of research in many publications. Often dynamic programming (DP) algorithms are used to optimize the velocity trajectory of hybrid vehicles [19,25]. Due to the fact that DP requires a high computational power, they are not real-time capable. Recently, approaches have been proposed where the DP algorithm is outsourced and computed on a cloud computing platform. The optimized velocity profile is sent back to the vehicle afterwards [26]. Such approaches have significant potential to reduce fuel consumption.
However, for the simulation case study in this paper, a more simple drive strategy is used. Initially, a mission specification for the track, on which the DMU is operated, is defined. It specifies the driving distance, drive and stop durations as well as velocity limits of each track sequence. Based on this information, a driver simulation model, implemented in Simulink and Stateflow, computes the requested velocity profile. The objective of the driving strategy is the reduction of the DMU’s energy consumption traveling on the tracks considering all the specified constraints (driving duration, velocity limits etc.). For this purpose, the algorithm aims at minimizing the cruising speed, considering the quadratic influence of velocity on the required traction force, see Equation (1). To operate the vehicle at a cruising speed as low as possible, the driving strategy asks for maximum acceleration and deceleration in the particular parts of each track sequence. Acceleration and deceleration demands are restricted by the performance capabilities of the PU, vehicle limitations or even operational boundaries, like a deceleration limit of −1 m/s2 due to comfort considerations. In DMUs with conventional PUs, such a drive strategy, where the energy consumption is minimized, is considerably simple and leads to good results. Due to its simplicity it is fairly realistic that a human DMU operator in real world driving can easily track such a velocity profile.
For a hybrid system with energy storage unit, the possibility of a recovery of kinetic energy arises. For the hybrid drive strategy, hence, the algorithm of the driver model retards the deceleration phase. The strategy demands the vehicle to decelerate with a constant brake power, equivalent to the maximum mechanic brake power of the MG. This leads to slightly higher cruising speeds and, thus, energy consumption, but also significantly increases the amount of recuperated energy. Therefore, this drive strategy is used for hybrid operation mode.

3. System Simulation Model and Validation

The virtual vehicle and propulsion system are built up as a dynamic simulation model in the simulation environment GT-SUITE. GT-SUITE library blocks are used to model the physical components as well as to implement the basic control functions belonging to the components. Physical components and functions are combined to so-called compounds and archived in a compound library. The compounds possess standardized interfaces to enable a high degree of modularity, which allows to build simulation models of various system configurations for diverse applications. Each component provides the actual values of its physical state variables as well as their maximum and minimum values for each of them, as model outputs. More complex control algorithms, like the PMA, are realized in MATLAB/Simulink and Stateflow. The Simulink models can be compiled to dll-code and implemented in the GT-SUITE environment. The simulation models are suited for performance simulations, controls development, system parameter and configuration optimizations as well as hardware-in-the-loop testing.

3.1. Modelling System Components

This section gives a brief overview over the physical modeling theory and the equations, which the component models are based on. Furthermore, the predefined objects of the GT-SUITE library, which are used for the particular component models, are presented. Additionally, the most important model parameters are specified.

3.1.1. Vehicle Model
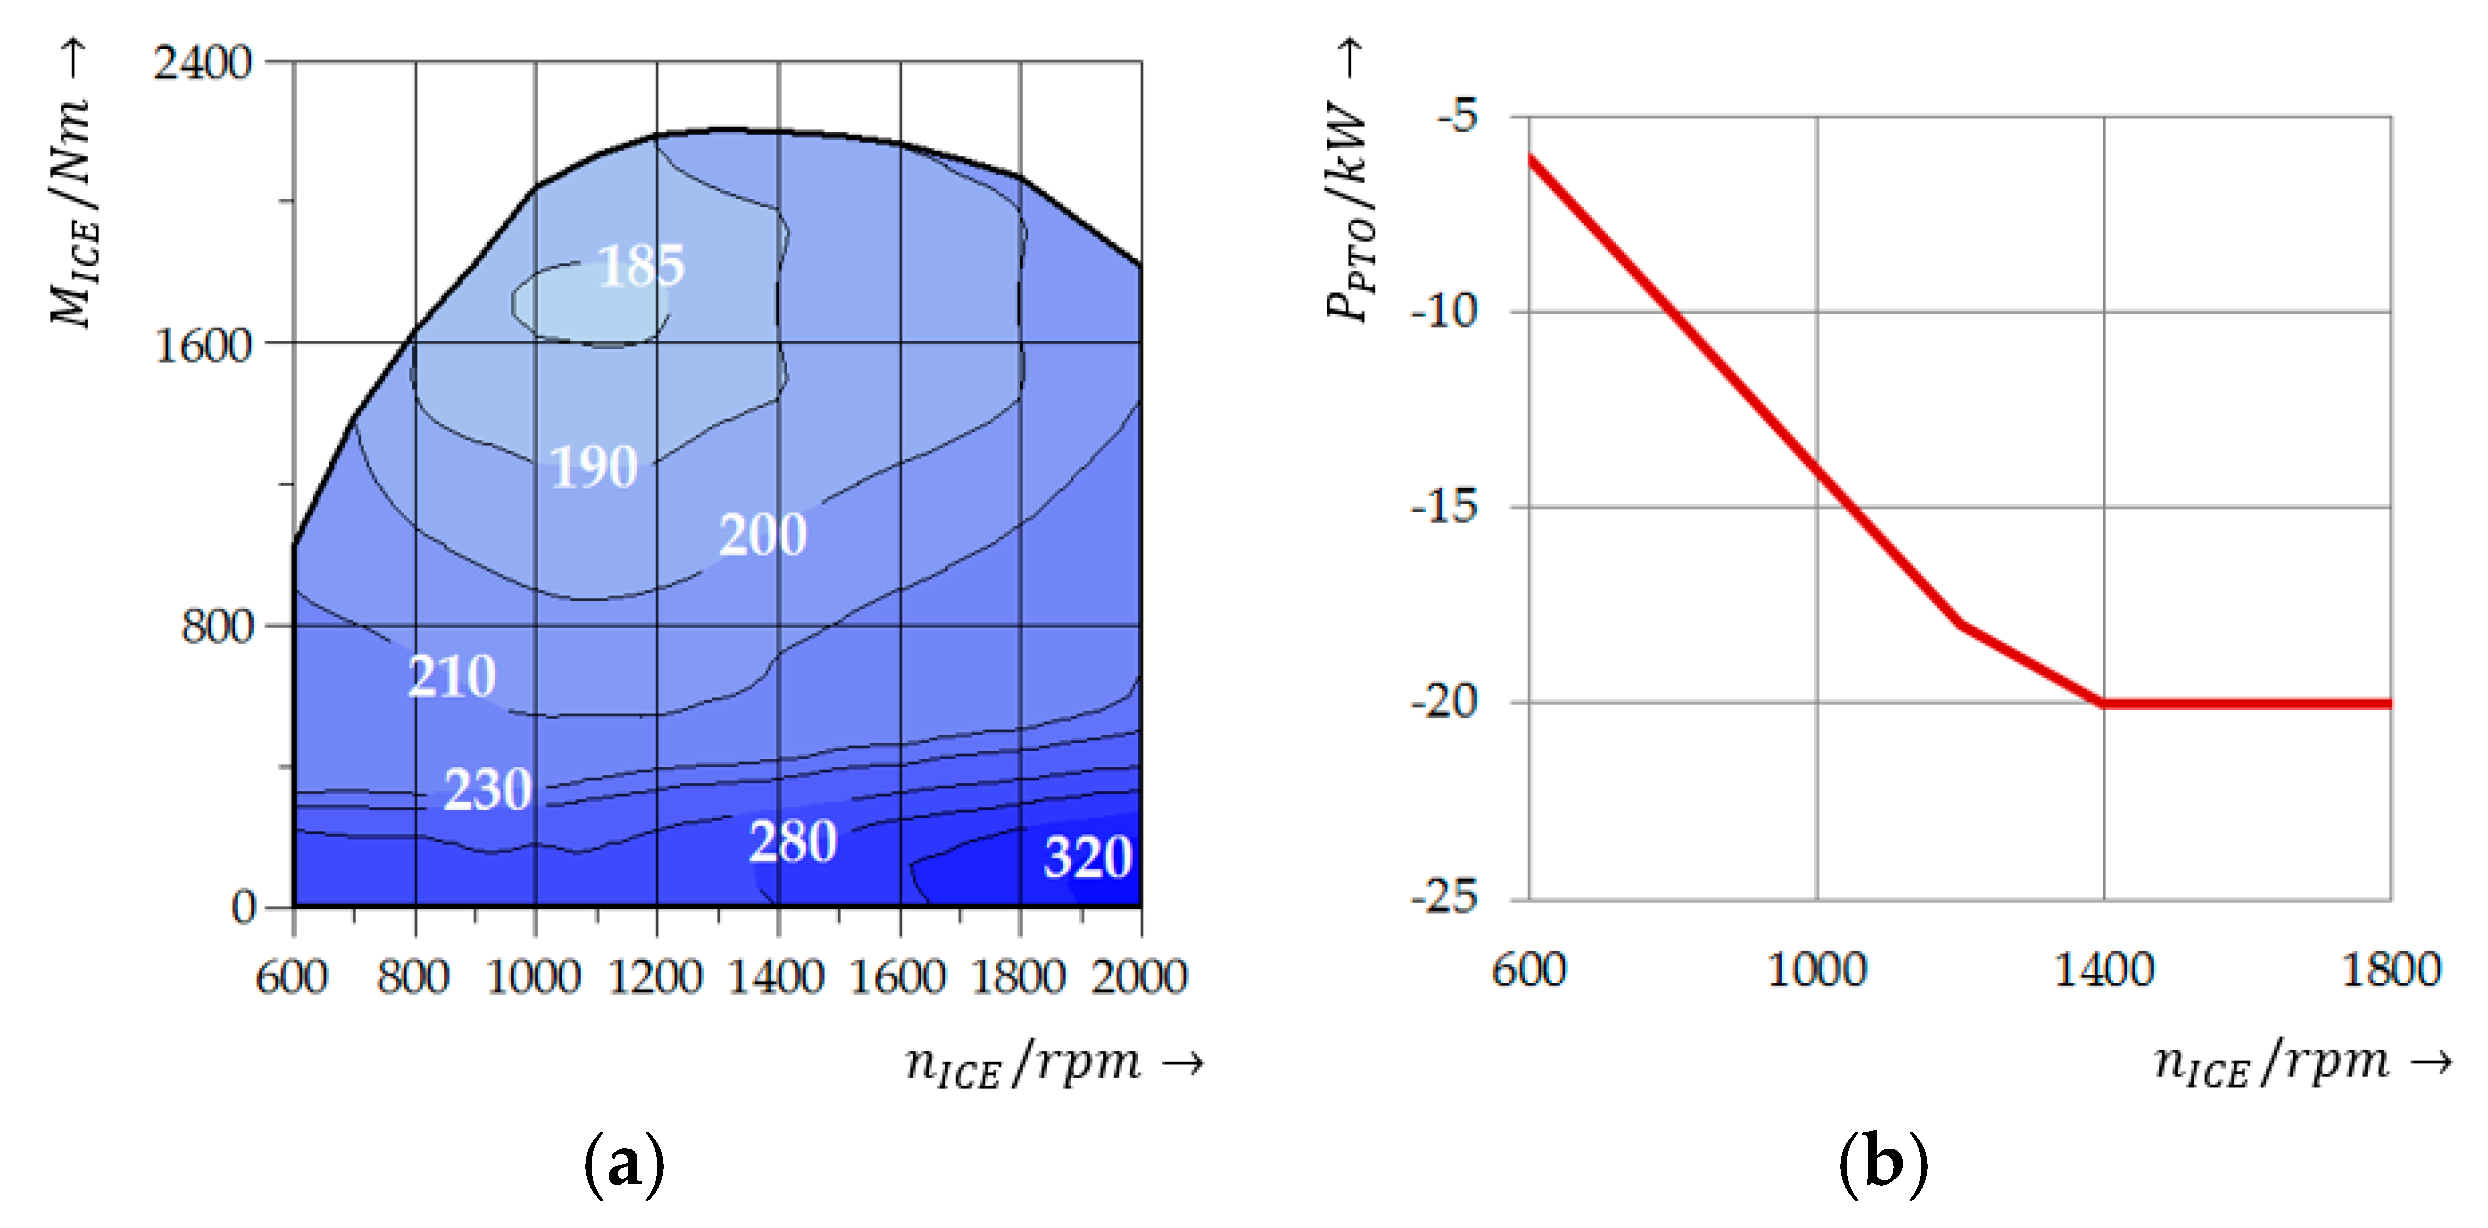
The dynamic vehicle simulation model uses the “GT VehicleBody”, which is based on the equation of motion. The traction force F T r is equal to the sum of all drive resistance forces:
F T r ( t ) = c r   m   g cos ( ) + 1 2 c D A   ρ   v ( t ) 2 + m   g sin ( ) + ( m + θ r e d r d y n 2 )   v ˙ ( t )
with track inclination , air density ρ , vehicle velocity v and the reduced mass moment of inertia θ r e d . The required input traction torque M D r i v e to the vehicle differential is calculated by:
M D r i v e ( t ) = F T r ( t ) r d y n η D i f i D i f ( t ) .
Table 2 gives an overview over the most important vehicle model parameters.

3.1.2. Engine Model

The engine simulation model used in this case study is based on the “GT EngineState” object. It computes fuel consumption using a static brake specific fuel consumption ( b s f c ) map, see Figure 4a. The fuel consumption F C I C E is calculated by:
F C I C E ( t ) = 0 t M I C E ( τ ) ω I C E ( τ ) b s f c ( τ )   d τ
The angular velocity ω I C E of the ICE in r a d s e c (or n I C E in r p m ) follows from
ω ˙ I C E ( t ) = M I C E ( t ) + M P T O ( t ) θ I C E
with the engine torque M I C E , the mass moment of inertia θ I C E of the ICE and the mechanical auxiliary torque M P T O . The mechanical auxiliaries or PTOs (power-take-offs) are directly linked to the engine output shaft. In the real vehicle, M P T O is a function of both angular velocity and PTO load, which depends on coolant or boost temperatures etc. In the simulation model, M P T O or P P T O is a function of the engine angular velocity, whereas the load is set constant, see Figure 4b.

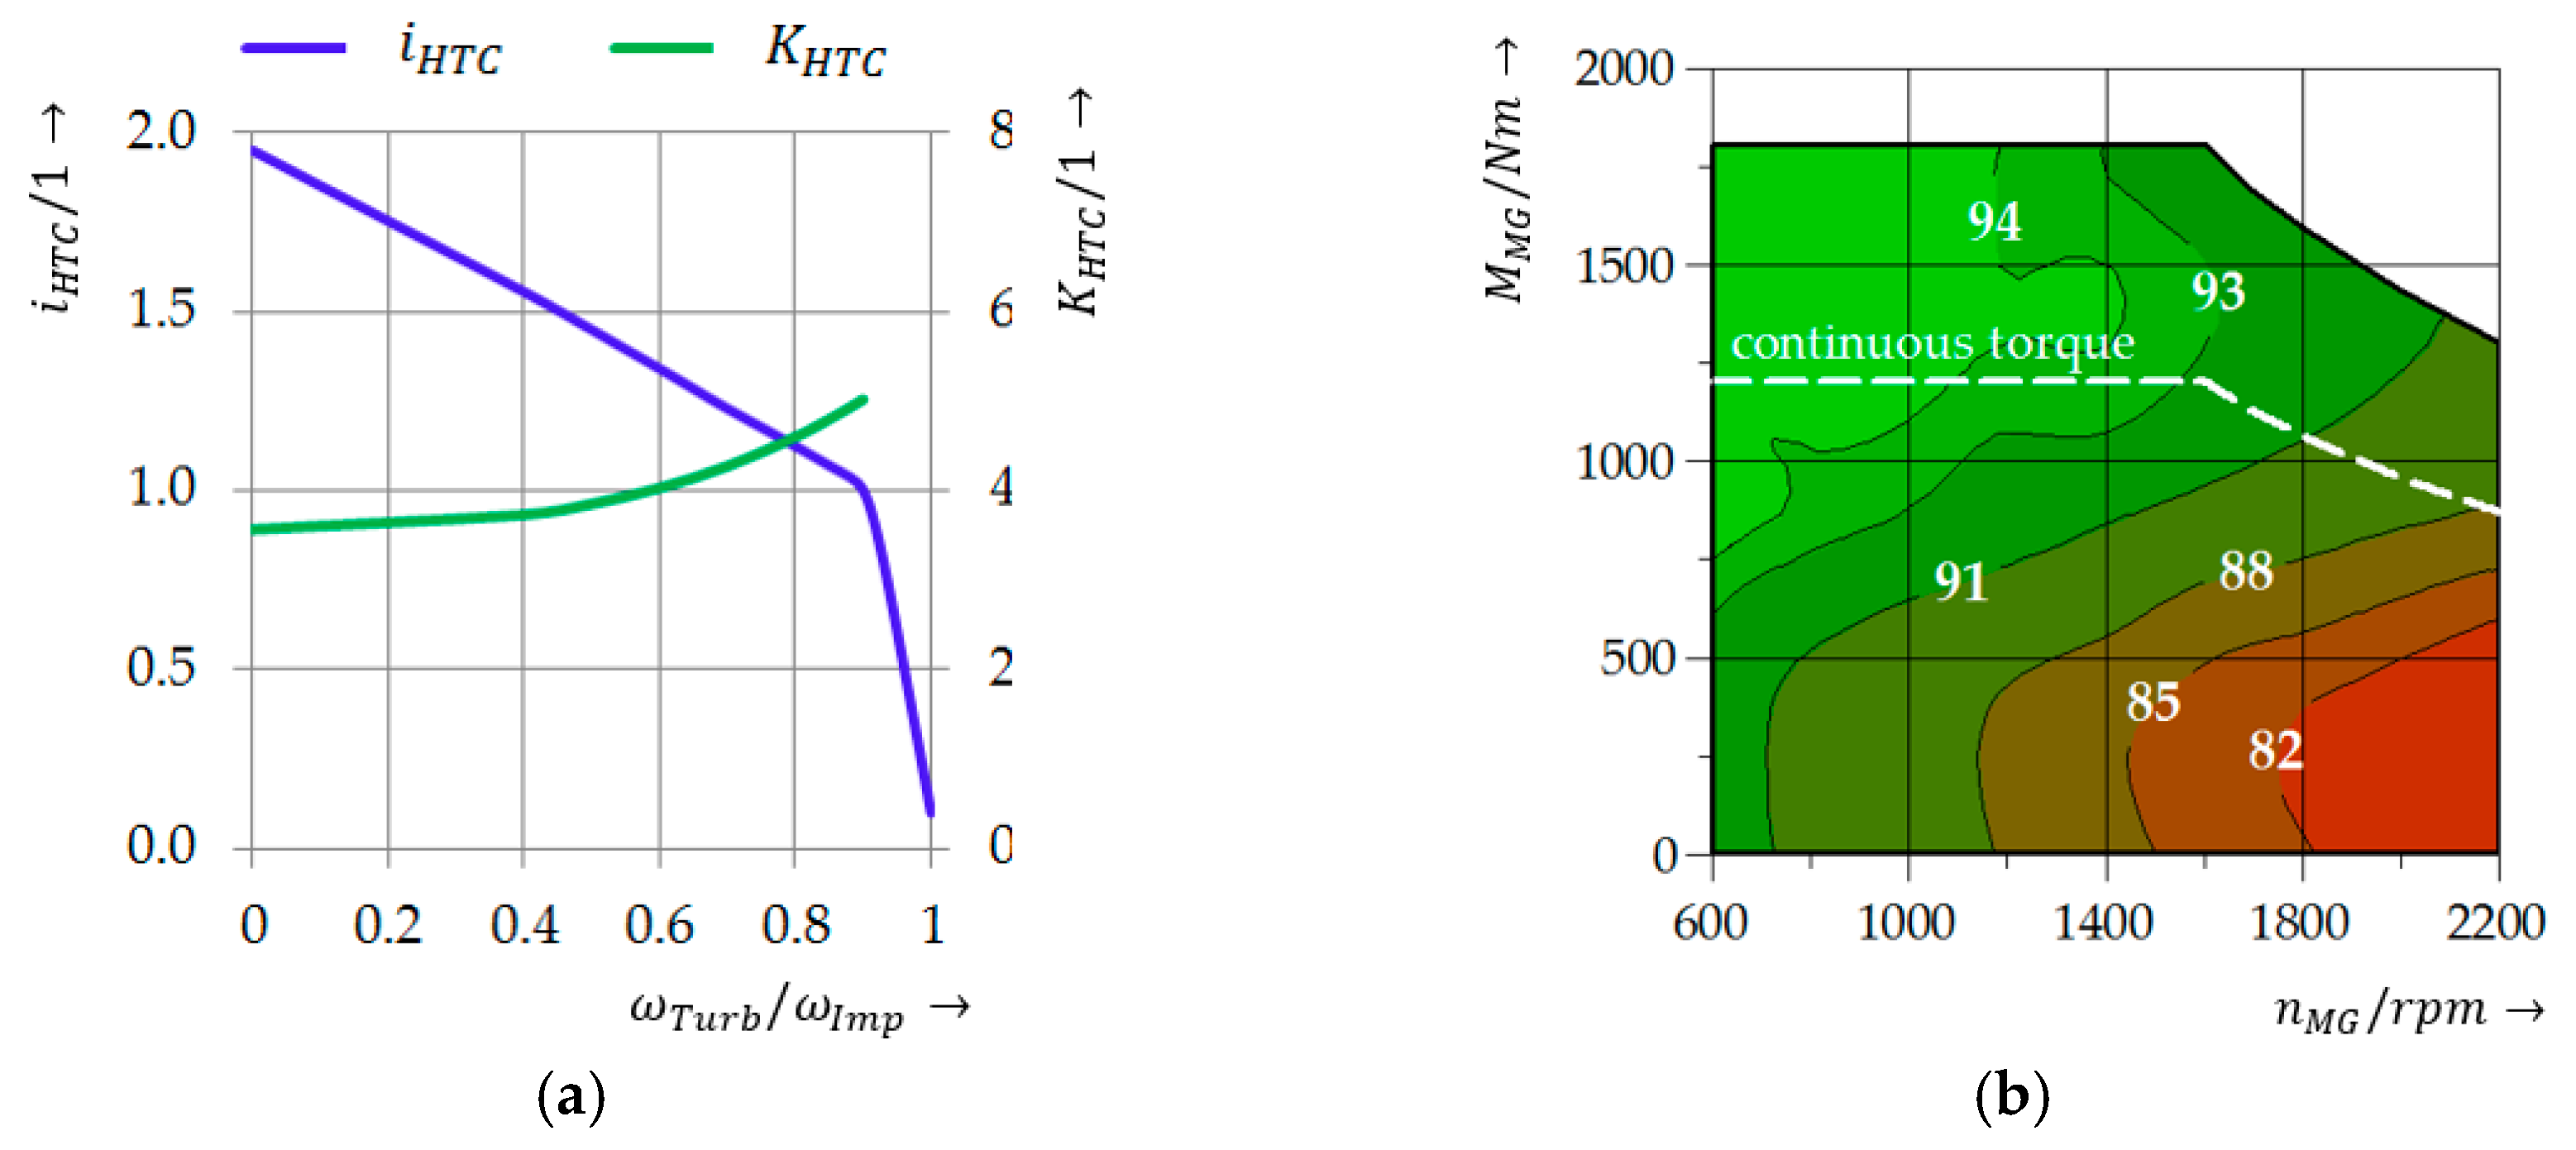
3.1.3. Gearbox Model

The gearbox is a six-speed transmission with a hydrodynamic torque converter (HTC) and transmits the input torque M G R to the vehicle differential input shaft. The model consists of a continuously-variable gear set, a HTC including a model of the torque converter clutch, and the controls module. It manages the clutch actuation and gear shifts. The controls are implemented in Simulink and integrated into the GT-SUITE model as dll-file. The required gear is computed externally by one module of the power management. The gearbox output torque is calculated by:
M G R = M I C E + M P T O + M M G ,
M G R _ o u t = η G R i G R M G R
(valid at closed torque converter clutch) with the MG effective torque M M G and the gear ratio i G R . For simplicity, the gearbox efficiency η G R is set constant. The HTC enables the railway vehicle to accelerate with high traction forces. In gears with a gear ratio of z > 1 it is “deactivated” and locked with a torque converter clutch. To calculate the turbine torque of the HTC, M T u r b the impeller torque M I m p is multiplied by the torque ratio i H T C , which is taken from the torque ratio table in Figure 5a. The impeller torque is calculated using the capacity factor K H T C .
M I m p = ( ω I m p K H T C ) 2   with   K H T C = f 1 ( ω T u r b ω I m p ) ,
M T u r b = i H T C M I m p   with   i H T C = f 2 ( ω T u r b ω I m p ) .

3.1.4. Motor/Generator Model

To determine the electro-mechanic losses in the MG model, the efficiency η M G is interpolated linearly from a map, see Figure 5b. Beside the losses of the MG itself, it also includes the electric efficiency of the electric converter. From the mechanic power P M G and the efficiency, the electric power in the generator mode becomes P e G e n = η M G P M G , whereas the motor mode is characterized by P e M o t = P M G η M G . Generally, electric machines are capable of running on overload for a restricted period of time. The overload duration is thermally restricted. Therefore, the MG involves a simple heat model to simulate heating and cooling sequences:
m c d T d t = Q ˙ L o s s ( t ) + Q ˙ C o o l i n g ( t ) .
The product of mass m and specific heat c (here for iron) represents the time constant of the differential Equation (9) and depends on the MG size. The heat flows follow from:
Q ˙ L o s s ( t ) = ( 1 η M G ( t ) ) P M G ( t ) ,
Q ˙ C o o l i n g ( t ) = α w A ( T C o o l a n t T ( t ) ) .
The parameters m ,   α w ,   T C o o l a n t and A for this simplified approach are set to match pre-defined heating-up and cool-down times as well as to reach thermal steady state at the rated continuous power of the MG. The internal control routine of the MG model deactivates the overload mode and reduces the maximum power as soon as a temperature threshold is exceeded. MG power in overload mode is increased by a factor of 1.5 compared to the continuous operation mode, see Figure 5b.

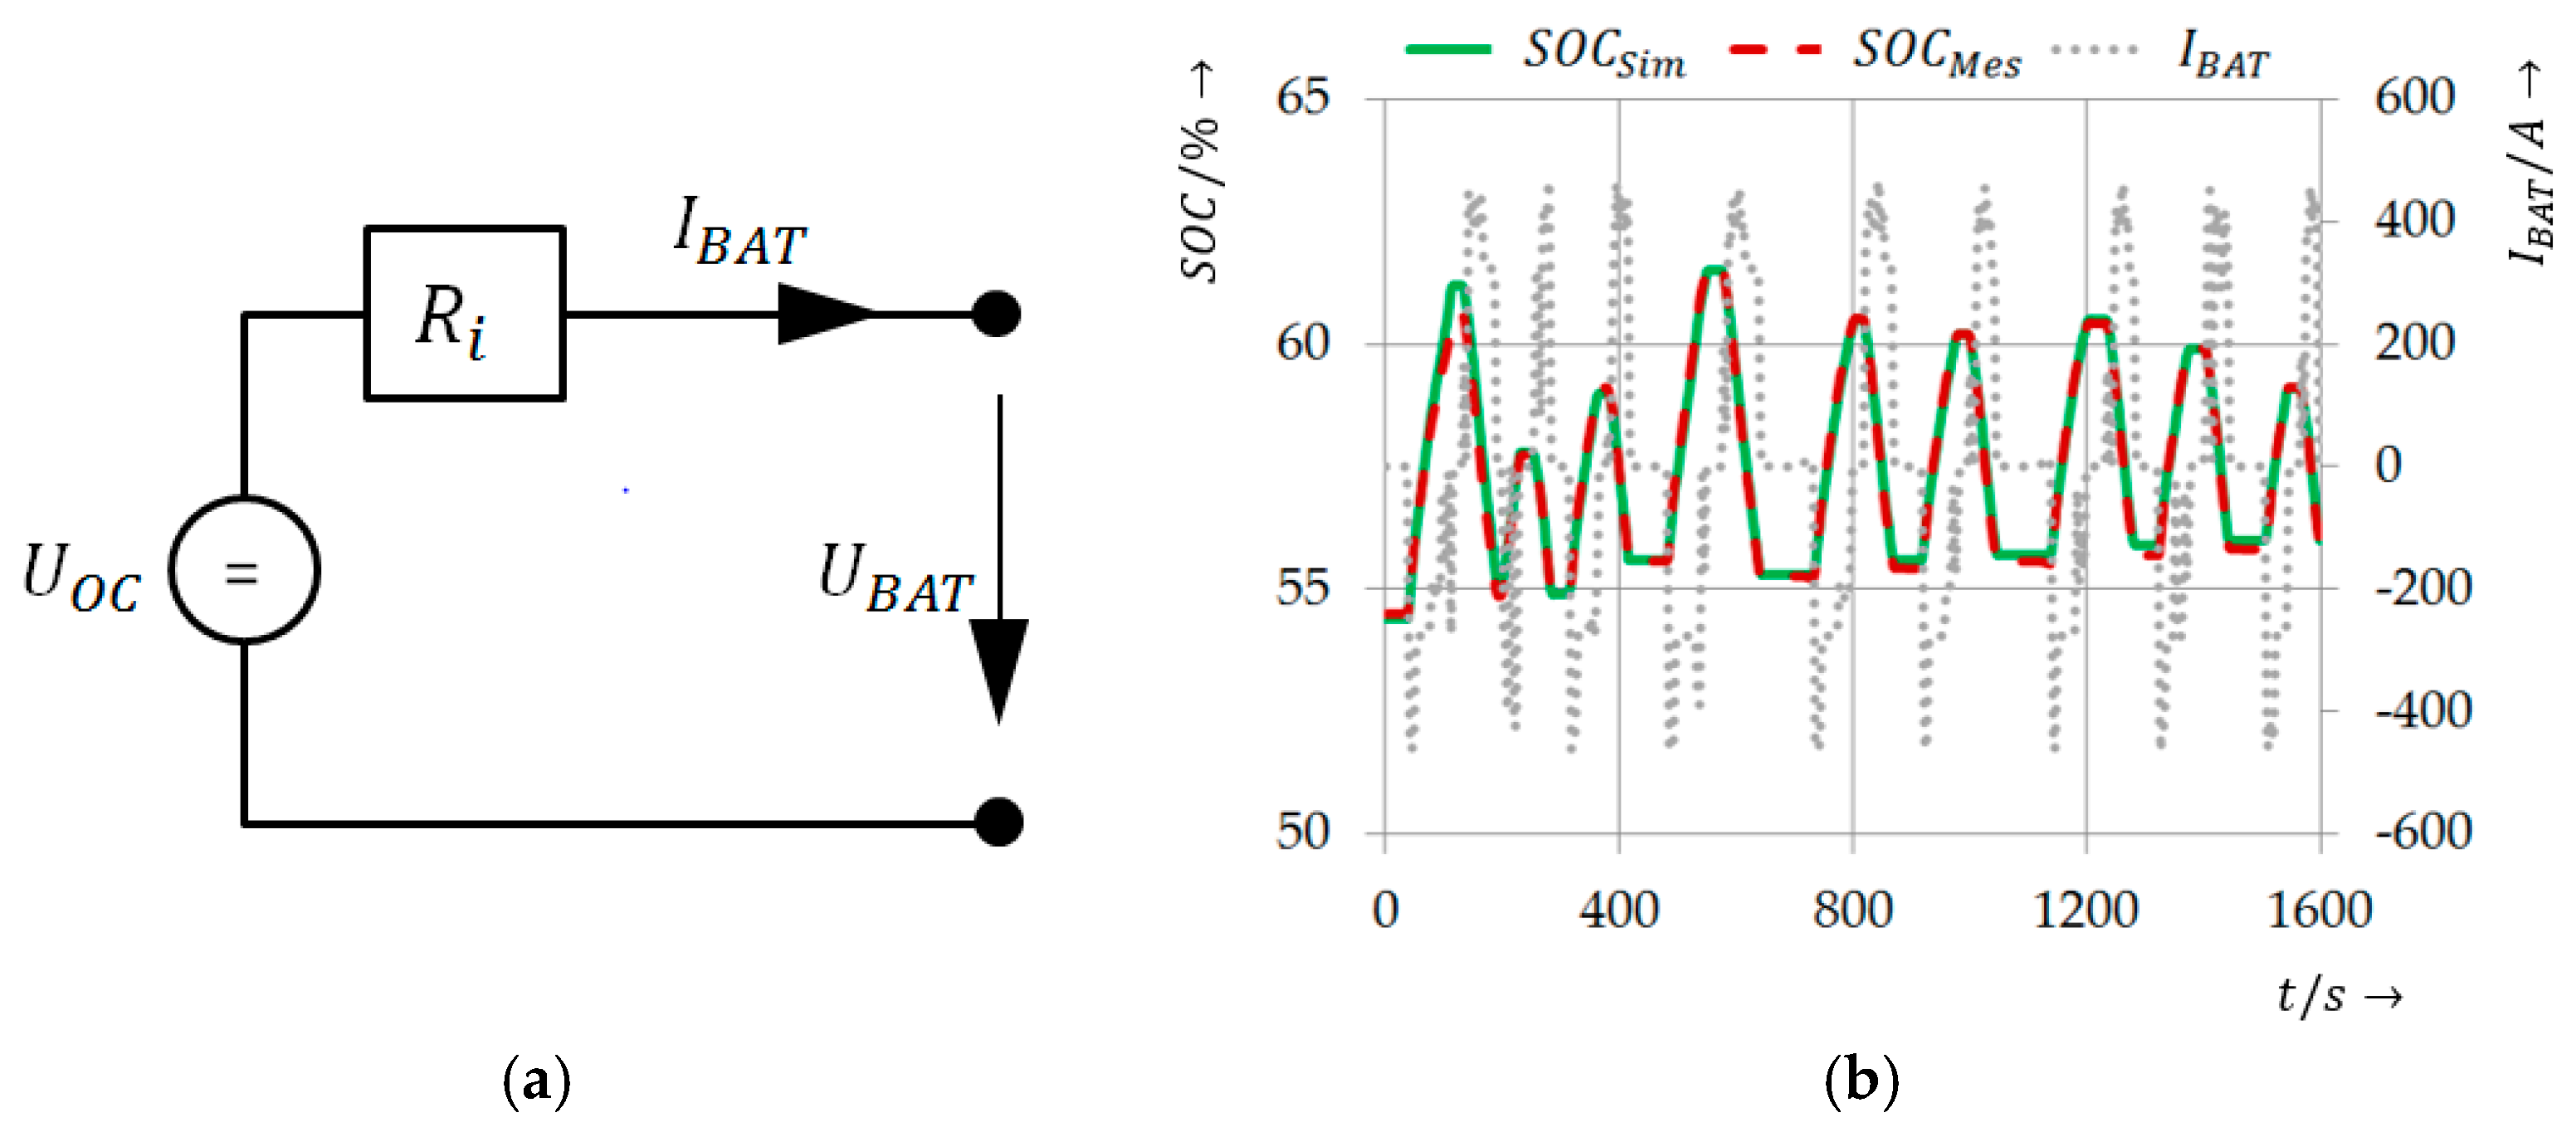
3.1.5. Battery Model

The battery model is based on the equivalent electric circuit shown in Figure 6a. The voltage of the battery U B A T follows from Kirchhoff’s voltage law for the illustrated equivalent circuit:
U B A T ( t ) = U O C ( t ) R i ( t ) I B A T ( t )
The open-voltage circuit U O C represents the equilibrium potential of the battery, which corresponds to the number n s e r of battery cells connected in series (13). The battery stack capacity C B A T follows from the number of parallel linked battery cells n p a r , with:
U O C = n s e r U c e l l ,
C B A T = n p a r C c e l l .
The internal resistance R i of the battery in (12) is taken from 2-D lookup tables parametrized for each battery cell type. For charging and discharging events, different tables of R i ( S O C ) as a function of battery state of charge S O C are employed. From the power sum at the electric circuit, the battery current I B A T can be calculated. Beside the MG, a further power sink of the electric circuit is the electric auxiliary power P e A u x :
I B A T ( t ) = P e M G ( t ) + P e A u x ( t ) U O C ( t ) .
The integration of I B A T according to (15) leads to the battery S O C . It is one of the most important input variables of the PMA of a hybrid propulsion system, because it represents the energetic status of the energy storage. It is often the reference to trigger mode switches between various system operation modes. S O C 0 is the initial state of charge value of the battery:
S O C ( t ) = S O C 0 + 0 t I B A T ( τ ) C B A T   d τ .

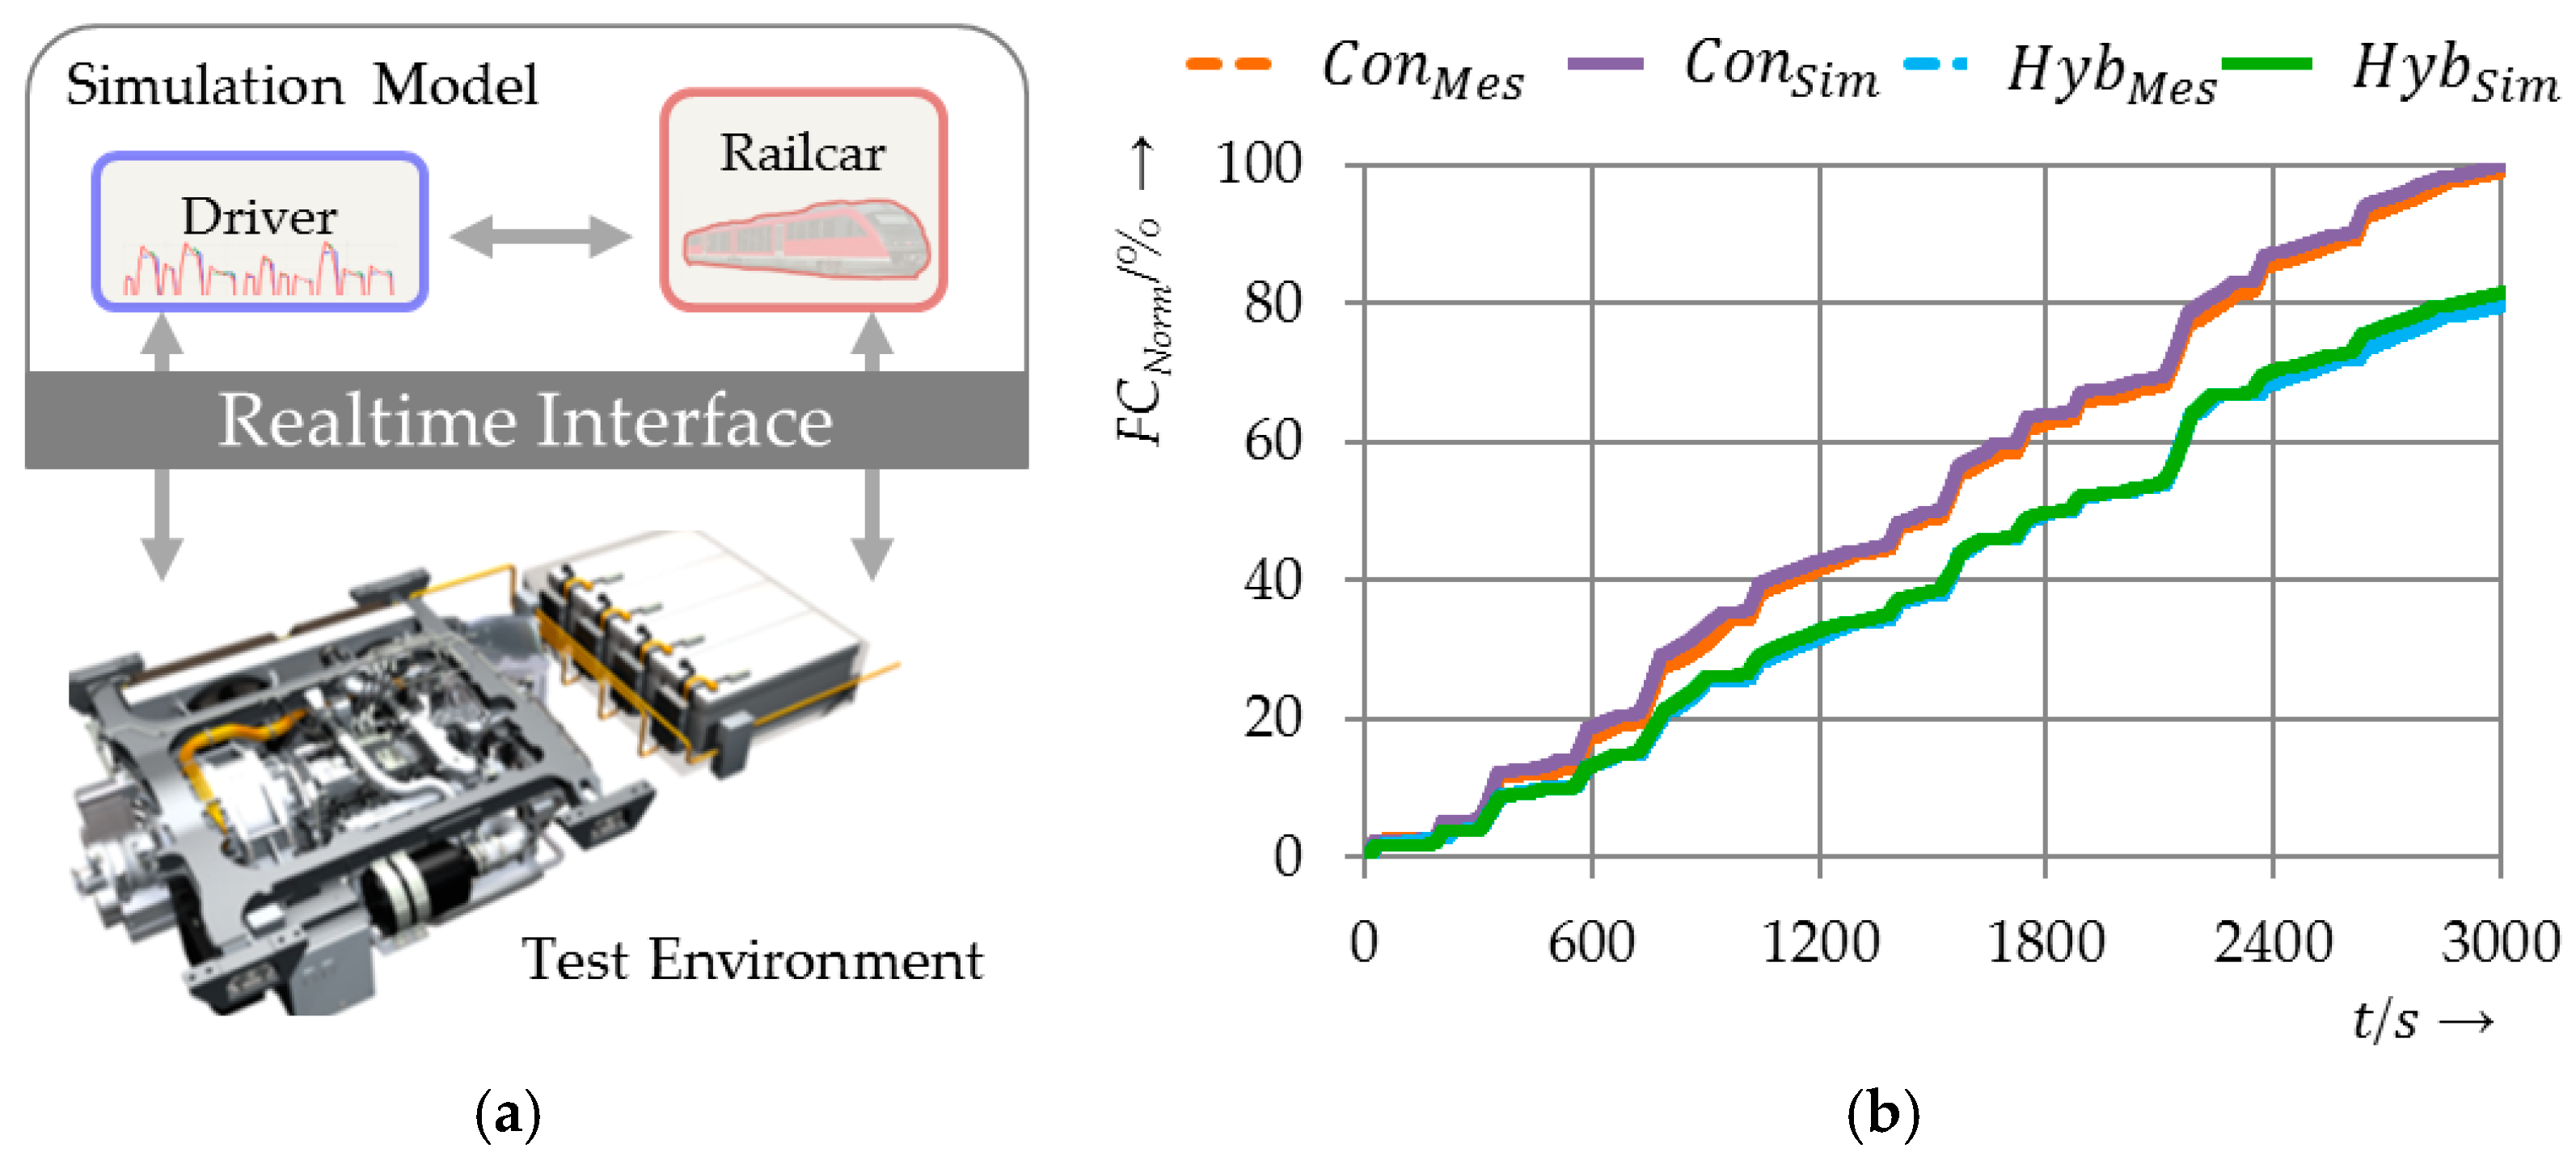
3.2. Model Validation

This section gives a brief overview of the model validation. The component models outlined in the previous section are used for open- and closed-loop component tests. The measured data of those tests contributes to a further improvement of the model accuracy.

3.2.1. Battery Model Validation

For model parameterization and validation purposes, measured data from open-loop battery tests was used. In the test procedure, a battery prototype on a battery test bench with a DC/DC power source was stressed with a battery current profile simulated beforehand. The current profile results from a simulation of a DMU with two hybrid PUs operating in regional passenger transportation. Battery state variables as voltage, current and S O C are measured. Afterwards, simulations of the battery were executed to optimize the internal resistance tables in the battery model for a minimum deviation of measured and simulated values for voltage and S O C . The optimization is based on Brent’s algorithm [27]. Figure 6b shows a good matching between the calculated and observed S O C .

3.2.2. Powertrain Model Validation

In more extensive test campaigns of the whole propulsion system, validation data for the PU model was recorded. For this purpose, a prototype of a MTU hybrid PU was installed on a system test bench. In hardware-in-the-loop tests (HiL tests), the powertrain on the test bed is coupled with the simulation model of a DMU running on a virtual track. The test bed automation system is linked via a real-time interface to the simulation model of the vehicle and driver. In such a HiL test environment, performance tests can be executed or software functions are validated etc. Figure 7a gives a schematic overview of the experimental set-up. In Figure 7b, the simulated and measured results for the accumulated fuel consumptions over the whole drive cycle—for conventional and hybrid operation—are compared. The stated results are normalized on the fuel consumption for conventional mode. For the measurements campaign and the model validation, a previous version of the PMA, comprising a rule-based approach, was used. Obviously, the results underline and validate the achieved high accuracy of the simulation models.

4. Hybrid Power Management Algorithm (PMA)

4.1. Problem Definition

The PMA controls the power flow in the propulsion system and optimizes the power split between the ICE and the MG. Based on the optimal control problem [26], a suitable cost functional or performance index J is stated in (17). The cost functional J substitutes a corrected amount of fuel consumption F C C o r of the system in a time interval t [ t 0 ,   t e n d ] . The objective of the PMA is to minimize J and F C C o r over the given drive cycle. F C C o r represents the quantity to evaluate the performance of the hybrid system according to its energy consumption and efficiency:
J = ϕ ( S O C ( t e n d ) ) + t 0 t e n d m ˙ F u e l ( u ( τ ) , x ( τ ) , τ )   d τ
J is calculated by the integration of fuel mass flow m ˙ F u e l in k g s e c , as a function of the control inputs u ( t ) and state variables x ( t ) . The first term in (17) stands for a correction term to penalize the deviation of energy stored in the battery between t 0 and t e n d :
ϕ ( S O C ( t e n d ) ) = λ [ S O C ( t 0 ) S O C ( t e n d ) ] .
Here, λ represents a fuel equivalent factor, which converts the deviation of S O C into a value of fuel consumption in k g % . In contrast to some ECMS control algorithms, where an online adaption of λ is part of the PMA, λ is set constant in this case. It is determined by the amount of fuel, which is needed to balance battery charge deviation, assuming that charging is performed while the vehicle is at standstill (halt) at the end of each drive cycle:
λ = E B A T 100 H u η c h r g o p .
E B A T 100 stands for the maximum amount of energy, which can be stored in the battery at S O C = 100 % . H u is the lower heating value of diesel fuel, and η c h r g o p denotes the charging efficiency at a predefined ICE operation point. This operating point for charging at standstill (halt) is optimized offline for maximum charging efficiency and set as a parameter.

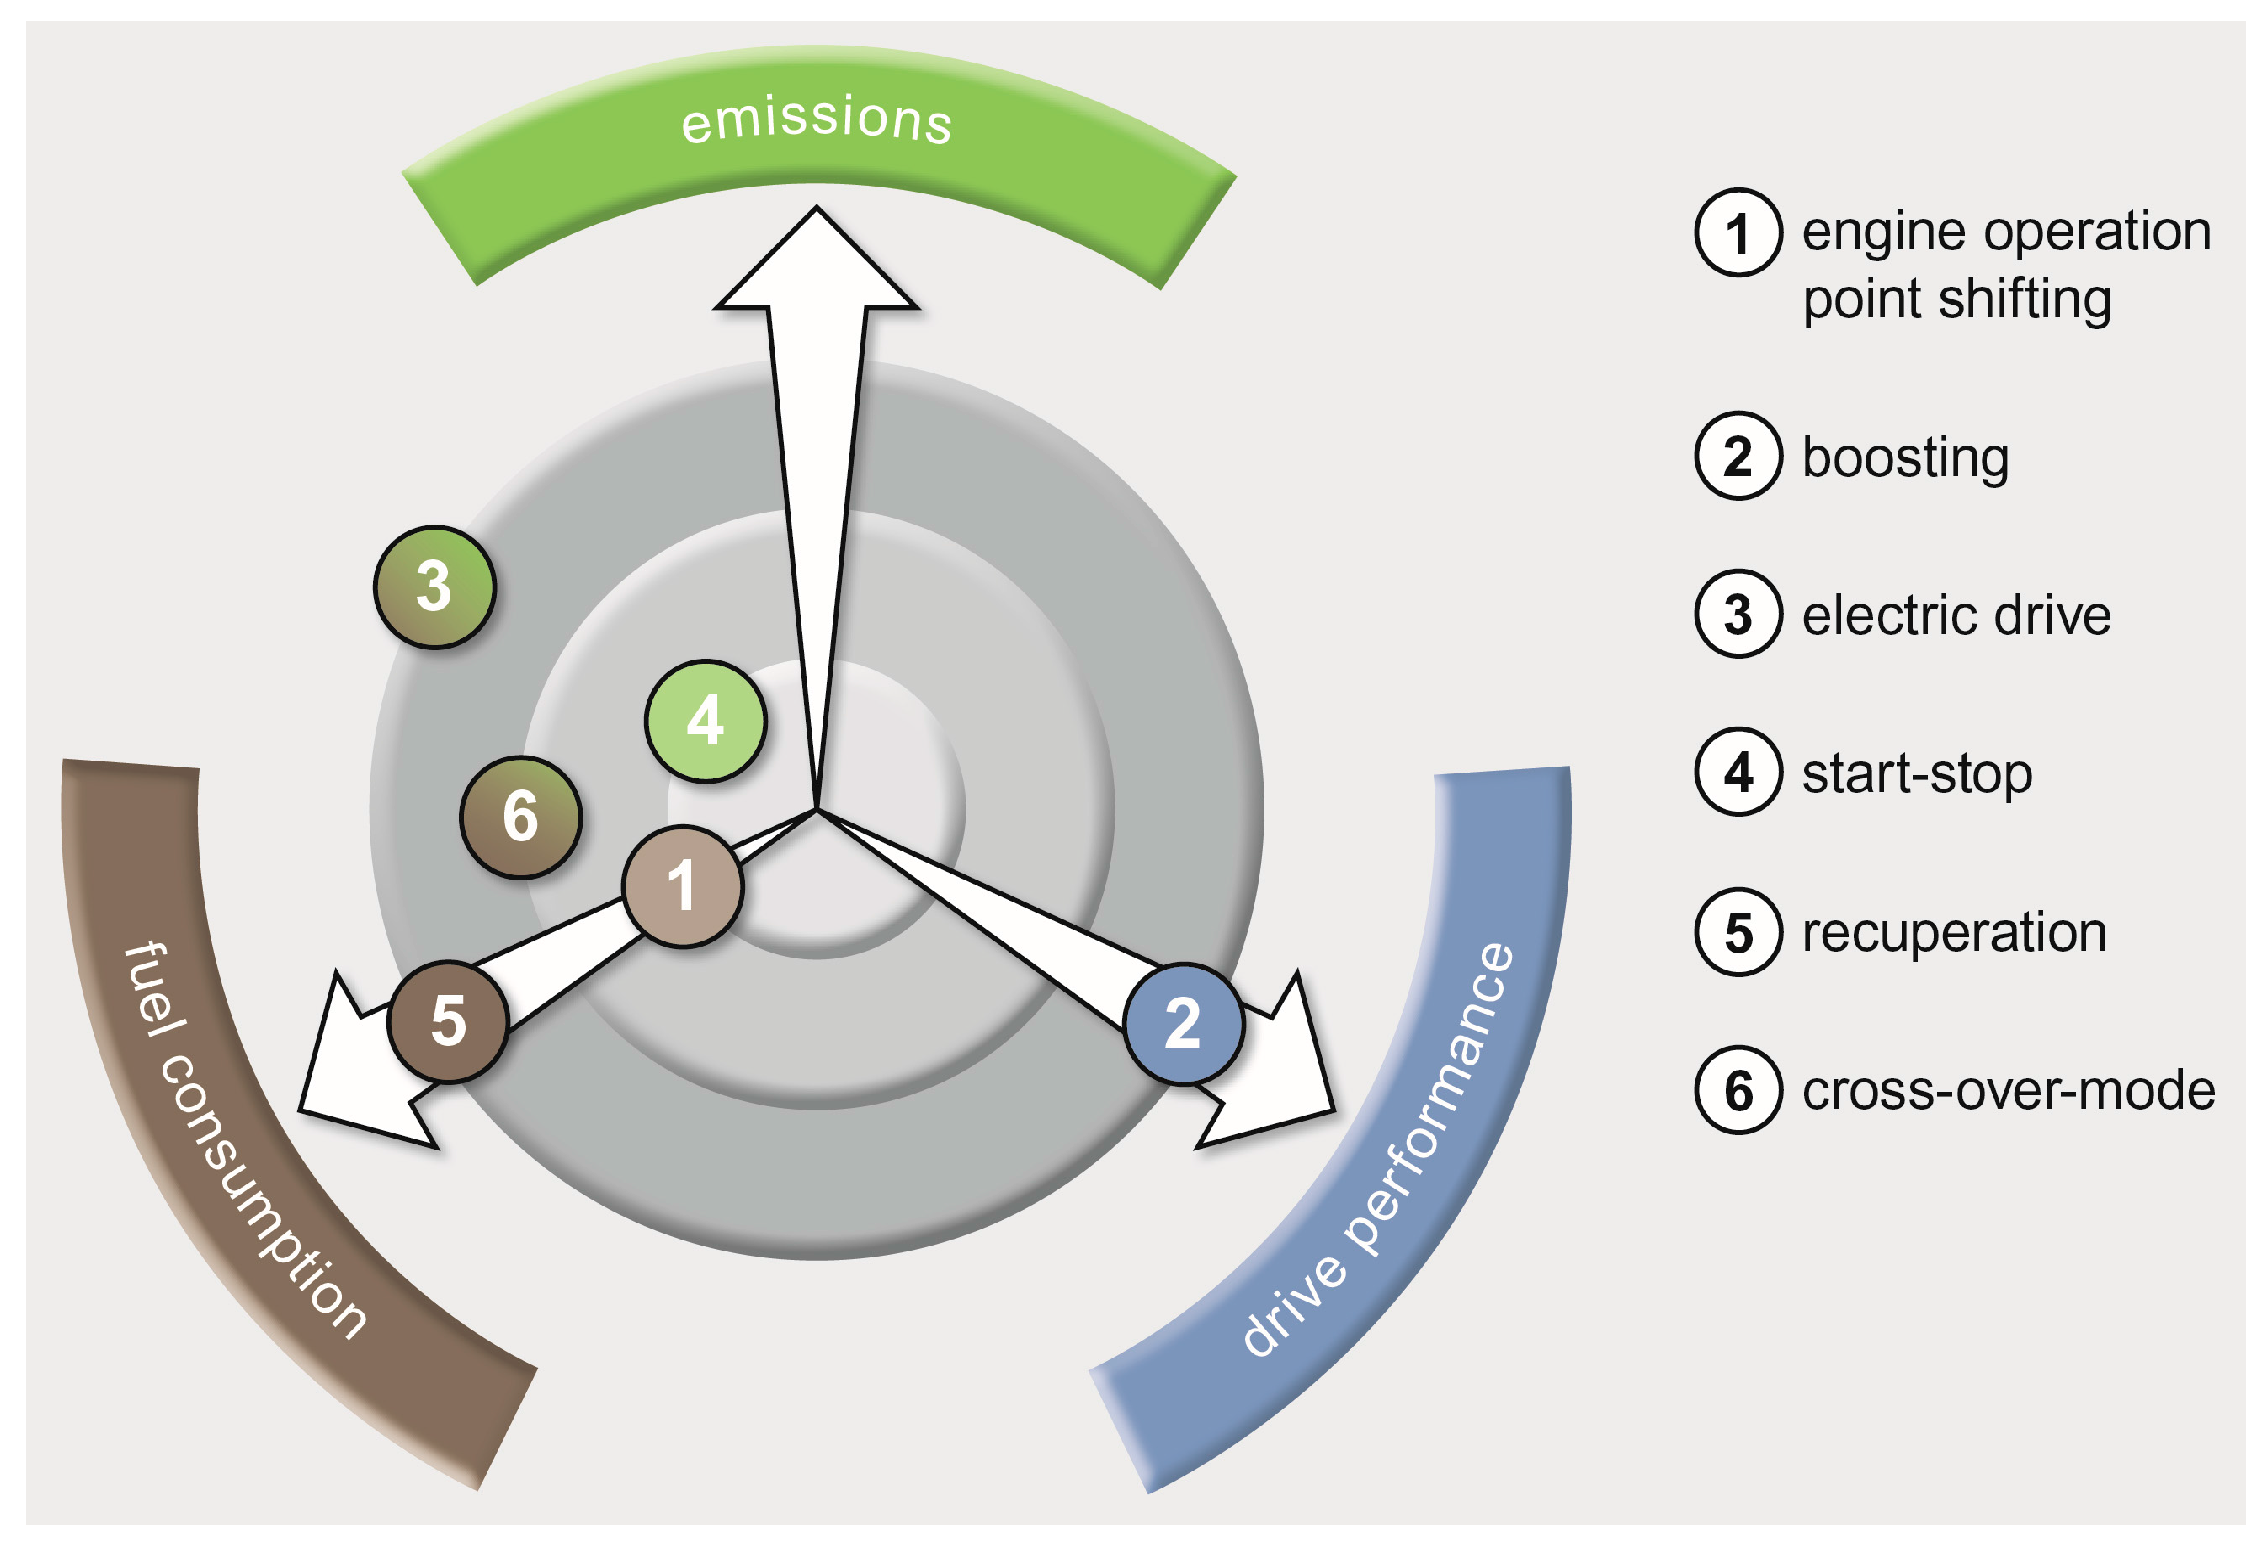
4.2. Hybrid Operation Modes

The configuration of the parallel hybrid system, see Figure 2, enables different operation modes. Table 3 outlines the various operation modes and assigns them to drive events. The drive events result from the requested traction power P T r a c . This table shows the signs of ICE and MG power demands, P I C E and P M G , as well as the time derivative S O C ˙ of the state of charge for the different drive modes. The signs take the auxiliary powers into account: P P T O < 0 at the ICE output shaft and P e A U X > 0 at the electric circuit. In Table 3 the plus sign, +, stands for a power request higher than zero. The minus sign, -, represents a negative power request, whereas, 0, refers to a constant value. The double plus and minus signs indicate very high or low power requests, which for example arise at acceleration or braking events.
During acceleration, two modes are possible. At Pure ICE mode, the traction power is exclusively provided by the ICE. The MG runs as generator and supplies electric auxiliaries. In the Combined Mode, the traction power is split between ICE and MG. During cruising, Pure Electric driving is possible. Furthermore, the battery can be charged by increasing the ICE load. In the case of a negative traction power demand, the deceleration event, the MG serves as generator to recuperate as much energy as possible. The clutch between ICE and MG is opened, to operate the ICE at idle speed. At halt, the vehicle velocity is zero. In Normal Halt mode, the ICE powers the PTO and supplies power for the AUX. If necessary, the ICE load can be increased to charges the battery. Additionally, the ICE may be switched off in Start/Stop mode, and the AUX power is supplied by the BAT. At deceleration and halt events, the different operation modes are triggered according to pre-defined thresholds of the S O C and other state variables. In those events, the PMA is a heuristic rule-based approach, where no optimization is executed. During acceleration and cruising, the optimization routine for P I C E and P M G is active.

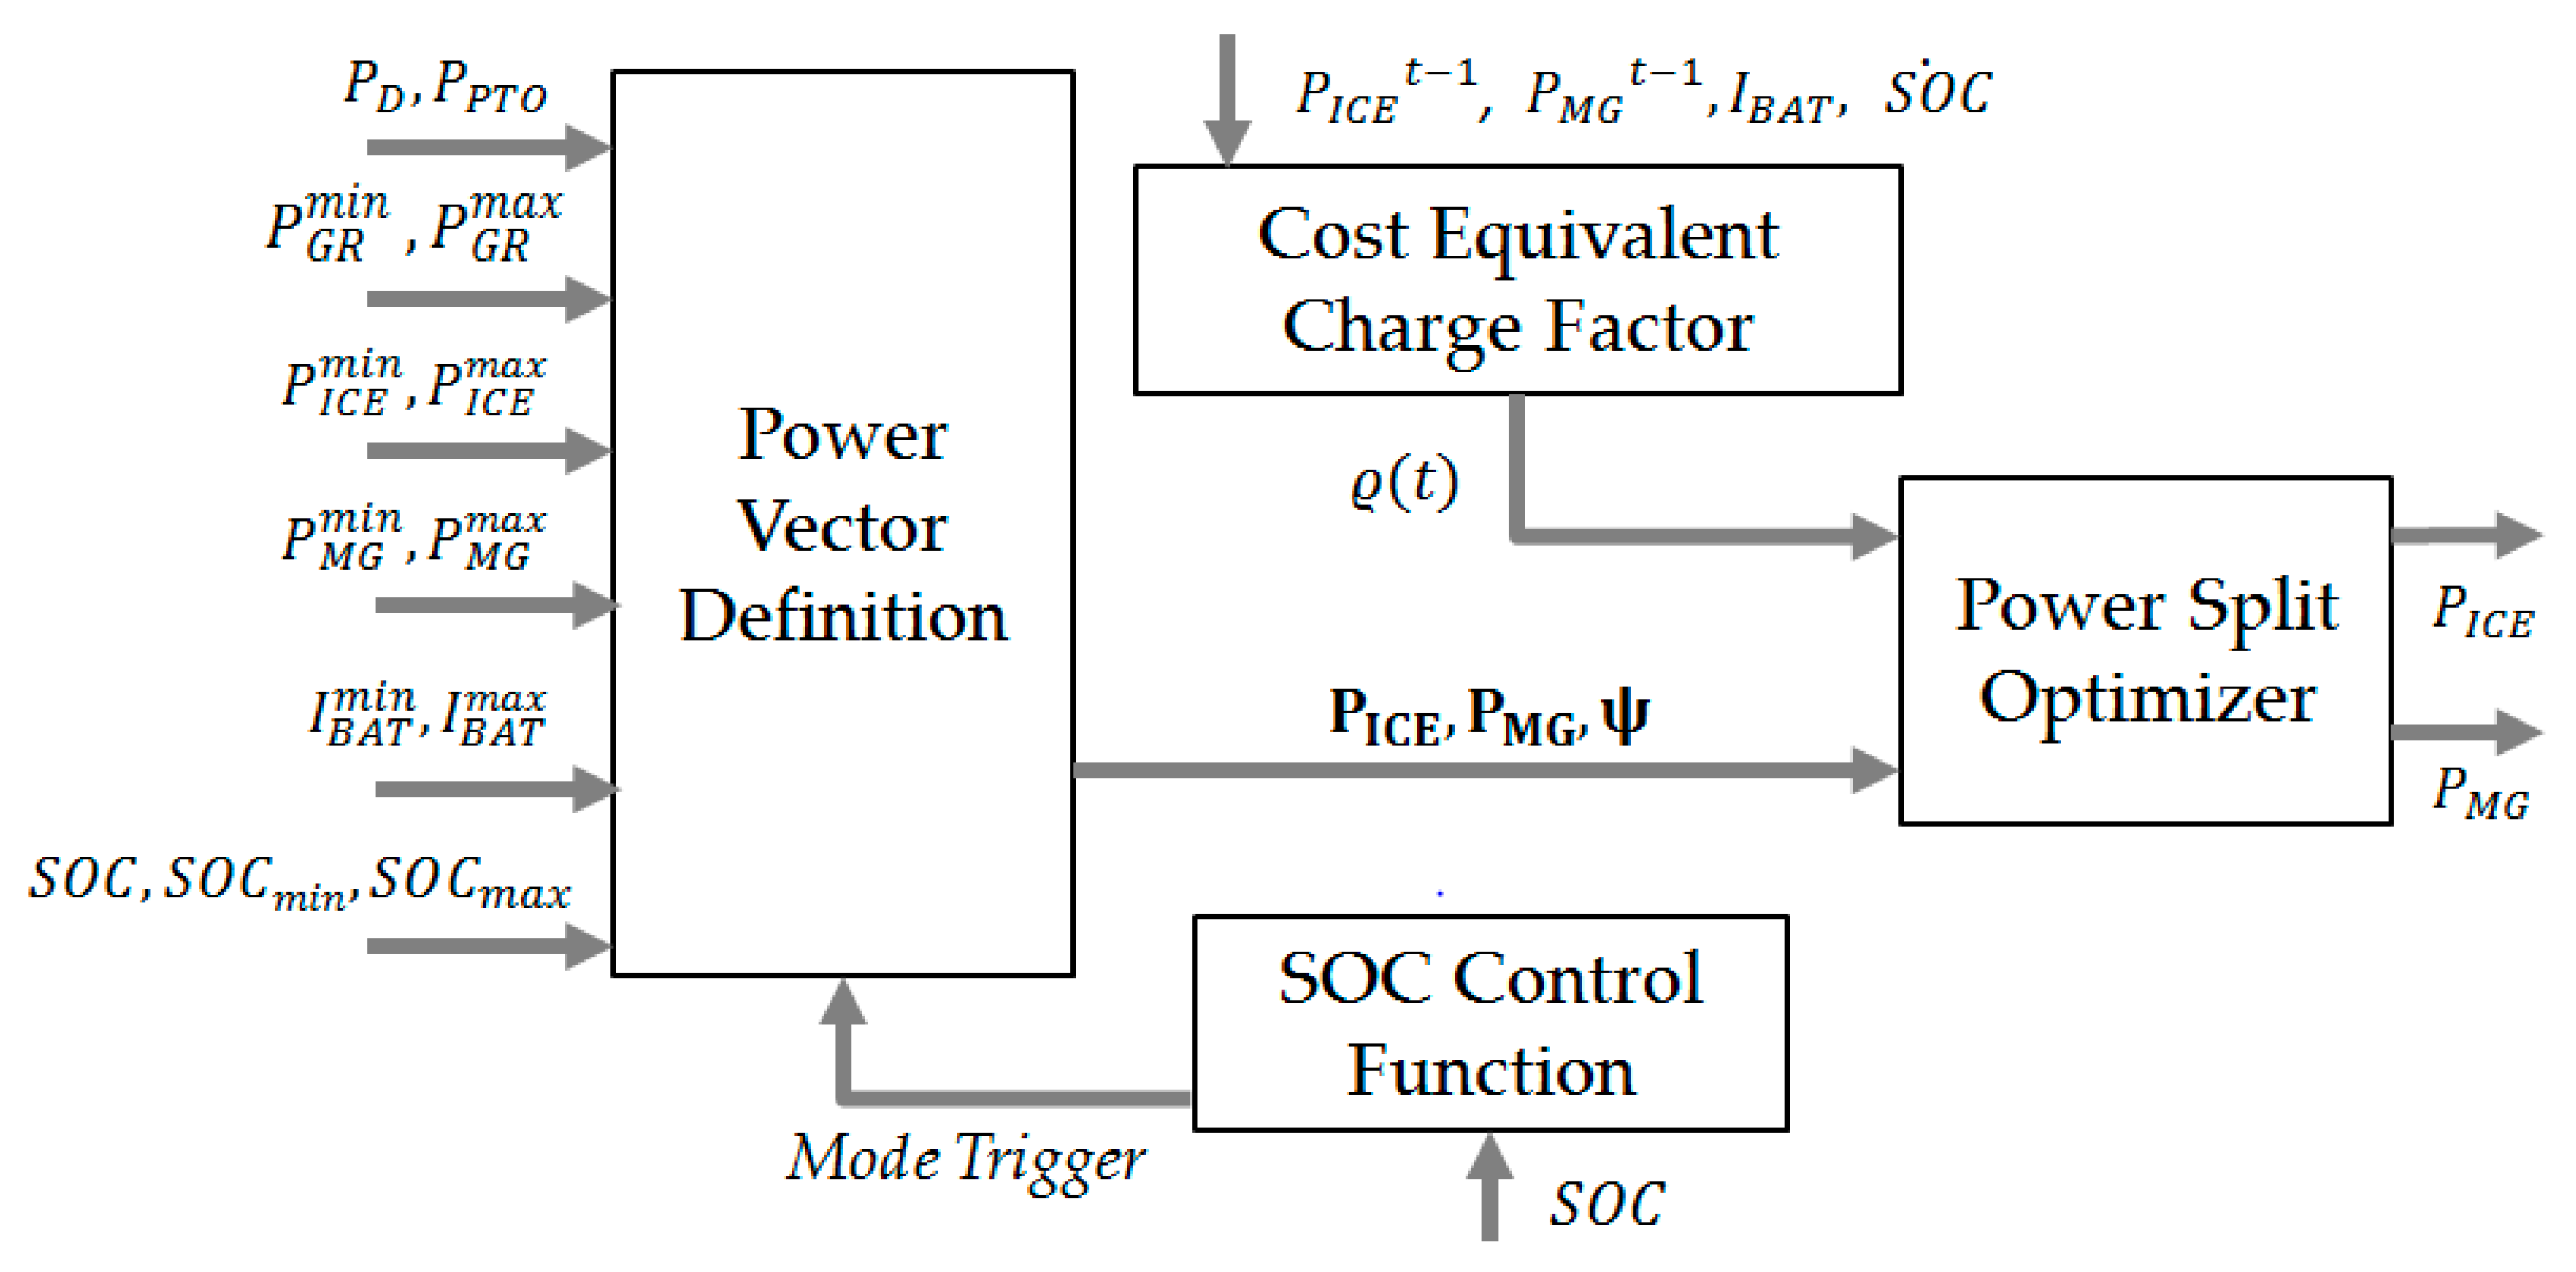
4.3. PMA Optimization Routine

Figure 8 shows a signal flow scheme of the PMA optimization routine including its most important input and output signals. Each block of the scheme represents one function of the routine, which is described in this section. In case of a DMU with more than one PU, P I C E and P M G represent the power demand from the particular power path. This means, for example, that if more than one engine is present, P I C E substitutes the sum of engine power demands. A further function block splits P I C E and distributes the particular share of power to the different engines. In case of PUs running synchronously, as assumed in this paper, power is equally split to the PUs’ machines. In this section, for simplicity, the PMA refers to the ICE and MG, neglecting the fact that more than one of each component is involved.

4.3.1. Power Vector Definition

From the traction power required and the power request of the mechanical auxiliaries P P T O , this function block calculates the propelling power demand P D . It always equals the sum of the power demands, P I C E plus P M G . Moreover, the gearbox input power limitations [ P G R m i n ,   P G R m a x ] as well as further vehicle constraints, have to be considered. In a next functional step, the inappropriate operation modes for the current drive event are rejected. This is necessary because the battery S O C always has to be in a valid state of charge range, S O C m i n S O C S O C m a x . If, for instance, S O C is above its maximum value, Charge Mode is prohibited. Based on the feasible modes and constraints regarding the ICE, MG and BAT the maximum and minimum values for the power split ratio ψ are defined. From those extremes, the operation point vectors ψ , P I C E and P M G for the split ratios of the length k are determined. They follow from:
ψ = ( ψ 1 m a x ψ k m i n ) ,
P I C E = ψ P D   a n d   P M G = ( 1 ψ ) P D ,
subject to   { 0 P I C E P I C E m a x P M G m i n P M G P M G m a x S O C m i n S O C S O C m a x I B A T m i n I B A T I B A T m a x P G R m i n ( P D + P P T O ) P G R m a x } .

4.3.2. Power Split Optimization

The optimization function block determines the control output signals for P I C E and P M G . Therefore, the algorithm calculates a power supply efficiency vector of length k, Ω = ( Ω 1 Ω k ) , where each element of the vector assigns a power supply efficiency Ω i to the particular elements of the operation point vectors. The power supply efficiency correlates to the sum of requested powers, P D , P P T O and P e A U X , divided by the sum of power consumption, P F u e l plus P e B A T (electric discharge power):
Ω k = P D + P P T O + P e A U X + P e B A T + k P F u e l k + ( P e B A T k ϱ ( t ) )
with:
P F u e l k = P I C E ( k ) η I C E ( P I C E ( k ) ,   ω I C E ) .
It is differentiated between electric battery power for charging P e B A T + and discharging P e B A T . P B A T k for each vector element k is calculated by:
P B A T k = P M G ( k ) η B A T ( I B A T ) η M G ( P M G ( k ) ,   ω M G ) ,
hence:
P e B A T + k = m a x [ 0 ,   P e B A T k ]   and   P e B A T k = | m i n [ 0 ,   P e B A T k ] | .
The values for the conversion efficiencies η I C E ,   η M G and η B A T are taken from efficiency maps (e.g., Figure 5b) or, in case of η I C E , are calculated based on lookup tables of b s f c ( P I C E ( k ) ,   ω I C E ) . The variable ϱ ( t ) in (23) stands for an energy cost equivalent charge factor and is described more detailed in the next subsection. Finally, the control output signals for P I C E and P M G are determined by the maximum value Ω m a x of the power supply efficiency vector Ω :
a r g   m a x { Ω ( P I C E ,   P M G ,   P D ,   P P T O ,   P e A U X ) }     P I C E ,   P M G .

4.3.3. Energy Cost Equivalent Charge Factor

The energy cost equivalent charge factor ϱ ( t ) accounts for the amount of fuel energy that was used in the time interval t [ t 0 ,   t ] to charge the battery. Its valid range is η c h r g m i n ϱ ( t ) 1 . If the battery is charged only by recuperation during braking, without any consumption of fuel, ϱ ( t ) has the value 1. But if the energy stored in the battery is provided by the ICE, ϱ ( t ) equals the medium efficiency of the charging procedure. Hence, for S O C ˙ > 0 , ϱ ( t ) is computed by:
ϱ ( t ) = E B A T * ( t ) E C h r g F u e l * ( t )
with:
E B A T * ( t ) = E B A T * ( t 0 ) + t 0 t U O C ( τ ) I B A T ( τ )   d τ
and:
E C h r g F u e l * ( t ) = E C h r g F u e l * ( t 0 ) + t 0 t P C h r g F u e l ( τ )   d τ .
In the case of discharging, S O C ˙ 0 , the PMA modifies (28) and holds ϱ ( t ) constant. It follows from (28) that ϱ ( t ) substitutes the ratio of energy E B A T * , stored in the battery, and the fuel energy needed to charge the battery E C h r g F u e l * . Please note that P C h r g F u e l represents the share of fuel consumed for charging. P C h r g F u e l can be calculated from the electric charging power at the battery terminal and the product of conversion efficiencies for the ICE as well as MG, leading to:
P C h r g F u e l ( t ) = U B A T ( t ) I B A T + η I C E ( M I C E ( t ) ,   ω I C E ( t ) ) η M G ( M M G ( t ) ,   ω M G ( t ) ) .
The index * implies that E B A T * represents the amount of energy in between the admissible boundaries of the battery state of charge, S O C m i n S O C S O C m a x . This makes sense because only this partition of the battery is used during operation.
From a mathematical point of few, ϱ ( t ) set in (23) is handled like an efficiency value, which increases the energy costs, or in other words, reduces the efficiency of the electrical path. In case of ϱ ( t ) being close to one, it means that most of the energy in the battery was provided by “free” sources like recuperation or even external sources, for instance, external charging in a depot. As a consequence, a high portion of P D is provided by the electric path. This results in ψ close to zero due to its higher conversion efficiency as compared to the ICE path. In applications, system configurations or even drive cycles, where not much of the consumed energy can be recuperated during the deceleration and only a relatively small BAT is used, Charge Mode is employed quite regularly to maintain S O C within its admissible interval. In this case, ϱ ( t ) falls below one and, thus, increases the electric energy cost. Due to its implementation, ϱ ( t ) adapts itself dependent on system parameters, the drive cycle and other operational boundaries.

4.3.4. SOC Control Function

There are system configurations or constraints for specific applications, where S O C does not only have to be within its bounds but have to match a specific value at the end of the drive cycle or even among single track sequences. This is the case if the additional installed electric power is intended to improve system performance or, for example, to replace one combustion engine, see Figure 3. Therefore, the PMA features a function block that determines an expected amount of energy that is recuperated during braking down from the current vehicle velocity. The computation addresses the driving resistance forces according to (1), estimates a brake trajectory in compliance with the drive strategy, see Section 2.2, and determines the recuperation duration t R e c = f ( v ) . From t R e c and an assumed mean electric recuperation power P e R e c m e a n , a recuperated S O C R e c c a l c is calculated:
S O C R e c c a l c = F R e c i t r e c P e R e c m e a n E B A T 100 .
The factor F R e c i in (32) represents a correction factor and is adapted online for a better match of the predicted S O C R e c c a l c and the real S O C R e c . It is calculated by a comparably simple approach according to (33) but leads to relatively good results (see Section 5):
F R e c i = F R e c i 1 + d F R e c   with   d F R e c = S O C R e c S O C R e c c a l c F R e c i 1 ,
subject to   0.15 d F R e c 0.15.
The computation of F R e c i is processed at discrete states i , after each recuperation event, where the velocity is reduced from cruising speed to a halt. Based on S O C R e c c a l c and a target value for S O C T r g , a finite-state machine sets a trigger to initiate the Charge Mode. The PMA strives for equality of S O C and S O C T r g at the start of the next cycle sequence. Hence, the Charge Mode is activated until S O C ( S O C T r g S O C R e c c a l c ) is achieved.
The S O C control function is a straightforward approach to control the state of charge of the battery BAT in order to attain a predefined target value. By a proper choice of the target value, it allows for implementing different operating strategies for hybrid systems. If S O C T r g is close to the upper S O C limit, a performance oriented strategy is applied. Here, it is ensured that at any time a high battery S O C is available for electrically boosted acceleration events. For a low S O C T r g , the PMA allows a wider range of possible operation modes and, moreover, to optimize a power split only from an efficiency point of view. Furthermore, this charge triggering function is intended to be the interface for further optional predictive algorithms, which process the knowledge of the whole drive cycle.

5. Case Study Results

In the simulation case study, the DMU specified in Section 2 with two identical PUs is employed. The vehicle parameters are shown in Table 2. The electric auxiliary power is set to P e A u x = 30   kW for the vehicle. In the reference case, where the DMU runs on Pure ICE mode, the auxiliaries are supplied by a generator driven by the ICE. For evaluation purposes, the corrected fuel consumption F C C o r , calculated with (15)–(17), is used. The DMU drives on a track which was generated from an evaluation of various DMUs’ field data. This track is representative for the real world operation of such a vehicle.
The fuel consumption of the reference diesel-driven vehicle adds up to 32.8 L. In hybrid operation, the DMU consumes 25.8 L, which denotes a reduction of F C C o r by 21.3%. Figure 9 shows the vehicle velocity profile over time for the diesel and hybrid system as well as the altitude profile. The velocity profiles differ due to the modified drive strategies and their particular brake trajectories (Section 2.2).
In Figure 10a, the battery S O C is shown. Due to the activated S O C control function, the S O C s at the end of the drive cycle and also at the end of each cycle sequence are fairly close to the target value S O C T r g of 55%. The maximum deviation of the S O C and its target value at halt events occurs after the seventh drive sequence and adds up to 0.59%. Considering the comparatively simple approach from Section 4.3.4, Figure 10b shows the energy cost-equivalent charge factor ϱ ( t ) over cycle time. It becomes obvious that ϱ ( t ) falls during cruising and raises throughout recuperation. This is the typical behavior and points out that Charge Mode is active quite often. The fact that ϱ ( t ) is not below one during the whole cycle shows that a relatively high amount of electric charging power for the battery is gained by recuperation. As a result, Pure Electric operation is executed rather often during cruising, because electric energy is quite “cheap”. Figure 11a shows the percentages of the individual operation modes during acceleration and cruising. The Combined Mode extensively occurs during vehicle acceleration. The reason is that a combined use of ICE and MG increases the vehicle performance and, therefore, results in lower cruising speeds. About 56% of the time, the Pure Electric mode is activated, whereas the ICE is running on idle speed decoupled from the MG by the clutch. This leads to the question, whether it is feasible to completely switch off the ICE during driving. The employment of Start/Stop mode at halt further reduces the fuel consumption by 2.5%, which leads to a F C C o r of 25.0 L. If Start/Stop mode is expanded to cruising events as well, the F C C o r is further lowered by 1.2%, see Figure 11b.

6. Conclusions and Outlook

In this contribution, an optimization-based causal PMA for hybrid propulsion systems is presented. It optimizes the power split between ICE and MG according to vectors of possible operation points. For each vector element, which represents one feasible operational power distribution, the corresponding element of a power supply efficiency vector is calculated. The power split that is related to the highest efficiency determines the power demand for ICE and MG as control output. The computation of the power supply efficiency uses an energy-cost-equivalent charge factor, which accounts for the energy consumption to charge the battery. It differentiates between regenerative charging during braking and “energy expensive” charging via the ICE. Moreover, as an optional feature, the power split can be controlled in such a way that the battery S O C matches a pre-defined target value at the end of the drive cycle. In a case study, the presented PMA is employed for the control a hybrid propulsion system of a DMU consisting of two identical PUs. Thereby, the DMU was operated on a track which was generated from logging field data of comparable vehicles. In comparison to the conventional diesel-driven system, a fuel consumption reduction of 21.3% was achieved. Employing Start/Stop at halt and, additionally, during Pure Electric driving, the fuel consumption was further reduced by 3.7%. It was stated that the PMA leads to high proportion of Pure Electric driving during cruising events. This has a significant influence on the engine load profile because especially areas of low engine loads, where engine efficiency is weak, disappear. This is even more true as soon as the engine is switched off during Pure Electric driving. Beside the shown fuel consumption benefits, the Pure Electric mode leads to shorter engine operation time and extends the time-before overhaul (TBO), which further reduces operational costs for the system operator. Another aspect which has to be considered is the influence of hybridization on exhaust emissions. DMUs’ modern diesel engines are compliant to EPA Tier 4i emission standards. Those are commonly equipped with SCR (selective catalytic reduction) exhaust after-treatment systems. Investigations in the HiL test environment show that the changed engine operation in hybrid systems, compared to conventional ones, considerably influence exhaust after-treatment performance, hence real driving emissions [7]. The implementation of Start/Stop during Pure Electric driving are one possibility to influence exhaust after-treatment temperatures and, for example, prevent the SCR-catalyst from cooling down too quickly during idling.
In future investigations, the introduced PMA will be applied to system configurations with multiple PUs, where the ICEs and MGs are operated individually. Furthermore, the PMA’s suitability for other applications will be proven. To demonstrate the “real-world” capability of the PMA, it will be applied to a PU prototype of a DMU propulsion system in hardware-in-the-loop testing campaigns on a system test bench. In those experiments, the impact and the benefits of the proposed PMA and its different operation modes on fuel consumption and emissions will be investigated for different DMU propulsion system configurations.

Author Contributions

Johannes Schalk developed the algorithm and the simulation model. Furthermore, he executed the case study. The HiL-Test procedure had been conducted at a test facility at MTU Friedrichshafen, where Johannes Schalk was part of the team of test engineers. Harald Aschemann supervised the work, contributed his know-how in hybrid Off-Highway applications and co-wrote the paper.

Conflicts of Interest

The authors declare no conflict of interest.

References

  1. European Parliament and Council of the European Union. REGULATION (EG) No 443/2009 Setting Emission Performance Standards for New Passenger Cars as Part of the Community’s Integrated Approach to Reduce CO2 Emissions from Light-Duty Vehicles, April 2009. Available online: http://eur-lex.europa.eu/legal-content/EN/TXT/PDF/?uri=CELEX:32009R0443&from=EN (accessed on 20 August 2016).
  2. Baffes, J.; Kose, M.A.; Ohnsorge, F.; Stocker, M. The Great Plunge in Oil Prices: Causes, Consequences and Policy Responses; Policy Research Note; World Bank Group: Washington, DC, USA, 2015. [Google Scholar]
  3. Dittus, H.; Hülsebusch, D.; Ungethüm, J. Reducing DMU fuel consumption by means of hybrid energy storage. Eur. Transp. Res. Rev. 2011, 3, 149–159. [Google Scholar] [CrossRef] [Green Version]
  4. Oszfolk, B.; Radke, M.; Ibele, Y. Hybridantrieb stellt Marktreife unter Beweis. ETR Eisenbahntechnische Rundsch. 2015, 9, 44–49. [Google Scholar]
  5. Yuan, L.C.W.; Tjahjowidodo, T.; Lee, G.S.G.; Chan, R. Equivalant consumption minimization strategy for hybrid all-electric tugboats to optimize fuel savings. In Proceedings of the American Control Conference (ACC), Boston, MA, USA, 6–8 July 2016.
  6. Jayaram, V.; Khan, M.Y.; Welch, W.A.; Johnson, K.; Miller, J.W.; Cocker, D.R. A generalized approach for varifying the emission benefits of off-road hybrid mobile sources. Emiss. Control Sci. Technol. 2016, 2, 89–98. [Google Scholar] [CrossRef]
  7. Hass, C.; Oszfolk, B.; Schalk, J. Emissions of a hybrid propulsion system for regional trains as an example for innovative non-road propulsion systems. In Proceedings of the 8th Emission Control, Dresden, Germany, 2–3 June 2016.
  8. Hofman, T.; Steinbuch, M.; Van Druten, R.; Serrarens, A. Rule-based energy management strategies for hybrid vehicles. Int. J. Electr. Hybrid Veh. 2007, 1, 71–94. [Google Scholar] [CrossRef]
  9. Guzella, L.; Sciarretta, A. Vehicle Propulsion Systems: Introduction to Modeling and Optimization; Springer: Berlin/Heidelberg, Germany, 2013. [Google Scholar]
  10. Goerke, D. Untersuchungen zur Kraftstoffoptimalen Betriebsweise von Parallelhybridfahrzeugen und Darauf Basierende Auslegung Regelbasierter Betriebsstrategien; Springer: Wiesbaden, Germany, 2016. [Google Scholar]
  11. Guzella, L.; Sciarretta, A. Control of hybrid electric vehicles. IEEE Control Syst. 2007, 27, 60–70. [Google Scholar]
  12. Helbing, D.I.M.; Uebel, D.I.S.; Tempelhahn, D.I.C.; Bäker, I.B. Bewertender Überblick von Methoden zur Antriebsstrangsteuerung in Hybrid- und Elektrofahrzeugen. ATZelektronik 2015, 10, 66–71. [Google Scholar] [CrossRef]
  13. Karbaschian, M.A.; Söffker, D. Review and comparison of power management approaches for hybrid vehicles with focus on hydraulic drives. Energies 2014, 7, 3512–3536. [Google Scholar] [CrossRef]
  14. Lampe, A. Regelbasierte Betriebsstrategien zur Vorauslegung von Hybridantriebssträngen. ATZ Automobiltech. Z. 2016, 116, 76–82. [Google Scholar] [CrossRef]
  15. Hanho, S.; Hyunsoo, K. Development of near optimal rule-based control for plug-in hybrid electric vehicles taking into account drivetrain component losses. Energies 2016, 9, 420. [Google Scholar] [CrossRef]
  16. Paschero, M.; Storti, G.L.; Rizzi, A.; Mascioli, F.M.F. Implementation of a fuzzy control system for a parallel hybrid vehicle powertrain on compactrio. Int. J. Comput. Theory Eng. 2013, 5, 273. [Google Scholar] [CrossRef]
  17. Khoucha, F.; Benbouzid, M.; Kheloui, A. An optimal fuzzy logic power shift strategy for parallel hybrid electric vehicles. In Proceedings of the IEEE Vehicle Power and Propulsion Conference, Lille, France, 1–3 September 2010.
  18. Yuan, Z.; Teng, L.; Fengchun, S.; Peng, H. Comparative study of dynamic programming and pontryagin’s minimum principle on energy management of a parallel hybrid electric vehicle. Energies 2013, 6, 2305–2318. [Google Scholar] [CrossRef]
  19. Leska, M.; Aschemann, H. Fuel-optimal combined driving strategy and energy management for a parallel hybrid electric railway vehicle. In Proceedings of the 20th International Conference on Methods and Models in Automation and Robotics, Miedzyzdroje, Poland, 24–27 August 2015.
  20. Sivertsson, M.; Sundström, C.; Eriksson, L. Adaptive Control of a Hybrid Powertrain with Map-Based ECMS; IFAC World Congress: Prague, Czech Republic, 2011. [Google Scholar]
  21. Mustardo, C.; Rizzoni, G.; Guezennec, Y.; Staccia, B. A-ECMS: An adaptive algorithm for hybrid electric vehicle energy management. Eur. J. Control 2005, 11, 509–524. [Google Scholar] [CrossRef]
  22. Nüesch, T.; Cerofolini, A.; Mancini, G.; Cavina, N.; Onder, C.; Guzzella, L. Equivalent consumption minimization strategy for control of real driving NOx emissions of a diesel hybrid electric vehicle. Energies 2014, 7, 3148–3178. [Google Scholar] [CrossRef]
  23. Onori, S.; Serrao, L. On adaptive-ECMS strategies for hybrid electric vehicles. In Proceedings of the International Scientific Conference on Hybrid and Electric Vehicles, Rueil-Malmaison, France, 6–7 December 2011.
  24. Winkler, M.; Geulen, S.; Josevski, M.; Tegethoff, M.; Abel, D.; Vöcking, B. Online parameter tuning methods for adaptive ECMS control strategies in hybrid electric vehicles. In Proceedings of the FISTA World Automotive Congress, Maastricht, The Netherlands, 2–6 June 2014.
  25. Katsargyri, G.-E.; Kolmanovsky, I.V.; Michelini, J.; Kuang, M.L.; Phillips, A.M.; Rinehart, M.; Dahleh, M.A. Optimally controlling electric hybrid vehicles using path forecasting. In Proceedings of the 2009 American Control Conference, St. Louis, MO, USA, 10–12 June 2009.
  26. Geering, H.P. Optimal Control with Engineering Applications; Springer: Berlin/Heidelberg, Germany, 2007. [Google Scholar]
  27. Gamma Technologies. GT-SUITE User Manual. GT-SUITE Optimisation Manual, version 2016; Gamma Technologies: Westmont, IL, USA, 2015. [Google Scholar]
Figure 1. Overview of hybrid powertrain functionalities.
Energies 10 00010 g001
Figure 2. Scheme of a parallel hybrid power unit.
Energies 10 00010 g002
Figure 3. Scheme of a parallel hybrid propulsion system for a diesel multiple unit train (DMU) consisting of two PUs and a combined electric circuit with the potential to replace one ICE.
Energies 10 00010 g003
Figure 4. (a) Generic bsfc map for a diesel engine; (b) Mechanical auxiliary power P P T O over engine speed n I C E .
Energies 10 00010 g004
Figure 5. (a) Torque converter torque ratio i H T C and capacity factor K H T C over the speed ratio; (b) MG efficiency map.
Energies 10 00010 g005
Figure 6. (a) Equivalent electric circuit for the battery; (b) Battery validation cycle: simulated S O C S i m and measured S O C M e s over time.
Energies 10 00010 g006
Figure 7. (a) Schematic overview over experimental HiL layout; (b) Measured and simulated normalized fuel consumption for conventional and hybrid mode.
Energies 10 00010 g007
Figure 8. Signal flow scheme of the PMA optimization routine.
Energies 10 00010 g008
Figure 9. Altitude and velocity profiles for conventional and hybrid mode.
Energies 10 00010 g009
Figure 10. (a) S O C and its target value over cycle time; (b) Energy cost equivalent charge factor over cycle time.
Energies 10 00010 g010
Figure 11. (a) Percental proportion of operation modes during acceleration and cruising (hybrid without Start/Stop); (b) Overview over percental reductions of corrected fuel consumption.
Energies 10 00010 g011
Table 1. System specification of vehicle and components.
VehicletypeSiemens Desiro VT642
number PUs2
operating weight83,000 kg
EnginetypeMTU 6H1800R85LP
number cylinders6
rated power390 kW
rated speed1800 rpm
Motor/Generatortypep. magnet synchron. motor
rated power200 kW (continuous)
rated speed1600 rpm
GearboxtypeZF EcoLife
number gears6
BatterytypeLithium-ion battery
nom. voltage670 V
nom. capacity90 Ah
max./min. current+/-300 A
Table 2. Vehicle model parameters.
ParameterSymbolUnitValue
Vehicle mass m kg83,000
Track coefficient c r -0.001
Drag coefficient c D -0.8
Frontal area A m210.8
Dynamic roll radius r d y n m0.38
Differential ratio i D i f -2.59
Differential efficiency η D i f -0.95
Table 3. Drive Events and Hybrid Operation Modes.
Drive EventOperation Mode P T r a c P I C E P M G S O C ˙
AccelerationPure ICE++++-0
Combined Mode++++-
CruisingPure ICE++-0
Pure Electric+0+-
Combined Mode+++-
Charge Mode+++-+
DecelerationRecuperation--+--+
HaltNormal Halt0+-0
Start/Stop000-
Charge Mode0+-+

