Article

Thermo-Economic Comparison and Parametric Optimizations among Two Compressed Air Energy Storage System Based on Kalina Cycle and ORC

School of Energy and Power Engineering, Xi’an Jiaotong University, Xi’an 710049, Shaanxi, China
*
Author to whom correspondence should be addressed.
Energies 2017, 10(1), 15; https://doi.org/10.3390/en10010015
Submission received: 25 September 2016 / Revised: 12 December 2016 / Accepted: 14 December 2016 / Published: 23 December 2016

Abstract

:
The compressed air energy storage (CAES) system, considered as one method for peaking shaving and load-levelling of the electricity system, has excellent characteristics of energy storage and utilization. However, due to the waste heat existing in compressed air during the charge stage and exhaust gas during the discharge stage, the efficient operation of the conventional CAES system has been greatly restricted. The Kalina cycle (KC) and organic Rankine cycle (ORC) have been proven to be two worthwhile technologies to fulfill the different residual heat recovery for energy systems. To capture and reuse the waste heat from the CAES system, two systems (the CAES system combined with KC and ORC, respectively) are proposed in this paper. The sensitivity analysis shows the effect of the compression ratio and the temperature of the exhaust on the system performance: the KC-CAES system can achieve more efficient operation than the ORC-CAES system under the same temperature of exhaust gas; meanwhile, the larger compression ratio can lead to the higher efficiency for the KC-CAES system than that of ORC-CAES with the constant temperature of the exhaust gas. In addition, the evolutionary multi-objective algorithm is conducted between the thermodynamic and economic performances to find the optimal parameters of the two systems. The optimum results indicate that the solutions with an exergy efficiency of around 59.74% and 53.56% are promising for KC-CAES and ORC-CAES system practical designs, respectively.

1. Introduction

Due to the increasing depletion of fossil fuels and the deterioration of global environmental pollution, integrating renewable energy sources into the power system has developed rapidly during the last few decades. However, the inherent nature of renewable energy, i.e., randomness and intermittence, has greatly restricted the large-scale utilization of renewable energies, mostly in the power grid [1,2]. Energy storage technology can deal with the encountered situation by storing the excess renewable energies and releasing the energy to balance the difference between energy demand and supply [3].
At present, pumped hydroelectric energy storage (PHES) and compressed air energy storage (CAES) are two energy storage technologies suitable for large-scale energy storage applications [4,5]. Compared with PHES, CAES has the advantages of low investment costs, fast construction time and high economic feasibility. The system may contribute to creating a flexible energy system with a better utilization of fluctuating renewable energy sources [3,6]. During the charge period at the off-peak time, electricity produced by renewable energy sources converts into internal energy of compressed air, which is stored in an under-ground cavern; during the discharge period at peak demand, the compressed air is heated up first and then expanded in the turbine to produce electricity [4,7].
In recent years, many works regarding the CAES system have been conducted in order to improve the applicability of the system [8]. Grazzini and Milazzo [9] presented a thermodynamic analysis for an adiabatic compressed air energy storage system (ACAES) and proposed the variable configuration system with a variable compression ratio to address the un-steady operation of the components. Wolf and Budt [1] introduced a low-temperature adiabatic compressed air energy storage (LTA-CAES) plant, which can avoid all of the technical challenges of adiabatic CAES designs. Arabkoohsar et al. [10,11,12] proposed a CAES system equipped with an ancillary solar heating system for a large-scale PV farm in Brazil, and the thermodynamic and economic analyses are conducted to select the best operation strategy of the power plant. Abbaspour et al. [13] and Zhao et al. [14] conducted a preliminary dynamic behavior analysis for CAES integrated with wind power to find the optimization and improvement methods of the system. Fu et al. [15] described a new gas turbine power generation system coupled with conventional CAES technology to improve the thermal efficiency at least 5% over that of the existing system. Bouman [16] and Gulagi [17] discussed the environmental impacts and importance associated with a CAES or ACAES system as a means of balancing the electricity output.
Although the CAES system has had remarkable attention paid to it, the large-scale CAES system needs a suitable underground geology to store the compressed air, which leads to the great limitation of the commercial application of CAES. Thus, developing a small-scale CAES system, which could use an artificial air vessel instead of a natural cavern to store compressed air, has become the main trend in recent years [5]. Because of the advantages of the gas engine in the small-scale industrial system, integrating the gas engine with CAES could not only boost the system output power, but also improve the efficiency of energy utilization and operation flexibility in the system [5]. Ibrahim et al. [18] presented a hybrid wind-diesel CAES to heighten diesel power output, increase engine lifetime and reduce the fuel consumption and greenhouse gas emissions. Yao et al. [5] proposed a novel combined cooling, heating and power system (CCHP) combined with CAES and a gas engine; the system increases the output power of the CCHP system and realizes energy cascade utilization. Nielsen et al. [19] and Basbous et al. [20] exposed new CAES systems based on diesel engines, which can be applied to remote areas and ships.
The mentioned systems, due to the waste heat from the engine or compressor exhaust gas not being utilized efficiently and flexibility, cause much destruction of the available energy. The organic Rankine cycle (ORC) and Kalina cycle (KC) have been proven to be two worthwhile technologies to fulfill the residual heat recovery for energy systems [21,22]. Therefore, the two cycles (i.e., ORC and KC) can be employed in the CAES system to utilize the waste heat and improve the efficiency of the system. To the best of the authors’ knowledge, there is only one paper related to the CAES combined with KC at present. Zhao et al. [8] proposed an integrated energy system based on CAES and the Kalina cycle, which can recover the waste heat of exhaust from a low pressure turbine during the discharge process. However, the heat produced by the compressor is provided to users directly, which will lead to the irrational utilization of high-grade energy when the exhaust temperature of the compressor is high. Therefore, we consider the possibility of recovering heat from the exhaust gas of the compressor and the gas engine by means of KC and ORC in this paper to improve the operating efficiency of the system greatly and expand the scope of application of the energy storage system.
This paper is organized into the following sections: Section 2 describes the schematic diagram of two novel CAES systems. Then, the mathematical modelling of each component, including thermodynamics and exergy model, is presented in Section 3. The sensitivity analysis and optimization of the system are shown in Section 4. Finally, the conclusions are summarized in Section 5. The main originality of this paper is summarized as follows:
(a)
In this paper, two novel combined CAES systems which have never been presented are proposed.
(b)
Compared with ACAES, the thermal storage vessel is not employed in the proposed system. In addition, the output power of the system can increase with the increasing power demand of the electric network.
(c)
The heat produced during the charging and discharging stage is used to generate electricity, which can improve the operation efficiency.

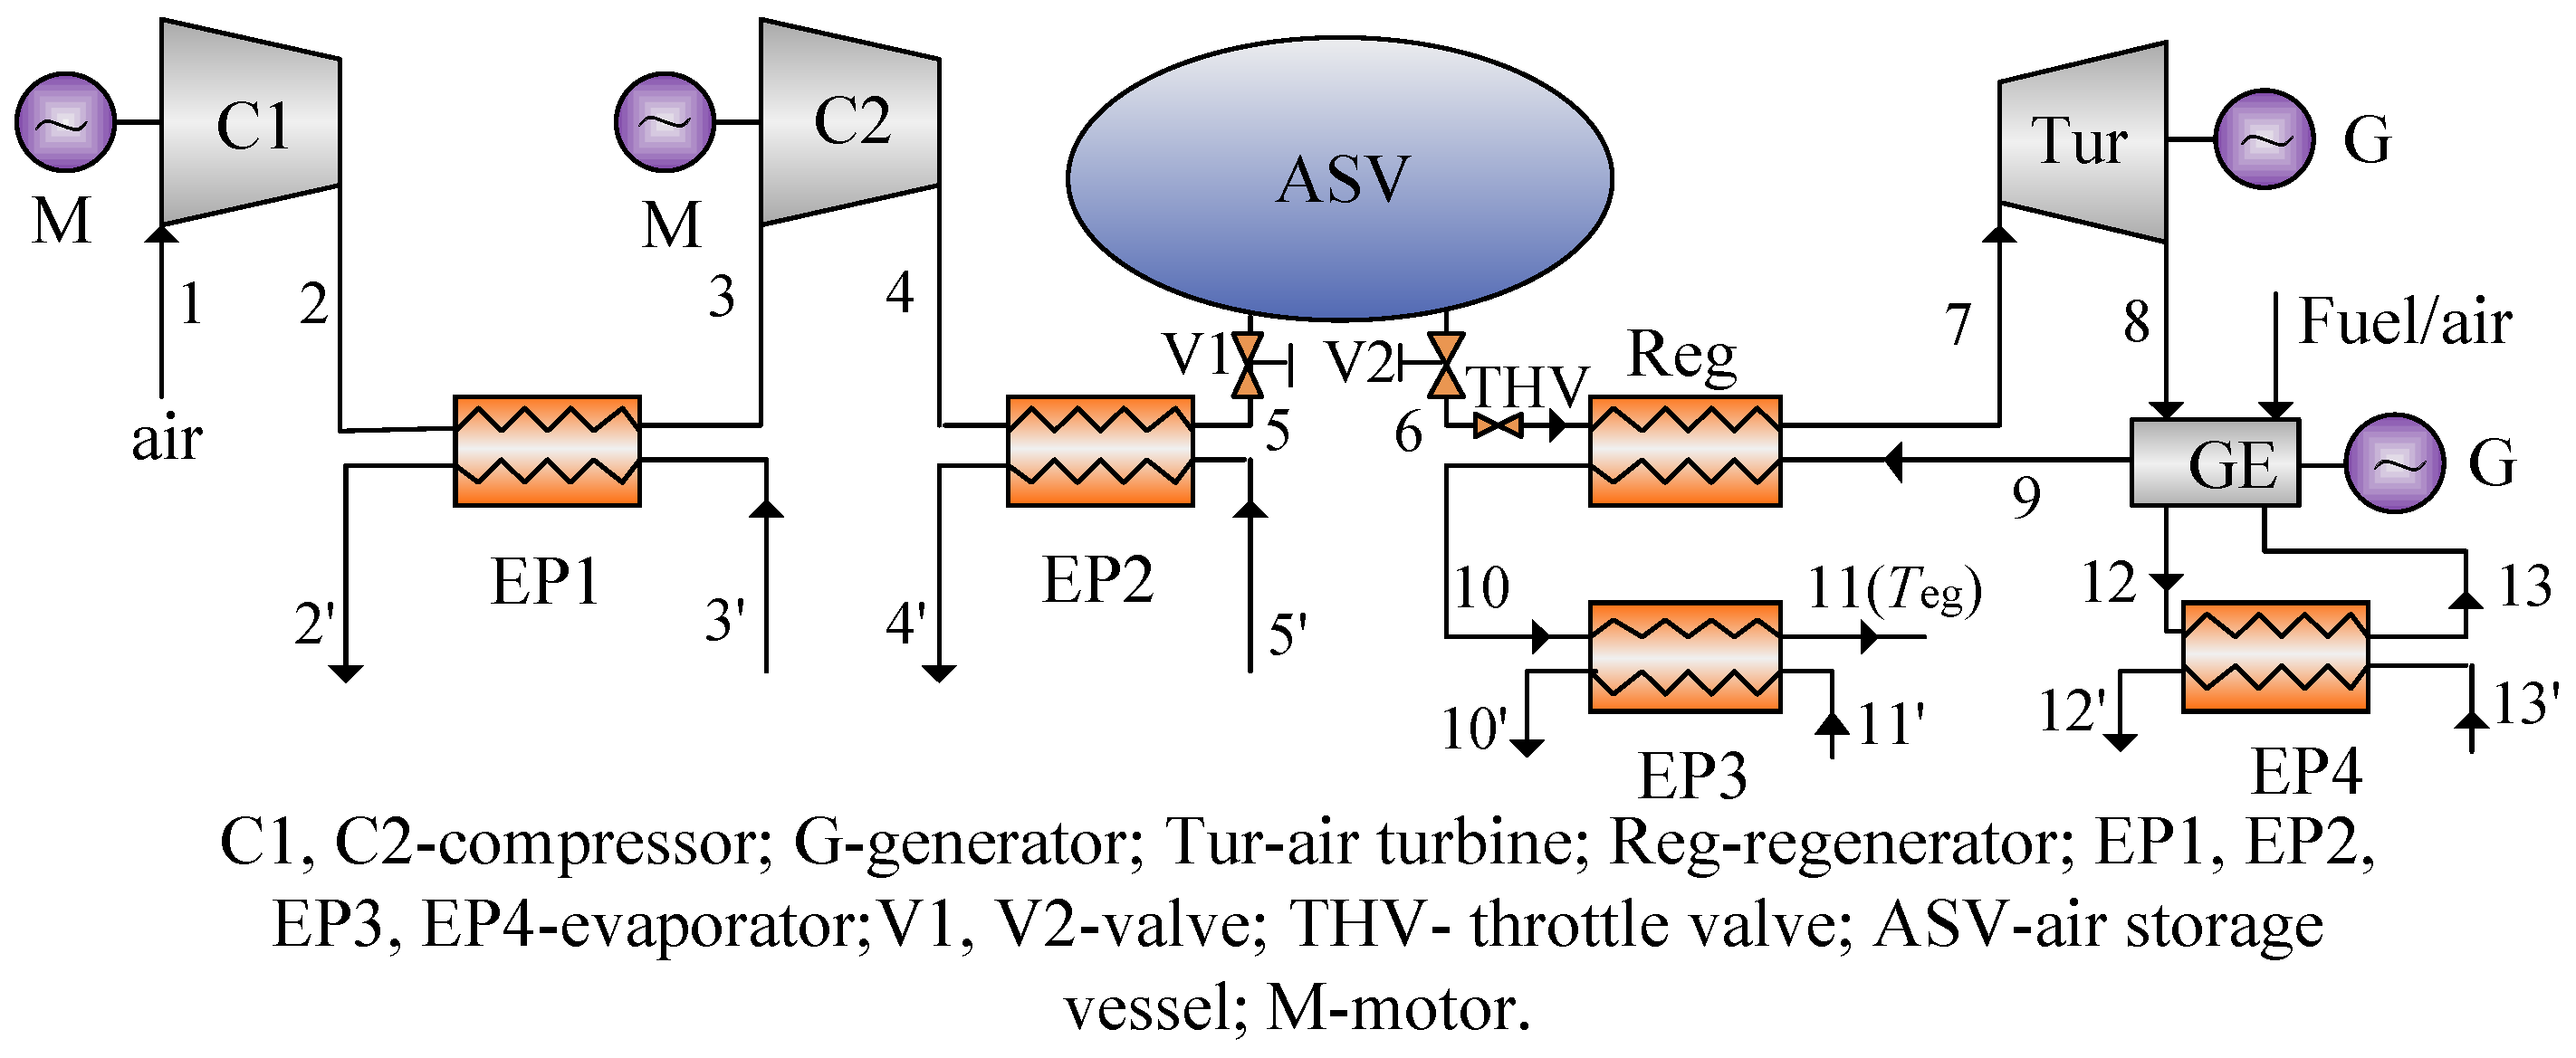
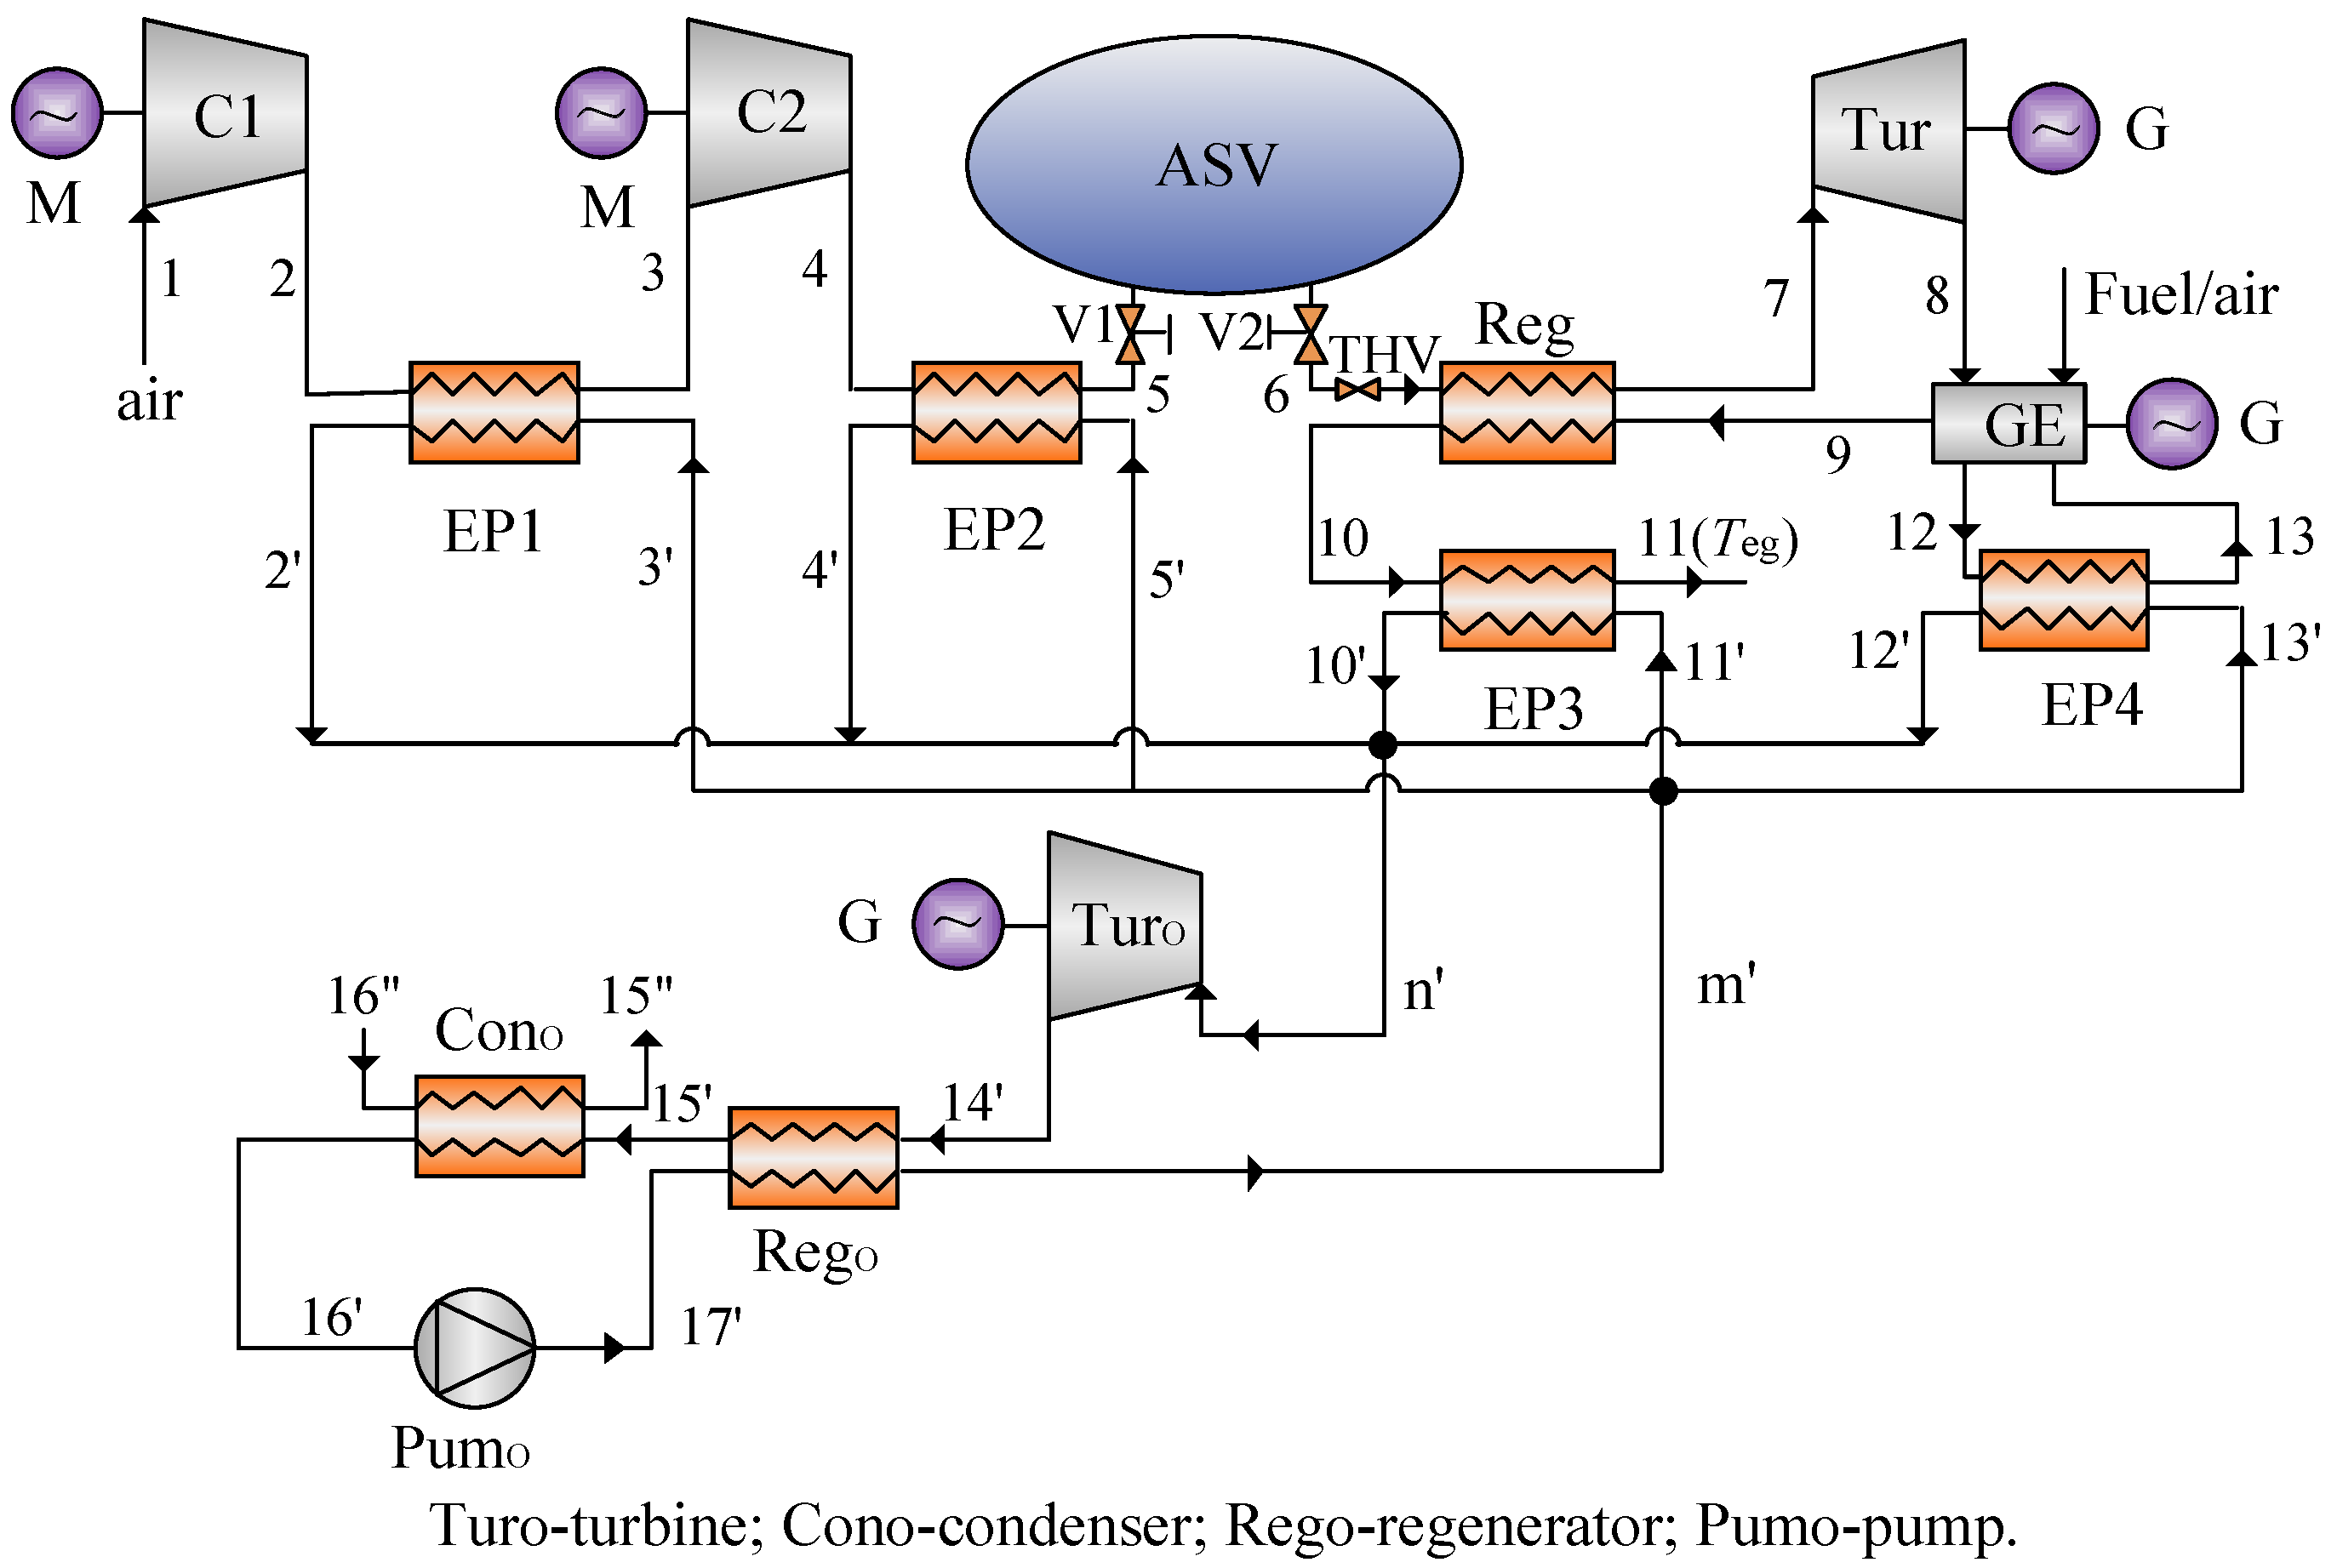
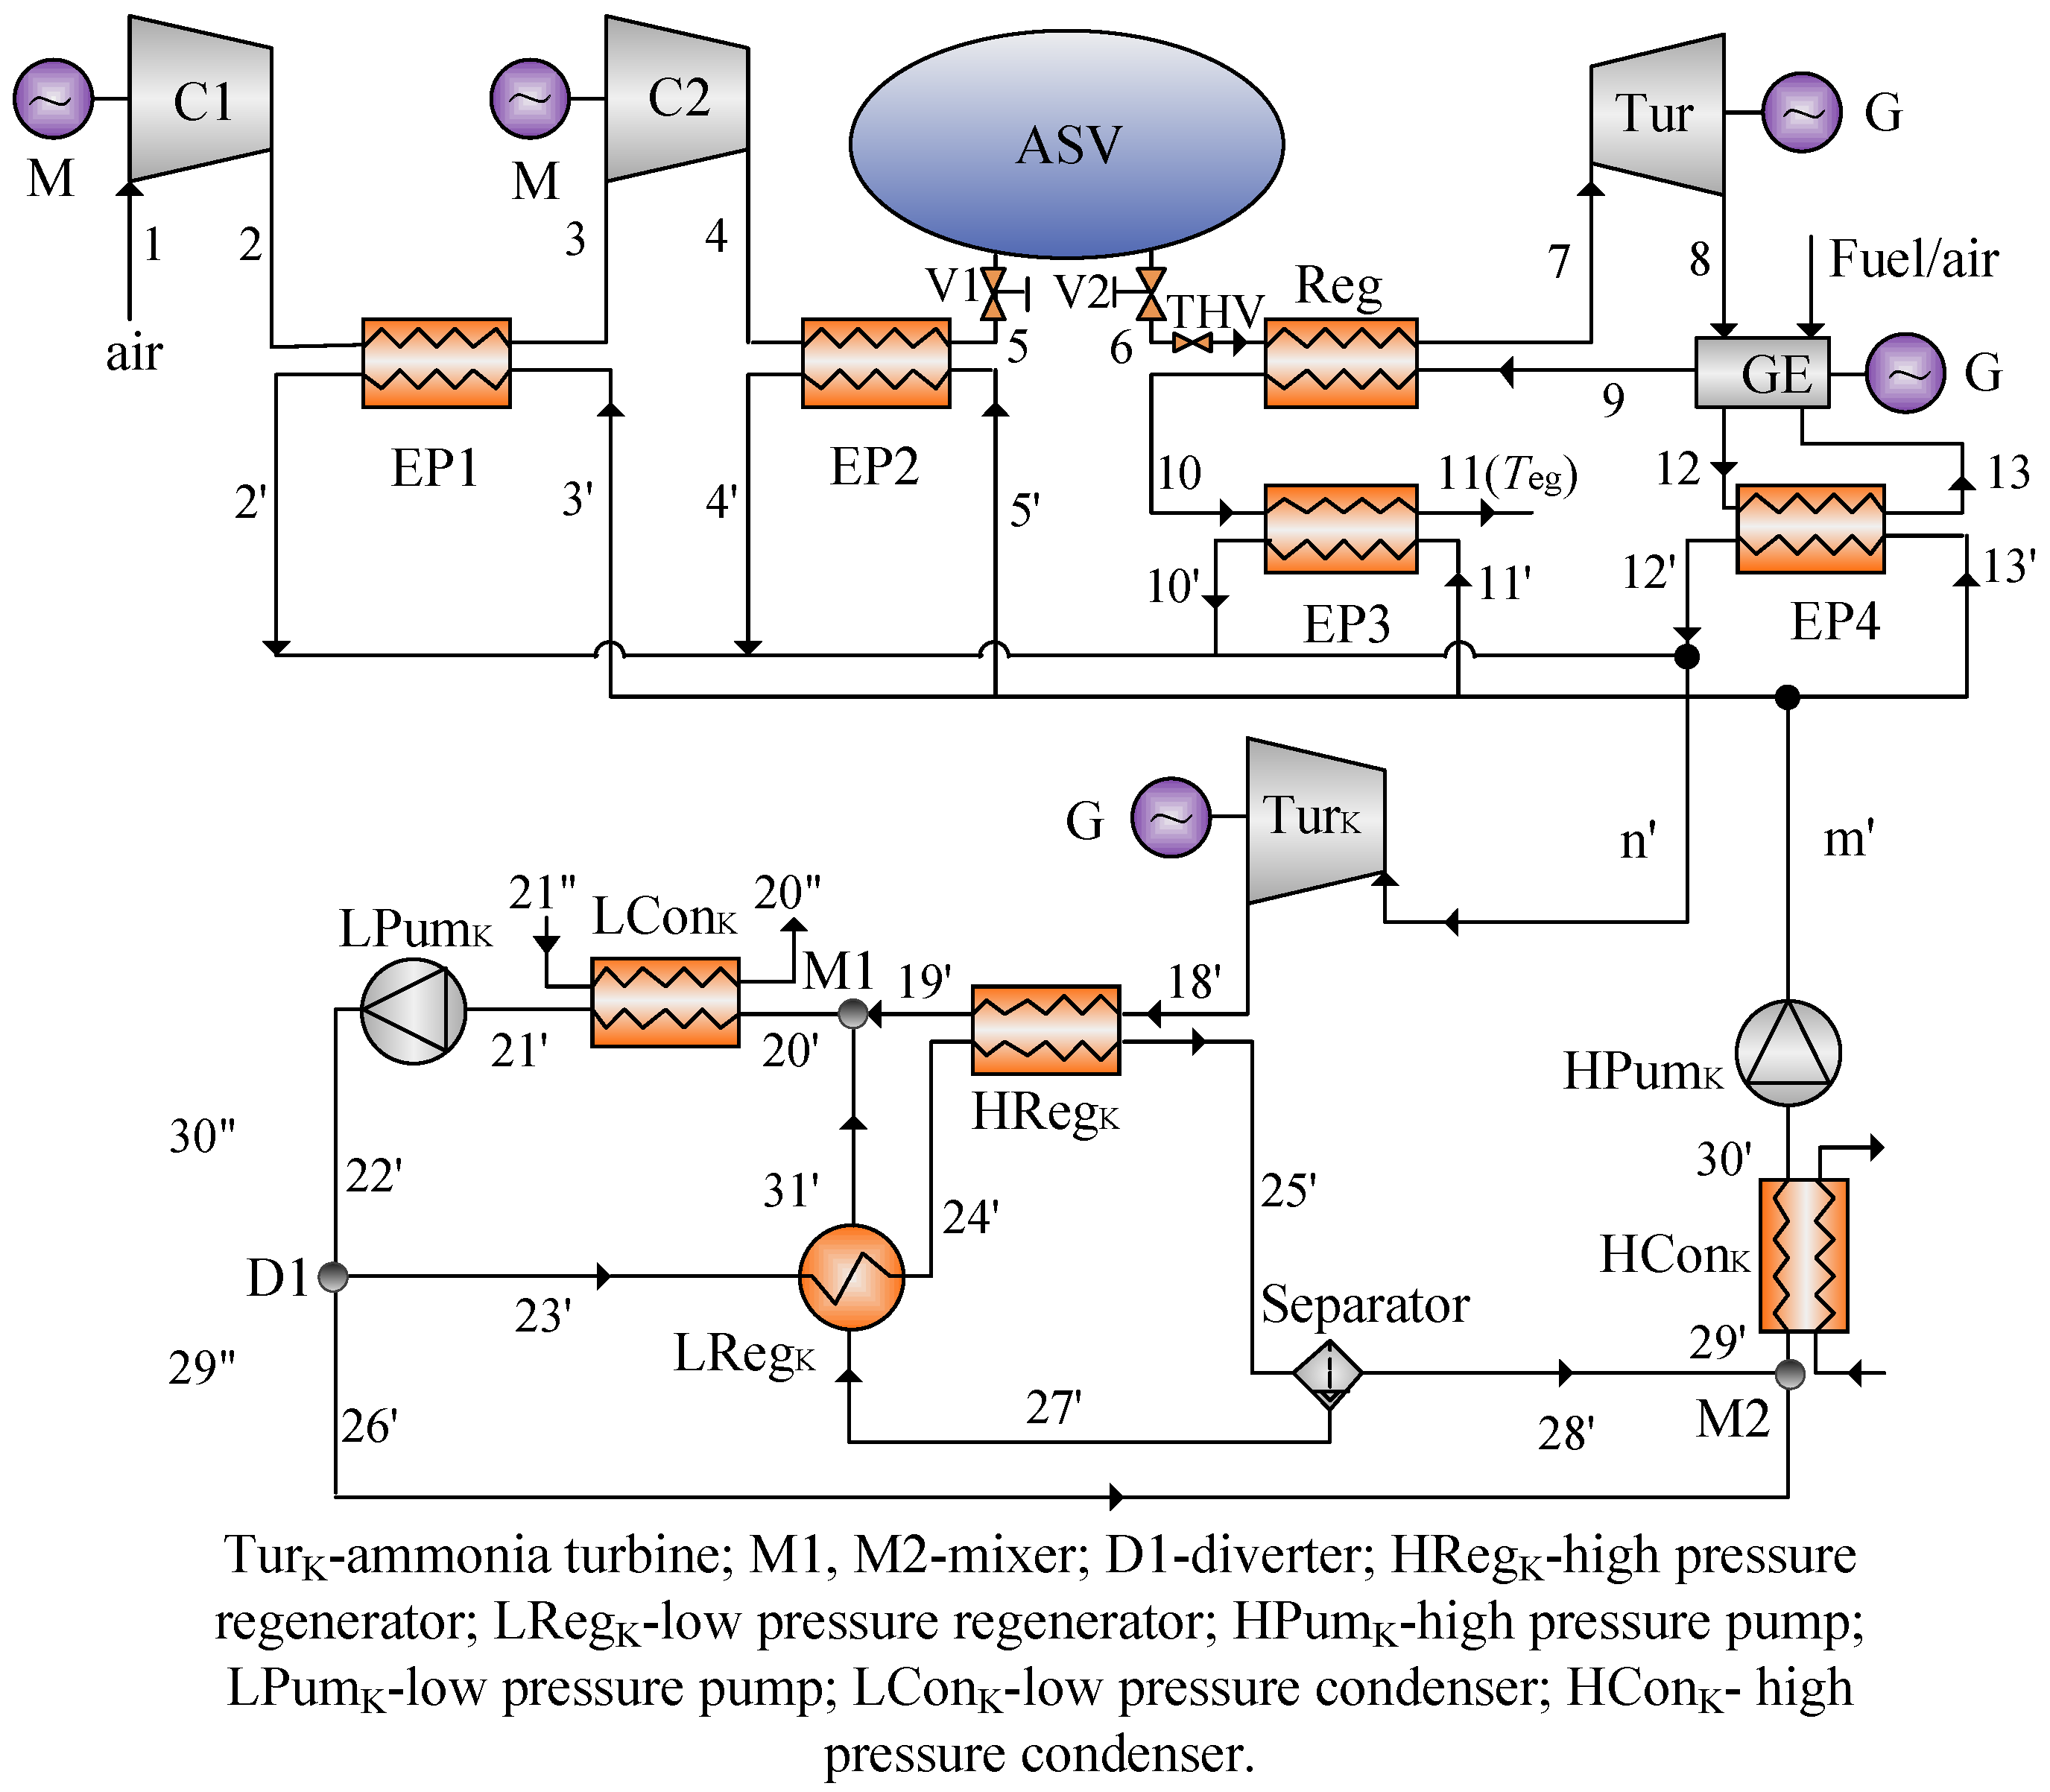
2. System Description

The schematic of the compressed air energy storage (CAES) system is shown in Figure 1. The working process of the system can be divided into two periods: charge period and discharge period. During the charge period, the compressor is driven by renewable energies to compress the ambient air to high-pressure compressed air (from Streams 1 to 5). The compressed air enters the evaporator for after-cooling (Streams 2 and 3) and then is stored in the air storage vessel (Stream 5). The compression heat produced by Evaporators 1 and 2 (EP1 and EP2) will be provided to the heat recovery cycle, i.e., the Kalina cycle (KC) or organic Rankine cycle (ORC).
During the discharge period, the high-pressure air passes through the throttle valve (THV), which is used to adjust the air flow rate (Stream 6) and then enters the regenerator (Reg) for preheating (Stream 6). After that, the compression air expands in the air turbine to drive the generator to produce electricity (Stream 7). After the expansion, the mixture of the exhaust air from the air turbine and the fuel enters the gas engine (GE) (Stream 8). The energy produced by the GE includes three parts: the power energy, the heat of exhaust gas and the heat of jacket water (i.e., used to cool the GE to prevent the inside temperature of the GE from becoming too high). The jacket water heat will be absorbed by EP4 (Stream 12) for the heat recovery cycle. The exhaust gas heat will be used to preheat the compressed air (Stream 9) coming from the air storage vessel first, and then, the residual heat of the exhaust gas will be employed for the heat recovery cycle in EP3 (Stream 10).
Figure 2 illustrates the schematic diagram of ORC combined with CAES (ORC-CAES). During the charge or discharge stage, the working fluid absorbs the heat energy from the exhaust gas in the evaporator to produce superheated vapor. After that, the vapor is expanded in the turbine (TurO) to the output power (stream n′). The exhaust gas of the turbine is cooled in the regenerator (RegO) (Stream 14′), condensed by cooling water (ConO) (Stream 15′), compressed (PumO) (Stream 16′) and cooled by the regenerator (RegO) (Stream 17′). Finally, the working fluid enters the evaporator (stream m′) to carry out the next cycle. For the working fluid in the ORC, R245fa is selected as the working fluids, due to its good thermodynamic performance and small negative impact on the environment [23,24].
The schematic of the combination of the KC and CAES (KC-CAES) is shown in Figure 3. The KC could provide a better match to a heat source than the constant-temperature evaporation of a pure substance (water/steam) [21]. This cycle employs an ammonia-water mixture as its working fluid. During the working process, the mixture splits into four streams (basic solution, working solution, rich solution and poor solution) with different concentrations to provide the flexibility of optimizing the heat recovery system [21,25]. During the charge or discharge stage, the ammonia-water mixture absorbs the heat energy from the exhaust gas with a high temperature and pressure in the evaporator to produce superheated vapor. Then, the ammonia-water vapor expands in the ammonia turbine (TurK) (stream n’); meanwhile, power is generated. After that, the ammonia turbine exhaust is cooled in the regenerator (HRegK) (Stream 18′) and diluted with ammonia-poor liquid in a mixture (M1) to become basic solution (Stream 20′). In the condenser (LConK), the basic solution is condensed to saturated liquid (Stream 21′), which will be compressed to an intermediate pressure (Stream 22′) in low pressure pump (LPumK) after leaving LConK by cooling water. The diverter (D1) divides working solution into two parts (Stream 22′). One of them is heated by the regenerator (LRegK, HRegK) (Streams 23′ to 24′) and then enters the separator (Stream 25′) that separates the medium into the ammonia-poor solution and the ammonia-rich vapor; the other part (Stream 26′) mixes directly with the rich ammonia solution (Stream 28′) in the mixer (M2) to become the working solution (Stream 26′). Finally, the working solution will be cooled, condensed by cooling water (HConK), compressed (HPumK) and sent to the evaporator (Streams 29′ to m′) [26].

3. Mathematical Modeling

The mathematical models of the novel energy storage system include the CAES, the KC and the ORC. The following assumptions are made [8,9,26]:
(1)
The air is treated as an ideal gas in the CAES system;
(2)
Ambient air is composed of 78.12% nitrogen, 20.96% oxygen and 0.92% argon;
(3)
The temperature and pressure of ambient atmospheric environment are 298.15 K and 101.325 kPa, respectively;
(4)
The fuel of the gas engine is composed of 100% methane;
(5)
In the KC and ORC, the working fluid in the condenser is cooled by water coming from the atmospheric environment.

3.1. CAES Mathematical Model

3.1.1. Turbine and Compressor

For the compression process, the power consumption of the compressor can be obtained:
W ˙ Comp = k R g T in m ˙ Comp ( π Comp ( k 1 ) / k 1 ) ( k 1 ) η Comp ,
where m ˙ Comp is the air mass flow rate of the compressor, T in stands for the inlet temperature of the compressor, k is the isentropic exponent and π Comp and η Comp represent the pressure ratio and isentropic efficiency of the compressor, respectively.
The outlet temperature of the compressor can be given as:
T out = T in [ ( π Comp ( k 1 ) / k 1 ) η Comp + 1 ] ,
Then, the isentropic efficiency of the compressor can be expressed as:
η Comp = h out , s h in h out h in ,
In the expansion process, the power output by the turbine can be calculated by the following equations:
W ˙ Tur = η Tur k R g T 6 m ˙ Tur ( 1 π Tur ( k 1 ) / k ) ( k 1 ) ,
where m ˙ Tur is the air mass flow rate of the turbine, T 6 is the inlet temperature of the turbine and π Tur and η Tur represent the pressure ratio and isentropic efficiency of the turbine, respectively.
The outlet temperature and isentropic efficiency of the turbine are shown below:
T 7 = T 6 [ 1 η Tur ( 1 π Tur ( k 1 ) / k ) ] ,
η Tur = h 6 h 7 h 6 h 7 , s .

3.1.2. Gas Engine

The power output of the gas engine is the product of the power efficiency η GE and fuel consumption rate Q ˙ GE :
W ˙ GE = Q ˙ GE η GE ,
The fuel consumption rate by the gas engine can be written as:
Q ˙ GE = m ˙ fuel LHV
where LHV denotes the low calorific value of fuel and m ˙ fuel is the mass flow rate of the fuel.

3.1.3. Air Storage Vessel

According to the conservation law of mass, the following equation can be obtained:
m in , ASV = m out , ASV
where m in , ASV and m out , ASV are the total input and output mass of air, respectively.
Due to the heat dissipation existing in the air storage vessel (ASV), the outlet temperature of compressed air from the ASV can be considered as ambient temperature:
T 6 = T 0
where T 0 is the ambient temperature.

3.2. ORC and KC Mathematical Model

3.2.1. Turbine and Pump

The power output of the turbine can be expressed as:
W ˙ Tur , HRC = m ˙ Tur , HRC ( h Tur , HRC in h Tur , HRC out ) ,
where m ˙ Tur , HRC denotes the mass flow rate of the working fluid in the heat recovery cycle and h Tur , HRC in and h Tur , HRC out are the inlet and outlet enthalpy of turbine, respectively. The subscript HRC represents the heat recovery cycle: ORC or KC.
The isentropic efficiency of the turbine is:
η Tur , HRC = h Tur , HRC in h Tur , HRC out h Tur , HRC in h Tur , HRC , s out .
The power consumption and isentropic efficiency of the pump can be written as:
W ˙ Pum , HRC = m ˙ Pum , HRC ( h Pum , HRC out h Pum , HRC in ) ,
η Pum , HRC = h Pum , HRC , s out h Pum , HRC in h Pum , HRC out h Pum , HRC in ,
where h Pum , HRC in , h Pum , HRC out are the inlet and outlet enthalpy of the pump.

3.2.2. Mixer, Separator and Diverter

Assuming that there is no energy loss in the mixer, separator and diverter, the following model about the mixer, separator and diverter can be used:
{ m ˙ mixer in = m ˙ mixer out m ˙ diverter in = m ˙ diverter out m ˙ seperator in = m ˙ seperator out ,
{ m ˙ mixer in x mixer in = m ˙ mixer out x mixer out m ˙ diverter in x diverter in = m ˙ diverter out x diverter out m ˙ seperator in x seperator in = m ˙ seperator out x seperator out ,
{ m ˙ mixer in h mixer in = m ˙ mixer out h mixer out m ˙ diverter in h diverter in = m ˙ diverter out h diverter out m ˙ seperator in h seperator in = m ˙ seperator out h seperator out ,
where x represents the concentration of ammonia-water.

3.3. Heat Exchanger Model

In the heat exchanger, the working fluid may work in different thermodynamic states, namely superheated state, two-phase state and sub-cooled state, which causes the heat transfer process in the heat exchanger to be divided into many regions. In the condenser, the working fluid is liquefied from one state (such as the superheated state or saturated liquid state) to another state (liquid state); while the working fluid may work in the sub-cooled region, two-phase region and superheated region in the evaporator [27]. However, the superheated region and the sub-cooled region can be considered as a single-phase region compared to a two-phase region [27].
The plate heat exchanger is employed in this paper due to the high heat transfer coefficient, good acclimatization, compact size and fewer materials’ consumption [28,29]. According to the law of energy conservation, the heat released by hot fluid is equal to the value of heat absorbed by cold fluid. For the evaporator and regenerator, the following equations can be employed:
( h hot , in h hot , in ) m ˙ hot = ( h cold , in h cold , in ) m ˙ cold
(A) Single-phase flow:
The heat rate of the heat exchanger can be given as [30,31]:
Q ˙ = U A Δ t m ,
where U represents the overall heat transfer coefficient of the heat exchanger and Δ t m is the logarithmic mean temperature difference (LMTD) that can be calculated as:
Δ t m = Δ t max Δ t min ln ( Δ t min / Δ t max )
where Δ t max and Δ t min are the maximum and minimum temperature difference between cold and hot fluid, respectively.
According to the law of energy conservation, the overall heat transfer coefficient of the heat exchanger is:
1 U = 1 h hot + δ λ + 1 h cold ,
where h hot and h cold are the heat transfer coefficient of hot fluid and cold fluid, respectively. δ is the thickness of the plate, and λ is the thermal conductivity.
The equivalent diameter of flow channel has been presented by Wang [28] and can be defined as:
D h = 4 A C = 4 L b 2 ( L + b ) ,
where L, b are the channel width and channel spacing, respectively [28,31]. C is the wetted perimeter of the cross-section. A is the cross-section area of the channel.
The mass velocity of fluid:
G = m ˙ f N L b ,
where N is the number of the channels [28,31].
The Reynolds number (Re) is a dimensionless quantity that is used to predict similar flow patterns in different fluid flow situations, which can be obtained by Equation (24) [5]:
R e = G D h μ ,
where μ is the viscosity of fluid.
The Prandtl number (Pr) is the ratio of momentum diffusivity to thermal diffusivity [31]:
P r = c p μ λ ,
where λ and c p are the thermal conductivity and specific heat of the fluid, respectively.
The Nusselt number (Nu) is the ratio of convective to conductive heat transfer across the boundary, which is calculated by Equation (26) for the single-phase region [32].
N u = 0.724 ( 6 β π ) 0.646 R e 0.583 P r 1 3 ,
where β stands for the chevron angle of the plates, being expressed by [32].
Therefore, the heat transfer coefficient HTC for single-phase flow can be expressed as:
H T C = λ N u D h .
(B) Two-phase flow:
The properties of fluid in the two-phase region are not constant, which will lead to inaccurate calculation results in the single-phase flow model. Thus, the two-phase region is divided into a number of small regions where the properties of the fluid keep almost constant [28,33,34]. The LMTD and overall heat transfer coefficient for each region can be obtained by Equations (20) and (21).
In the condenser, the heat transfer coefficient on the hot side for each region can be given by [28,33]:
N u Con , i = 4.118 R e i 0.4 P r i 1 3 ;
while in the evaporator, the heat transfer coefficient on the cold side for each region can be expressed as [28,33]:
N u Eva , i = 1.926 [ ( 1 x m , i ) + x m , i ( ρ l ρ v ) 0.5 ] R e i 0.5 P r i 1 3 B o i 0.5 ,
where B o i is the boiling number and x m , i is the dryness of the fluid [28,33]. R e i , P r i can be obtained using Equations (24) and (25), respectively.

3.4. Exergy Model of Systems

Exergy analysis reveals the location, the magnitude and the sources of thermodynamic inefficiencies within the energy system [5]. In addition, the exergy analysis can be used to improve the system efficiency by determining the sources and magnitude of irreversibility.
The total exergy of a material stream can be divided into two parts: chemical exergy ( E x i x ch ) and physical exergy ( E x i x ph ) [35]:
E x i x = E x i x ph + E x i x ch ,
E x i x ph = m [ h i x h 0 T 0 ( s i x s 0 ) ] ,
E x i x ch = m ( j x x j x ε 0 + R T 0 j x x j x ln x j x ) ,
where x j x is the mole fraction and ε 0 is the standard chemical exergy of the involved chemical component.

3.5. Performance Evaluation Criteria

In order to evaluate the thermodynamic and economic performance of the proposed system, the following system indicators are introduced [36,37,38]:
The round-trip efficiency η of the system is the ratio of the total energy generated W ˙ out (i.e., the power produced by the sum of ammonia turbine, air turbine and gas engine) and the total energy consumed by the system (i.e., the power consumed by compressor and pump W ˙ in and the fuel consumption of the gas engine Q ˙ GE ).
η = W ˙ out Q ˙ GE + W ˙ in ,
Exergy efficiency used to characterize the utilization of the total effective energy of the system is defined as the ratio between exergy product and exergy fuel [6,39,40]. The exergy product and the exergy fuel are defined by considering the desired result produced by the component and the resources expended to generate this result [21,35].
ε = E ˙ x P , tot E ˙ x F , tot ,
where E ˙ x P , tot is the exergy product of the whole system and E ˙ x F , tot is the sum of input power and the exergy of input fuel.
In order to evaluate the relationship between fuel consumption and output power of the system, the heat rate (HR) is introduced [1,41,42]:
H R = Q ˙ GE W ˙ out ,
The total investment cost per total output power (ICPP) as a widely-used economic indicator is used to calculate the approximate total investment cost of a given system for different scales [5,28]:
I C P P = C total W ˙ in ,
where C total is the total investment of the novel systems. The cost functions of the involved components in the systems are listed in Appendix A.

4. Results and Discussions

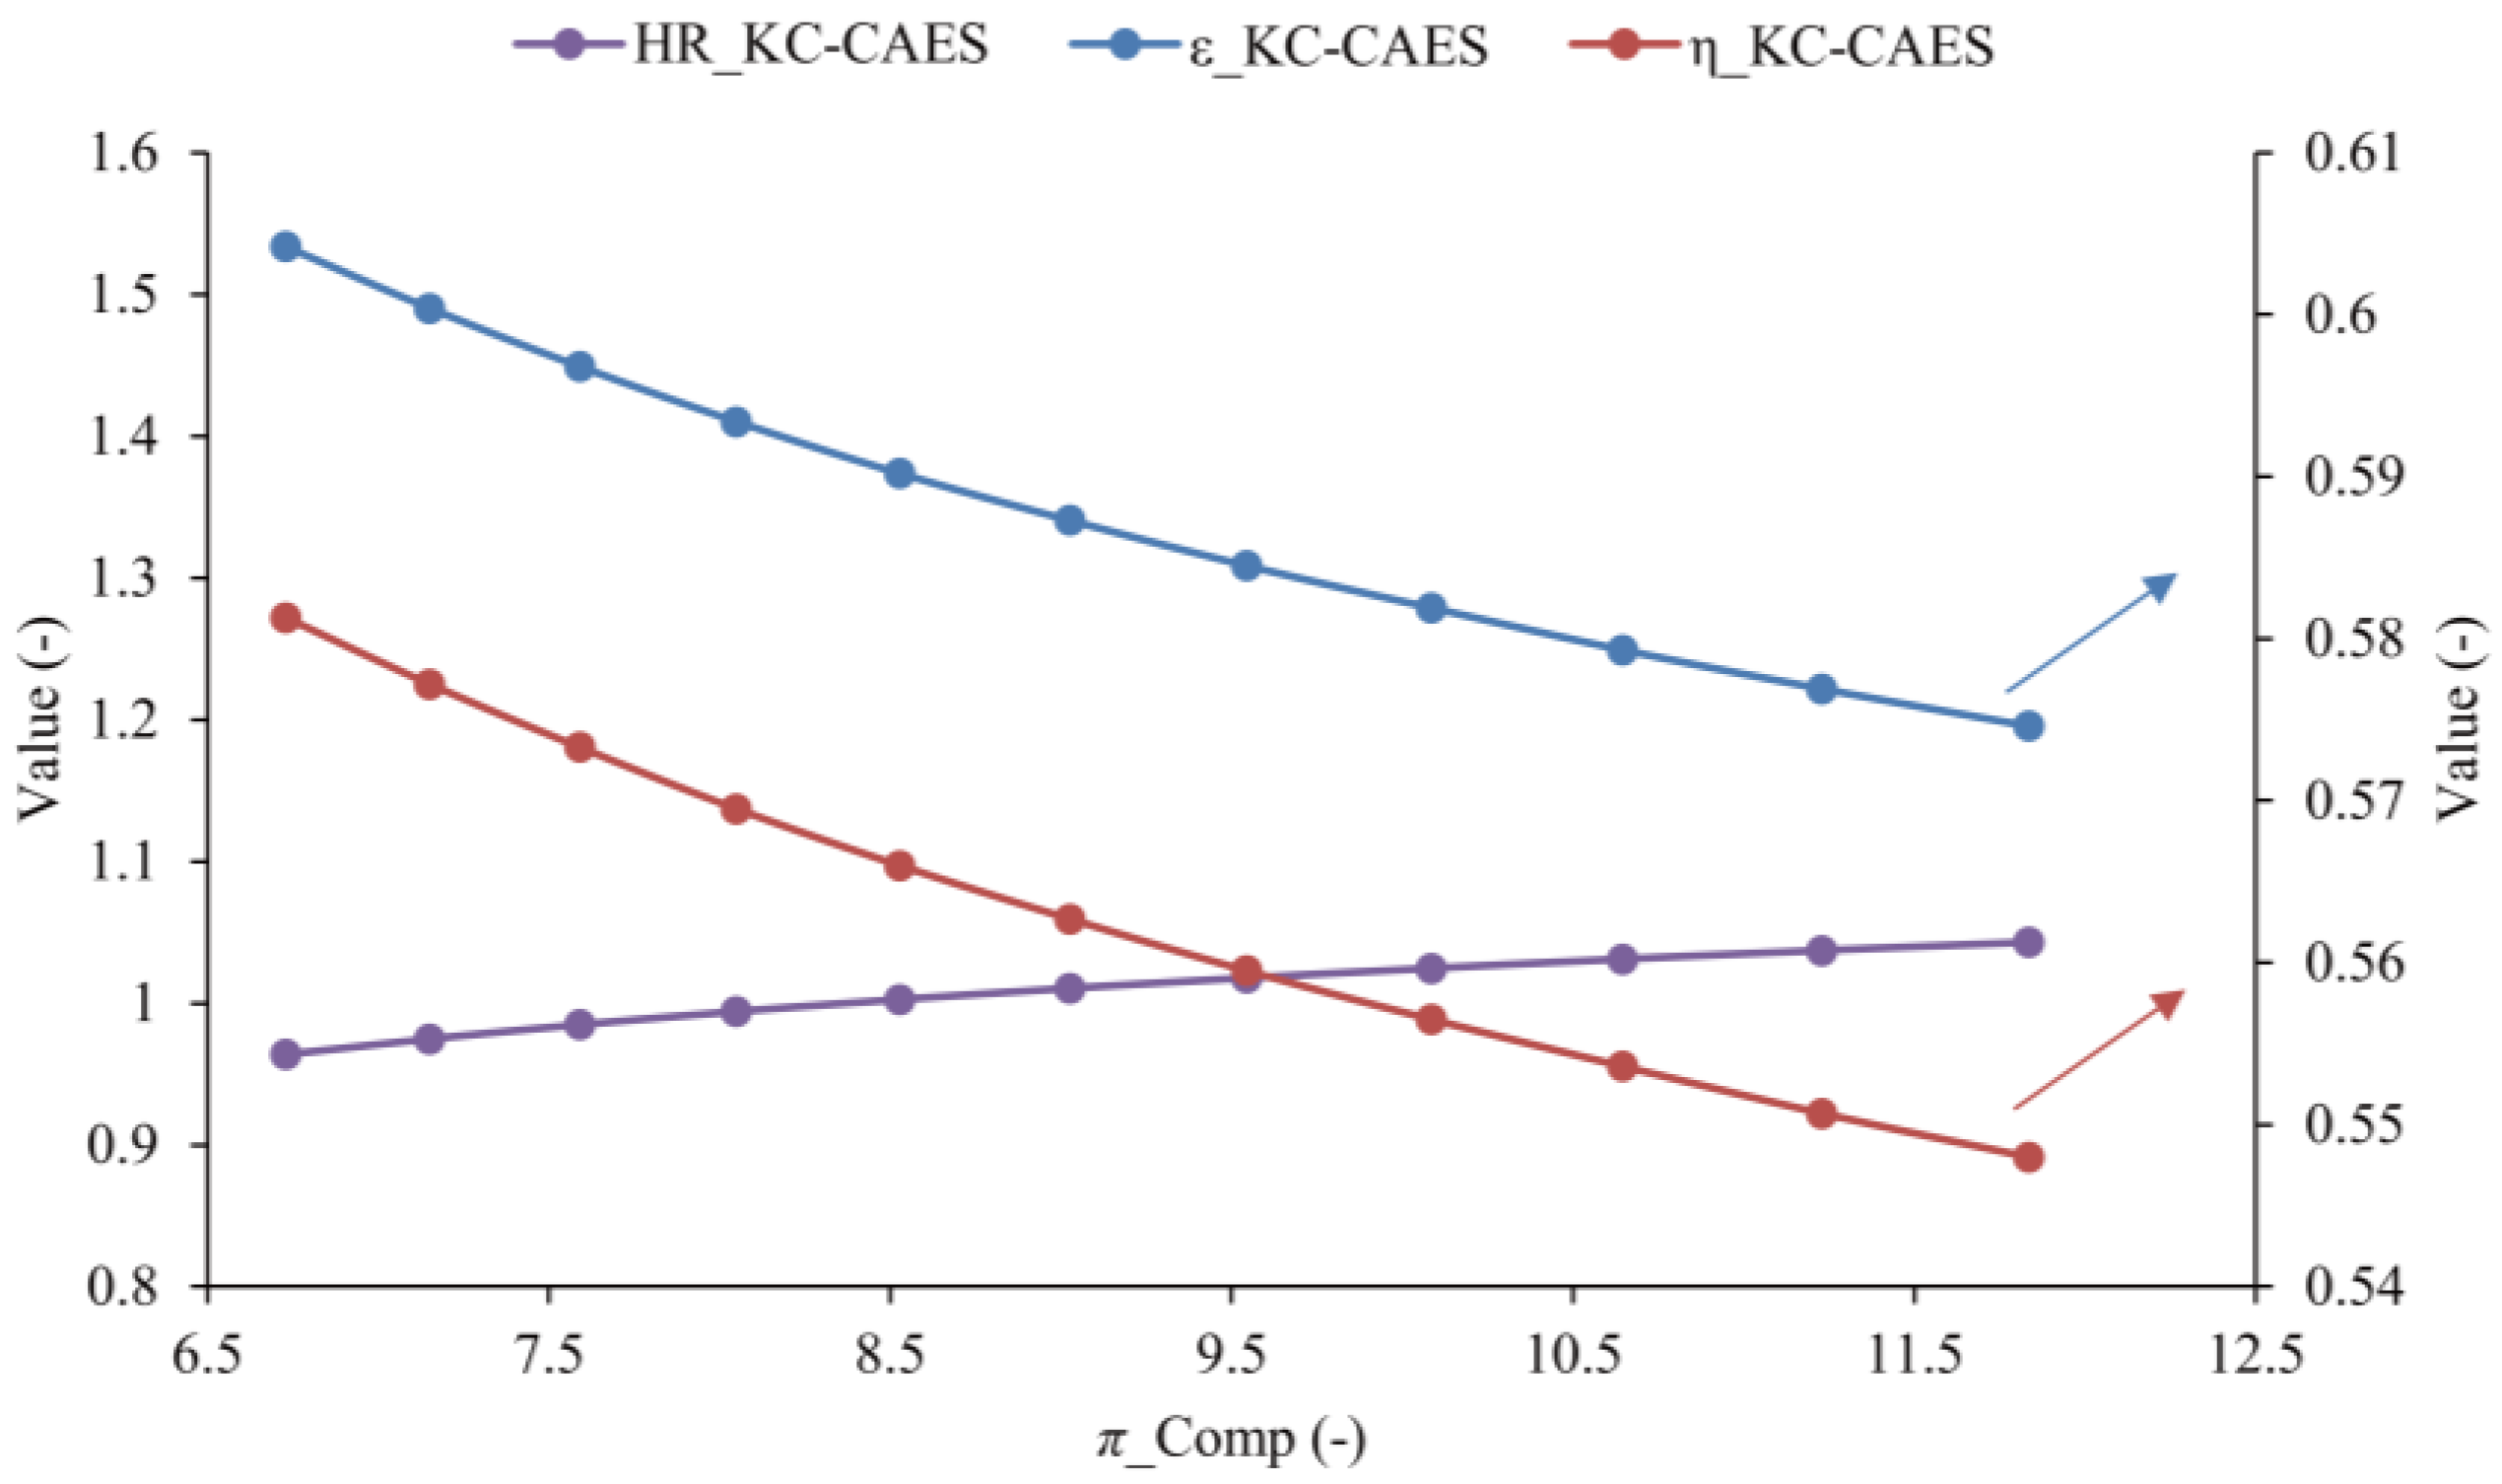
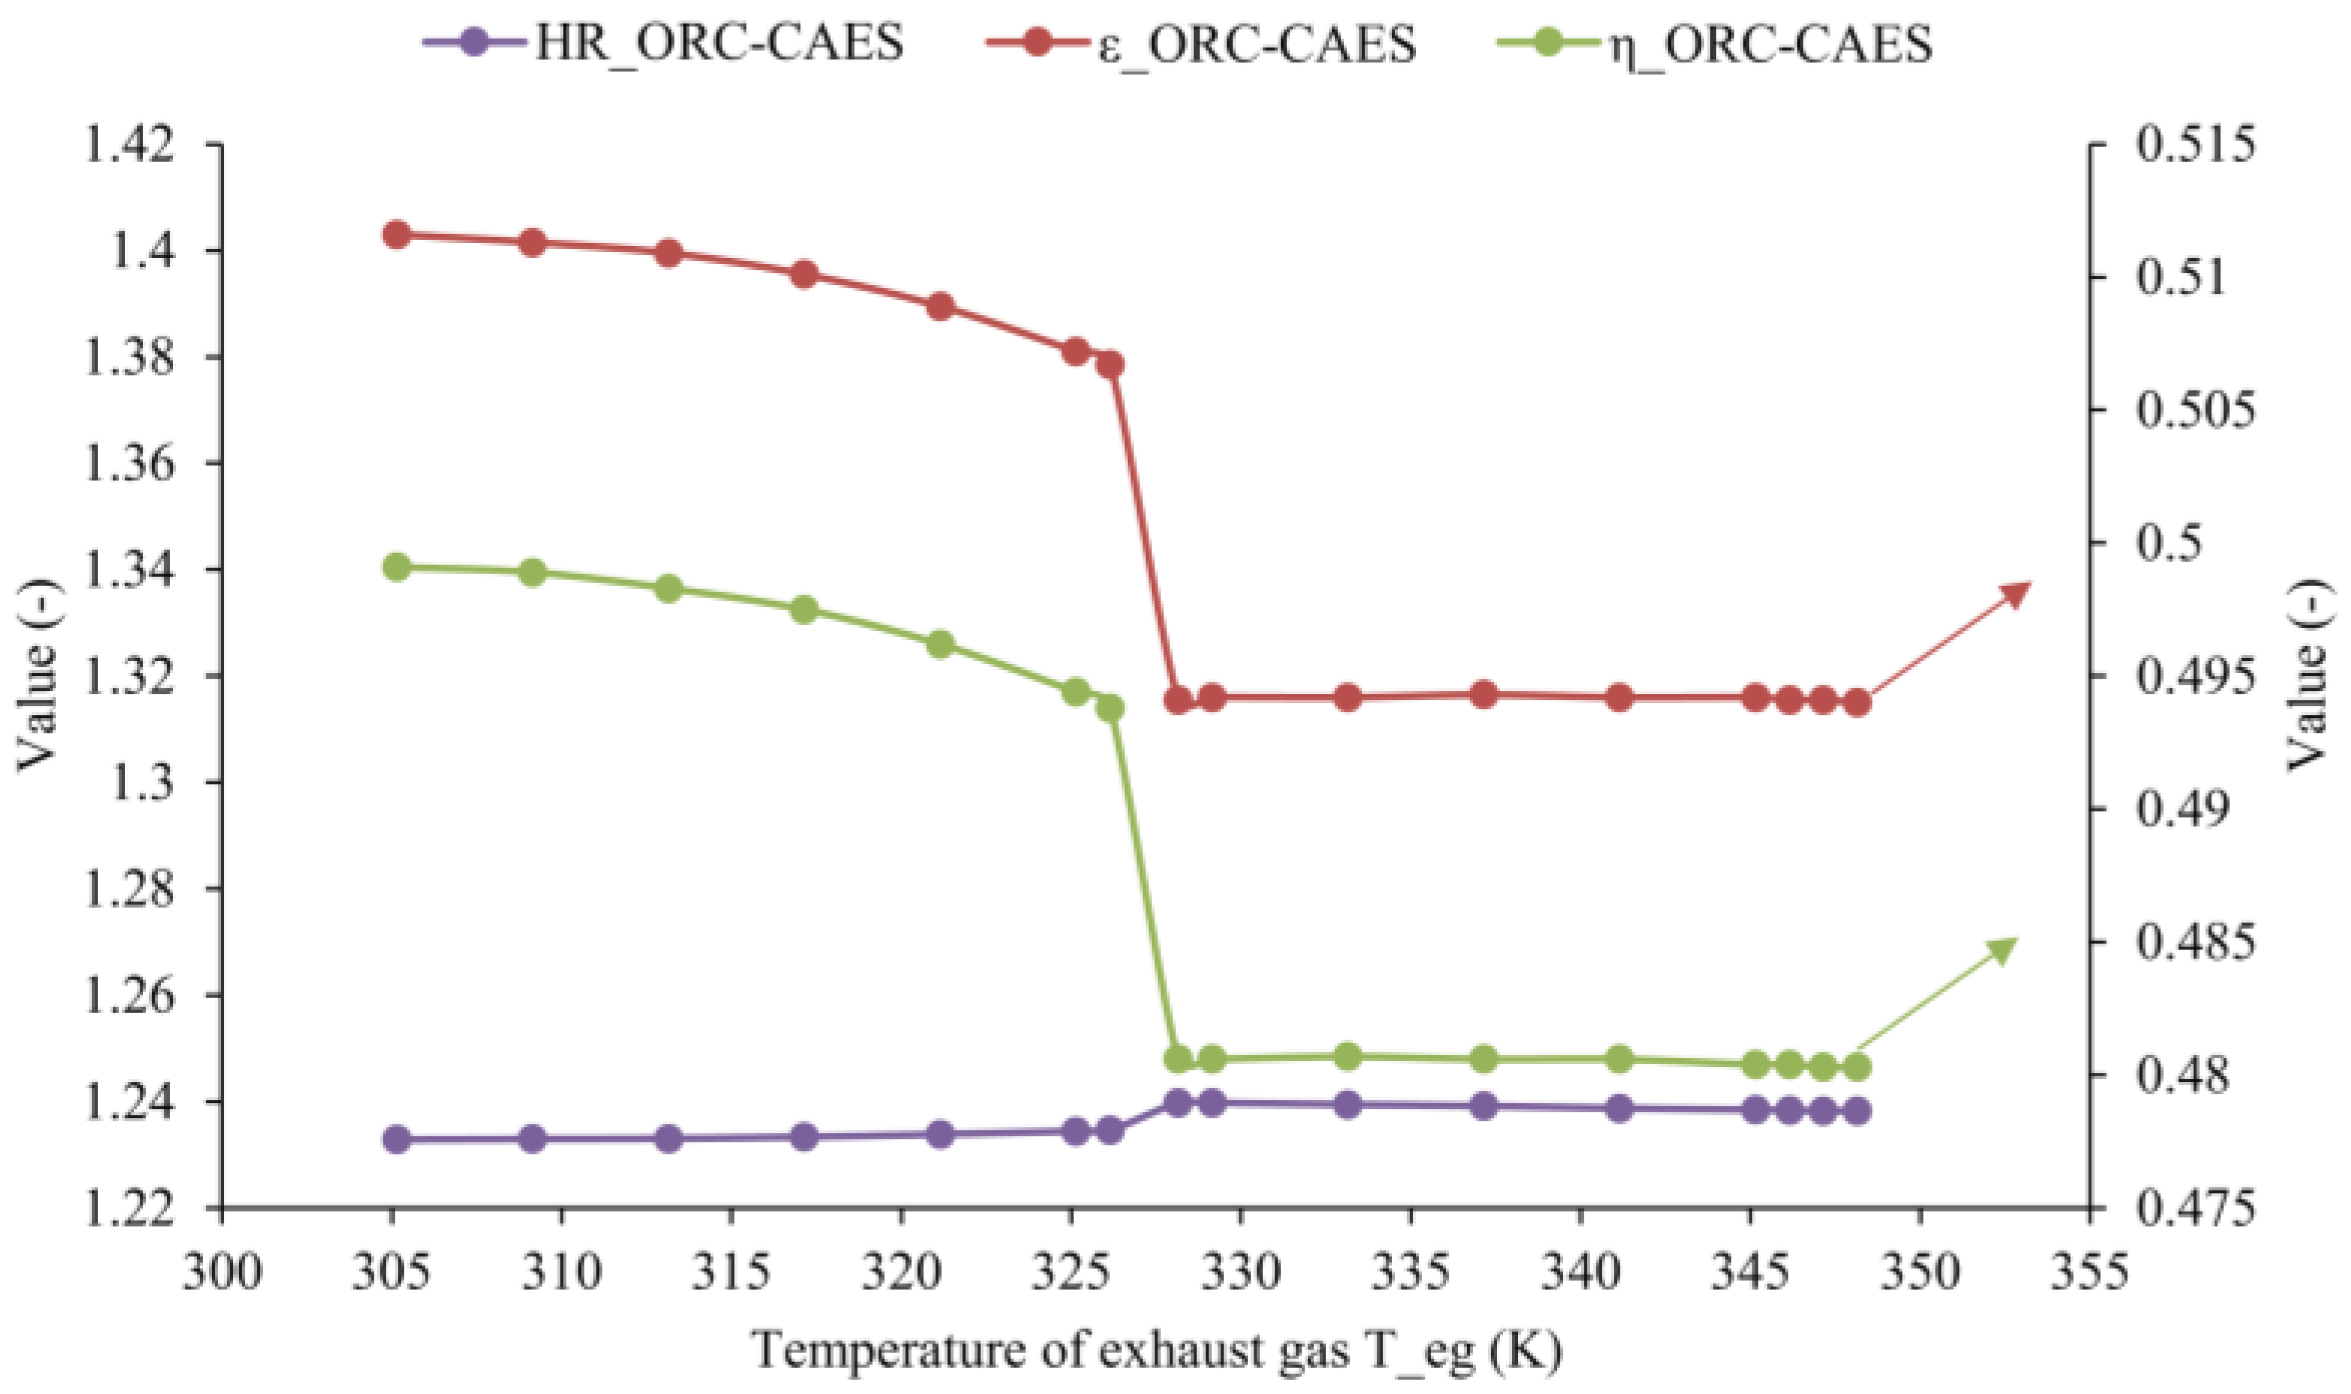
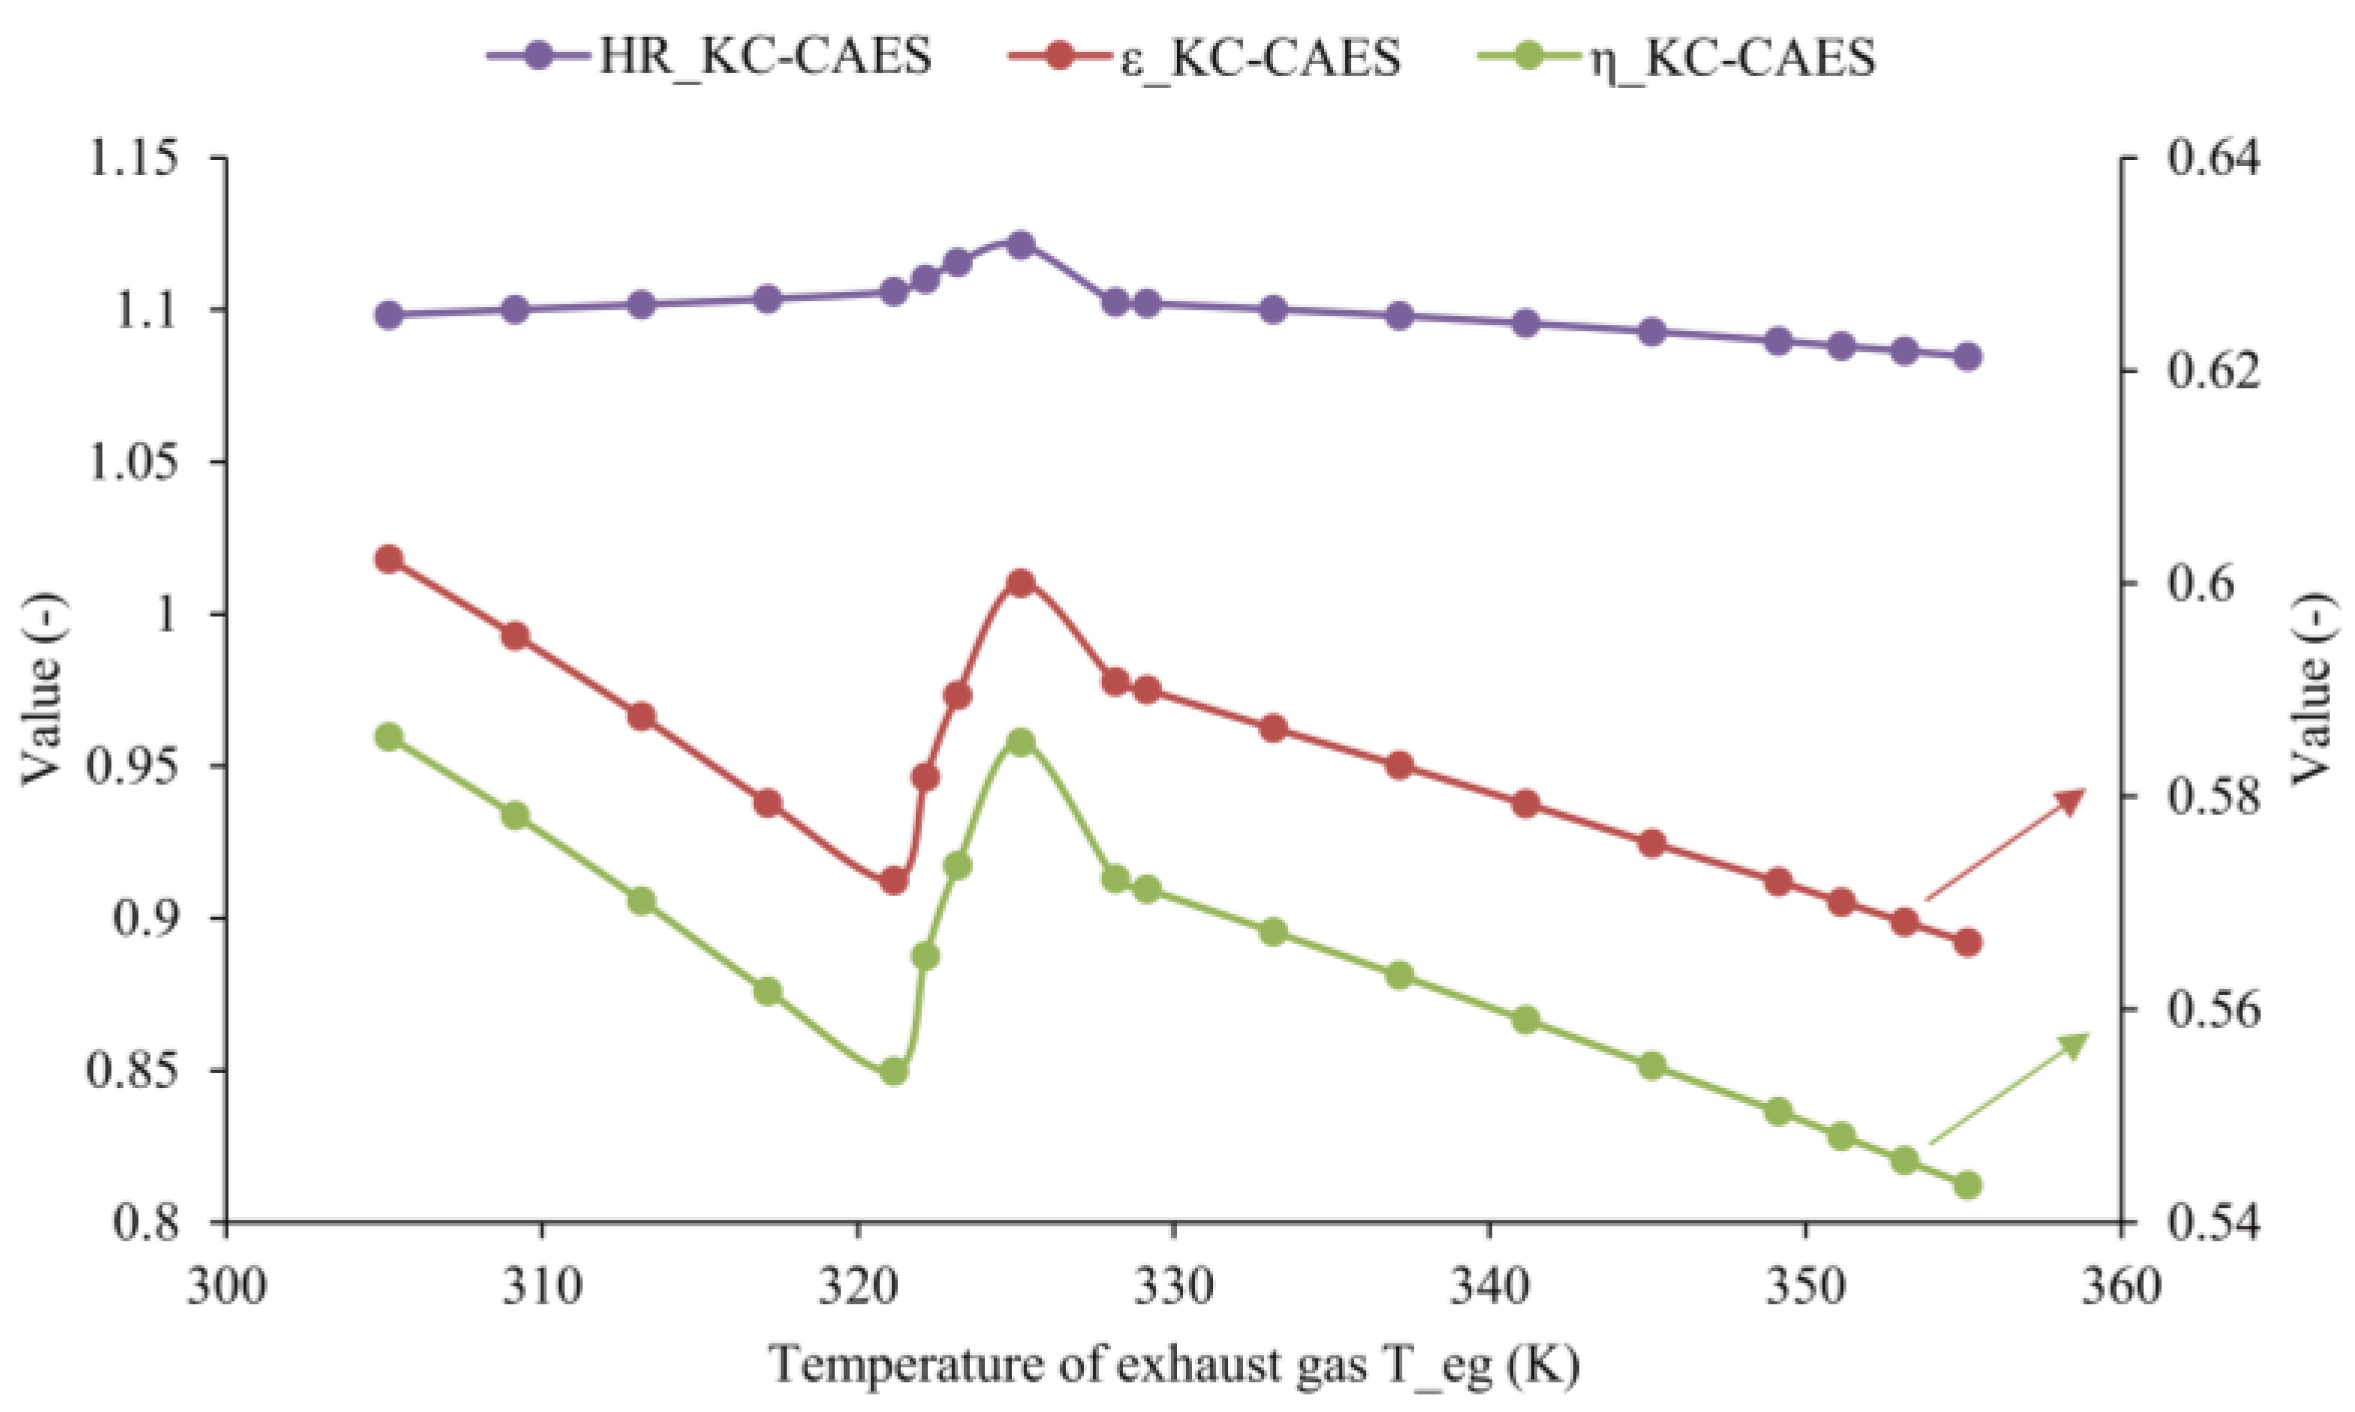
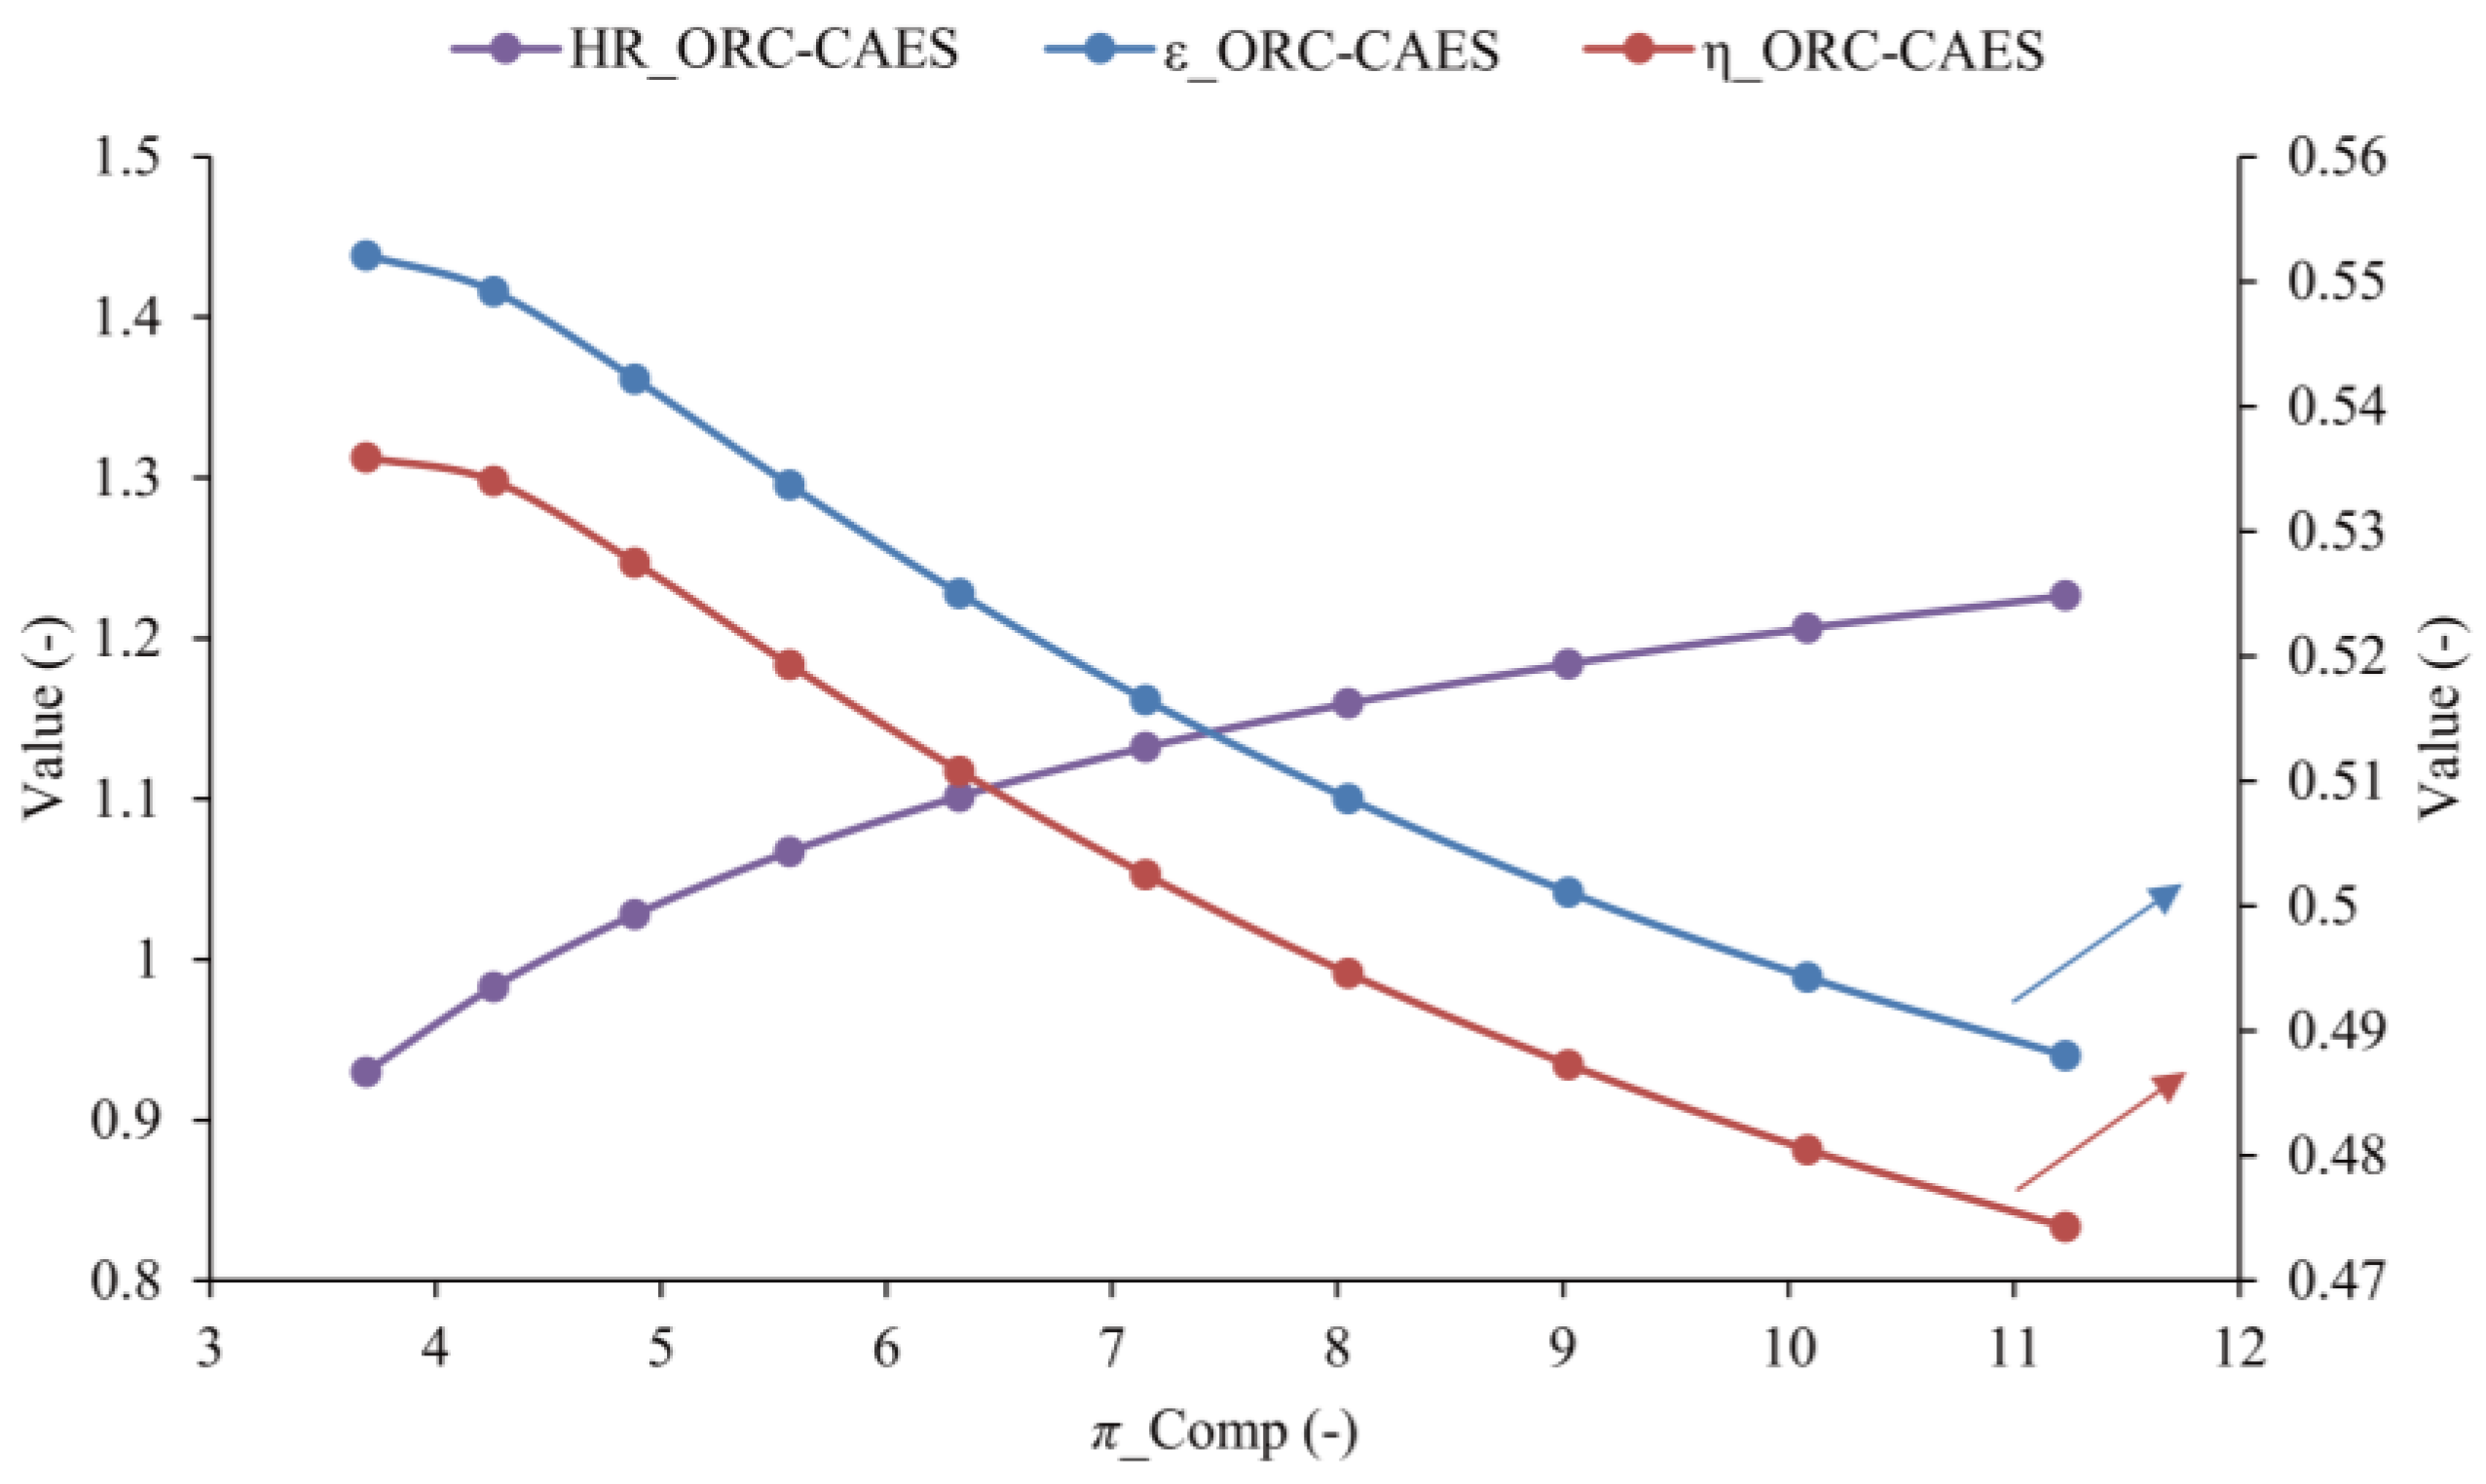
4.1. Sensitivity Analysis

The main thermodynamic parameters of the components in the systems are listed in Table 1. In this paper, the concentration of ammonia-water is 0.8 [43,44]. From the previous studies [25,44], the value of the temperature of exhaust gas ( T eg ) reveals the ability of waste recovery by the heat recovery cycle. In this paper, the compression ratio and temperature of the exhaust gas ( T eg ) are the key parameters to find the different requirements for the two proposed systems to recover the heat efficiently.
Figure 4 shows the effect of pressure ratio of the compressor ( π Comp ) on the exergy efficiency ( ε ORC-GAES ), round-trip efficiency ( η ORC-GAES ) and heat rate ( H R ORC-GAES ) of the ORC-CAES system. With the increasing π Comp , both ε ORC-GAES and η ORC-GAES decrease slowly at first; after the π Comp reaches 4.3, the system performance indicators decrease quickly. However, as the π Comp increases, the H R ORC-GAES increases from the beginning to the end. This is because the increasing π Comp causes the increasing irreversible loss of the compressor, which would lead to the decrement of exergy efficiency and the round-trip efficiency. In addition, the final pressure of the air storage vessel increases with the increment of π Comp , which will cause the increasing of the fuel consumption, resulting in the increase of the heat rate finally. Figure 5 shows the behaviors of the heat rate ( H R KC-GAES ), round-trip efficiency ( η KC-GAES ) and exergy efficiency ( ε KC-GAES ) of the KC-CAES systems. It can be seen that with increasing π Comp , ε KC-GAES and η KC-GAES of the KC-CAES system decrease, whereas H R KC-GAES increases. The reason for these trends is similar to the ORC-CAES system. Moreover, comparing Figure 4 with Figure 5, the exergy efficiency and the round-trip efficiency of KC-CAES are higher than that of ORC-CAES. This is because the boiling point of the ammonia-water can be adjusted to suit the heat input temperature of the heat source, resulting in a good temperature match between the heat source and the working fluid of KC.
The effect of the outlet temperature of the exhaust gas ( T eg ) on exergy efficiency ( ε ORC-GAES ), round-trip efficiency ( η ORC-GAES ) and the heat rate ( H R ORC-GAES ) of the ORC-CAES system are given in Figure 6. With the increasing T eg from 300 K to 325 K, ε ORC-GAES and η ORC-GAES of the system decrease slowly, whereas H R ORC-GAES increases slowly. This is because the exergy destruction of the compressor, gas engine and air turbine keep constant due to the fixed operation parameters; however, the increment in the outlet temperature of the exhaust gas leads to the decrement of the temperature difference between the inlet and outlet of the hot fluid of the evaporator, resulting in a decreasing heat recovery in the evaporator. After T eg reaches 325 K, with the increasing T eg , both the ε ORC-GAES and η ORC-GAES have remarkable plunges and then keep almost constant with the increase of temperature, whereas the H R ORC-GAES rises at first and then keeps constant. The reasons are the change of the thermodynamics property of the exhaust gas and that there is a breaking of the performance parameters of ORC-CAES systems when the T eg is in the range of 325 to 330 K. Figure 7 illustrates the effect of the outlet temperature of the turbine on the enthalpy and entropy of the exhaust gas. There is a sudden increase of the enthalpy and entropy as the outlet temperature increases, which is mainly caused by the changing of the compression factor of nitrogen.
Figure 8 exhibits the effect of the temperature of the exhaust gas of the KC-CAES system ( T eg ) on the exergy efficiency ( ε KC-GAES ), round-trip efficiency ( η KC-GAES ) and heat rate ( H R KC-GAES ). Similar to the effect of T eg on the exergy efficiency and round-trip efficiency of ORC-CAES, as T eg increases from 300 K to 320 K, the performance the parameters of the system decreases. However, there is little difference of the performance parameters between ORC-CAES and KC-CAES as T eg is higher than 320 K. This is because the thermodynamics property (entropy, density, etc.) of ammonia-water changes greatly compared to R245fa as the temperature increases, resulting in the power produced by the heat recovery cycle changing greatly.

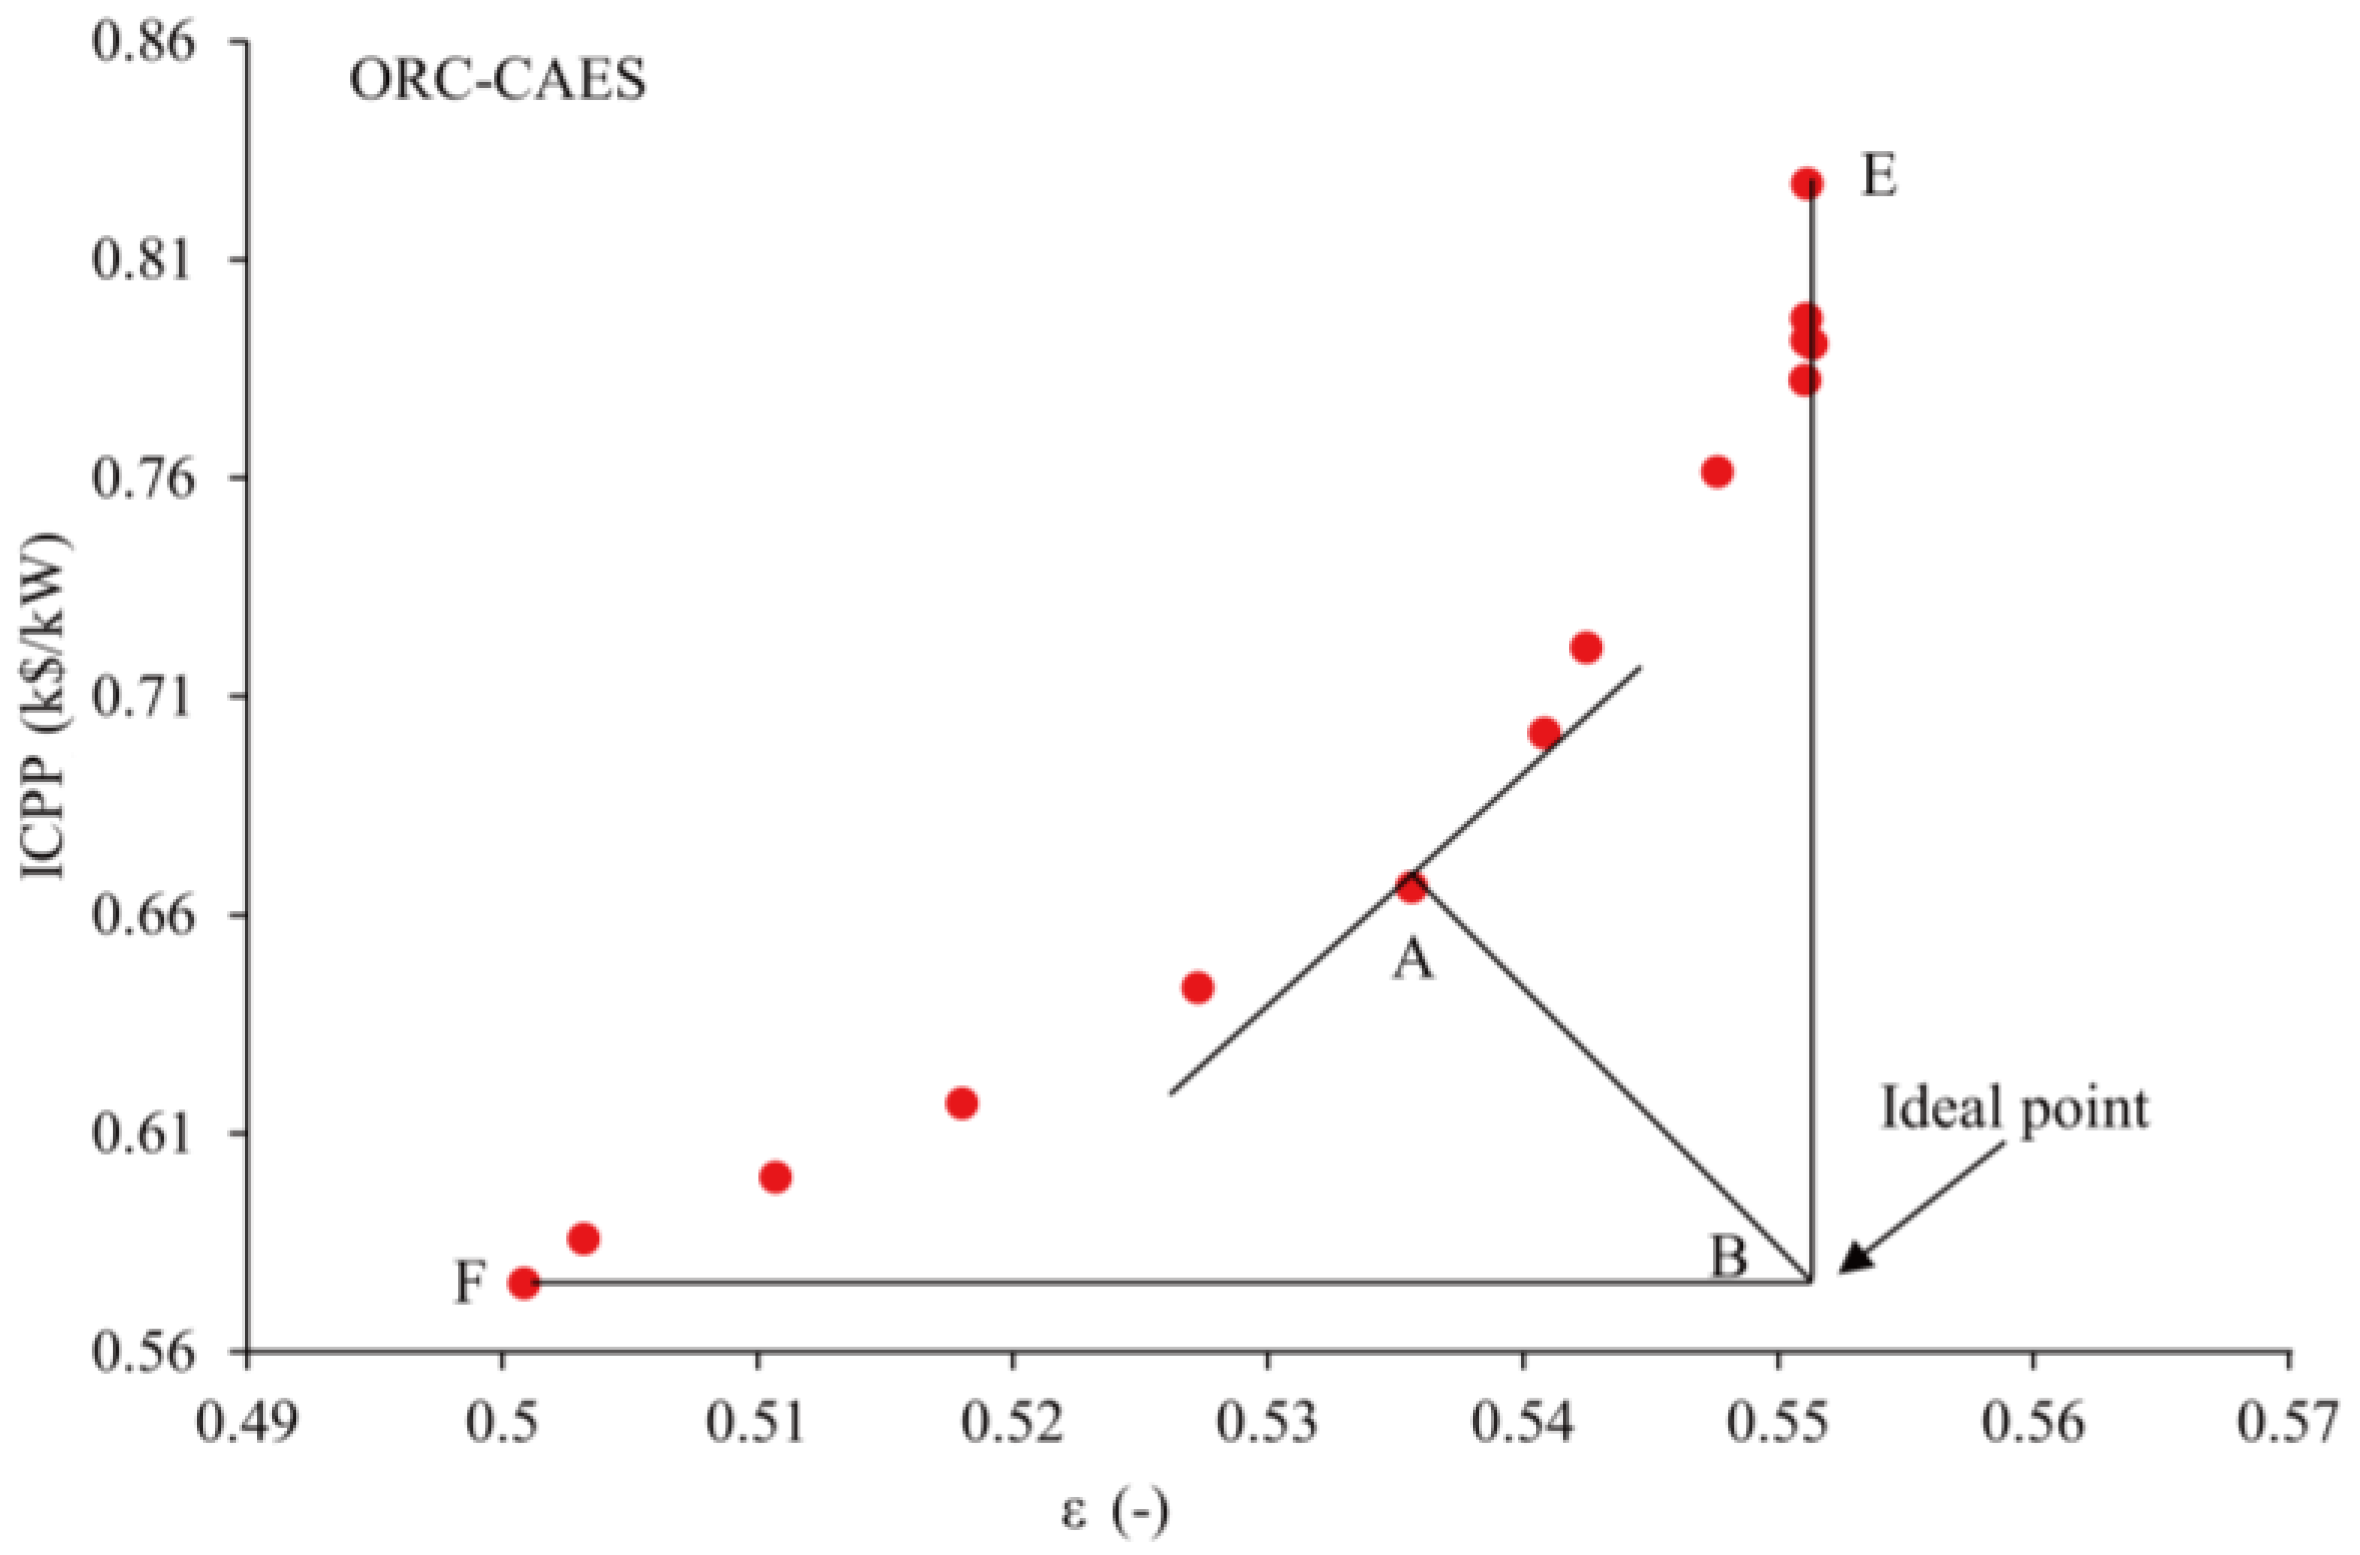
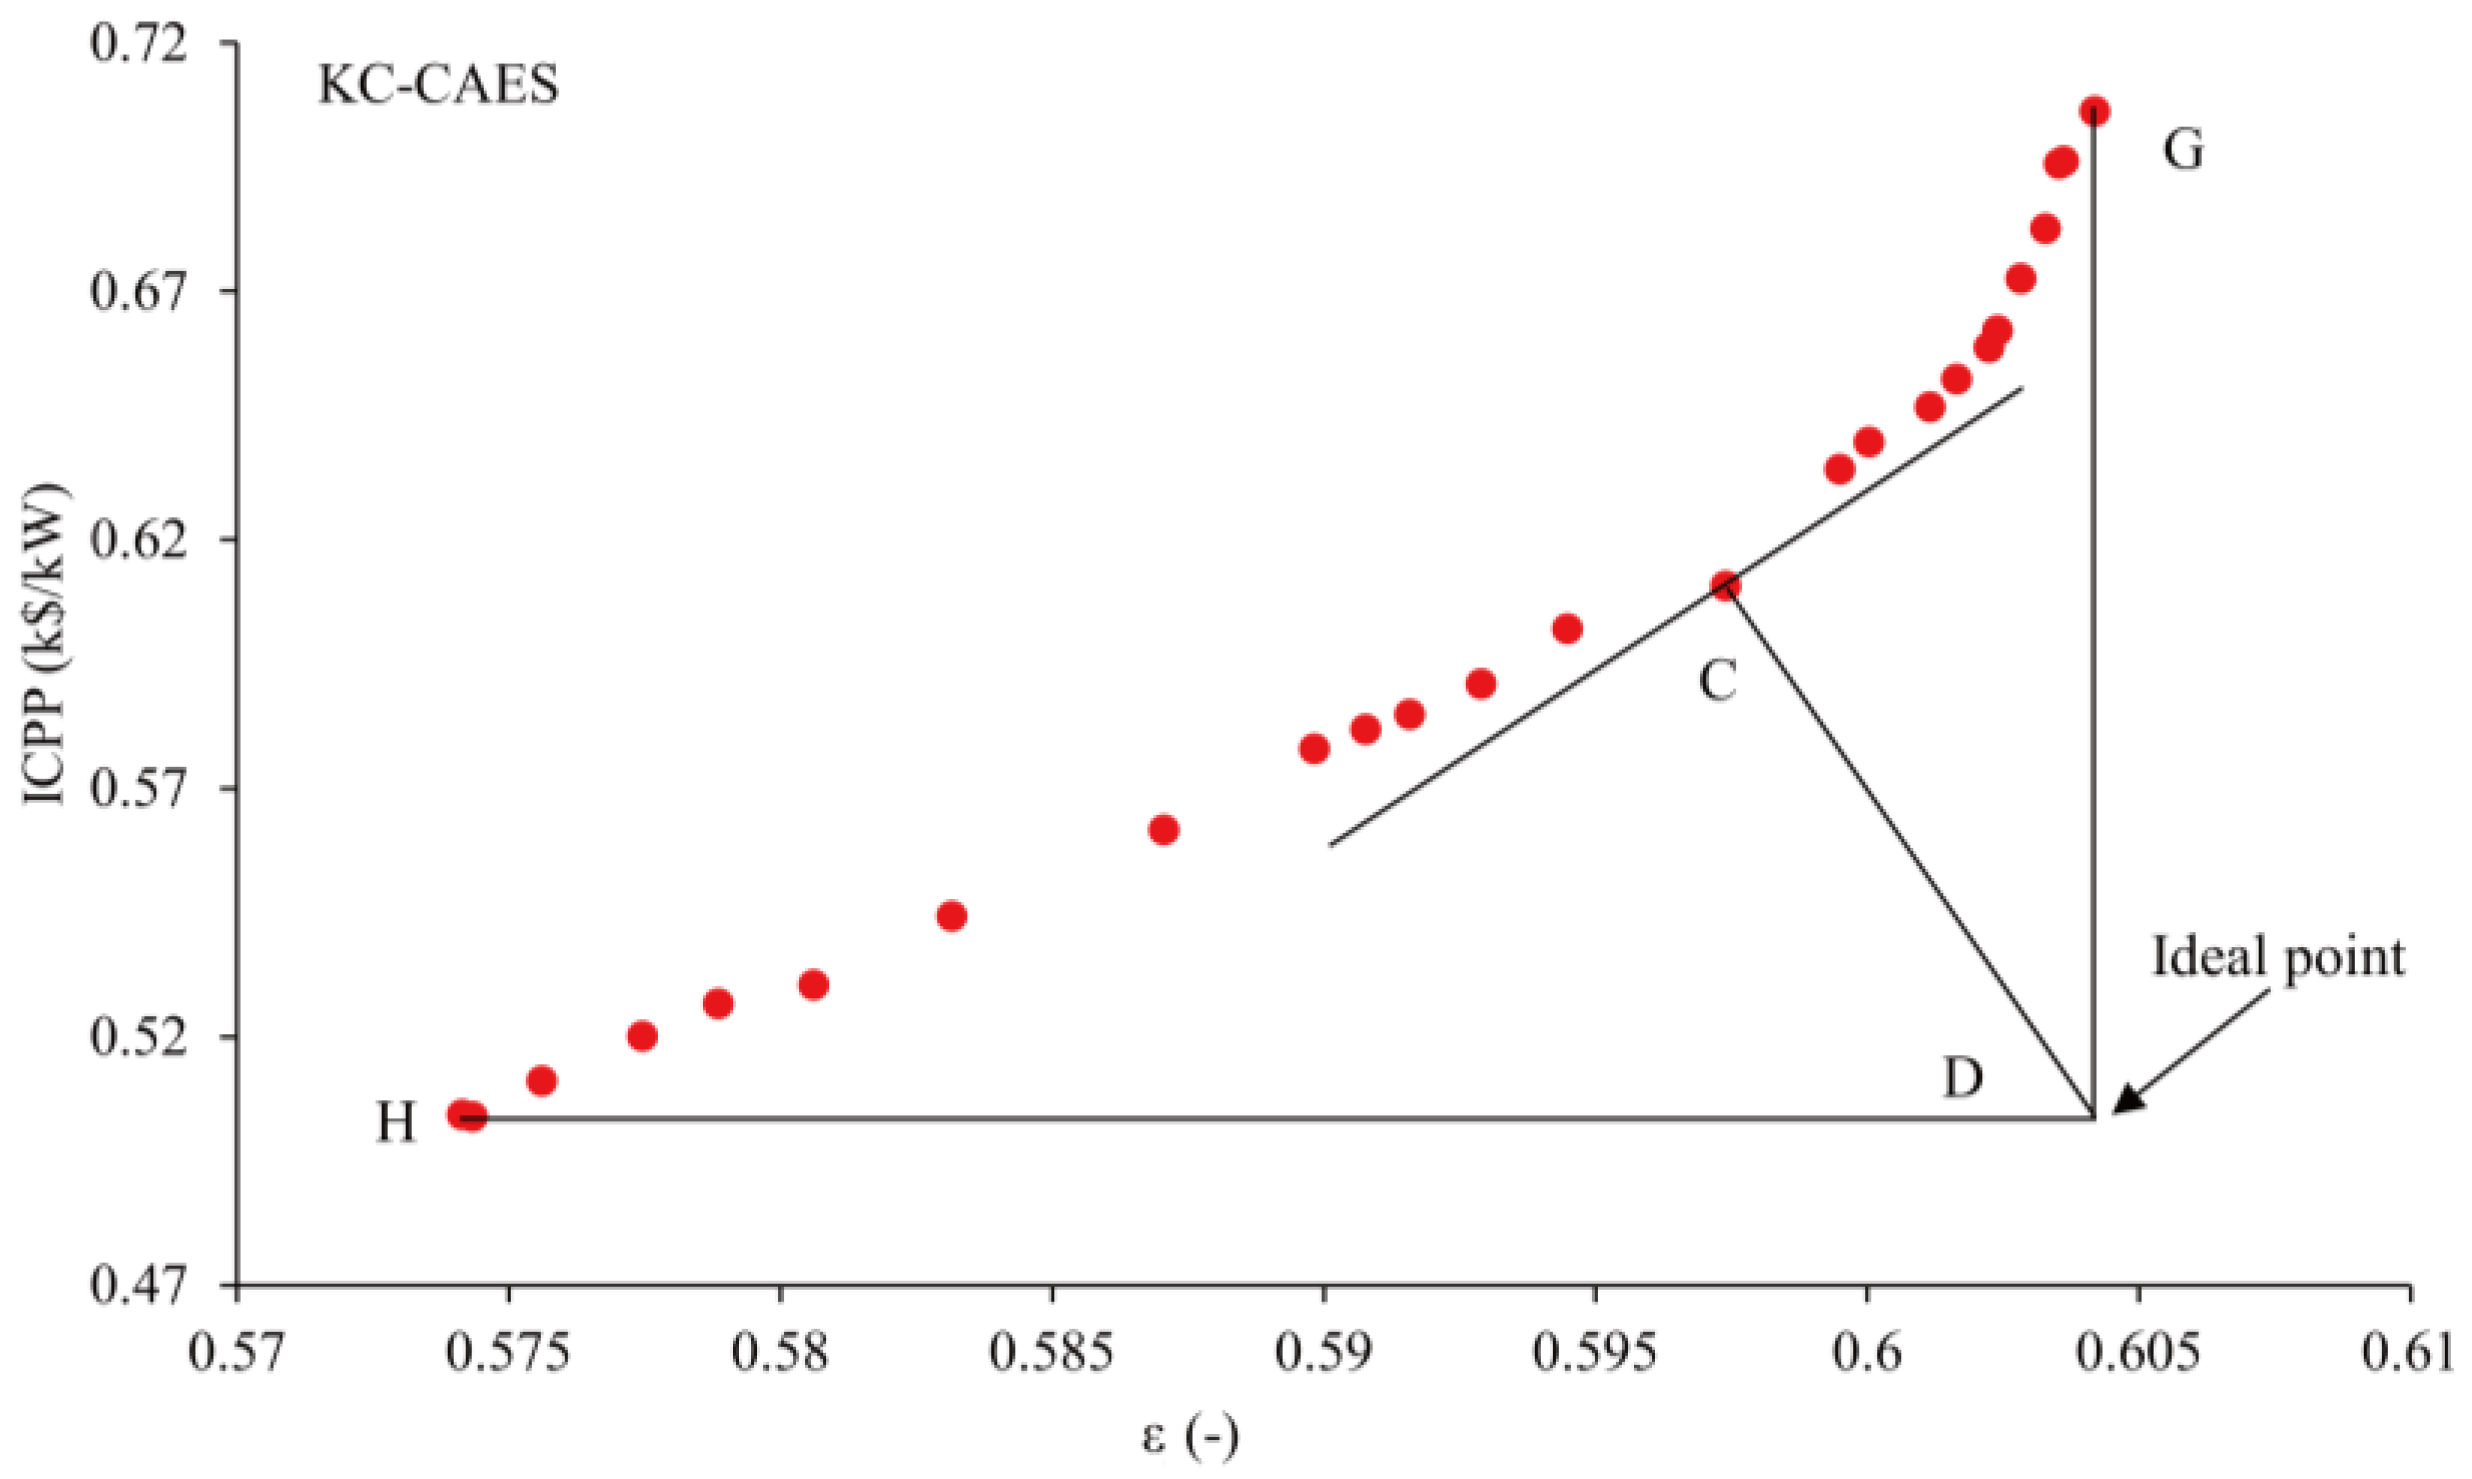
4.2. Parameter Optimization of Systems Based on the Genetic Algorithm

The sensitivity analysis shows the effect of a single system parameter on the system performance. In this section, the multi-objective optimization is carried out to find the trade-off between the thermodynamic performance and the economic performance of the system. The genetic algorithm (GA) is a method for solving both constrained and unconstrained optimization problems based on a natural selection process that mimics biological evolution. The algorithm repeatedly modifies a population of individual solutions. At each step, the GA selects individuals randomly from the current population and uses them as parents to produce the children for the next generation. Over successive generations, the population “evolves” toward an optimal solution [45,46].
To operate the system in the optimal state, the NSGA-П is employed with two decision variables: the temperature of the exhaust gas (ORC-CAES: 305–347.5 K, KC-CAES: 305–355 K) and the pressure ratio of the compressor (ORC-CAES: 3.7 to 11.2, KC-CAES: 6.5 to 11.8); setting the population size, generations and function tolerance to 100, 200 and 1 × 10⁻⁴ for the algorithm, to find the maximize exergy efficiency ( ε ) and minimize the total investment cost per total output power (ICPP).
Figure 9 shows the Pareto optimal solutions for the ORC-CAES system between exergy efficiency and ICPP. In the multi-objective optimization, each point located on the Pareto frontier is a potential optimum solution. It can be seen that the maximum exergy efficiency can reach 55.2% as the ICPP achieves the maximum value of 0.83 k$/kW (Point E), whereas the minimum exergy efficiency of 50.1% is obtained, and the ICPP also attains the minimum value of 0.57 k$/kW (Point F). Since it is impossible to make each objective at its optimum value simultaneously, i.e., to achieve the greatest value of exergy efficiency and the lowest value of ICPP (Point B), the process of decision-making is mostly performed based on engineering experiences [27,29]. While in this paper, the design point in the Pareto front, which has the shortest distance from the hypothetical Point B, is selected as the final optimal design point (Point A) [29]. In addition, the Pareto front is flat when the exergy efficiency is below approximately 53.56%. Afterward, the ICPP increases substantially in the course of the increase in exergy efficiency. With the help of the above decision-making process, Point A with the exergy efficiency value of 53.56% and the ICPP of 0.67 k$/kW is selected as the final optimal solution that is promising for engineering design.
Figure 10 gives the Pareto optimal solutions for the KC-CAES system between exergy efficiency and ICPP. The minimum exergy efficiency achieves 57.3% with the minimum ICPP (Point H), whereas as the investment cost obtains the maximum, the maximum exergy efficiency is obtained (Point G). Point D, which is a hypothetical point, is the ideal point with the minimum investment cost and maximum exergy efficiency. Point C possesses the shortest distance from the hypothetical point and is selected as the final optimal solution that is promising for engineering design.
Thus, the final optimal parameters of the two systems are shown in Table 2. Comparing with the ORC-CAES system, the KC-CAES system can achieve a lower temperature of the exhaust gas under the optimum conditions, resulting in less waste of the exhaust heat and higher exergy efficiency; besides, the KC-CAES system can operate at lower capital cost at the optimum conditions.
The relative efficiency of the two proposed systems, including relative round-trip efficiency ( ( η HRC-CAES η CAES ) / η HRC-CAES ) and relative exergy efficiency ( ( ε HRC-CAES ε CAES ) / ε HRC-CAES ), based on the single CAES system are given in Table 3. It can be seen that the second law efficiency of the proposed KC-CAES and ORC-CAES system improves 27.32% and 16.83% compared to that of the single CAES system, respectively. The round-trip efficiency of the combined two systems improves 27.35% (KC-CAES) and 16.89% (ORC-CAES). Moreover, the KC-CAES system achieves higher exergy and round-trip efficiency than those of the ORC-CAES system. The reason is that KC could provide a better match to a heat source and could achieve higher efficiency (20.5%) operation than that of ORC (11.7%).

5. Conclusions

In this paper, two novel compressed air energy storage systems (CAES), i.e., CAES combined with the organic Rankine cycle (ORC-CAES) and CAES combined with the Kalina cycle (KC-CAES), are proposed to utilize renewable energy sources efficiently by recovering the residual heat recovery. The dependence of the system’s thermodynamic performance on the compression ratio and temperature of the exhaust is investigated by a sensitivity analysis. Besides, the multi-objective optimization is conducted to find the optimal parameters of the two systems. The main conclusions are summarized as follows:
(1)
Firstly, increasing the pressure ratio of the compressor, the exergy efficiency and round-trip efficiency of the two energy systems decrease, resulting in the operation performance of the systems become worse. Secondly, the effect of the temperature of exhaust gas on KC-CAES is more obvious than that of the ORC-CAES; the KC-CAES system possesses higher operation efficiency and a lower heat rate, which illustrates that the Kalina cycle is more suitable as a heat recovery cycle of the CAES system.
(2)
For ORC-CAES, due to the changes in the total investment cost per total output power (ICPP) being relatively slow when the efficiency is less than 53.56%, the ICPP increases significantly when the efficiency is more than 53.56%; the optimal solutions around exergy efficiency of 53.56% are suggested for industrial applications. Moreover, the exergy efficiency value of 59.74% has been selected for the KC-CAES system as the final optimal solution, which is based on the design point in the Pareto front having the shortest distance from the hypothetical point.

Acknowledgments

The authors are grateful to the support given by the National Natural Science Foundation of China (51676151).

Author Contributions

Ruixiong Li dealt with the detailed calculations, the simulation and was responsible for drafting and revising the whole paper. Erren Yao revised the grammar and the structure of the whole paper. Shuyu Zhang and Huanran Wang gave some useful suggestions on the system modelling.

Conflicts of Interest

The authors declare no conflict of interest.

Abbreviations

The following abbreviations are used in this manuscript:
A area of components (m2)
b channel spacing (m)
B o boiling number
C capital cost
c p specific heat capacity at constant pressure (J/kg·K)
E x exergy (kJ)
G mass velocity
h enthalpy (kJ/kg)
H T C heat transfer coefficient (W/m2·K)
k isentropic exponent
K constant
L average distance between the channel (m)
L H V lower heating value (J/kg)
m ˙ flow rate (kg/s)
N number of channel
N u Nusselt number
p pressure (pa)
P r Prandtl number
R e Reynolds number
R g universal gas constant (J/kg·K)
T temperature (K)
U overall heat transfer coefficient (W/m2·K)
V volume of components (m3)
W ˙ power (kW)
x mass fraction of ammonia
Greek letters
βchevron angle
δthickness of the plate (m)
εexergy efficiency
ηround-trip efficiency
λthermal conductivity of fluid (W/m·K)
μdynamic viscosity (N·s/m2)
πpressure ratio
ρdensity (kg/m3)
Subscripts and superscripts
chchemical
coldcold fluid
Compcompressor
Concondenser
Divdiverter
egexhaust gas
Evaevaporator
GEgas engine
Hhexhigh pressure regenerator
hothot fluid
HRCheat recovery cycle
ininput of the system
ixmaterial stream
jxchemical components
KKalina cycle
Lhexlow pressure regenerator
OORC
outoutput of the system
Pproduct
phphysical
PSproposed system
Pumpump
sisentropic
tottotal
Turturbine
xpercentage of components

Appendix A

The large-scale application of the energy system can be determined by economic operation, which means lower-cost and higher profits. Therefore, an economic analysis of a novel compressed air energy storage (CAES) system is conducted in order to optimize the business-economic profits on the market. The centrifugal pump is employed in the two proposed systems.
The total investment of the novel systems:
C Total , PS = C Total , CAES + C Total , HRC ,
where the subscript PS represents the proposed system, ORC-CAES (CAES combined with ORC) or KC-CAES (CAES combined with Kalina cycle), and the subscript HRC denotes the heat recovery cycle: KC (Kalina cycle) or ORC (organic Rankine cycle); C Total , CAES is the overall capital cost of the CAES, and C Total , HRC is the overall capital cost of the heat recovery cycle.
(1) Economic model of KC and ORC:
The overall capital cost of the system is determined by the summation of individual components:
C Total , HRC = C Ci , HRC + C Cj , HRC
where C Ci , HRC and C Cj , HRC represent the capital cost of components in the heat recovery cycle.
The capital cost of components (including turbine, separator, mixer or diverter) in the cycle is expressed as [29,47]:
C Ci , HRC = 584.6 397 F Ci , MP F S C Ci , HRC 0 ,
where the subscript Ci represents components in the cycle, such as the turbine, separator, mixer or diverter. F Ci , MP is the material and pressure factor of the components (stainless steel). F S is the additional factor. C Ci , HRC 0 is the basic cost of the components made from carbon steel and can be given by [29,47]:
log C Ci , HRC 0 = K 1 , Ci , HRC + K 2 , Ci , HRC log W ˙ Ci , HRC + K 3 , Ci , HRC ( log W ˙ Ci , HRC ) 2 ,
where W ˙ Ci , HRC is the power output for the turbine, whereas W ˙ Ci , HRC represents the volume for the separator, mixer or diverter. K 1 , Ci , HRC , K 2 , Ci , HRC and K 3 , Ci , HRC are respectively constants for the components’ type.
For other components (including the pump and heat exchanger), the capital cost is given by [4,29,47]:
C Cj , HRC = 584.6 397 ( B 1 , Cj + B 2 , Cj F Cj , M F Cj , P ) F S C Cj , HRC 0
where Cj represents the pump or heat exchanger. B 1 , Cj and B 2 , Cj are constants for the component type. F Cj , M and F Cj , P are the material factor and pressure factor of components (stainless steel). C Cj , HRC 0 is the basic cost of components made from carbon steel.
log C Cj , HRC 0 = K 1 , Cj , HRC + K 2 , Cj , HRC log W ˙ Cj , HRC + K 3 , Cj , HRC ( log W ˙ Cj , HRC ) 2 ,
where K 1 , Cj , HRC , K 2 , Cj , HRC and K 3 , Cj , HRC are constants for the components. W ˙ Cj , HRC is the consumption power for the pump.
log F Cj , P = C 1 , Cj + C 2 , Cj log P Cj + C 3 , Cj ( log P Cj ) 2
Note that C 1 , Cj , C 2 , Cj and C 3 , Cj are constants for the component type. P Cj is the design pressure of the corresponding components [4,29,47].
(2) Economic model of CAES:
The economic models proposed by Couper et al. [48,49,50] are employed in calculating the capital cost of CAES.
C Total , CAES = C Tur + C Comp + C Reg + C GE + C vessel ,
where C Tur , C Comp , C GE and C vessel denote the air turbine (Tur), compressor (C1 and C2), gas engine (GE) and air storage vessel.
Equations for evaluating the capital cost of the CAES components are shown in Table A1.
Table A1. Capital cost model of each component of the CAES.
ComponentsInvestment Model (k$)
Air turbine, Tur C Tur = 0.110 ( W ˙ Tur ) 0.81 [49,50]
Compressor, C1 or C2 C Comp = 0.790 ( W ˙ Comp ) 0.62 [49,50]
Regenerator, Reg C Reg = 1.218 f d f m f p exp [ 8.821 0.30863 ( ln A Reg ) + 0.0681 ( ln A Reg ) 2 ] 10 4 [49]
Gas engine, GE C GE = 0.65 W ˙ GE ( 16137 W ˙ GE 0.3799 ) 10 4 [48]
Air storage vessel C vessel = 10 4 × 1.218 exp [ 2.631 + 1.3673 ( ln V vessel ) 0.06309 ( ln V vessel ) 2 ] [49]
fd: type correction factor; fm: material correction factor; fp: pressure correction factor. W ˙ Tur , W ˙ Comp and W ˙ GE are respectively the output power of the turbine, the power consumption of the compressor and the output power by the gas engine. A Reg and V vessel present the area of the regenerator and the volume of the air storage vessel.

References

  1. Wolf, D.; Budt, M. LTA-CAES—A low-temperature approach to Adiabatic Compressed Air Energy Storage. Appl. Energy 2014, 125, 158–164. [Google Scholar] [CrossRef]
  2. Dudiak, J.; Kolcun, M. Integration of renewable energy sources to the power system. In Proceedings of the 14th International Conference on Environment and Electrical Engineering (EEEIC), Krakow, Poland, 10–12 May 2014.
  3. De Bosio, F.; Verda, V. Thermoeconomic analysis of a Compressed Air Energy Storage (CAES) system integrated with a wind power plant in the framework of the IPEX Market. Appl. Energy 2015, 152, 173–182. [Google Scholar] [CrossRef]
  4. Yao, E.; Wang, H.; Liu, L.; Xi, G. A Novel Constant-Pressure Pumped Hydro Combined with Compressed Air Energy Storage System. Energies 2015, 8, 154–171. [Google Scholar] [CrossRef]
  5. Yao, E.; Wang, H.; Wang, L.; Xi, G.; Maréchal, F. Thermo-economic optimization of a combined cooling, heating and power system based on small-scale compressed air energy storage. Energy Convers. Manag. 2016, 118, 377–386. [Google Scholar] [CrossRef]
  6. Tessier, M.J.; Floros, M.C.; Bouzidi, L.; Narine, S.S. Exergy analysis of an adiabatic compressed air energy storage system using a cascade of phase change materials. Energy 2016, 106, 528–534. [Google Scholar] [CrossRef]
  7. Zhang, Y.; Yang, K.; Li, X.; Xu, J. The thermodynamic effect of thermal energy storage on compressed air energy storage system. Renew. Energy 2013, 50, 227–235. [Google Scholar] [CrossRef]
  8. Zhao, P.; Wang, J.; Dai, Y. Thermodynamic analysis of an integrated energy system based on compressed air energy storage (CAES) system and Kalina cycle. Energy Convers. Manag. 2015, 98, 161–172. [Google Scholar] [CrossRef]
  9. Grazzini, G.; Milazzo, A. Thermodynamic analysis of CAES/TES systems for renewable energy plants. Renew. Energy 2008, 33, 1998–2006. [Google Scholar] [CrossRef]
  10. Arabkoohsar, A.; Machado, L.; Farzaneh-Gord, M.; Koury, R.N.N. Thermo-economic analysis and sizing of a PV plant equipped with acompressed air energy storage system. Renew. Energy 2015, 83, 491–509. [Google Scholar] [CrossRef]
  11. Arabkoohsar, A.; Machado, L.; Farzaneh-Gord, M.; Koury, R.N.N. The first and second law analysis of a grid connected photovoltaic plant equipped with a compressed air energy storage unit. Energy 2015, 87, 212–214. [Google Scholar] [CrossRef]
  12. Simpore, S.; Garde, F.; David, M.; Marc, O.; Castaing-Lasvignottes, J. Design and Dynamic Simulation of a Compressed Air Energy Storage System (CAES) Coupled with a Building, an Electric Grid and a Photovoltaic Power Plant. Clima 2016, 4, 1–11. [Google Scholar]
  13. Abbaspour, M.; Satkin, M.; Mohammadi-Ivatloo, B.; Hoseinzadeh Lotfi, F.; Noorollahi, Y. Optimal operation scheduling of wind power integrated with compressed air energy storage (CAES). Renew. Energy 2013, 51, 53–59. [Google Scholar] [CrossRef]
  14. Zhao, P.; Wang, M.; Wang, J.; Dai, Y. A preliminary dynamic behaviors analysis of a hybrid energy storage system based on adiabatic compressed air energy storage and flywheel energy storage system for wind power application. Energy 2015, 84, 825–839. [Google Scholar] [CrossRef]
  15. Fu, Z.; Lu, K.; Zhu, Y. Thermal System Analysis and Optimization of Large-Scale Compressed Air Energy Storage (CAES). Energies 2015, 8, 8873–8886. [Google Scholar] [CrossRef]
  16. Bouman, E.A.; Øberg, M.M.; Hertwich, E.G. Environmental impacts of balancing offshore wind power with compressed air energy storage (CAES). Energy 2016, 95, 91–98. [Google Scholar] [CrossRef] [Green Version]
  17. Gulagi, A.; Aghahosseini, A.; Bogdanov, D.; Breyer, C. Comparison of the Potential Role of Adiabatic Compressed Air Energy Storage (A-CAES) for a Fully Sustainable Energy System in a Region of Significant and Low Seasonal Variations. In Proceedings of the International Renewable Energy Storage Conference, Düsseldorf, Germany, 15–17 March 2016.
  18. Ibrahim, H.; Younès, R.; Ilinca, A.; Dimitrova, M.; Perron, J. Study and design of a hybrid wind–diesel-compressed air energy storage system for remote areas. Appl. Energy 2010, 87, 1749–1762. [Google Scholar] [CrossRef]
  19. Nielsen, R.F.; Haglind, F.; Larsen, U. Design and modeling of an advanced marine machinery system including waste heat recovery and removal of sulphur oxides. Energy Convers. Manag. 2014, 85, 687–693. [Google Scholar] [CrossRef]
  20. Basbous, T.; Younes, R.; Ilinca, A.; Perron, J. Optimal management of compressed air energy storage in a hybrid wind-pneumatic-diesel system for remote area’s power generation. Energy 2015, 84, 267–278. [Google Scholar] [CrossRef]
  21. Bombarda, P.; Invernizzi, C.M.; Pietra, C. Heat recovery from Diesel engines: A thermodynamic comparison between Kalina and ORC cycles. Appl. Therm. Eng. 2010, 30, 212–219. [Google Scholar] [CrossRef]
  22. Lecompte, S.; Huisseune, H.; van den Broek, M.; Vanslambrouck, B.; De Paepe, M. Review of organic Rankine cycle (ORC) architectures for waste heat recovery. Renew. Sustain. Energy Rev. 2015, 47, 448–461. [Google Scholar] [CrossRef]
  23. Dai, Y.; Wang, J.; Gao, L. Parametric optimization and comparative study of Organic Rankine Cycle (ORC) for low grade waste heat recovery. Energy Convers. Manag. 2008, 50, 576–582. [Google Scholar] [CrossRef]
  24. Yang, K.; Zhang, H.; Wang, Z.; Zhang, J.; Yang, F.; Wang, E.; Yao, B. Study of zeotropic mixtures of ORC (organic Rankine cycle) under engine various operating conditions. Energy 2013, 58, 494–510. [Google Scholar] [CrossRef]
  25. Yari, M.; Mehr, A.S.; Zare, V.; Mahmoudi, S.M.S.; Rosen, M.A. Exergoeconomic comparison of TLC (trilateral Rankine cycle), ORC (organic Rankine cycle) and Kalina cycle using a low grade heat source. Energy 2015, 83, 712–722. [Google Scholar] [CrossRef]
  26. Kim, Y.M.; Shin, D.G.; Favrat, D. Operating characteristics of constant-pressure compressed air energy storage (CAES) system combined with pumped hydro storage based on energy and exergy analysis. Energy 2011, 36, 6220–6233. [Google Scholar] [CrossRef]
  27. Wang, M.; Wang, J.; Zhao, P.; Dai, Y. Multi-objective optimization of a combined cooling, heating and power system driven by solar energy. Energy Convers. Manag. 2015, 89, 289–297. [Google Scholar] [CrossRef]
  28. Wang, J.; Yan, Z.; Wang, M.; Ma, S.; Dai, Y. Thermodynamic analysis and optimization of an (organic Rankine cycle) ORC using low grade heat source. Energy 2013, 49, 356–365. [Google Scholar] [CrossRef]
  29. Wang, J.; Yan, Z.; Wang, M.; Li, M.; Dai, Y. Multi-objective optimization of an organic Rankine cycle (ORC) for low grade waste heat recovery using evolutionary algorithm. Energy Convers. Manag. 2013, 71, 146–158. [Google Scholar] [CrossRef]
  30. Guo, Z.Y.; Liu, X.B.; Tao, W.Q.; Shah, R.K. Effectiveness–thermal resistance method for heat exchanger design and analysis. Int. J. Heat Mass Transf. 2010, 53, 2877–2884. [Google Scholar] [CrossRef]
  31. Guo, J.; Xu, M.; Cheng, L. The application of field synergy number in shell-and-tube heat exchanger optimization design. Appl. Energy 2009, 86, 2079–2087. [Google Scholar] [CrossRef]
  32. García-Cascales, J.R.; Vera-García, F.; Corberán-Salvador, J.M.; Gonzálvez-Maciá, J. Assessment of boiling and condensation heat transfer correlations in the modelling of plate heat exchangers. Int. J. Refrig. 2007, 30, 1029–1041. [Google Scholar] [CrossRef]
  33. Coletti, F. Heat Exchanger Design Handbook; Begell House: Danbury, CT, USA, 2016. [Google Scholar]
  34. Biematht, R.W.; Soane, D.S. Department of Chemical Engineering. Am. Chem. Soc. 2011, 115, 1394–1402. [Google Scholar]
  35. Zhang, X.; He, M.; Zhang, Y. A review of research on the Kalina cycle. Renew. Sustain. Energy Rev. 2012, 16, 5309–5318. [Google Scholar] [CrossRef]
  36. Yin, J.L.; Wang, D.Z.; Kim, Y.; Lee, Y. A hybrid energy storage system using pump compressed air and micro-hydro turbine. Renew. Energy 2014, 65, 117–122. [Google Scholar] [CrossRef]
  37. Oldenburg, C.M.; Pan, L. Porous Media Compressed-Air Energy Storage (PM-CAES): Theory and Simulation of the Coupled Wellbore–Reservoir System. Transp. Porous Med. 2013, 97, 201–221. [Google Scholar] [CrossRef]
  38. Pei, P.; Korom, S.F.; Ling, K.; He, J.; Gil, A. Thermodynamic impact of aquifer permeability on the performance of a compressed air energy storage plant. Energy Convers. Manag. 2015, 97, 340–350. [Google Scholar] [CrossRef]
  39. Vongmanee, V. The renewable energy applications for uninterruptible power supply based on compressed air energy storage system. In Proceedings of the IEEE Symposium on Industrial Electronics and Applications, Kuala Lumpur, Malaysia, 4–6 October 2009; pp. 827–830.
  40. Kemble, S.; Manfrida, G.; Milazzo, A.; Buffa, F.; Kemble, S.; Buffa, F. Thermoeconomics of a ground-based CAES plant for peak-load energy production system. J. Nanosci. Nanotechnol. 2016, 32, 1–16. [Google Scholar]
  41. Zavattoni, S.A.; Barbato, M.C.; Pedretti, A.; Zanganeh, G.; Steinfeld, A. High Temperature Rock-bed TES System Suitable for Industrial-scale CSP Plant—CFD Analysis Under Charge/Discharge Cyclic Conditions. Energy Proced. 2014, 46, 124–133. [Google Scholar] [CrossRef]
  42. Kirn, Y.M.; Favrat, D. Energy and exergy analysis of a micro-compressed air energy storage and air cycle heating and cooling system. Energy 2010, 35, 213–220. [Google Scholar]
  43. Singh, O.K.; Kaushik, S.C. Energy and exergy analysis and optimization of Kalina cycle coupled with a coal fired steam power plant. Appl. Therm. Eng. 2013, 51, 787–800. [Google Scholar] [CrossRef]
  44. Fu, W.; Zhu, J.; Zhang, W.; Lu, Z. Performance evaluation of Kalina cycle subsystem on geothermal power generation in the oilfield. Appl. Therm. Eng. 2013, 54, 497–506. [Google Scholar] [CrossRef]
  45. Fwa, T.F.; Chan, W.T.; Tan, C.Y. Genetic-Algorithm Programming of Road Maintenance and Rehabilitation. J. Transp. Eng. 1996, 122, 246–253. [Google Scholar] [CrossRef]
  46. Yang, M.D.; Chen, Y.P.; Lin, Y.H.; Ho, Y.F.; Lin, J.Y. Multiobjective optimization using nondominated sorting genetic algorithm-II for allocation of energy conservation and renewable energy facilities in a campus. Energy Build. 2016, 122, 120–130. [Google Scholar] [CrossRef]
  47. Atrens, A.D.; Gurgenci, H.; Rudolph, V. Economic Optimization of a CO2—Based EGS Power Plant. Energy Fuel 2011, 25, 3765–3775. [Google Scholar] [CrossRef]
  48. Li, H. Environomic Modeling and Multi-Objective Optimisation of Integrated Energy Systems for Power and Cogeneration. Ph.D Thesis, École Polytechnique Fédérale de Lausanne, Zurich, Switzerland, 2006. [Google Scholar]
  49. Couper, J.R.; Penney, W.R.; Fair, J.R.; Walas, S.M. Chemical Process Equipment, 2nd ed.; Gulf Professional Publishing: Houston, TX, USA, 2009. [Google Scholar]
  50. Ulrich, G.D. A Guide to Chemical Engineering Process Design and Economics; Wiley: New York, NY, USA, 1984. [Google Scholar]
Figure 1. Schematic diagram of the CAES system.
Energies 10 00015 g001
Figure 2. Schematic diagram of the ORC-CAES system.
Energies 10 00015 g002
Figure 3. Schematic diagram of the Kalina cycle (KC)-CAES system.
Energies 10 00015 g003
Figure 4. Effect of π Comp on the performance parameters of ORC-CAES.
Energies 10 00015 g004
Figure 5. Effect of π Comp on performance parameters of KC-CAES.
Energies 10 00015 g005
Figure 6. Effect of the outlet temperature of the exhaust gas on the performance parameters of the ORC-CAES.
Energies 10 00015 g006
Figure 7. Effect of the outlet temperature of the exhaust gas on the enthalpy and entropy.
Energies 10 00015 g007
Figure 8. Effect of the outlet temperature of the exhaust gas on the performance parameters of the KC-CAES.
Energies 10 00015 g008
Figure 9. Pareto frontier of the ORC-CAES system for ICPP versus ε using multi-objective GA.
Energies 10 00015 g009
Figure 10. Pareto frontier of KC-CAES for ICPP versus ε using multi-objective GA.
Energies 10 00015 g010
Table 1. The simulation condition of the proposed CAES system.
TermUnitValue
Ambient temperatureK298.15
Ambient pressureMPa0.10
Pinch temperature differenceK8
Turbine isentropic efficiency-0.9
Compressor isentropic efficiency-0.9
Pump isentropic efficiency-0.7
Work solution concentration-0.55
Rich solution concentration-0.80
Basic solution concentration-0.25
Gas engine power efficiency-0.42
Rated air flow rate of compressionkg/s98.80
Volume of air storage vesselm330,000.00
Table 2. Optimal parameters of the two systems.
SystemπCompTeg (K)Exergy Efficiency (%)ICPP (k$/kW)
KC-CAES7.3332359.740.61
ORC-CAES6.4234453.560.67
Table 3. Comparison of the efficiency between KC-CAES and ORC-CAES at the optimal point (based on the single CAES).
SystemRelative Exergy Efficiency (%)Relative Round-Trip Efficiency (%)Heat Recovery Cycle Efficiency (%)
KC-CAES27.3227.3520.5
ORC-CAES16.8316.8911.7

