Article

A Novel Voltage Control Scheme for Low-Voltage DC Distribution Systems Using Multi-Agent Systems

1
School of Electrical Engineering, Kookmin University, 861-1, Jeongneung-dong, Seongbuk-gu, Seoul 02707, Korea
2
Korea Electric Power Research Institute (KEPRI), 105 Munji-ro, Yuseong-gu, Daejeon 34056, Korea
*
Author to whom correspondence should be addressed.
Energies 2017, 10(1), 41; https://doi.org/10.3390/en10010041
Submission received: 10 August 2016 / Revised: 7 December 2016 / Accepted: 21 December 2016 / Published: 1 January 2017

Abstract

:
Low-voltage direct current (LVDC) distribution systems have been evolving into interesting ways of integrating distributed energy resources (DERs) and power electronics loads to local distribution networks. In LVDC distribution systems, voltage regulation is one of the most important issues, whereas AC systems have concerns such as frequency, power factor, reactive power, harmonic distortion and so on. This paper focuses on a voltage control method for a LVDC distribution system based on the concept of multi-agent system (MAS), which can deploy intelligence and decision-making abilities to local areas. This paper proposes a distributed power flow analysis method using local information refined by local agents and communication between agents based on MAS. This paper also proposes a voltage control method by coordinating the main AC/DC converter and multiple DERs. By using the proposed method, we can effectively maintain the line voltages in a pre-defined normal range. The performance of the proposed voltage control method is evaluated by case studies and compared to conventional methods.

1. Introduction

Recently, there have been studies into DC distribution systems that can bring advantages over conventional AC distribution systems in terms of energy efficiency, power quality and so on [1]. Among various applications of DC distribution systems, low-voltage DC (LVDC) distribution systems, whose rated voltage is less than 1500 V, have unique strengths for distribution network operators (DNOs) in that they can supply diverse energy management services by integrating distributed generation or storage units into local distribution networks [2,3]. The first commercial application of a LVDC distribution system was built in Finland in 2012, and has been successfully tested for more than 3500 h, as explained in [2].
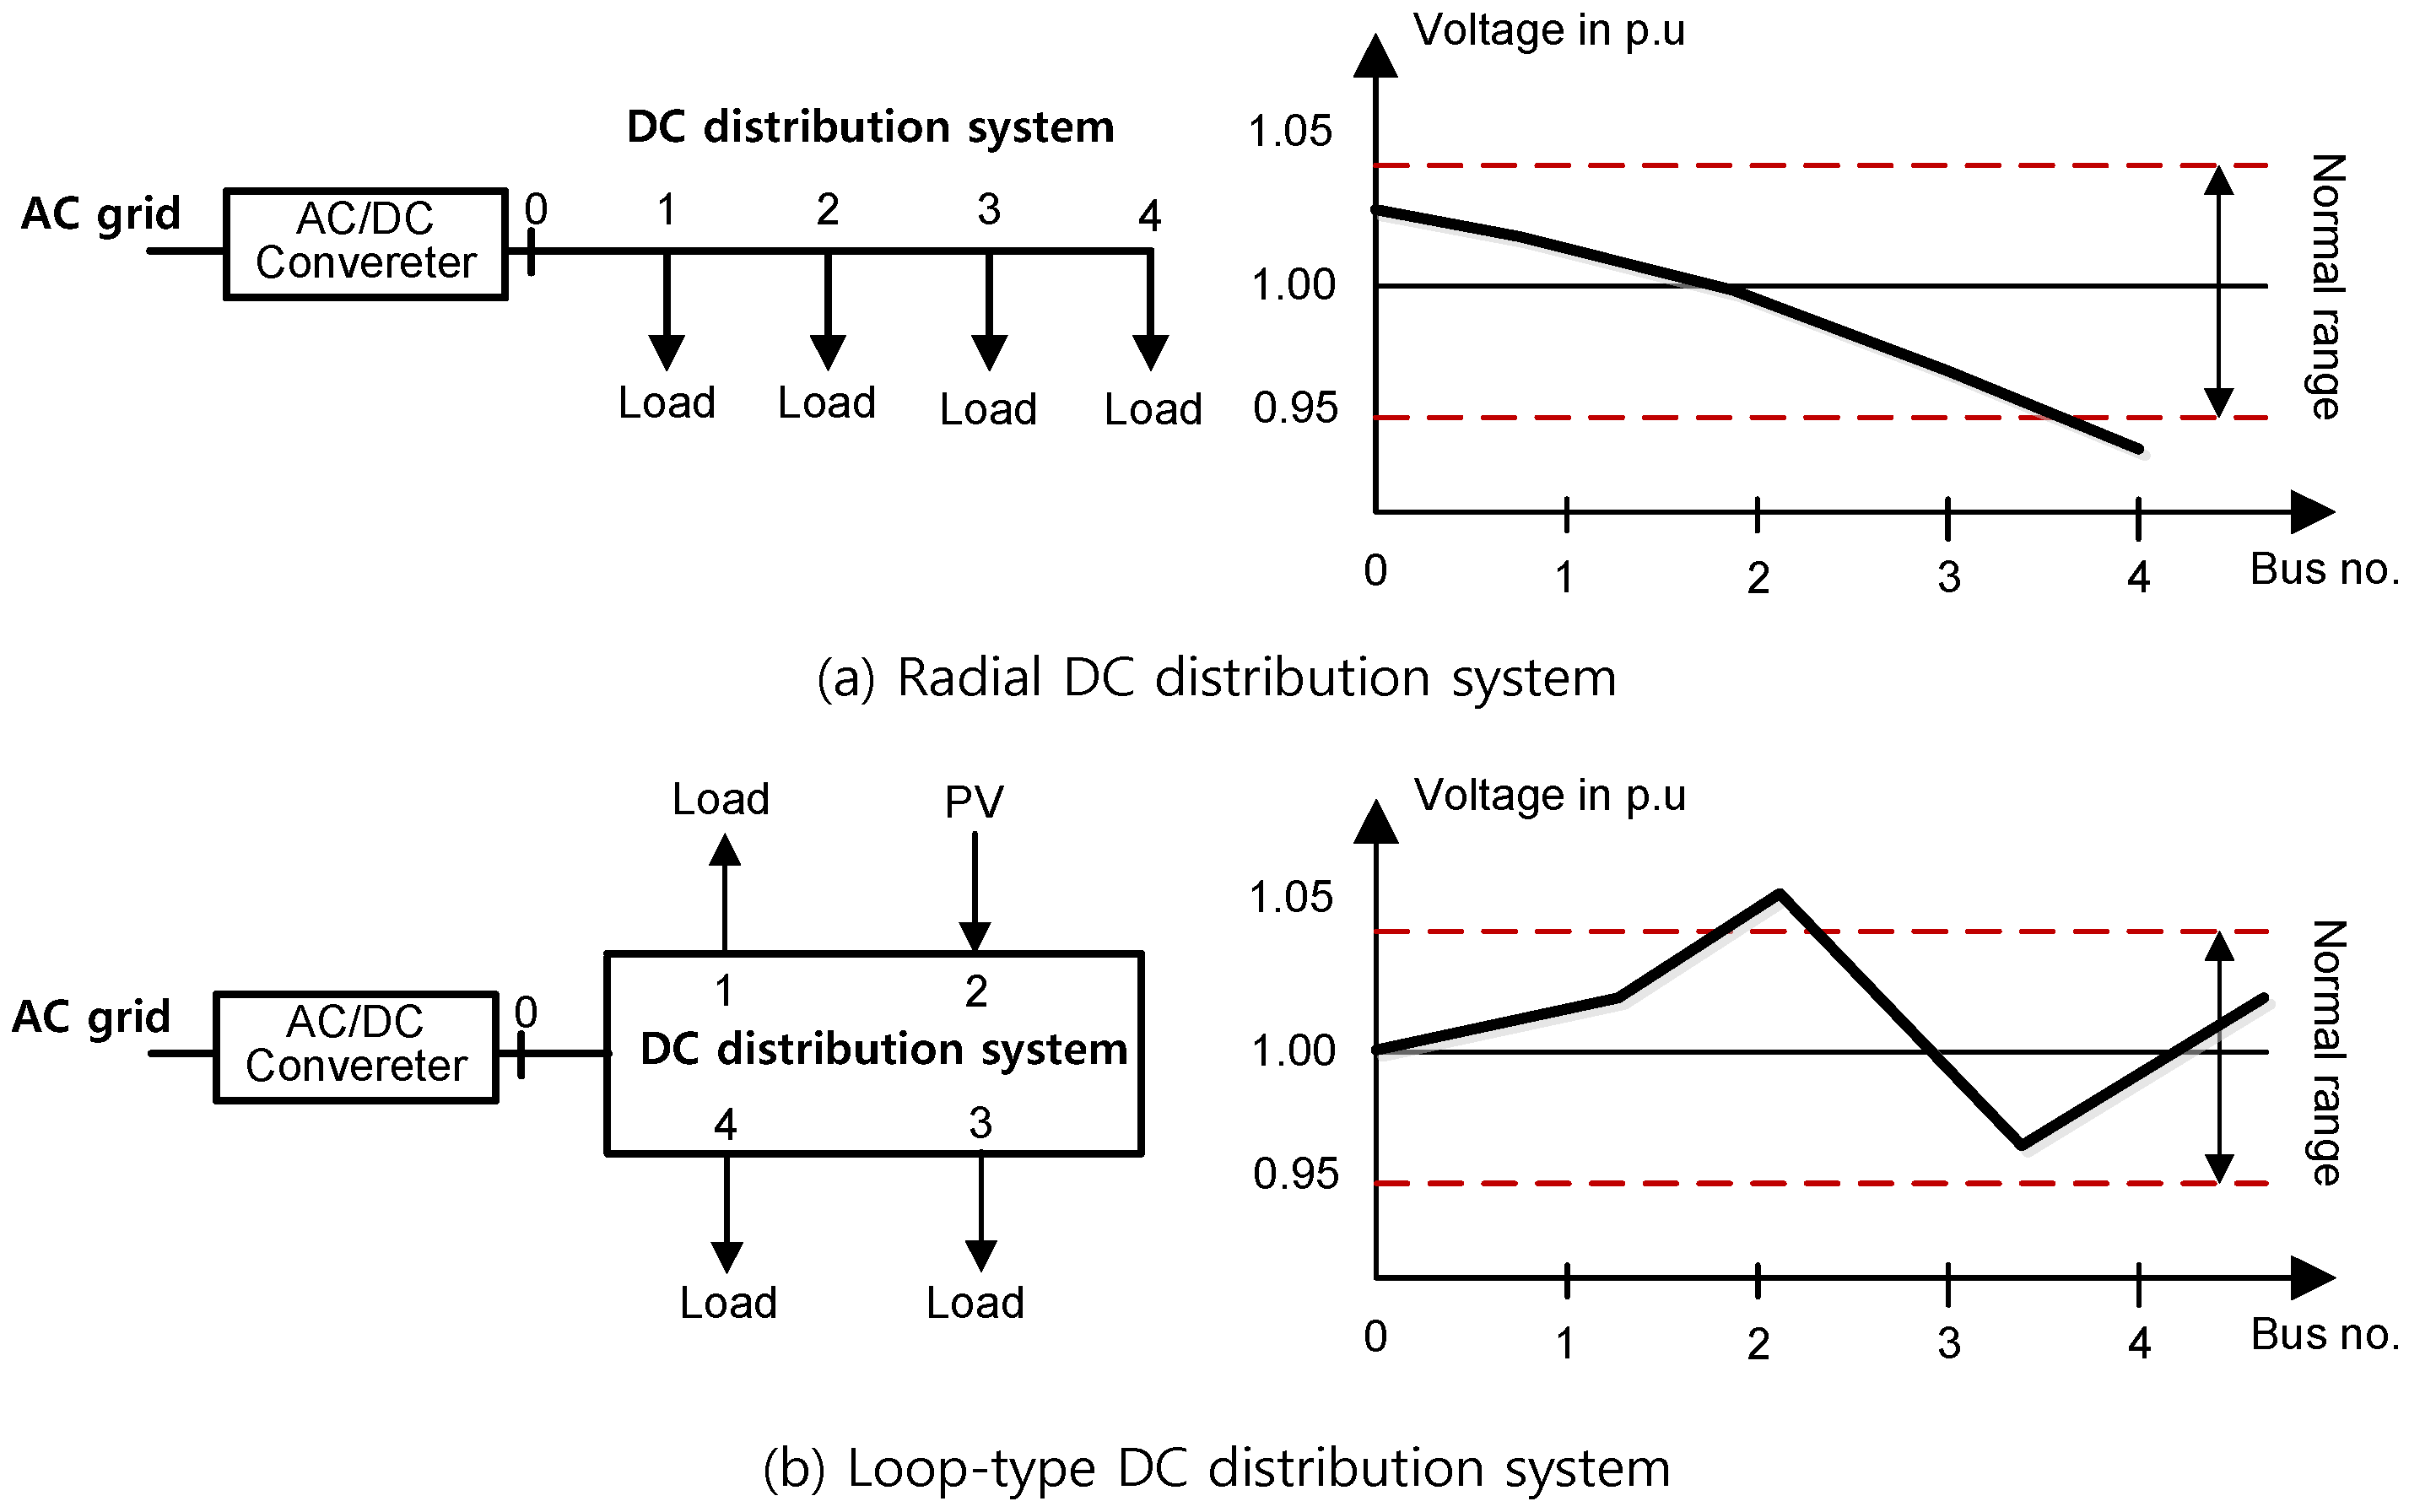
In LVDC distribution systems, voltage regulation is one of the most significant issues for their planning and operation because it mainly defines the quality of the distributed electricity. The main objective of voltage regulation is to maintain the voltage within certain ranges that can guarantee voltage stability and service quality of the distribution system. There are some on-going discussions about the acceptable voltage range for LVDC distribution systems. In this paper, the normal voltage range is defined as ±5% of the rated voltage under the assumption that we need to supply the same voltage quality to the customers as AC distribution systems. According to the American National Standard (ANSI) for distribution systems [4].
There have been many studies into voltage control methods in AC distribution systems. Their basic approach is to manipulate the tap position of the distribution transformers. On top of the basic solution, some researchers have considered voltage regulators such as static VAR compensators (SVCs) as local voltage compensators. References [5,6,7] proposed to how to coordinate a voltage regulator and an on-load tap changer (OLTC). The authors in [8] proposed a local coordination scheme between an OLTC and shunt capacitors in the presence of synchronous generating units with coordinating actions with time delay.
To coordinate multiple control units, some researchers have proposed the application of a multi-agent system (MAS) to system-wide voltage control. A MAS can be defined as a system comprising multiple intelligent agents that have the abilities of autonomous decision-making and communication with other agents [9,10]. In [11,12], the authors suggested an agent-based algorithm to control the reactive power output of distributed energy resources (DERs) for proper voltage regulation with a few communication requirements. However, they did not consider the coordination between OLTC and DERs.
There have been studies about voltage control issues for DC distribution systems. However, many of them are focused on small-scale DC systems with limited service areas. If the distribution line is short, the line voltage can be considered as the common parameter over the system such as the frequency in AC distribution system. In [13,14], the authors have supposed a local voltage control method by using DERs with droop control concepts to control the common bus voltage on DC distribution system.
However, their approaches are difficult to apply to a long-distance LVDC distribution systems because the DERs are connected to different buses with different voltages. To solve this problem, the authors in [15] suggested a multi-agent control scheme for voltage regulation in DC distribution systems. In [15], two sequential stages were proposed: one for the AC/DC converter operation and the other for DER control strategies. However, the authors neglected loss and voltage drop in the lines to simplify the computation process so that their method can be prone to computation error if the line lengths are extended. The authors in [16] derived simplified equations describing voltage sensitivity factors (VSFs) for voltage control. However, because they assumed radial networks, it is difficult to apply the equations to more complicated configurations such as loop or meshed networks.
This paper proposes a new voltage control method by coordinating the main AC/DC converter and DERs scattered in LVDC distribution systems. The main advantages of the proposed control scheme are as follows: first, we calculated the VSFs based on the Jacobian matrix of the system and load flow analysis. This allows us to consider line losses and voltage drops in the distribution lines. In addition, our method can be applied to not only for radial systems, but also ring-type or meshed networks. Second, to reduce the computational burden of the main central controller, we applied MAS to distribute computation process to multiple local agents. Each local agent generates system information to construct the Jacobian matrix of the system using locally measured raw information. In addition, we define “virtual buses” so that local agents can also estimate the voltages in the neighboring buses with precise calculation results. With this concept, we can reduce the number of measurement points to calculate the Jacobian matrix of the system without losing accuracy. This means that the overall system can be economic. The overall decision making procedure is based on contract net protocol (CNP), which can reduce the size of communication data and increase the flexibility of decision making procedure in local agents.
This paper is organized as follows: Section 2 introduces the important issues of voltage control in LVDC distribution systems. In Section 3, we propose a new voltage control scheme in LVDC distribution system using a MAS. Lastly, in Section 4, we verify the effectiveness of the proposed voltage control method in comparison to the conventional methods with various simulation studies.

2. Voltage Control in DC Distribution System

2.1. Important Issues in Voltage Control

Voltage magnitude is one of the most important parameters for low-voltage distribution systems. Usually, DNOs have a strict responsibility to regulate the magnitude of the voltages of their distribution system within statutory limits. Because the voltage magnitudes are directly affected by the line currents, management of power consumption or generation in the distribution system is essential for voltage control [17].
There are two kinds of approaches related to DER integration to the distribution system. The first approach depends highly on local control with power-electronics technology while the other considers system-wise energy management technology. In the first approach, each DER locally controls the voltage at its point-of-common-coupling (PCC). If there are multiple DERs in the distribution system, droop control can be used to prevent unwanted hunting reaction between DERs [18,19]. The main drawback of this method is that it is difficult to consider system-wide voltage profiles if the line losses are significantly large.
In order to control the voltages system-wisely, we need to use power flow analysis that can calculate bus voltages, line currents, power flows, line losses and so on. This second approach requires supervised management system with communication and system-wise decision-making process. This paper proposes a MAS-based system-wise voltage control method to accurately and effectively control the voltage profile in the distribution lines.

2.2. Voltage Problem in DC Distribution System

In a typical radial network as shown in Figure 1a, active power flows along with the feeders in one direction from the grid to the end of the feeder. When loads increase significantly, the voltage profile can fall below the normal range. In this case, the minimum voltage occurs at the end of the feeders. Figure 1b illustrates a loop-type DC distribution system, in which all the loads have two paths to receive electric power from the grid. If DERs are integrated to this system, the voltage profile becomes more complicated than the radial system. To accurately analyze the effect of DERs to system voltage, power flow analysis must be executed.
Figure 2 illustrates voltage profiles for two extreme examples of radial distribution networks. Let us assume that Feeder #1 includes only DERs distributed in the line whereas only loads are connected to Feeder #2. As seen with the lines in Figure 2, overvoltage and undervoltage problems can occur at the end of Feeders #1 and #2, respectively. To compensate the undervoltage problem, the AC/DC converter can adjust its output voltage to a higher value up to 1.05 p.u. Then the voltage profile of the distribution line can be changed to the dashed line in Figure 2. However, this causes overvoltage problem at the end of Feeder #1. This simple example shows that the coordinated control between AC/DC converter and the DERs (and loads) are very important for secure voltage control.

3. Proposed Voltage Control Scheme Using Multi-Agent Systems

3.1. Multi-Agent System for Voltage Regulation

Section 2 describes the problem of voltage control without coordination between the AC/DC converter and DERs. This subsection proposes a MAS-based voltage regulation method that can coordinate the main AC/DC converter control and multiple DERs. By using the proposed method, the bus voltages in the LVDC distribution system can effectively be maintained within the normal range.
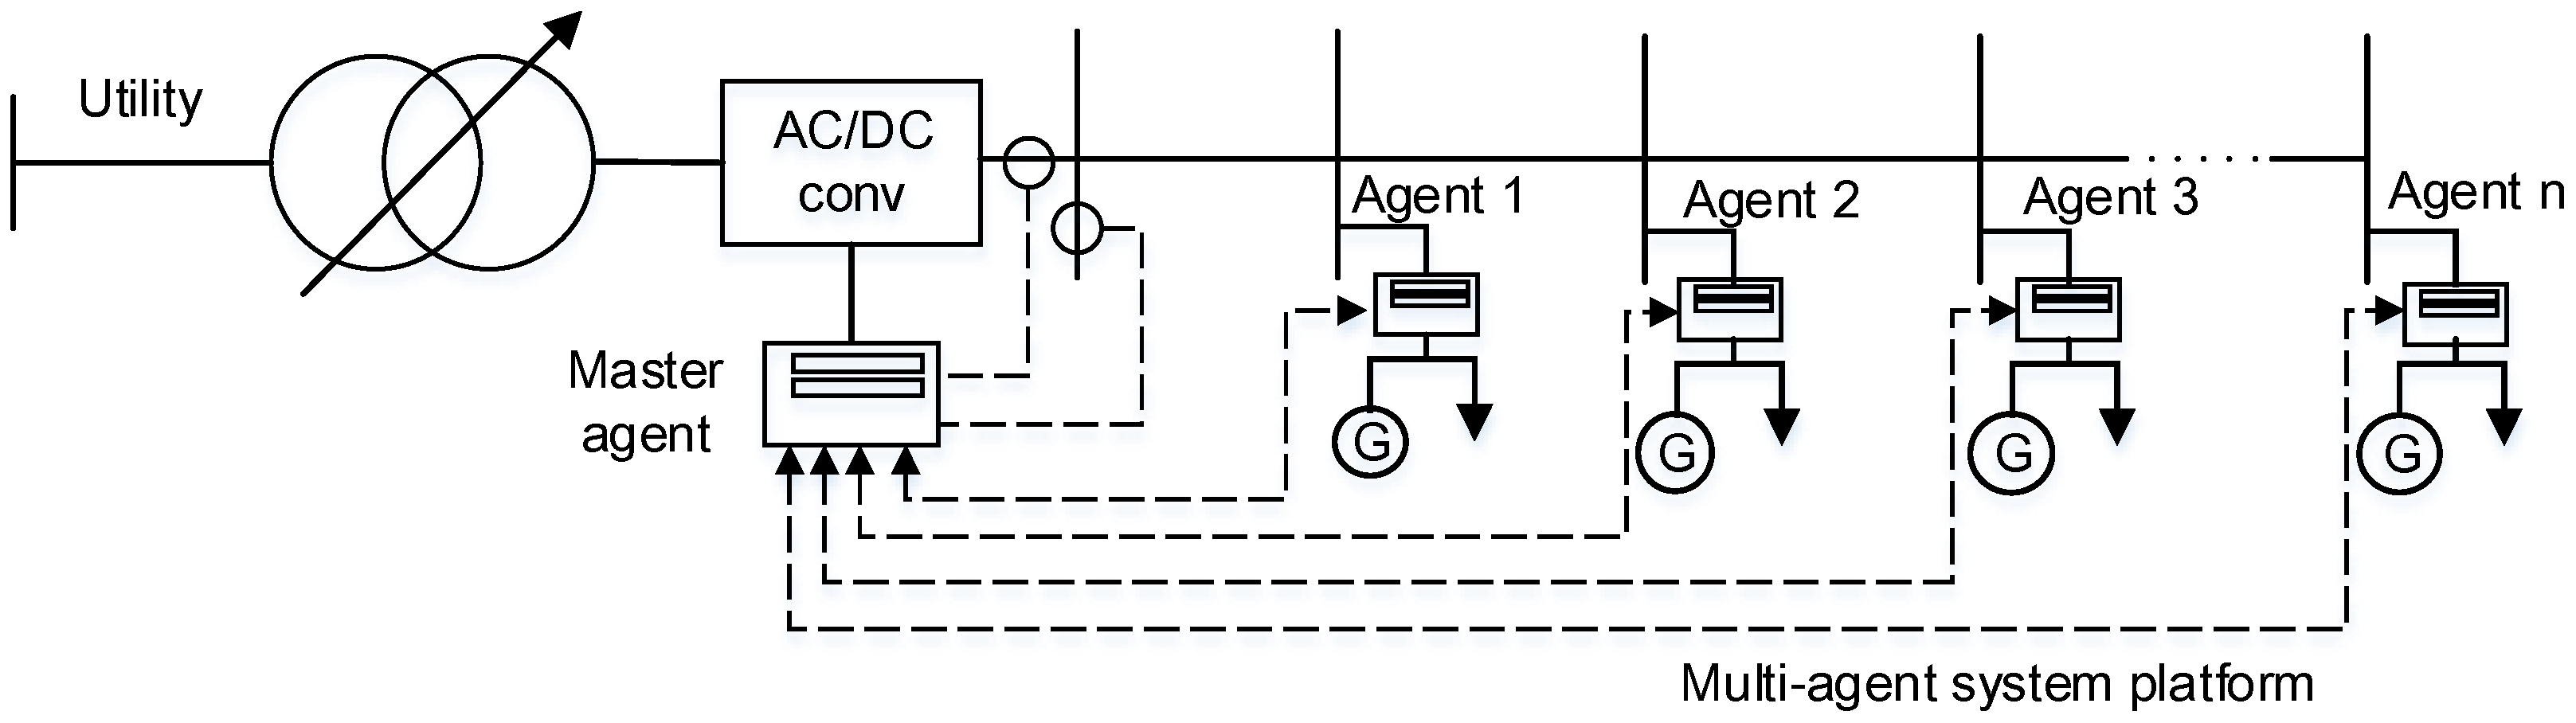
Figure 3 shows the structure of the MAS-based voltage control system. Control agents are classified into two types such as master and local agents. Physically, the master agent links to the controller of the main AC/DC converter and local agents are connected to DER controllers or important monitoring points in the distribution lines. 
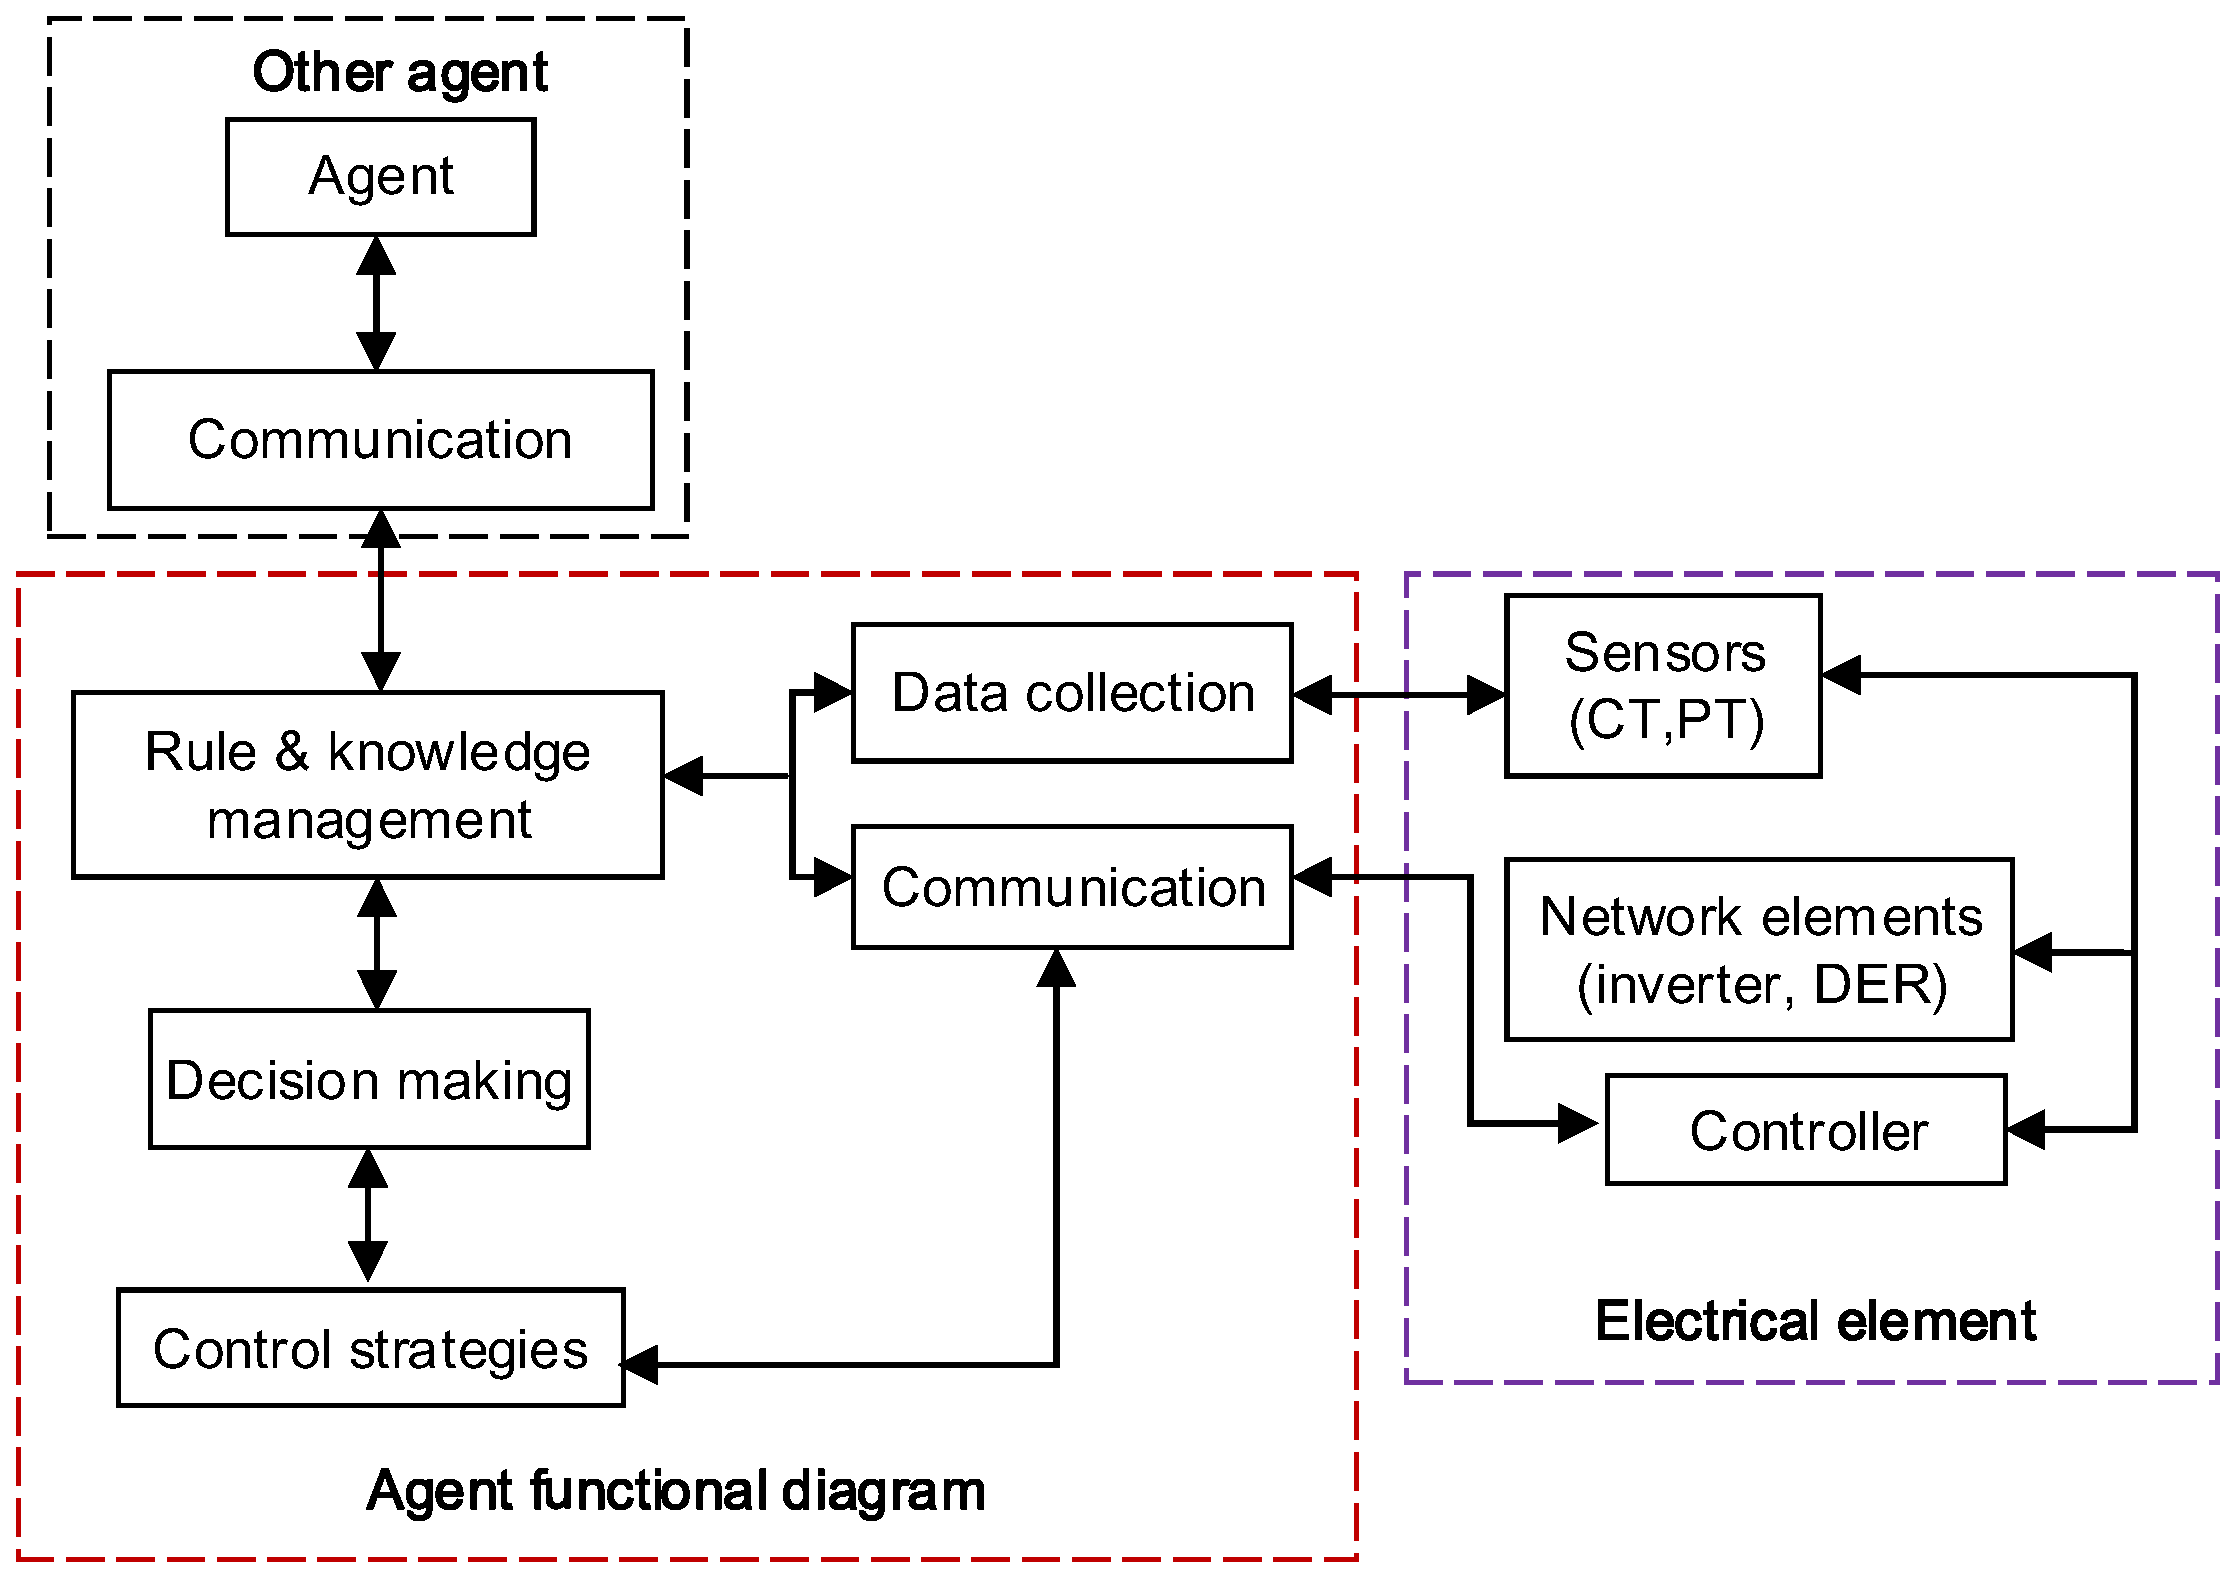
Figure 4 shows an architecture of a control agent for DC distribution network application. The control agents are composed of three main functions: communication, data collection and computation functions. The communication part has two main actions: (1) connection to the other agents to negotiate and exchange data for coordinated tasks and (2) integration with the controller of the AC/DC converter or DER. The data collection function is to measure local data with sensors such as potential transformers (PTs) and current transformers (CTs). The computation function is to monitor voltage events, to calculate power flow analysis, and to make decisions for voltage control actions. Local agents monitor the voltage events and estimate the system parameters to construct the Jacobian matrix. We implemented the decision-making process in the master agent that can assign the dedicated tasks to AC/DC converter and/or DERs to accomplish system wise-voltage control schemes.
We define two types of local agents: DER agent and monitoring agent. Both types of agents share the same hardware and software platform. The major different between DER and monitoring agents is that the monitoring agents do not have DER control functions. DER agents link to DER controllers to manipulate active power output for regulating the bus voltage within the normal ranges. Monitoring agents are installed in important electrical nodes where DER is not integrated. In LVDC radial distribution systems, monitoring agents should be located at the end of the distribution lines because these locations usually have the minimum voltage in the LVDC distribution lines. Without the information of the end of the lines, the accuracy of power flow analysis can be degraded.
The master agent determines the control command for the AC/DC converter controller and has responsibility to coordinate multiple agents to accomplish efficient voltage compensation. The proposed control schemes for the master and local agents are described in detail in the following sub-sections.

3.2. Ovaerall Voltage Control Process Based on Multi-Agent System

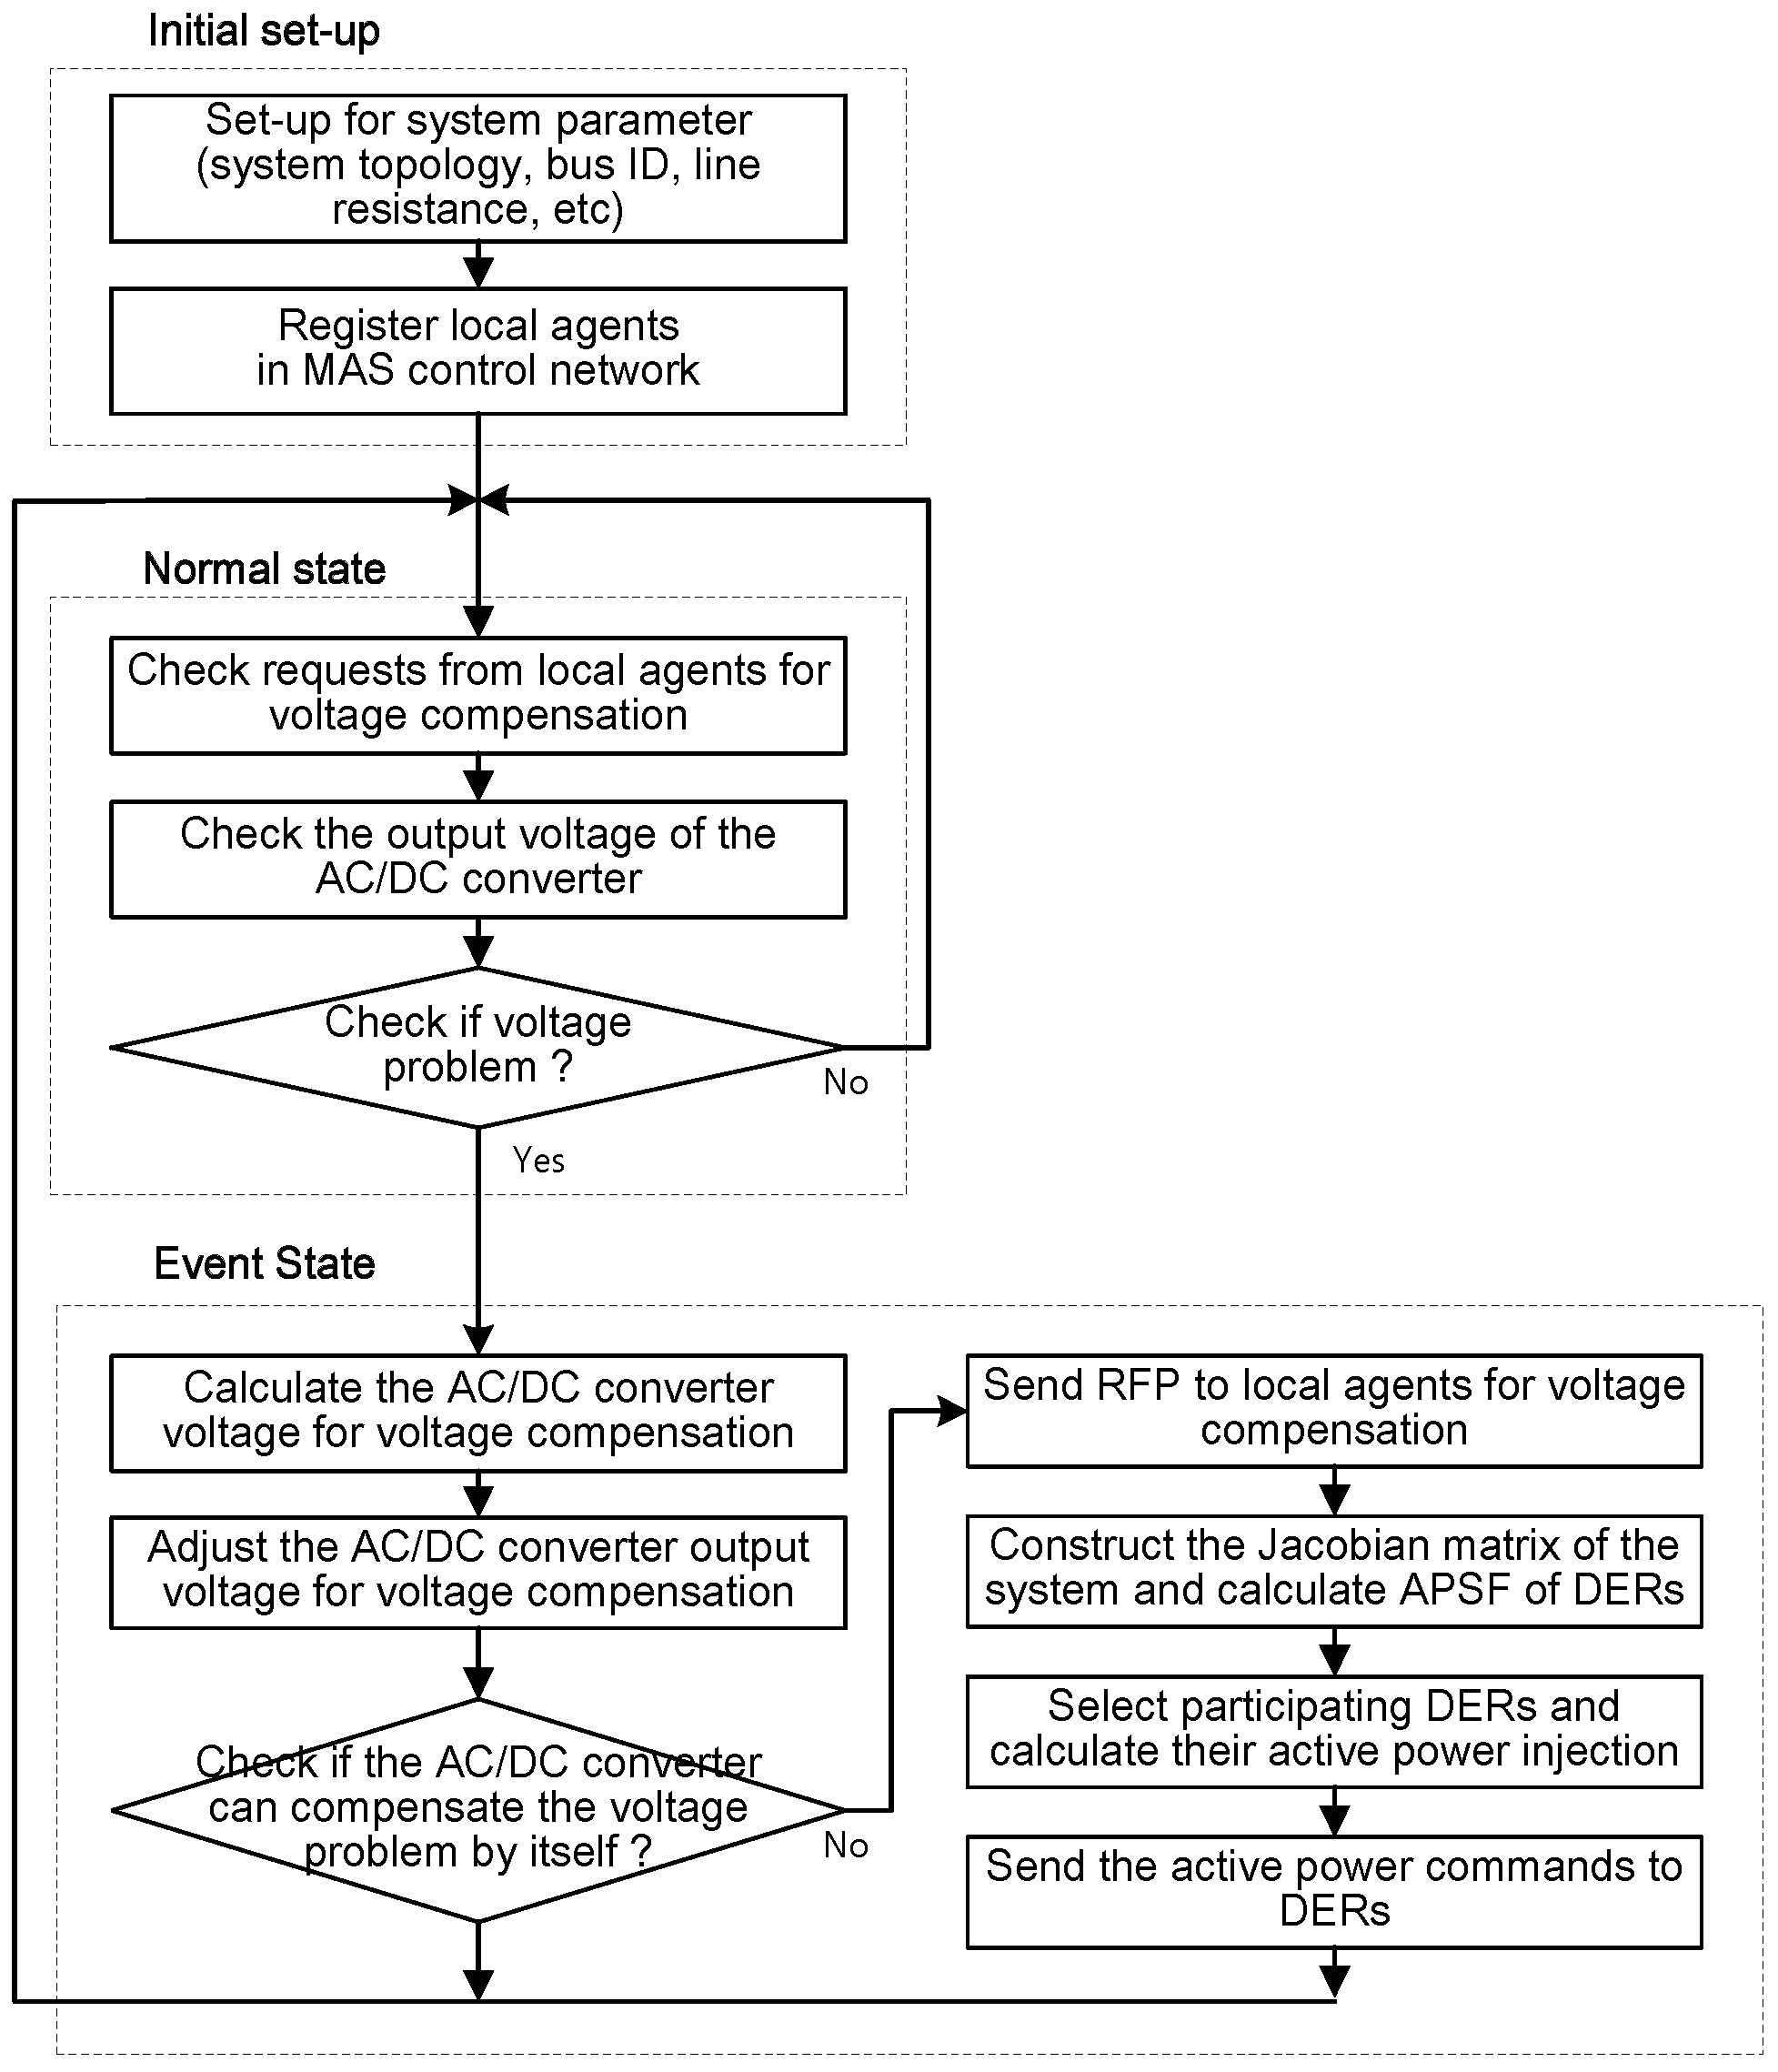
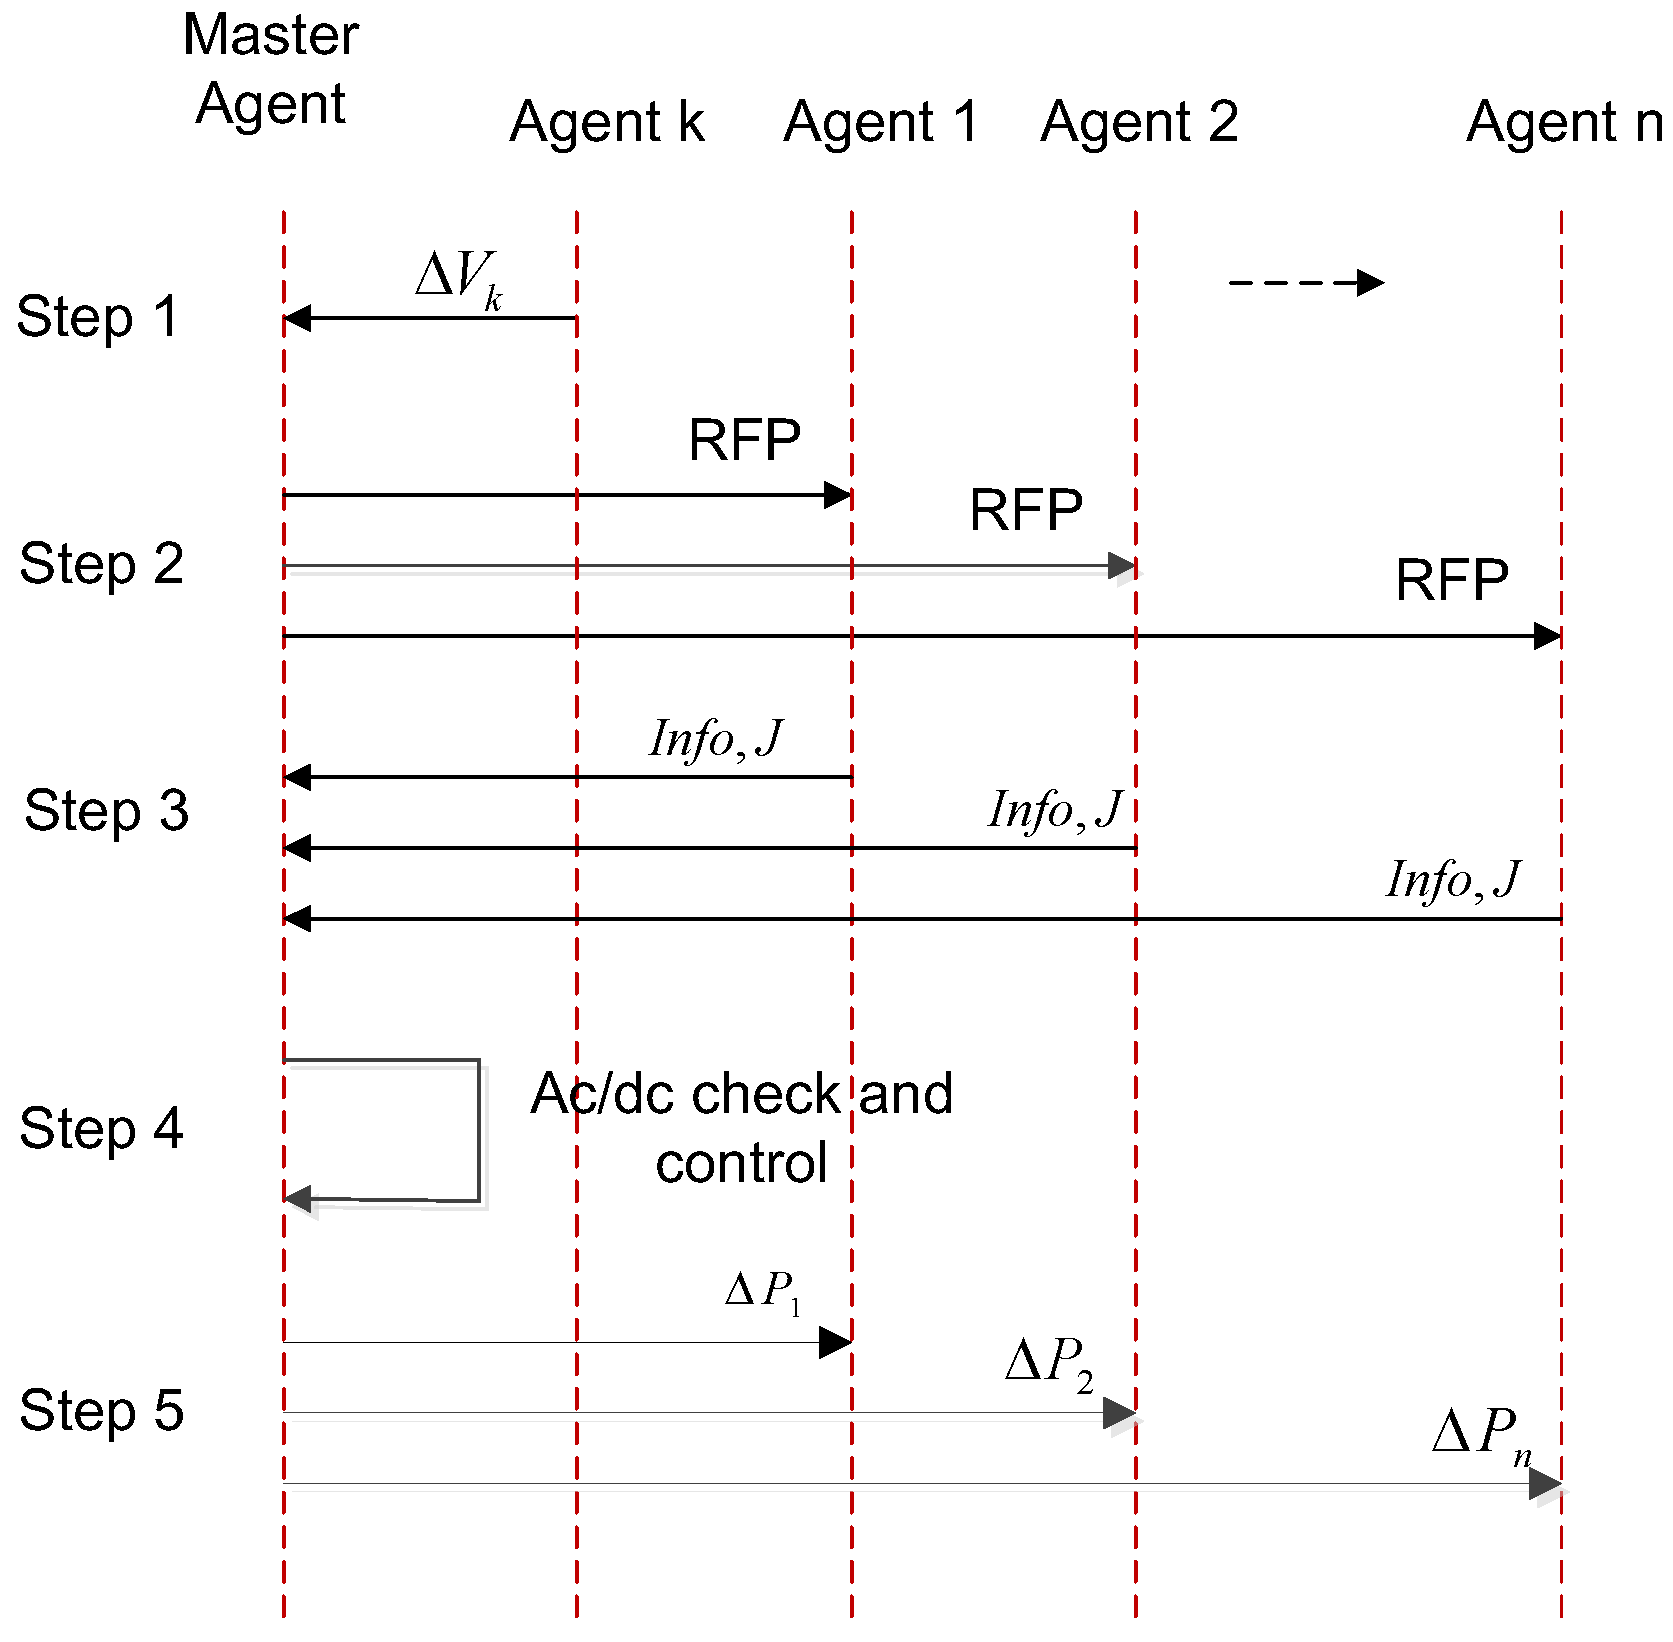
In this sub-section, we explain the control hierarchy of the proposed system and communication configuration between multiple agents for common tasks. Physically, the MAS-based control network uses the Ethernet protocol so that the system is easily scalable to the size of the system. The decision-making procedure of the overall MAS network is implemented using CNP, which is based on request-for-proposal (RFP) and bidding process [20]. The overall voltage control process is summarized in Figure 5.
  • Step 1: In normal state, all the agents operate in monitoring mode and measures local voltages. If the measured voltages exceed the normal limits, which is normally ±5% of the rated voltage, the local agents inform the master agent of the voltage problem via request messages with the voltage deviation (ΔVk).
  • Step 2: The master agent requests for voltage control proposals to all DER agents. The process begins with issuing a request-for-proposal (RFP).
  • Step 3: Local agents respond to the RFP by sending their bidding information to the master agent. The bidding data include bus voltage, line current, active power margin of the DER, line power flow and a part of the Jacobian matrix of the system. If there is a “virtual bus” defined next to the local agent, the local agent estimates the data of that virtual bus and send them to the master agent. The virtual bus and estimation algorithms will be defined in next section.
  • Step 4: When the bidding data of local agents arrives, the master agent constructs the Jacobian matrix of the system and decides the best solution for voltage control. The master agent computes the reference value of the AC/DC converter and checks whether the AC/DC converter is available for the reference value or not. If not, the control process goes to step 5.
  • Step 5: The master agent decides the participation of DERs according to the results of sensitivity analysis. Then, it assigns the tasks to the selected DER agents. In this step, the task is given as an amount of active power injection of the DERs.
If the voltage compensation is not enough due to any errors, the voltage control process is repeated until the amount of ΔVk becomes less than a certain threshold line 0.001 p.u.

3.3. Computaion of Local Agent

This sub-section explains how the agents compute the data using distributed computation method based on MAS-based control network.

3.3.1. Computation of Jacobian Matrix with Distributed Algorithms

Power flow analysis using Newton-Raphson method needs the Jacobian matrix of the system. The Jacobian matrix in a DC power system represents the first derivative relationship between active power and bus voltages. Therefore, the inverse of the Jacobian matrix means the sensitivity of the bus voltages over the injected active powers to the corresponding buses. Here, we define the elements of the inverse of the Jacobian matrix as VSFs. This value can be derived from small-signal linear model of power flow equations as:
Δ V = J 1 Δ P
[ Δ V 1 Δ V 2 Δ V n ] = [ J 11 J 12 J 1 n J 21 J 22 J 2 n J n 1 J n 2 J n n ] 1 [ Δ P 1 Δ P 2 Δ P n ]
where J is the Jacobian matrix corresponding to derivations of the active power from the bus voltage magnitude. The full equation of Jacobian matrix is obtained as follows:
  • Off-diagonal elements:
    J i j = V i G i j
  • Diagonal elements:
    J i i = 2 V i G i i + j = 1 , j i N V j G i j
    where N is the number of buses, V i and V j are the bus voltages at the i-th and j-th nodes, respectively. The bus conductance matrix G is defined as:
    G = [ G 11 G 12 G 1 n G 21 G 22 G 2 n G n 1 G n 2 G n n ]
    G i i = j = 1 n g i j and G i j | i j = g i j
    where g i j is the conductance of the line between i-th and j-th buses. The conductance matrix is similar to the bus admittance matrix for an AC distribution system and the only difference is absence of reactance components.
Then, we can obtain VSF that define the voltage sensitivity against power injection. Equation (7) defines the VSF between the voltage at the i-th bus and the power injection at the j-th bus as:
[ V S F ] i j = Δ V i Δ P j = [ J ] i j 1
where [ J ] i j 1 is the element of i-th row and j-th column of the inverse of the Jacobian matrix.
Equation (4) shows that to obtain the diagonal elements of the Jacobian matrix, we must gather two types of information, namely the bus voltages and line resistances of all the buses and the lines at the same time. Generally, energy management systems (EMSs) suffer a significant communication burden to collect those data in the central controller. In addition, EMSs also need to screen bad data due to sensing errors or communication failure using state estimation algorithms.
In this paper, we propose a new algorithm to calculate the Jacobian matrix with distributed computation manners using multiple agents. The voltages of the other nodes in (4) can be replaced by the line currents that can be locally measured by the local agent as:
J i i = P i V i = V i ( 2 G i i + k = 1 k i N G i , k ) + k = 1 k i N I i k sign ( I i , k )
where, I i , k is the line current from bus i to the adjacent bus k; sign ( I i , k ) is defined as ‘−1’ for outgoing current, ‘1’ for incoming current. Then, from (3) and (8), the local agent at bus i can calculate the i-th row of the Jacobian matrix only using locally measured data. Therefore, the cooperation of local agents can construct the complete Jacobian matrix.

3.3.2. Data Related to Power Flow and Power Margins of Distributed Energy Resources

The power margin of a DER can be obtained by monitoring its power output of DER as:
P i m a r g i n = P i r a t e d P i o u t p u t
where P i m a r g i n is the power margin of the DER at bus i; P i r a t e d and P i o u t p u t are the rated and output powers of the DER at bus i, respectively.
The line power flow between buses i and j can be obtained as:
P i , j = V i I i , j
where V i and I i , j are the bus voltage at bus i and the bus current between the buses i and j measured by local agent located at bus i, respectively.

3.3.3. Estimation of System Parameters for Virtual Buses

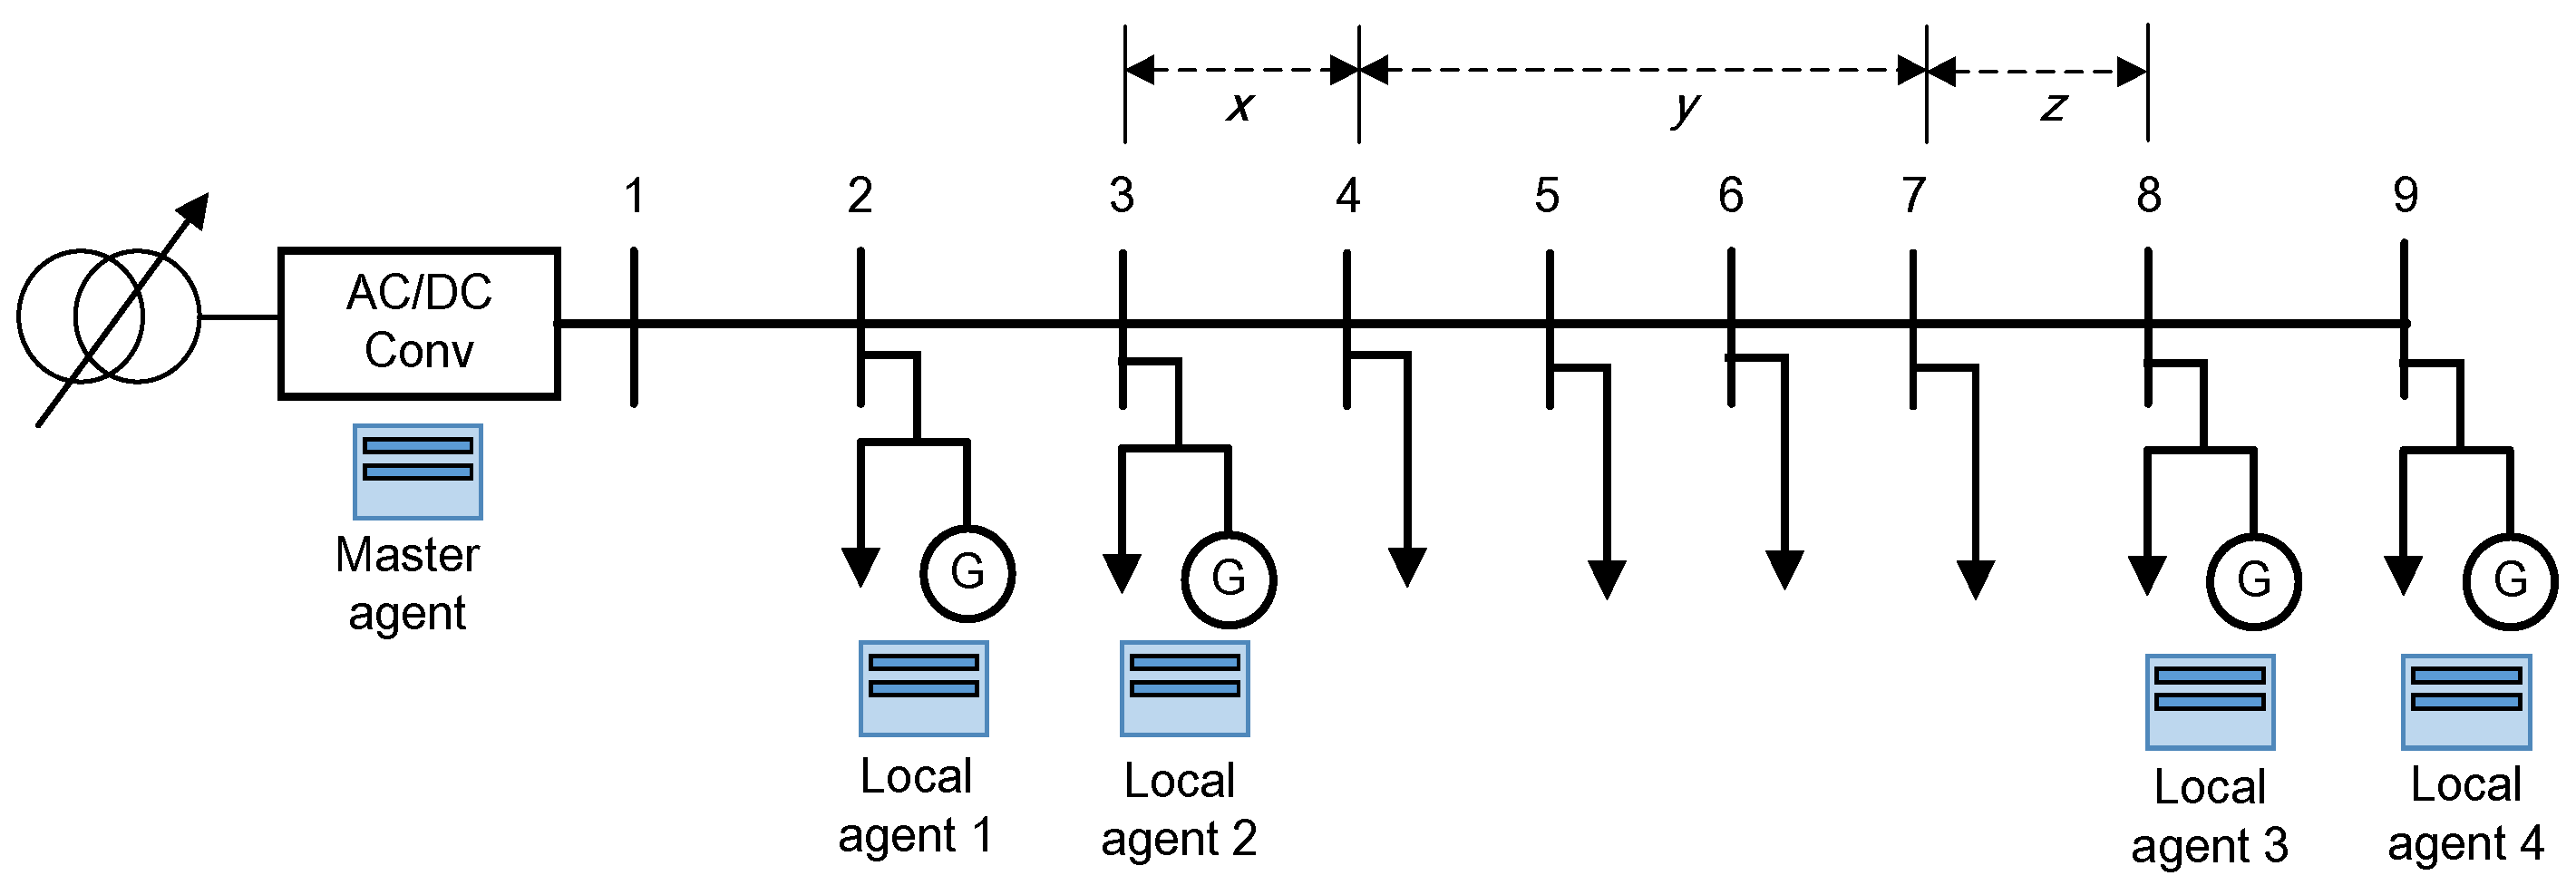
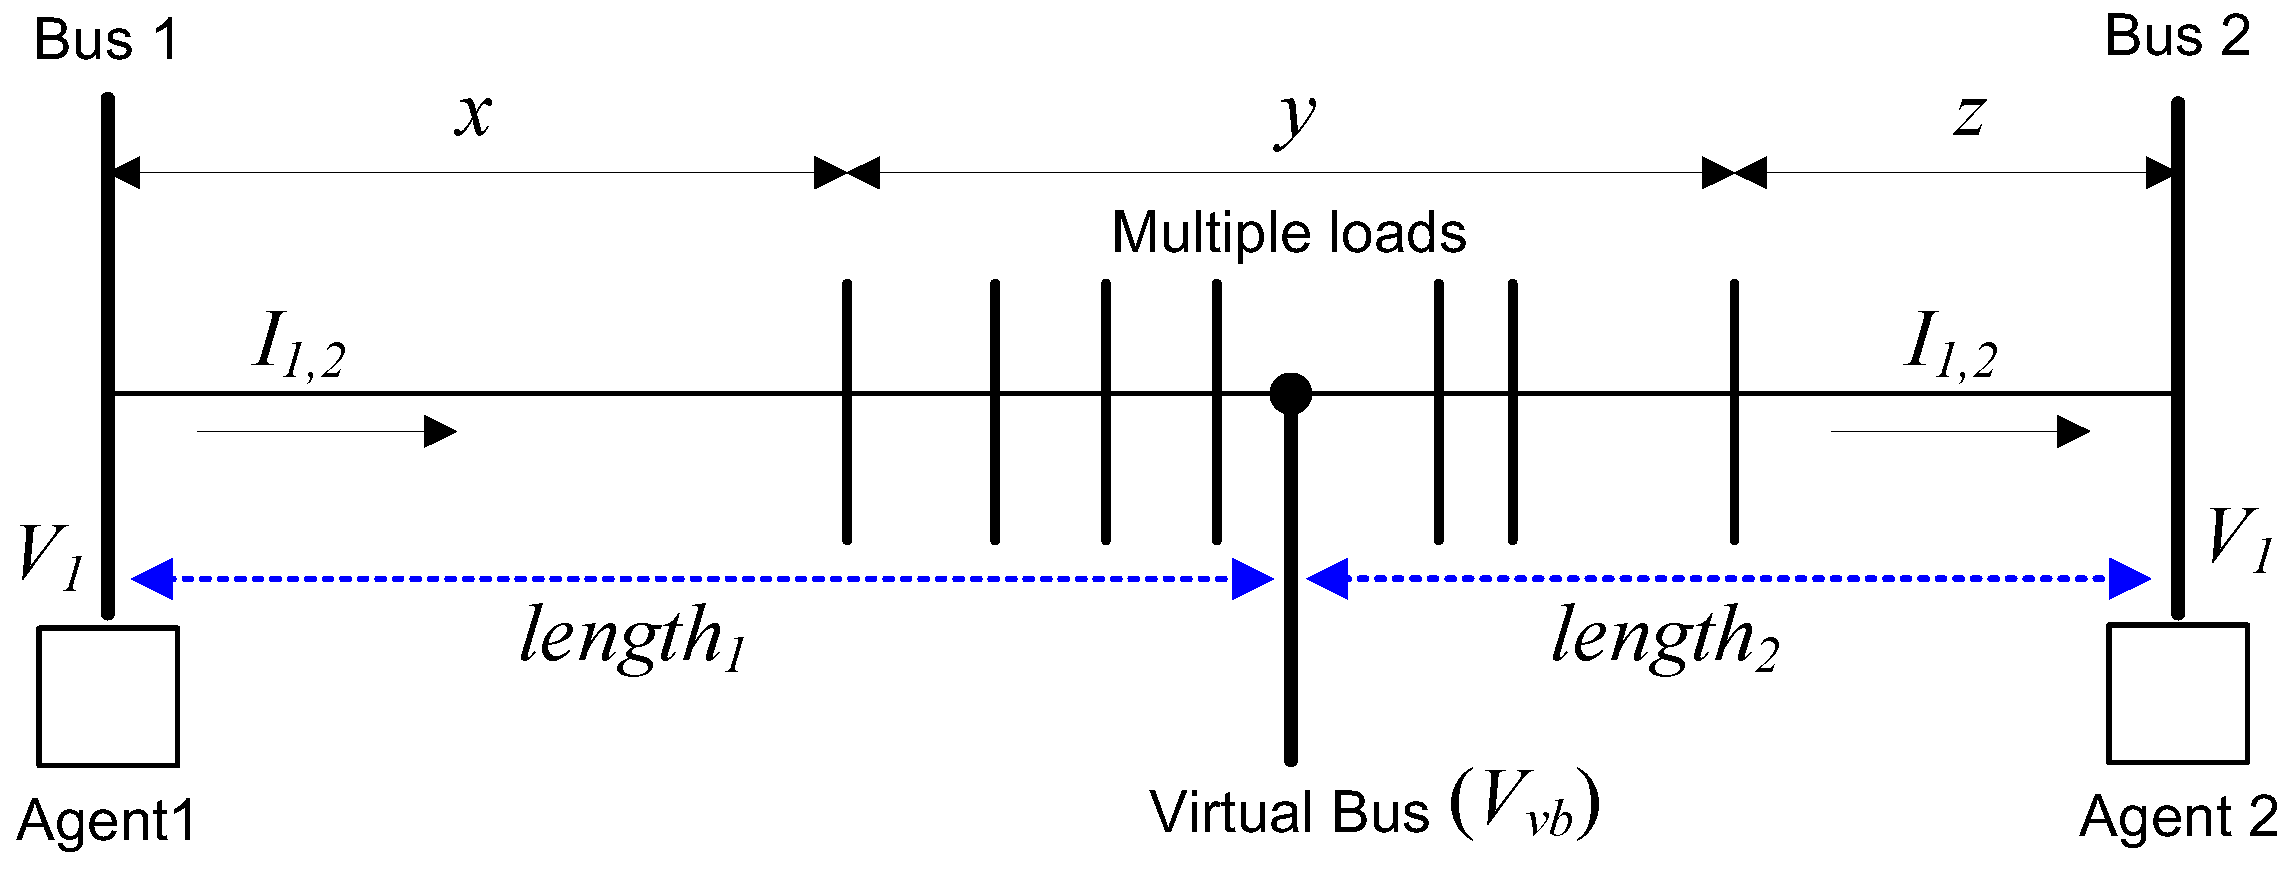
Because of economic issues, we need to select a limited number of locations for local agent installation. The appropriate locations of the local agents are the points of DER connection for DER agents and the ends of the distribution lines for monitoring agents. This means that some buses in the distribution line are not directly monitored by local agents. Because the number of monitoring buses is reduced, the dimension of Jacobian matrix can be reduced and the computation burden is also relieved. However, this may cause inaccuracy to power flow and voltage sensitivity analysis. To solve this problem, we propose the concept of “virtual bus” that is assumed to be located between two local agents in distribution line as illustrated in Figure 6. The estimation process can be done by the agents at both sides. Here, we propose how to define the location of the virtual bus and to estimate the voltage at the virtual bus.
Assume that multiple loads connected between two agents can be concentrated in the middle of the two nearest loads from the agents as shown in Figure 6. Then, define the variables related to the lengths: L is the total length between two agents; length1 and length2 are the distances of the virtual bus from buses 1 and 2, respectively. The distances length1 and length2 are obtained as:
l e n g t h 1 = x + y 2
l e n g t h 2 = z + y 2
l e n g t h 1 + l e n g t h 2 = x + y + z
where x and z are the distances from bus 1 and bus 2 to its nearest loads, respectively, y is the distance between these two loads. Then, the line resistances of length1 and length2 are obtained as:
R l e n g t h 1 = ( x + y 2 ) × r l i n e = l e n g t h 1 × r l i n e
R l e n g t h 2 = ( z + y 2 ) × r l i n e = l e n g t h 2 × r l i n e
where r line is the line resistance per unit length in Ω/km.
The voltage at the virtual bus estimated by agent 1 (Vvb1) can be given as:
V v b 1 = V 1 I 1 R l e n g t h 1
Similarly, the voltage at the virtual bus can also be estimated by agent 2 (Vvb2) as:
V v b 2 = V 2 + I 2 R l e n g t h 2
where I1 and I2 are the line currents measured by agents 1 and 2, respectively. Both Equations (16) and (17) estimate the voltage at the virtual bus using locally measured data.
When do we need to use virtual buses? There is a trade-off between the accuracy and the cost of the system. If there is a small load between agents, we do not need to consider a virtual bus for it because a new virtual bus can increase the dimension of Jacobian matrix. With multiple simulation studies, we found that two conditions need to be met for the use of virtual buses. First, the distance between distributed loads need to be longer than 10% of the total length of the distribution system. Second, total amount of loads between two agents need to be larger than 10% of the total loads in the system. Otherwise, like short distances or small loads, we do not need to consider to use a virtual bus.

3.3.4. Computation Procedure of Local Agents

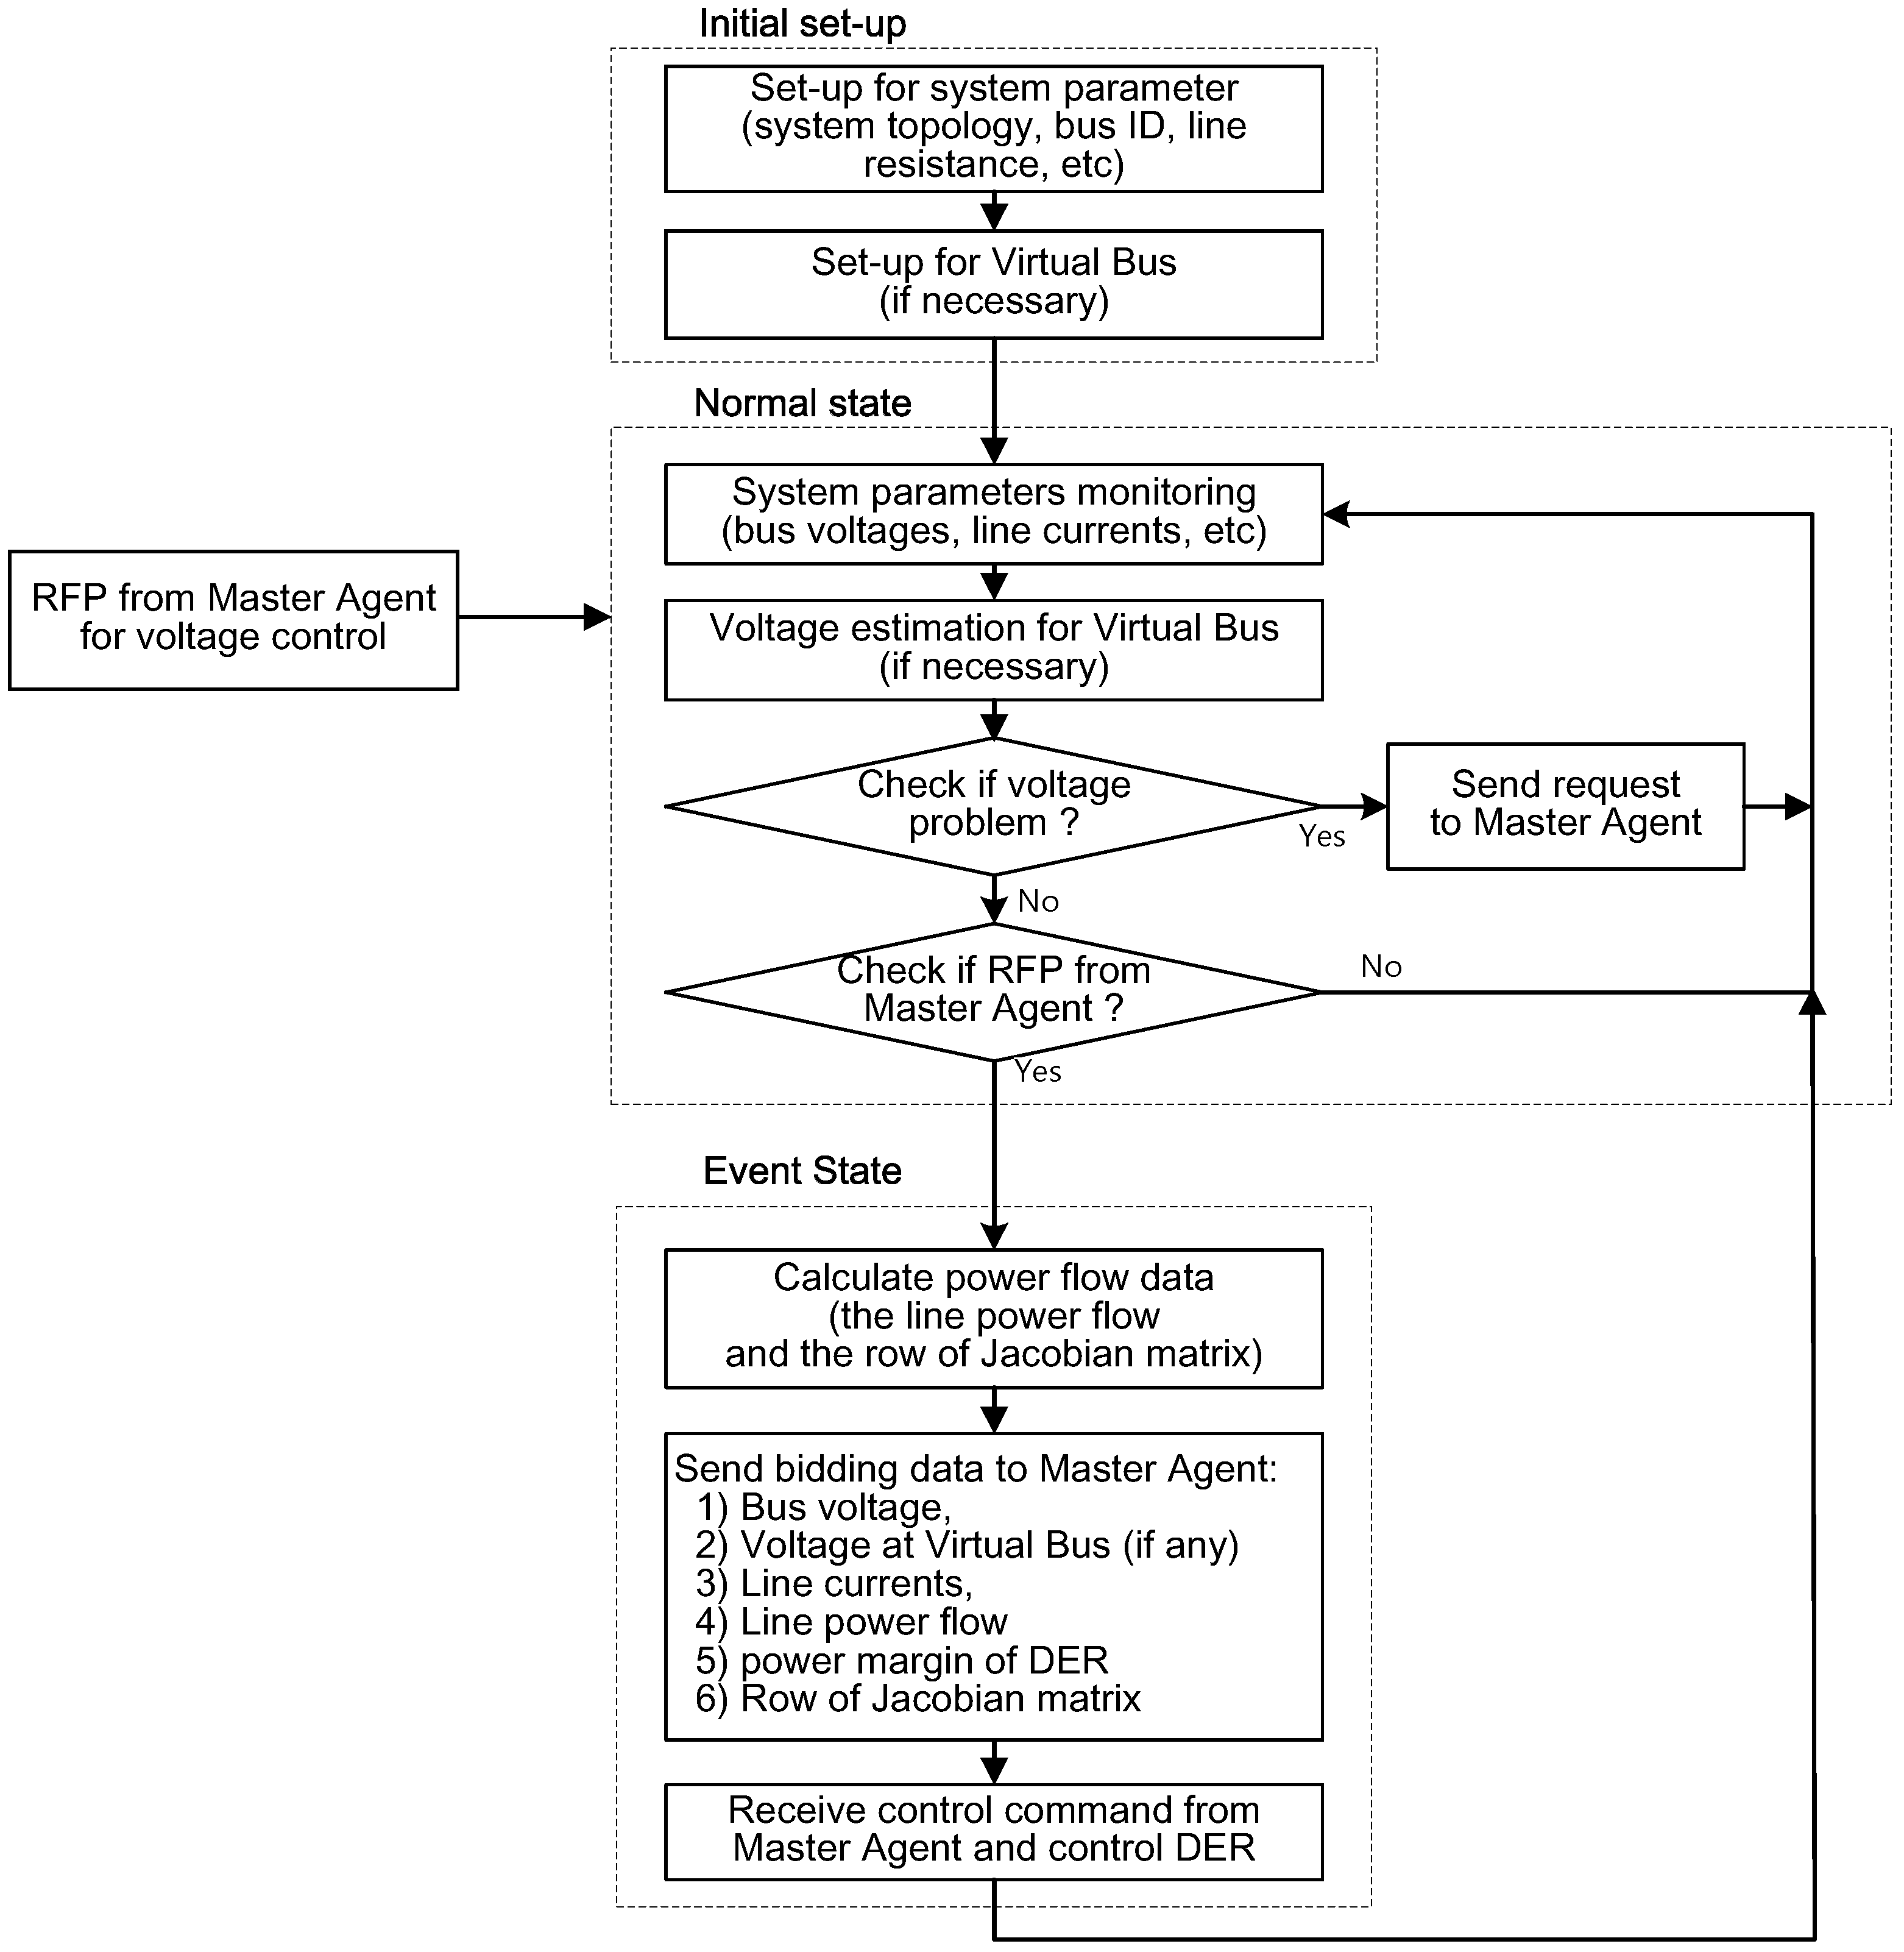
Figure 7 shows the flow chart of control procedures in local agents. In short, local agents have several responsibilities: (1) to check voltage violation problems; (2) to measure local power system data; (3) to calculate the corresponding row of the Jacobian matrix, line power flow, and active power margin of DER and (4) to estimate the voltage of the virtual bus based on local data. Then, send bidding data to the master agent for system-wise voltage control process. Local agents also send control signals to the DER to inject power into the system.

3.4. Control Procedure of the Master Agent

When a request for voltage restoration is transferred by local agents, the master agent first chooses the target bus that has the maximum voltage deviation from the normal range. In the proposed voltage control strategy, the master agent determines the reference value of the AC/DC converter and the power injection of DERs based on their bidding information.
The decision-making model of the master agent is the most important function that affects to the main concept of our voltage control algorithm. There are two criteria in the decision-making model of the master agent. First, the participation of the main AC/DC converter has priority to the control of DERs. Second, the master agent determines the participation of DERs in voltage control by comparing their VSFs.
Figure 8 shows the decision-making procedure of the master agent in detail. In this subsection, we propose the voltage control algorithm for the AC/DC converter first and then discuss how to determine the control command to DERs for voltage control.

3.4.1. Control Command for the AC/DC Converter

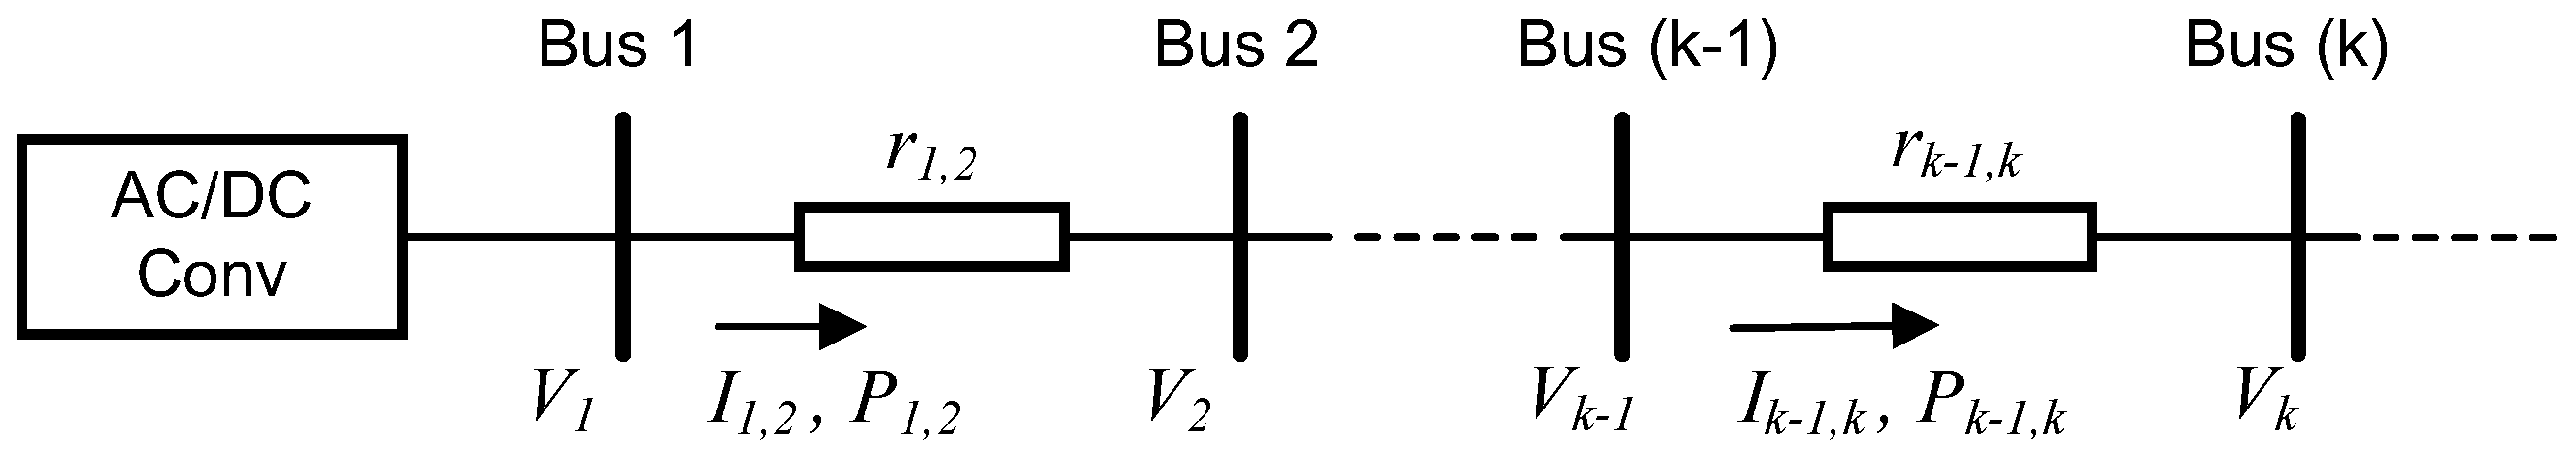
Let us define the node voltages at the (k − 1)-th and k-th buses as Vk−1 and Vk, respectively and the branch currents and the line power flows between (k − 1)-th and k-th buses as Ik−1,k and Pk−1,k, respectively as illustrated in Figure 9.
Assume that i-th bus is the target bus that has the maximum voltage violation exceeded the normal range. This means the Vi is the minimum voltage in an undervoltage problem or the maximum voltage in an overvoltage problem. According to the proposed method, the first control action is to change the output bus voltage of the AC/DC converter to make the voltage at the target bus restored within the normal range. The master agent should calculate the new voltage control command of the AC/DC converter. Define that Vinew is the voltage of the target bus that we want to restore after the AC/DC converter control and Viold is the voltage before control. Then, the voltage difference at the target bus can be calculated as:
Δ V i = V i n e w V i o l d
Similarly, the differential voltage at the (i − 1)-th bus is also given as:
Δ V i 1 = V i 1 n e w V i 1 o l d
On the other hand, the voltage at the i-th bus before and after the AC/DC converter control can be obtained from bus voltage and branch current measured at the (i – 1)-th bus as:
V i o l d = V i 1 o l d r i 1 , i I i 1 , i o l d
V i n e w = V i 1 n e w r i 1 , i I i 1 , i n e w
where r i 1 , i is the line resistance between the (i – 1)-th and i-th buses. If the loads consume constant power, we can assume that the line power flows Pi−1,i before and after the control action are almost the same. Then, we can obtain the equation about the line power flow between buses (i – 1) and i as:
P i 1 , i = V i o l d . I i 1 , i o l d = V i n e w . I i 1 , i n e w
With (22), we can rewrite (20) and (21) as:
V i o l d = V i 1 o l d P i 1 , i V i 1 o l d r i 1 , i
V i n e w = V i 1 n e w P i 1 , i V i 1 n e w r i 1 , i
From (18) to (24), we can obtain the following equation, which is a linear quadratic equation of Δ V i 1 as:
V i 1 o l d . Δ V i 1 2 + [ ( V i 1 o l d ) 2 + P i 1 , i . r i 1 , i V i 1 o l d Δ V i ] . Δ V i 1 ( V i 1 o l d ) 2 . Δ V i = 0
The detail derivation process of (25) will be provided in Appendix A at the end of this paper. In (25), the values of V i - 1 o l d and P i 1 , i can be measured by the local agent and r i 1 , i is a given value from the distribution system topology. When we apply the quadratic formula to (25), we can obtain Δ V i 1 as a function of Δ V i as:
Δ V i 1 = f 1 ( Δ V i ) + f 2 ( Δ V i ) 2 V i 1 o l d
where the sub-functions f1 and f2 can be defined as:
f 1 ( Δ V i ) = ( V i 1 o l d ) 2 + V i 1 o l d . Δ V i P i 1 , i . r i 1 , i
f 2 ( Δ V i ) = [ ( V i 1 o l d ) 2 V i 1 o l d . Δ V i + P i 1 , i r i 1 , i ] + 4 ( V i 1 o l d ) 3 . Δ V i
From (26) to (28), it can be noted that in order to compensate the voltage at the target bus as much as Δ V i , we need to change the voltage at (i − 1)-th bus as Δ V i - 1 . If we apply (26) up to the first bus where AC/DC converter installed using backward sweeping method, we can finally obtain the voltage change command of the AC/DC converter as:
Δ V 1 = f 1 ( Δ V 2 ) + f 2 ( Δ V 2 ) 2 V 1 o l d
where:
f 1 ( Δ V 2 ) = ( V 1 o l d ) 2 + V 1 o l d . Δ V 2 P 1 , 2 . r 1 , 2
f 2 ( Δ V 2 ) = [ ( V 1 o l d ) 2 V 1 . Δ V 2 + P 1 , 2 . r 1 , 2 ] 2 + 4 ( V 1 o l d ) 3 . Δ V 2
In (29) through (31), V 1 o l d is the voltage measured at the AC/DC converter, and Δ V 2 is the voltage change at bus 2 required for restoration in the target bus as much as Δ V i . The value of P1,2 and r1,2 are the line power flow and line resistance between buses 1 and 2, respectively.
Finally, the voltage control command of the AC/DC converter can be obtained from (29) as:
V c o n v n e w = V 1 o l d + Δ V 1
If the margin of the output voltage of the AC/DC converter is smaller than Δ V 1 , the AC/DC converter cannot fully compensate the voltage problem at the target bus. For example, consider a case that AC/DC converter already maintained the output voltage as 1.05 p.u. during undervoltage problem. Then, the AC/DC converter cannot increase the voltage more because the voltage at the AC/DC converter exceeds the upper level limit. Then, the master agent controls the AC/DC converter at the maximum value and activates power control of DERs for the remaining voltage control task.

3.4.2. Control Command for Distributed Energy Resources

As shown in Figure 8, the DERs control is activated if and only if the voltage problem lasts after using AC/DC converter control. Then, the master agent selects DERs and then determines the active power output of the selected DERs according to bidding information such as the VSF and real power margins of the DERs. The selection rule of DER is to choose the DERs that have larger VSF values first. Then, we calculate the injection power of DER to compensate the target bus voltage within the normal range. The equation for determining the DER power is as:
Δ P j = Δ V k V S F k j
where, bus k is the target bus and j is the bus index where the selected DER is connected. The variable Δ V k represents the voltage deviation of the target bus from the normal range and Δ P j is the required additional power injection from the DER. If the power margin of the selected DER is smaller than Δ P j , the voltage at the target bus cannot be fully compensated. Then, the master agent selects another DERs with the second largest VSF value and similarly calculates the injection power command to compensate the remaining voltage deviation after the first DER control action. This process repeats until the voltage at the target bus is completely compensated.

4. Simulation Results

4.1. Test System Layout

To verify the performance of the proposed voltage control scheme, we implemented a simulation model of a LVDC distribution system using MATLAB version R2015b developed by MathWorks (https://www.mathworks.com/) as shown in Figure 10. The AC/DC converter interconnects the LVDC system to the 22.9 kV medium-voltage AC grid. The simulation model is a typical radial distribution system with nine buses whose rated voltage is DC 1500 V. The requirement for voltage regulation is ± 5 % of rated voltage over the whole distribution lines [4]. The distribution line is modeled as one of the popular types of overhead line in South Korea, OW 60 mm2, of which line resistance is 0.313 Ω/km. The configuration of the LVDC distribution system is a bipolar system that has positive and negative poles as explained in [2,3]. The voltage difference between two poles is 1500 V and the loads are connected between the positive and negative poles. The distance and resistance of the distribution line are listed in Table 1.
We assumed that four DERs are connected to the distribution system and their rated power is identically set to 20 kW. Hence, the maximum power injection from all the DERs are 80 kW. Loads are distributed over the distribution lines as shown in Figure 10. Load changes differently in each study cases from 100 kW to 300 kW. Figure 10 also illustrates the configuration of MAS-based voltage control system. The test system is comprised of one master agent at bus 1 and four local agents at buses 2, 3, 8 and 9 in the feeder. For all the following cases, we assume the following conditions:
  • The output voltage of the main AC/DC converter is maintained at 1.0 p.u. in nominal operation.
  • The minimum and maximum allowable voltages are 0.95 p.u and 1.05 p.u., respectively.
As seen in Figure 10, there is no local agents installed between bus 4 and bus. In this unmonitored region, bus voltages are not directly measured by local agents, but rather estimated by the agents considering the “virtual bus” concept. There are three values such as x, y and z to represent the distances between load buses that are not directly measured by local agents as depicted in Figure 10. In this section, we evaluate two case studies to evaluate the performance of the proposed method and compare the results to conventional methods. In case 1, the distance between buses 3 and 8 is relatively short and the loads in between are also small whereas the distance and the loads between the buses are relatively long and large in case 2.
In each case, we assume three different loading conditions such as normal loading condition (L0), heavy loading condition (L1) and heavier loading condition (L2), which can be defined as:
  • Normal loading condition (L0): In this condition, we do not need to compensate the voltages of the system because loads are moderate so that all the buses in the LVDC distribution system are within the normal range.
  • Heavy loading condition (L1): In this condition, the distribution system suffers an undervoltage problem due to load increase. This problem can be fully compensated by the AC/DC converter control.
  • Heavier loading condition (L2): Load increase more than heavy loading condition (L1) so that the LVDC system suffers severe undervoltage problems. In this case, both the AC/DC converter control and DER control are needed to compensate the voltage problem.
In each case, the results of the proposed method are analyzed in detail over the three different loading conditions. Table 2 list the three loading conditions for each case study. The values are arbitrarily chosen to show the control performance clearly. The results are also compared to the previous control method proposed in [15].

4.2. Case 1: x, y and z Are Short, Loads at Bus 4, 5, 6, 7 Are Small

In this case, the distance of the unmonitored region between buses 4 and 7 are relative short and their loads are also small. The voltage profiles under different loading conditions before and after control actions are listed in Table 3. Table 4 provides the detailed computation results of VSFs under the proposed method in this paper and the conventional method described in [15].
In Table 3, the second column explains the voltage profile during normal loading condition (L0). In this condition, the minimum voltage is 0.9588 p.u., which is in the normal range. The third column in Table 3 shows the voltage profiles during heavy loading condition (L1). Due to the increases in loads, the voltage at bus 9 reduces to 0.9426 p.u. below the normal range. In the proposed method, the local agent 4 can detect the voltage violation and requests for voltage compensation to the master agent as much as 0.0074 p.u. After receiving the request message, the master agent computes the required change in the AC/DC converter output voltage as 0.006962 p.u. to make the minimum bus voltage over 0.95 p.u. using (32).
The fifth and seventh columns in Table 3 show the results for L1 loading condition after the AC/DC converter control using conventional method [15] and the proposed method. It can be noted that the output voltages of the AC/DC converter are 1.02867 p.u. in the conventional method and 1.006962 p.u. in the proposed method while the overall voltage profiles are maintained within the normal range. This means the proposed method can maintain the system voltage with smaller control efforts. This is due to precise computation without simplification of the system model in the proposed method compared to the conventional method.
The fourth column in Table 3 shows the voltage profile on L2 loading condition after the AC/DC converter control. Note that the voltage at bus 1 becomes 1.05 p.u. due to the maximum AC/DC converter control. However, even after the AC/DC converter control, an undervoltage problem still exists at bus 9 as 0.9463 p.u. Therefore, we need to use the power injection from DERs to compensate the remaining voltage problems. For this, the master agent sends an RFP signal to local agents and the local agents at buses 2, 3, 8 and 9 to receive locally computed information such as the corresponding row of the Jacobian matrix and the margin of DERs. Then, the master agent calculates the required power injection from the DER using (33).
The sixth and eighth columns of Table 3 list the voltage profiles after control action of the conventional and proposed methods, respectively. In both results, the voltage profiles can be maintained within the normal range between 0.95 p.u. and 1.05 p.u. However, in the proposed method, the DER can inject less active power than the conventional method.
Table 4 provides the accuracy of the computational results for the VSFs in the proposed and conventional methods for heavier loading condition (L2). The second and fourth columns in Table 4 show the VSFs computed by the proposed method with or without virtual bus concept. The sixth column gives the VSFs calculated by the conventional method of [15]. According to the results, the VSF of the bus 9 is the largest. This means the DER at bus 9 can compensate the voltage problem with the minimum power injection to the distribution system.
The third, fifth and seventh columns in Table 4 represent the computational error against ideal power flow analysis when local agents are connected to all the buses in the distribution system including the buses between buses 4 and 7. The computation error in the proposed method is less than 0.022% with virtual bus concept while the conventional method has around 10% error. The proposed method with virtual bus concept is the most accurate compared to the others. In addition, the required power injection of DER at bus 9 is 6.0775 kW in the proposed method while 7.0543 kW in the conventional method. This means that the proposed method can save about 1kW for the voltage compensation compared to the conventional method. Figure 11 shows the graph of the voltage profile of the LVDC distribution system in case 1.

4.3. Case 2: x, y and z Are Long, Loads Are High

The major difference case 2 from case 1 is that the distance between buses 3 and 8 becomes larger and the loads in between grow bigger. Because there is no local agent installed between buses 4 and 7, the power system parameters such as bus voltage and line currents are not measured in the region. Therefore, we can expect that the error in power flow analysis may increase due to the effect of the unmonitored region. Table 5 lists the voltage profiles of the LVDC distribution system on three different loading conditions before and after the voltage control. Similar to case 1, the voltage profile is good without any voltage control actions in the normal loading condition (L0). The minimum voltage is 0.9572 p.u. at bus 9 within the nominal voltage range.
During heavy loading condition (L1), the voltage at bus 9 plummets to 0.9057 p.u. as shown in the third column in Table 5. In this condition, the AC/DC converter can compensate the voltage problem by increasing the output voltage of the AC/DC converter control using the conventional and proposed control method, respectively. Both results are good but the proposed method can change the output voltage of the AC/DC converter less than the conventional method. This means the proposed method can achieve the control task with less effort.
During heavier loading condition (L2), the voltage profile of the LVDC distribution system cannot remain in the normal range even after the AC/DC converter control. In this condition, the DER active power control must be activated. The sixth and eighth columns of Table 5 show the voltage profiles after DER control in the conventional and proposed methods, respectively. Both results are acceptable because the voltage profiles are well maintained within the normal range.
Table 6 shows the computation results for VSF of the DERs for the voltage compensation at bus 9 during L2 condition. The results in Table 6 indicate that the maximum error of the proposed method with virtual bus concepts is still less than 1% (0.52%) whereas the error without virtual bus is higher than 5% (5.67%) and the error of the conventional method is more than 10% (15.36%). This means that the virtual bus concept is essential when the unmonitored region is lengthy and highly loaded.
As discussed in Section 3, the virtual bus is located at length1 = 0.582 km according to (11). Two agents at buses 3 and 8 can estimate the voltage at the virtual bus individually and send the estimated voltage to the master agent. The master agent can use the average of two estimated virtual bus voltage from two agents. With this idea, the proposed method can filter out noises in the estimated voltages. Figure 12 shows the graph of the voltage profile of the LVDC distribution system in case 2.
Figure 13 shows the comparison between the power injection of the DER to compensate the voltage problem during heavy loading condition (L2) in cases 1 and 2. For example, the required power injection of the DER at bus 9 is 17.143 W in the proposed method while the conventional method requires 19.811 kW. This means that the proposed method can save 2.668 kW while providing the same voltage compensation. This result shows the main advantage of our proposed method compared to the conventional method because the proposed method can use less active power to solve the same voltage problems in both cases.

5. Conclusions

This paper presented a new voltage control scheme for LVDC distribution system using coordination control between the main AC/DC converter and multiple DERs based on MAS. The proposed method distributes power flow analysis and decision-making procedure to multiple local agents. Since local agents can detect voltage problems in real time and refine raw data to system information of the overall system, the computation burden in the master agent can be significantly relieved. For example, the roles of the local agents are to monitor the local bus voltage and currents, to detect the voltage problem and to request the voltage compensation. Local agents also compute the power system data such as corresponding rows of the system Jacobian matrix, power margin of DERs, line power flow and so on. All the functions of the local agents can be implemented in an affordable microcontroller.
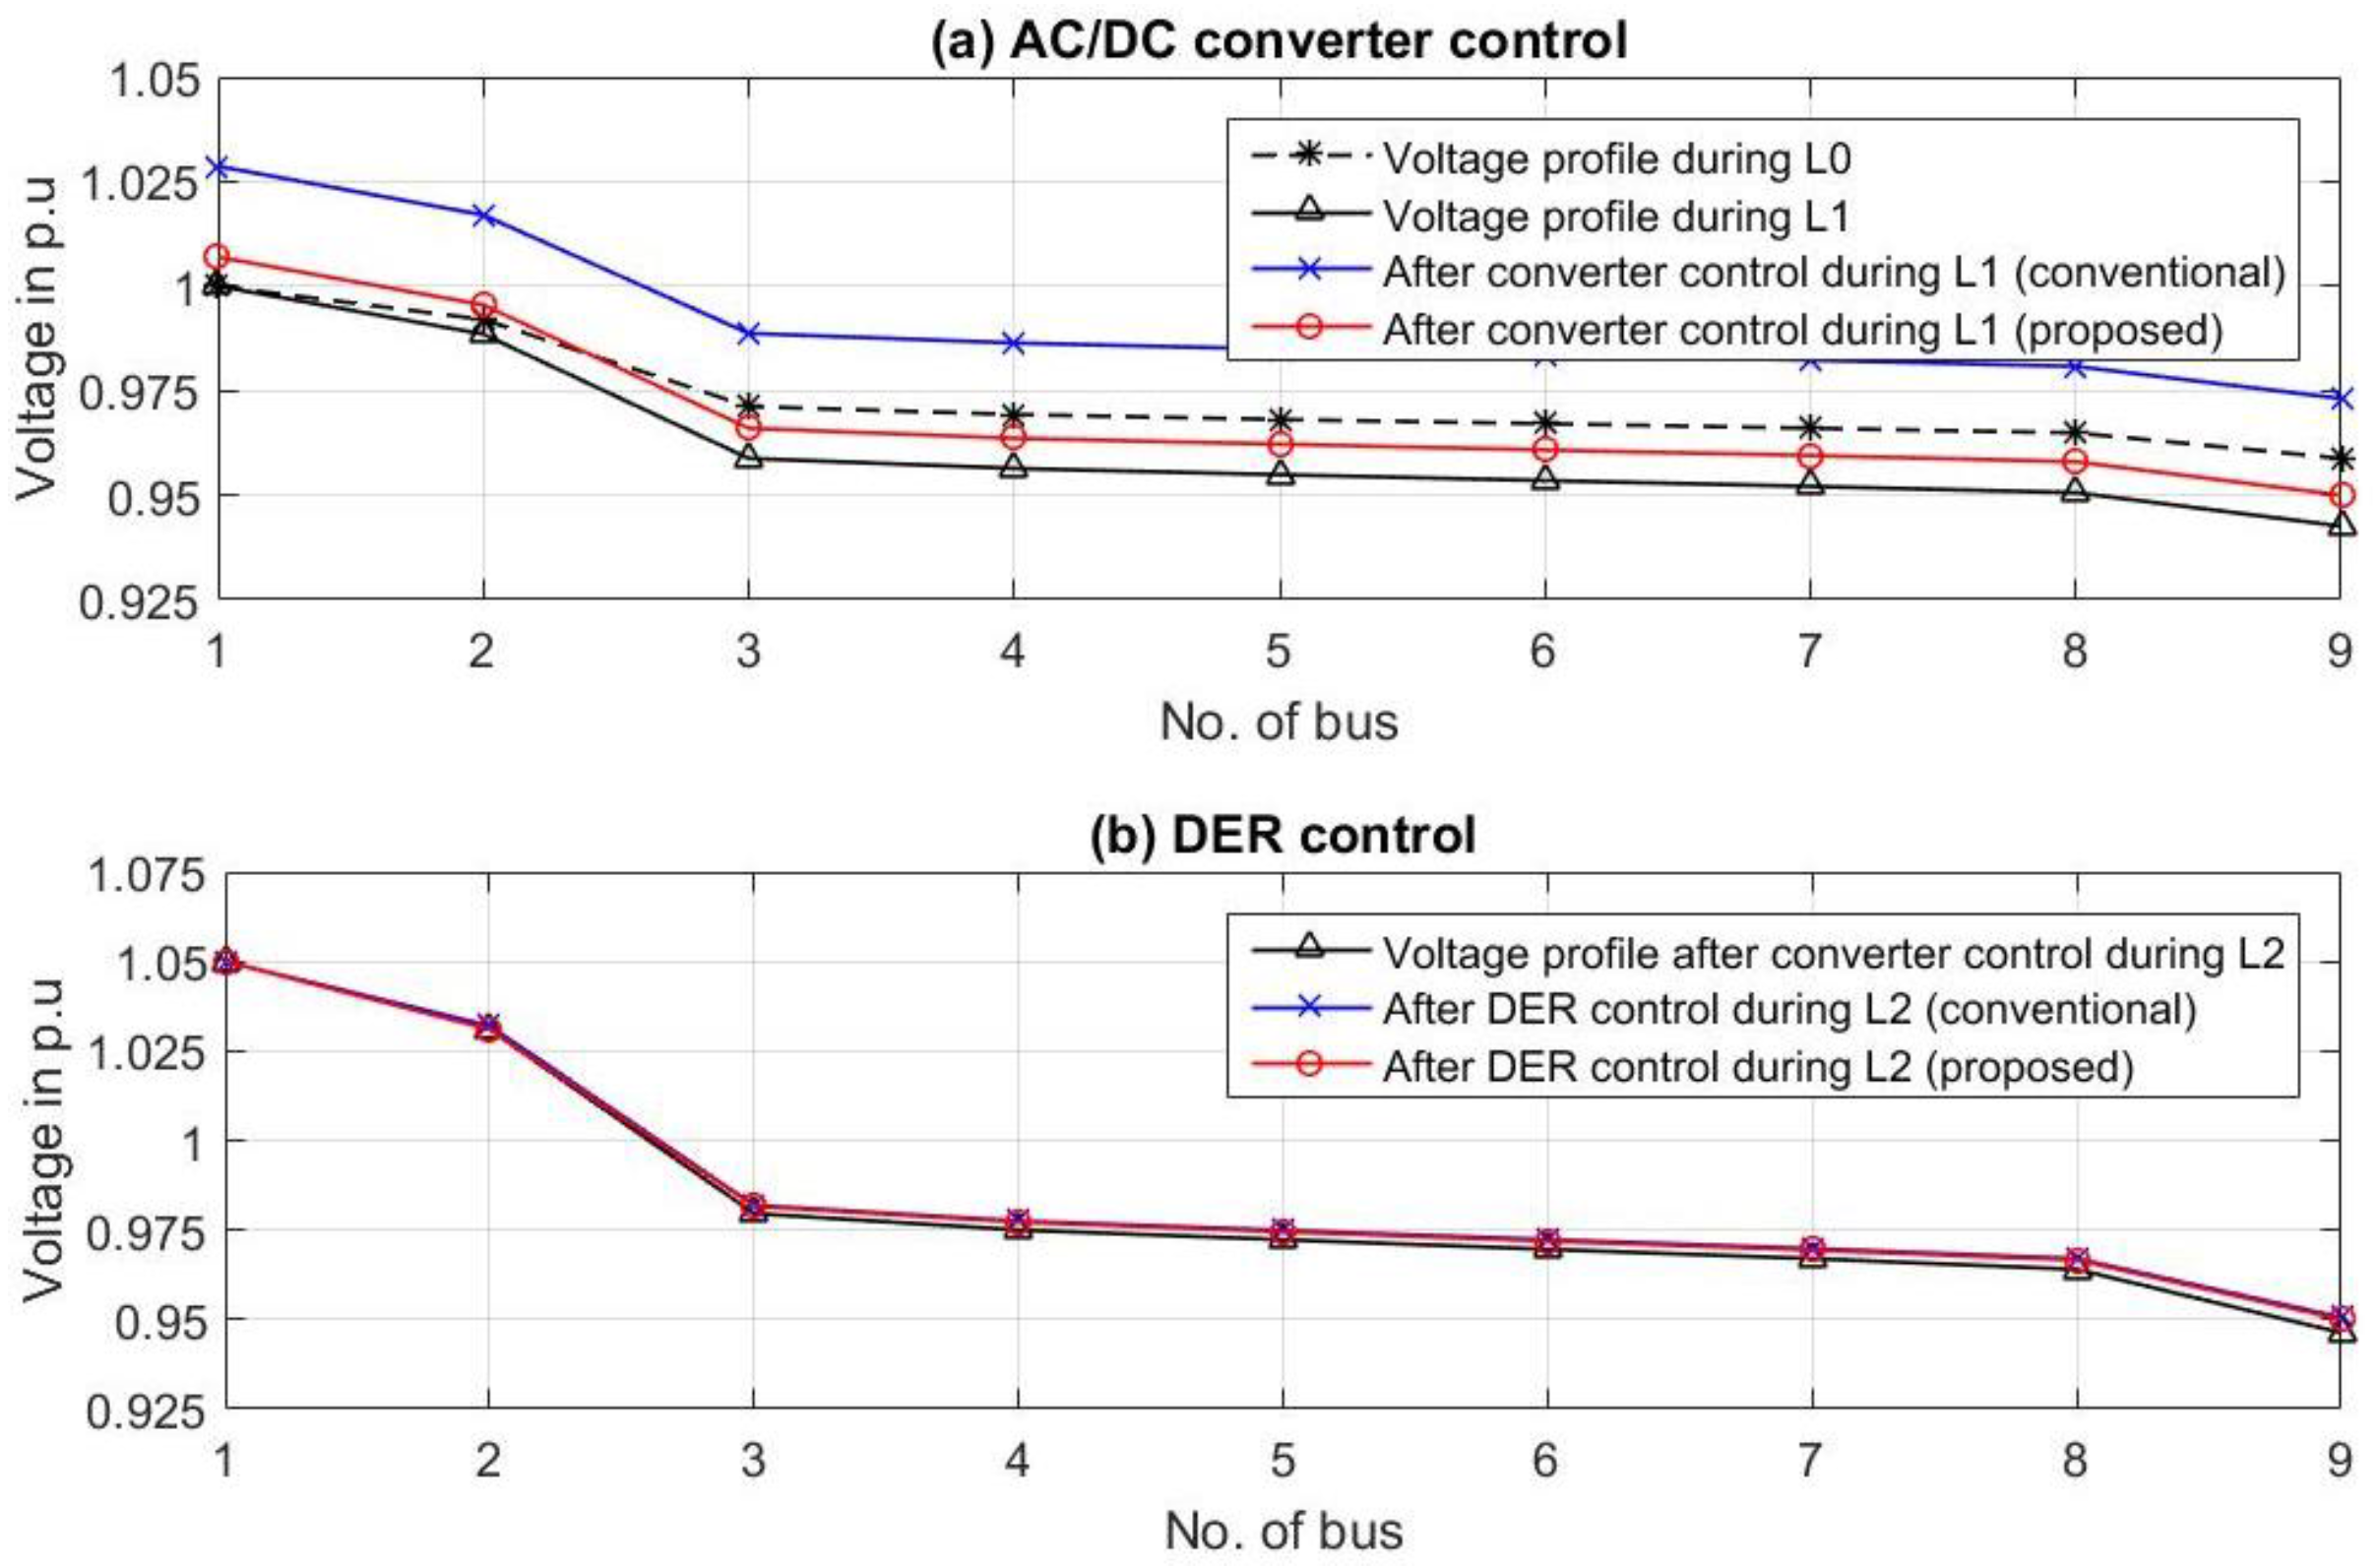
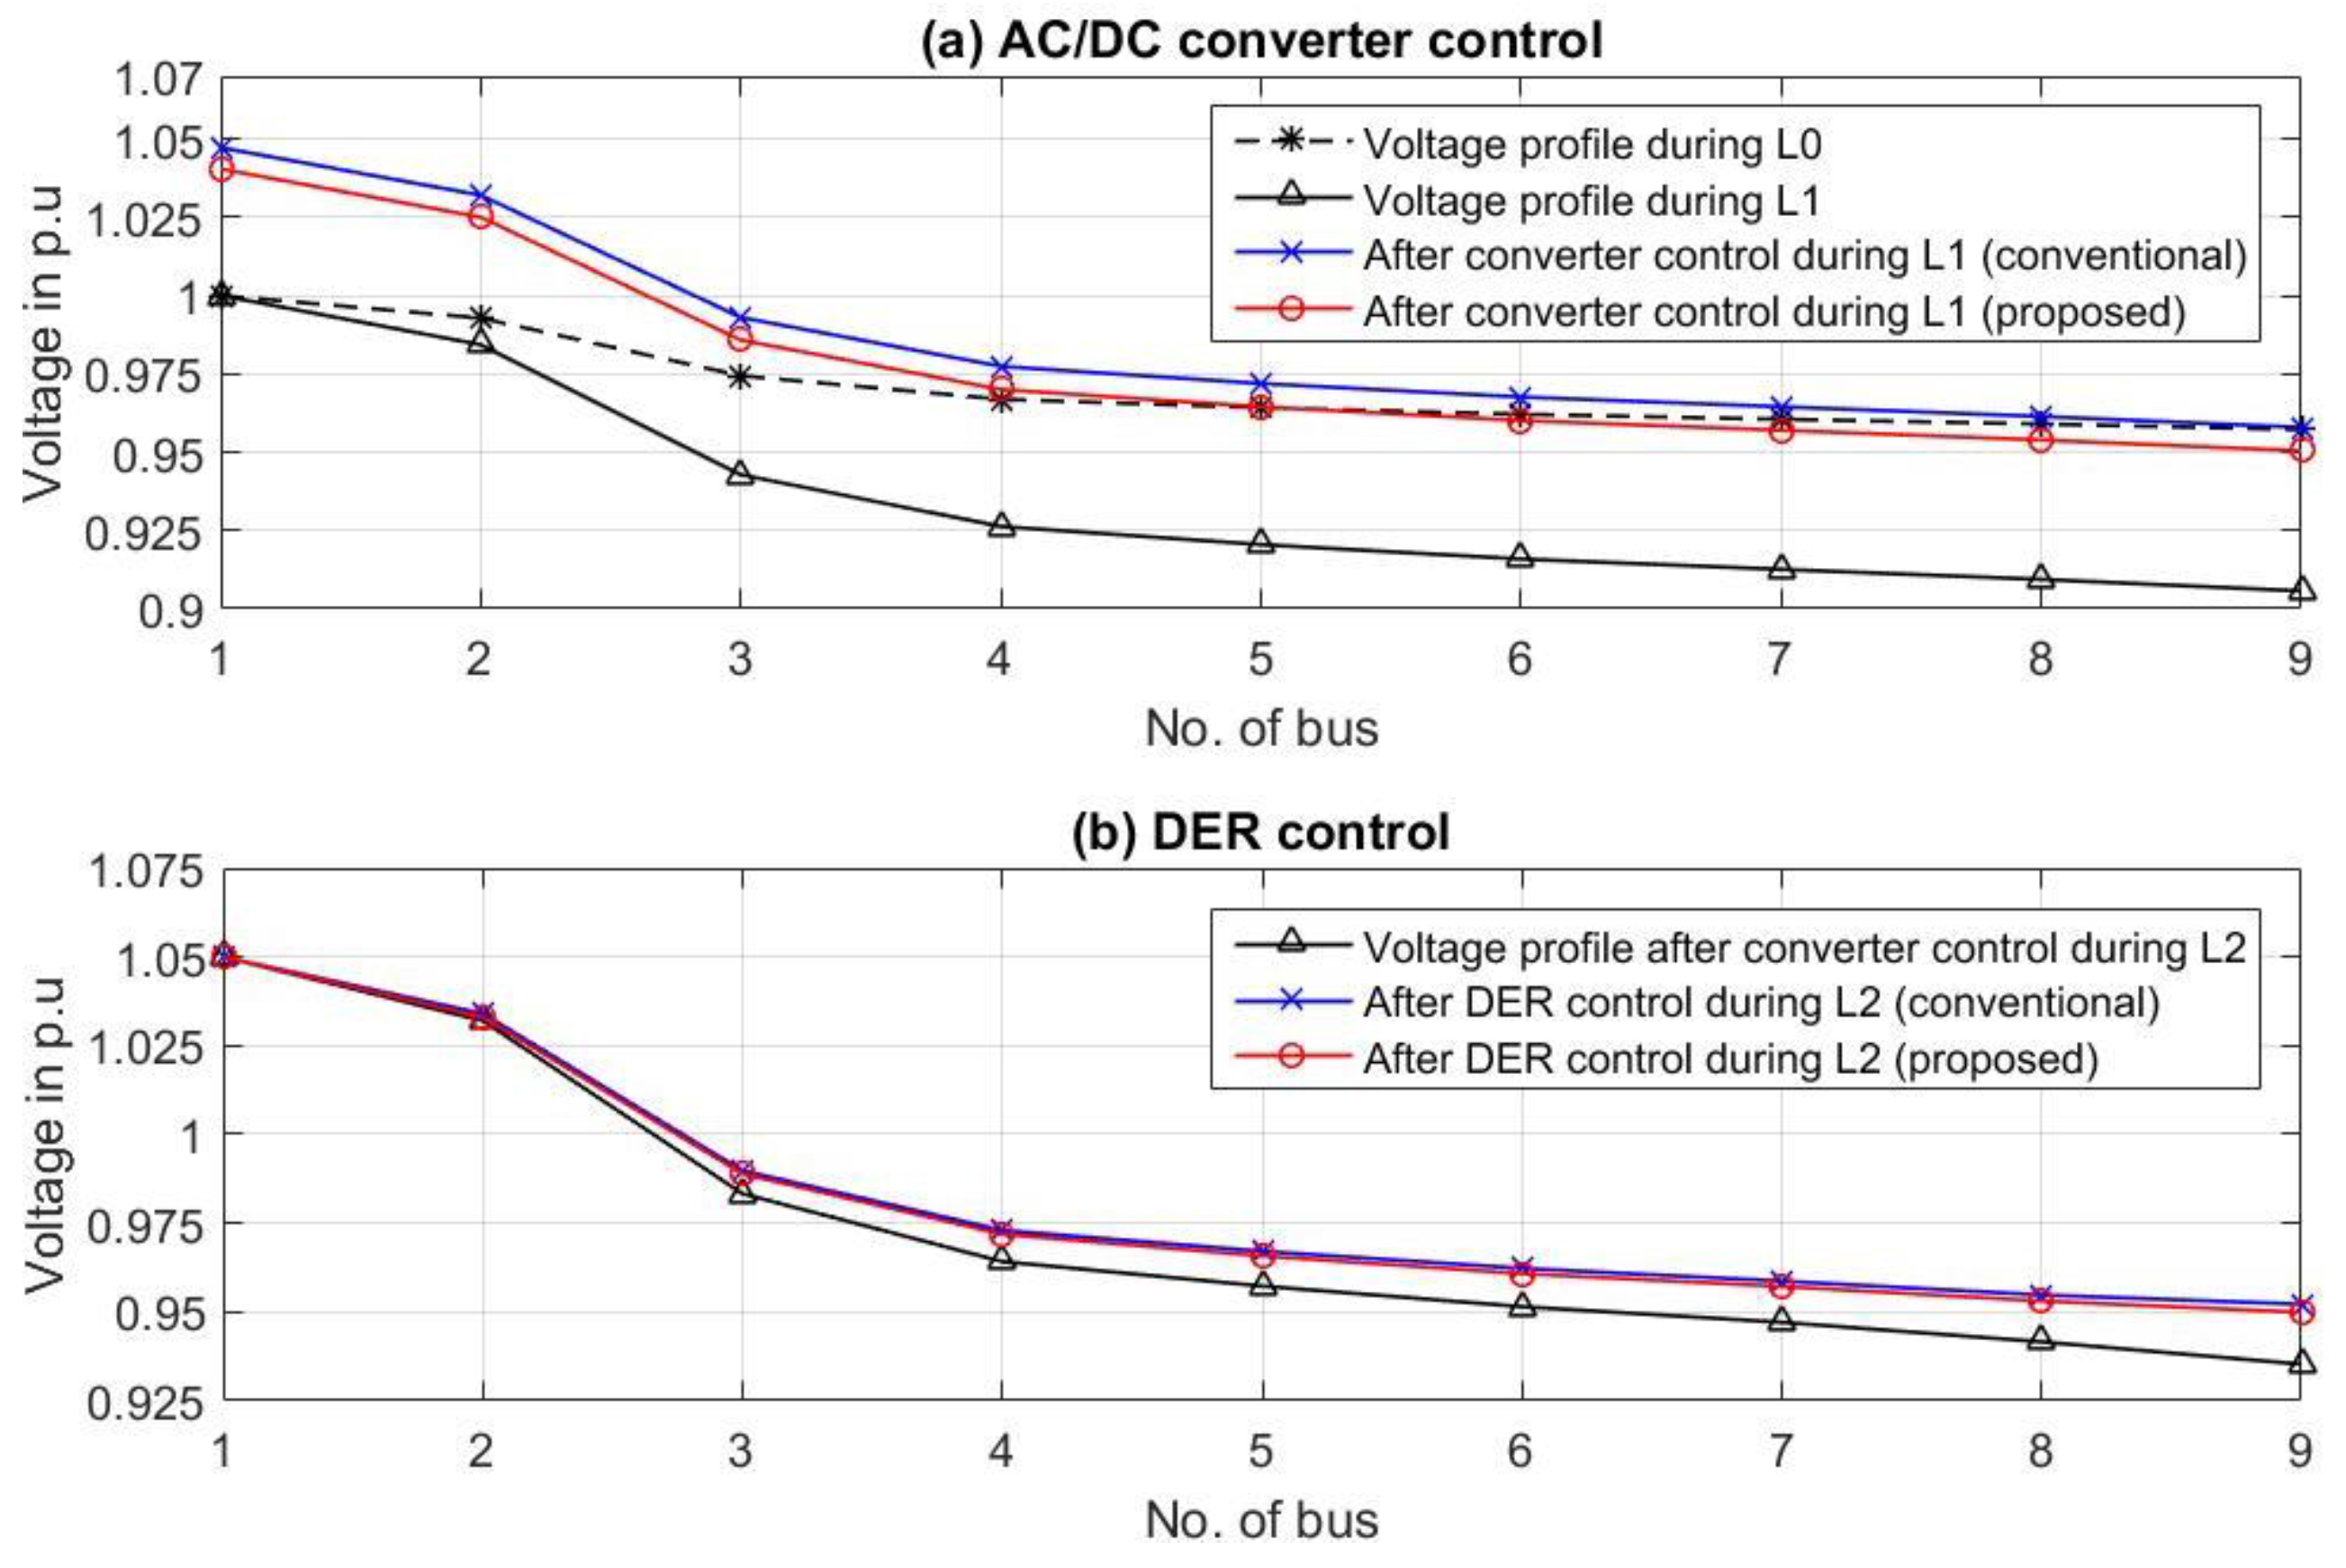
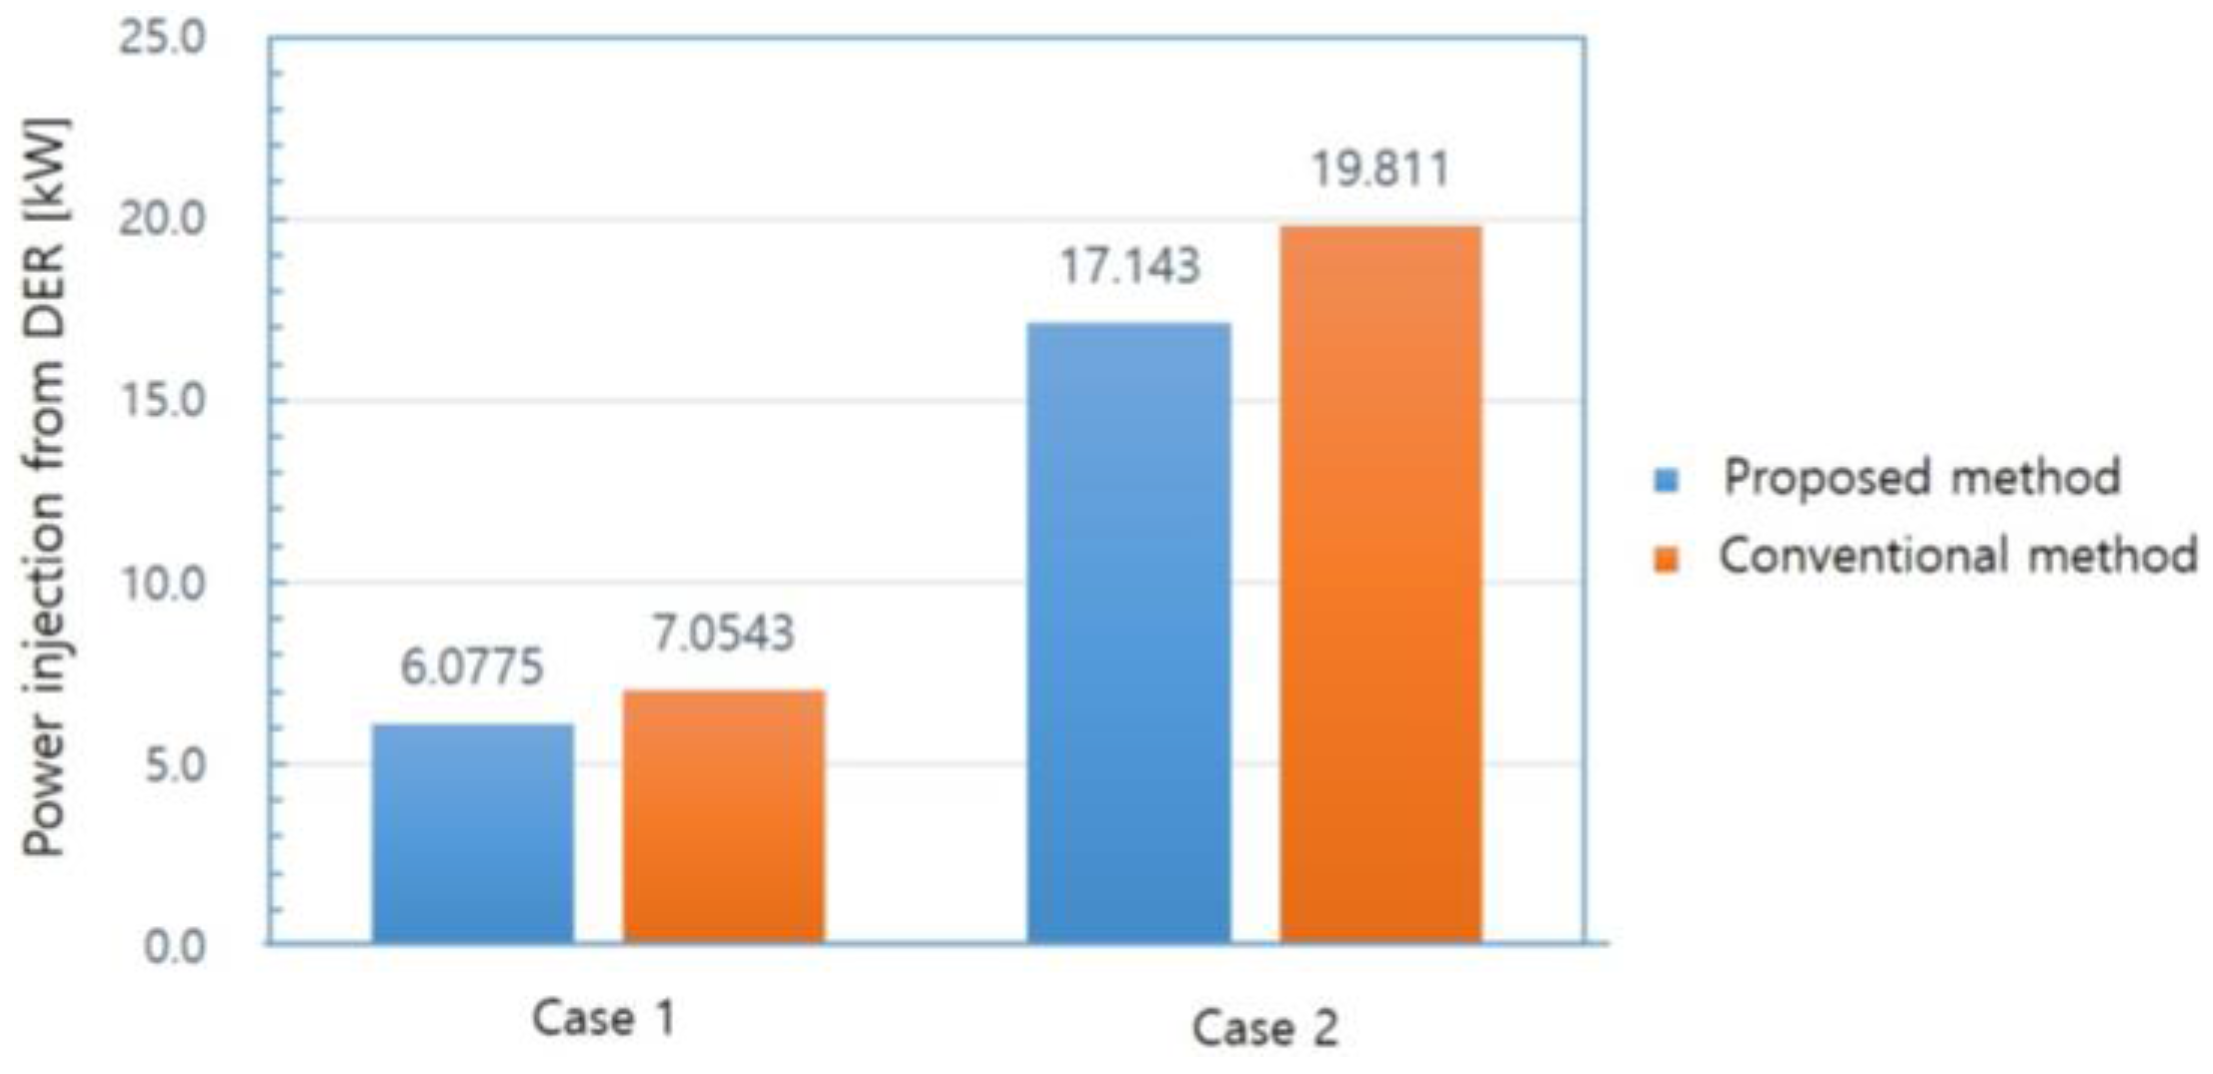
When a voltage problem occurs, local agents participate in the bidding process based on the CNP. This paper also proposed the definition of “virtual bus” and presented how to estimate the power system data of the virtual bus in the neighboring local agents. By using the virtual bus, we can use the data of unmonitored buses into the system analysis so that the proposed method can be more accurate. The proposed method is compared to the conventional method with case studies. Through the simulation results, it was numerically verified that the proposed method can solve voltage problems more accurately and use smaller control efforts than the conventional method.

Acknowledgments

This research was supported by the Global Scholarship Program for Foreign Graduate Students at Kookmin University in Korea and by the National Research Foundation of Korea grant funded by the Korea government (MSIP) (NRF-2015R1C1A1A01054635).

Author Contributions

Trinh Phi Hai developed the main idea of the paper and also compiled the manuscript; Hector Cho and Hyun-Koo Kang advised to apply multi-agent based control algorithms to the paper; Il-Yop Chung proposed the main idea and supervise the overall research; Jintae Cho and Juyong Kim advised to improve the results of the paper in terms of practicality in real power systems.

Conflicts of Interest

The authors declare no conflict of interest.

Appendix A

In Section 3.4.1, subtracting (23) from (24) yields:
V i n e w V i o l d = ( V i 1 n e w V i 1 o l d ) + ( 1 V i 1 o l d 1 V i 1 n e w ) P i 1 , i r i 1 , i
Then, application of (18) and (19) to (A1) results in:
Δ V i = Δ V i 1 + V i 1 n e w V i 1 o l d V i 1 n e w V i 1 o l d P i 1 , i r i 1 , i = Δ V i 1 + V i 1 n e w V i 1 o l d ( Δ V i 1 + V i 1 o l d ) V i 1 o l d P i 1 , i r i 1 , i
where V i 1 n e w = Δ V i 1 + V i 1 o l d .
If we rearrange (A2) to a quadratic form in terms of Δ V i - 1 , we can obtain (A3) that is the same as (25):
V i 1 o l d . Δ V i 1 2 + [ ( V i 1 o l d ) 2 + P i 1 , i . r i 1 , i V i 1 o l d Δ V i ] . Δ V i 1 ( V i 1 o l d ) 2 . Δ V i = 0

References

  1. Hammerstrom, D.J. AC versus DC distribution systems did we get it right? In Proceedings of the IEEE Power Engineering Society General Meeting, Tampa, FL, USA, 24–28 June 2007; pp. 1–5.
  2. Nuutinen, P.; Kaipia, T.; Peltoniemi, P.; Lana, A.; Pinomaa, A.; Mattsson, A.; Silventoinen, P.; Partanen, J.; Lohjala, J.; Matikainen, M. Research site for low-voltage direct current distribution in a utility—Structure, functions, and operation. IEEE Trans. Smart Grid 2014, 5, 2574–2582. [Google Scholar] [CrossRef]
  3. Chung, I.; Trinh, P.H.; Cho, H.; Kim, J.; Cho, J.; Kim, T. Design and evaluation of voltage control techniques by hierarchical coordination of multiple power converters in low-voltage DC distribution Systems. In Proceedings of the International Conference on Electricity Distribution (CIRED Workshop), Helsinki, Finland, 14–15 June 2016.
  4. Std, ANSI C84. 1-2011. American National Standard for Electric Power Systems and Equipment-Voltage Ratings (60 Hertz). 2011. Avaliable online: https://www.nema.org/Standards/ComplimentaryDocuments/Contents-and-Scope-ANSI-C84-1-2011.pdf (accessed on 20 September 2015).
  5. Hrisheekesha, P.N.; Sharma, J. AI applications to distribution system with distributed generation. Int. J. Comput. Appl. 2010, 1, 38–42. [Google Scholar] [CrossRef]
  6. Harlow, J.H. Load Tap Changing Control; National Rural Electric Cooperative Association (NRECA): Houston, TX, USA, 1996. [Google Scholar]
  7. Viawan, F.A.; Sannino, A.; Daalder, J. Voltage control with on-load tap changers in medium voltage feeders in presence of distributed generation. Electr. Power Syst. Res. 2007, 77, 1314–1322. [Google Scholar] [CrossRef]
  8. Viawan, F.A.; Karlsson, D. Voltage and reactive power control in systems with synchronous machine-based distributed generation. IEEE Trans. Power Deliv. 2008, 23, 1079–1087. [Google Scholar] [CrossRef]
  9. Phuong, N.H. Multi Agent System Based Active Distribution Network. Ph.D. Thesis, Eindhoven University of Technology, Eindhoven, The Netherlands, 2010. [Google Scholar]
  10. Farag, H.E.Z.; El-Saadany, E.F. A novel cooperative protocol for distributed voltage control in active distribution system. IEEE Trans. Power Syst. 2013, 28, 1645–1656. [Google Scholar] [CrossRef]
  11. Baran, M.E.; El-Markabi, I.M. A multi agent based dispatching scheme for distributed generators for voltage support on distribution feeders. IEEE Trans. Power Syst. 2007, 22, 52–59. [Google Scholar] [CrossRef]
  12. Kang, H.; Chung, I.; Moon, S. voltage control method using distributed generators based on multi-agent system. Energies 2015, 8, 14009–14025. [Google Scholar] [CrossRef]
  13. Ito, Y.; Zhongqing, Y.; Akagi, H. DC microgrid based distribution power generation system. In Proceedings of the Power Electronics and Motion Control Conference, Xi’an, China, 14–16 August 2004.
  14. Kakigano, H.; Nishino, A.; Ise, T. Distribution voltage control for DC microgrid with fuzzy control and gain-scheduling control. In Proceedings of the 8th International Conference on IEEE Power Electronics and Energy Conversion Congress & Exposition Asia, Jeju, Korea, 30 May–3 June 2011.
  15. Hamad, A.A.; Farag, H.E.; El-Saadany, E.F. A novel multiagent control scheme for voltage regulation in DC distribution system. IEEE Trans. Sustain. Energy 2015, 6, 534–545. [Google Scholar] [CrossRef]
  16. Choi, J.; Jeong, H.; Choi, J.; Won, D.; Ahn, S.; Moon, S. Voltage control scheme with distributed generation and grid connected converter in a DC microgrid. Energies 2014, 7, 6477–6491. [Google Scholar] [CrossRef]
  17. Dai, C.; Baghzouz, Y. On the voltage profile of distribution feeders with distributed generation. In Proceedings of the IEEE Power Engineering Society General Meeting, Toronto, ON, Canada, 13–17 July 2003.
  18. Palizban, O.; Kauhaniemi, K. Hierarchical control structure in microgrids with distributed generation: Island and grid-connected mode. Renew. Sustain. Energy Rev. 2015, 44, 797–813. [Google Scholar] [CrossRef]
  19. Justo, J.J.; Mwasilu, F.; Lee, J.; Jung, J. AC-microgrids versus DC-microgrids with distributed energy resources: A review. Renew. Sustain. Energy Rev. 2013, 24, 387–405. [Google Scholar] [CrossRef]
  20. McArthur, S.D.J.; Davidson, E.M.; Catterson, V.M.; Dimeas, A.L.; Hatziargyriou, N.D.; Ponci, F.; Funabashi, T. Multi-agent systems for power engineering applications; Part I: Concepts, approaches, and technical challenges. IEEE Trans. Power Syst. 2007, 22, 1743–1752. [Google Scholar] [CrossRef] [Green Version]
Figure 1. Voltage profile in (a) DC radial network; (b) loop network.
Energies 10 00041 g001
Figure 2. Voltage profile variations in the DC distribution system.
Energies 10 00041 g002
Figure 3. The structure of the proposed multi-agent system (MAS)-based voltage control system.
Energies 10 00041 g003
Figure 4. Structure of control agents.
Energies 10 00041 g004
Figure 5. MAS-based overall voltage control process.
Energies 10 00041 g005
Figure 6. The location of virtual bus.
Energies 10 00041 g006
Figure 7. Flow-chart of control actions in local agents.
Energies 10 00041 g007
Figure 8. Flow-chart of decision-making procedure of the master agent.
Energies 10 00041 g008
Figure 9. Power system parameters in LVDC radial distribution system.
Energies 10 00041 g009
Figure 10. Configuration of a LVDC distribution system and MAS-based control system for simulation studies.
Energies 10 00041 g010
Figure 11. Voltage profile of the LVDC system under voltage control methods (Case 1). (a) with AC/DC converter control; (b) with distributed energy resource control after AC/DC converter control.
Energies 10 00041 g011
Figure 12. Voltage profile of the LVDC system under voltage control method (Case 2). (a) with AC/DC converter control; (b) with distributed energy resource control after AC/DC converter control.
Energies 10 00041 g012
Figure 13. Power injection of the selected DER comparing the conventional and proposed methods.
Energies 10 00041 g013
Table 1. Line parameters of the test LVDC distribution system shown in Figure 10.
From BusTo BusCase 1Case 2
DistanceResistanceDistanceResistance
kmΩp.u. 1kmΩp.u.
120.2570.16090.00720.2570.16090.0072
230.7350.46010.02040.7350.46010.0204
340.080.05010.00220.3570.22350.0099
450.050.03130.00140.1500.09390.0042
560.050.03130.00140.1500.09390.0042
670.050.03130.00140.1500.09390.0042
780.060.03760.00170.2650.16590.0074
890.6030.37750.01680.6030.37750.0168
Notes: 1 Resistance in p.u.: The p.u. values of line resistances are calculated based on the following base values—Rbase = 22.5 Ω where Vbase = 1500 V, Pbase = 100 kW.
Table 2. Three loading conditions (L0, L1 and L2) for case studies (Unit: kW).
LoadCase 1Case 2
Bus L0L1L2L0L1L2
1------
2101616101616
3153545153545
4335102525
5446122727
6557142929
7668163131
8304070102035
93545100102035
Total10815425797203243
Table 3. The results of voltage profiles for case 1 (Unit: per unit).
Bus No.L0L1L2Conventional MethodProposed Method
AC/DC Converter Control during L1DERs Control during L2AC/DC Converter Control during L1DERs Control during L2
11.00001.00001.05001.028671.05001.0069621.0500
20.99200.98851.03101.01701.03200.99551.0310
30.97120.95880.97960.98870.98190.96600.9816
40.96930.95640.97500.98640.97750.96360.9772
50.96810.95490.97230.98490.97490.96220.9745
60.96710.95350.96960.98360.97230.96080.9719
70.96600.95210.96700.98230.96980.95950.9694
80.96490.95060.96400.98080.96700.95800.9666
90.95880.94260.94630.97310.95060.95000.9500
Table 4. The computation results of case 1 for distributed energy resource control in the proposed and conventional methods during heavier loading condition (L2).
Voltage Sensitivity FactorsProposed MethodConventional Method
Result with Virtual BusErrorResult without Virtual BusErrorResultError
V S F 92 0.0077670%0.0076930.953%0.007157.944%
V S F 93 0.031520.022%0.031220.974%0.0276012.45%
V S F 98 0.041240.012%0.040880.885%0.0356713.52%
V S F 99 0.060880.013%0.060510.621%0.0524513.87%
Table 5. The results of voltage profile for case 2 (Unit: per unit).
Bus No.L0L1L2Conventional MethodProposed Method
AC/DC Converter Control during L1DER Control during L2AC/DC Converter Control during L1DER Control during L2
11.00001.00001.05001.04721.05001.04041.0500
20.99280.98431.03201.03201.03401.02501.0330
30.97440.94280.98330.99300.98980.98580.9889
40.96690.92630.96420.97740.97300.97000.9719
50.96420.92050.95730.97190.96710.96450.9658
60.96210.91590.95150.96760.96230.96010.9608
70.96050.91260.94710.96450.95870.95700.9572
80.95900.90940.94160.96140.95480.95390.9531
90.95720.90570.93530.95790.95220.95040.9500
Table 6. The computation results for case 2 for DER control in the proposed and conventional methods during heavier loading condition (L2).
VSFProposed MethodConventional Method
Result with Virtual BusErrorResult without Virtual BusErrorResultError
V S F 92 0.007860.03%0.0074165.67%0.007159.06%
V S F 93 0.031810.04%0.030025.66%0.0276013.27%
V S F 98 0.067770.12%0.064784.52%0.0574215.36%
V S F 99 0.085750.52%0.081714.22%0.0742013.02%

