Article

Low-Carbon Energy Development in Indonesia in Alignment with Intended Nationally Determined Contribution (INDC) by 2030

by
Ucok W.R. Siagian
1,
Bintang B. Yuwono
1,
Shinichiro Fujimori
2,3,* and
Toshihiko Masui
2
1
Center for Research on Energy Policy, Institut Teknologi Bandung, Jalan Ganesha 10, Bandung 40132, Indonesia
2
National Institute for Environmental Studies, 16-2 Onogawa, Tsukuba 305-8506, Ibaraki, Japan
3
International Institute for Applied Systems Analysis (IIASA), Laxenburg A-2361, Austria
*
Author to whom correspondence should be addressed.
Energies 2017, 10(1), 52; https://doi.org/10.3390/en10010052
Submission received: 29 September 2016 / Revised: 26 December 2016 / Accepted: 27 December 2016 / Published: 5 January 2017
(This article belongs to the Special Issue Low Carbon Economy)

Abstract

:
This study analyzed the role of low-carbon energy technologies in reducing the greenhouse gas emissions of Indonesia’s energy sector by 2030. The aim of this study was to provide insights into the Indonesian government’s approach to developing a strategy and plan for mitigating emissions and achieving Indonesia’s emission reduction targets by 2030, as pledged in the country’s Intended Nationally Determined Contribution. The Asia-Pacific Integrated Model/Computable General Equilibrium (AIM/CGE) model was used to quantify three scenarios that had the same socioeconomic assumptions: baseline, countermeasure (CM)1, and CM2, which had a higher emission reduction target than that of CM1. Results of the study showed that an Indonesian low-carbon energy system could be achieved with two pillars, namely, energy efficiency measures and deployment of less carbon-intensive energy systems (i.e., the use of renewable energy in the power and transport sectors, and the use of natural gas in the power sector and in transport). Emission reductions would also be satisfied through the electrification of end-user consumption where the electricity supply becomes decarbonized by deploying renewables for power generation. Under CM1, Indonesia could achieve a 15.5% emission reduction target (compared to the baseline scenario). This reduction could be achieved using efficiency measures that reduce final energy demand by 4%; This would require the deployment of geothermal power plants at a rate six times greater than the baseline scenario and four times the use of hydropower than that used in the baseline scenario. Greater carbon reductions (CM2; i.e., a 27% reduction) could be achieved with similar measures to CM1 but with more intensive penetration. Final energy demand would need to be cut by 13%, deployment of geothermal power plants would need to be seven times greater than at baseline, and hydropower use would need to be five times greater than the baseline case. Carbon prices under CM1 and CM2 were US$16 and US$63 (2005)/tCO2, respectively. The mitigation scenarios for 2030 both had a small positive effect on gross domestic product (GDP) compared to the baseline scenario (0.6% and 0.3% for CM1 and CM2, respectively). This is mainly due to the combination of two assumptions. The first is that there would be a great increase in coal-fired power in the baseline scenario. The other assumption is that there is low productivity in coal-related industries. Eventually, when factors such as capital and labor shift from coal-related industries to other low-carbon-emitting sectors in the CM cases are put in place, the total productivity of the economy would offset low-carbon investment.

1. Introduction

In an attempt to contribute to the global endeavor of limiting the increase in global average temperatures by the middle of the century to 2 °C, Indonesia has pledged to pursue development using a low-carbon approach. In its Intended Nationally Determined Contribution (INDC), Indonesia pledged unconditionally to reduce its emissions to 29% below its business-as-usual emission levels by 2030. With international support, this reduction could be as great as 42% (conditional pledge). As the second largest greenhouse gas (GHG)-emitting sector in the country, the energy sector is expected to contribute significantly to Indonesia’s emission reductions. For its unconditional pledge, the energy sector’s emission reductions are targeted to be 17.5% below the baseline energy sector emission level by 2030. Under the conditional pledge, the reduction could be up to 32.7%. The magnitude of these emission reductions is 253 MtCO2e (million ton of CO2 equivalent) /year (unconditional) and 472 MtCO2e/year (conditional) in 2030.
Indonesia has various energy sector mitigation options that could achieve this reduction, namely efficiency measures, deployment of renewable energy, and the use of nuclear power and clean coal technology (including carbon capture and storage, CCS). These options can be aggregated and considered part of a low-carbon-energy-system strategy. Energy development using these mitigation options involves costs that are generally higher than costs under the business-as-usual scenario (without mitigation actions). In a country with limited wealth, the economic impact of mitigation actions is an important factor in selecting and eventually implementing these options.
Several studies have discussed future options for the Indonesian energy system. Hasan et al. [1] comprehensively reviewed energy scenarios for Indonesia. Jupesta [2] projected biofuel production until 2025 using a linear programing model and concluded that progress in biofuel technology through research and development (R&D) and scaling up would support a biofuel transition. Although the main focus of that study was biofuel, several energy system options were modeled. Another study, which focused not only on Indonesia but also on the ASEAN (Association of Southeast Asian Nations) region, attempted to clarify the implications of low-carbon power technology options [3] using the MARKAL (MARKet and ALlocation) model. Their conclusion was that low-carbon technologies bring multiple benefits, such as a reduction in the primary energy supply as well as reductions in CO2 emissions and air pollutants. Another study that used MARKAL-ANSWER which is (a user friendly Windows interface with a gentle learning curve) presented projections of Indonesia’s energy system in 2050 [4]. There are also several publications discussing long-term climate policies for the country [5,6]. While several studies have addressed Indonesia’s future energy scenarios, there have been no attempts to assess its Intended Nationally Determined Contributions (INDCs).
Given this background, our study analyzed the potential role of a low-carbon energy system in reducing energy sector emissions by 2030. For comparison, the emission reduction target of Indonesia, as pledged in its INDC, is used as a reference. Besides technical potential, this study also analyzes the mitigation costs and economic impact of various mitigation actions. The indicators that we analyzed included type of low-carbon energy system, energy supply/demand development, GHG emission trajectory, emission reductions, and the economic impact of the mitigation actions. To achieve the objectives of this study, we used the Asia-Pacific Integrated Model/Computable General Equilibrium (AIM/CGE) model to assess three energy development scenarios (baseline and two mitigation scenarios). There are two reasons why we chose AIM/CGE. One is that AIM/CGE has many applications in national-level climate policy assessment. The other is that CGE is suitable to identify and assess the economic implication of policies. Although CGE models are not able to produce technology-rich outcomes as bottom-up-type engineering models can, this study would benefit from the use of CGE. This paper is arranged in six sections. The first is the introductory section. Section 2 describes Indonesia’s national circumstances. Section 3 describes the methodology and the design of the mitigation scenarios. Section 4 presents the modeling results. Section 5 presents a discussion of the modeling results. The main findings of this study are presented in the paper’s conclusion, Section 6.

2. National Energy Circumstances and Related CO2 Emissions

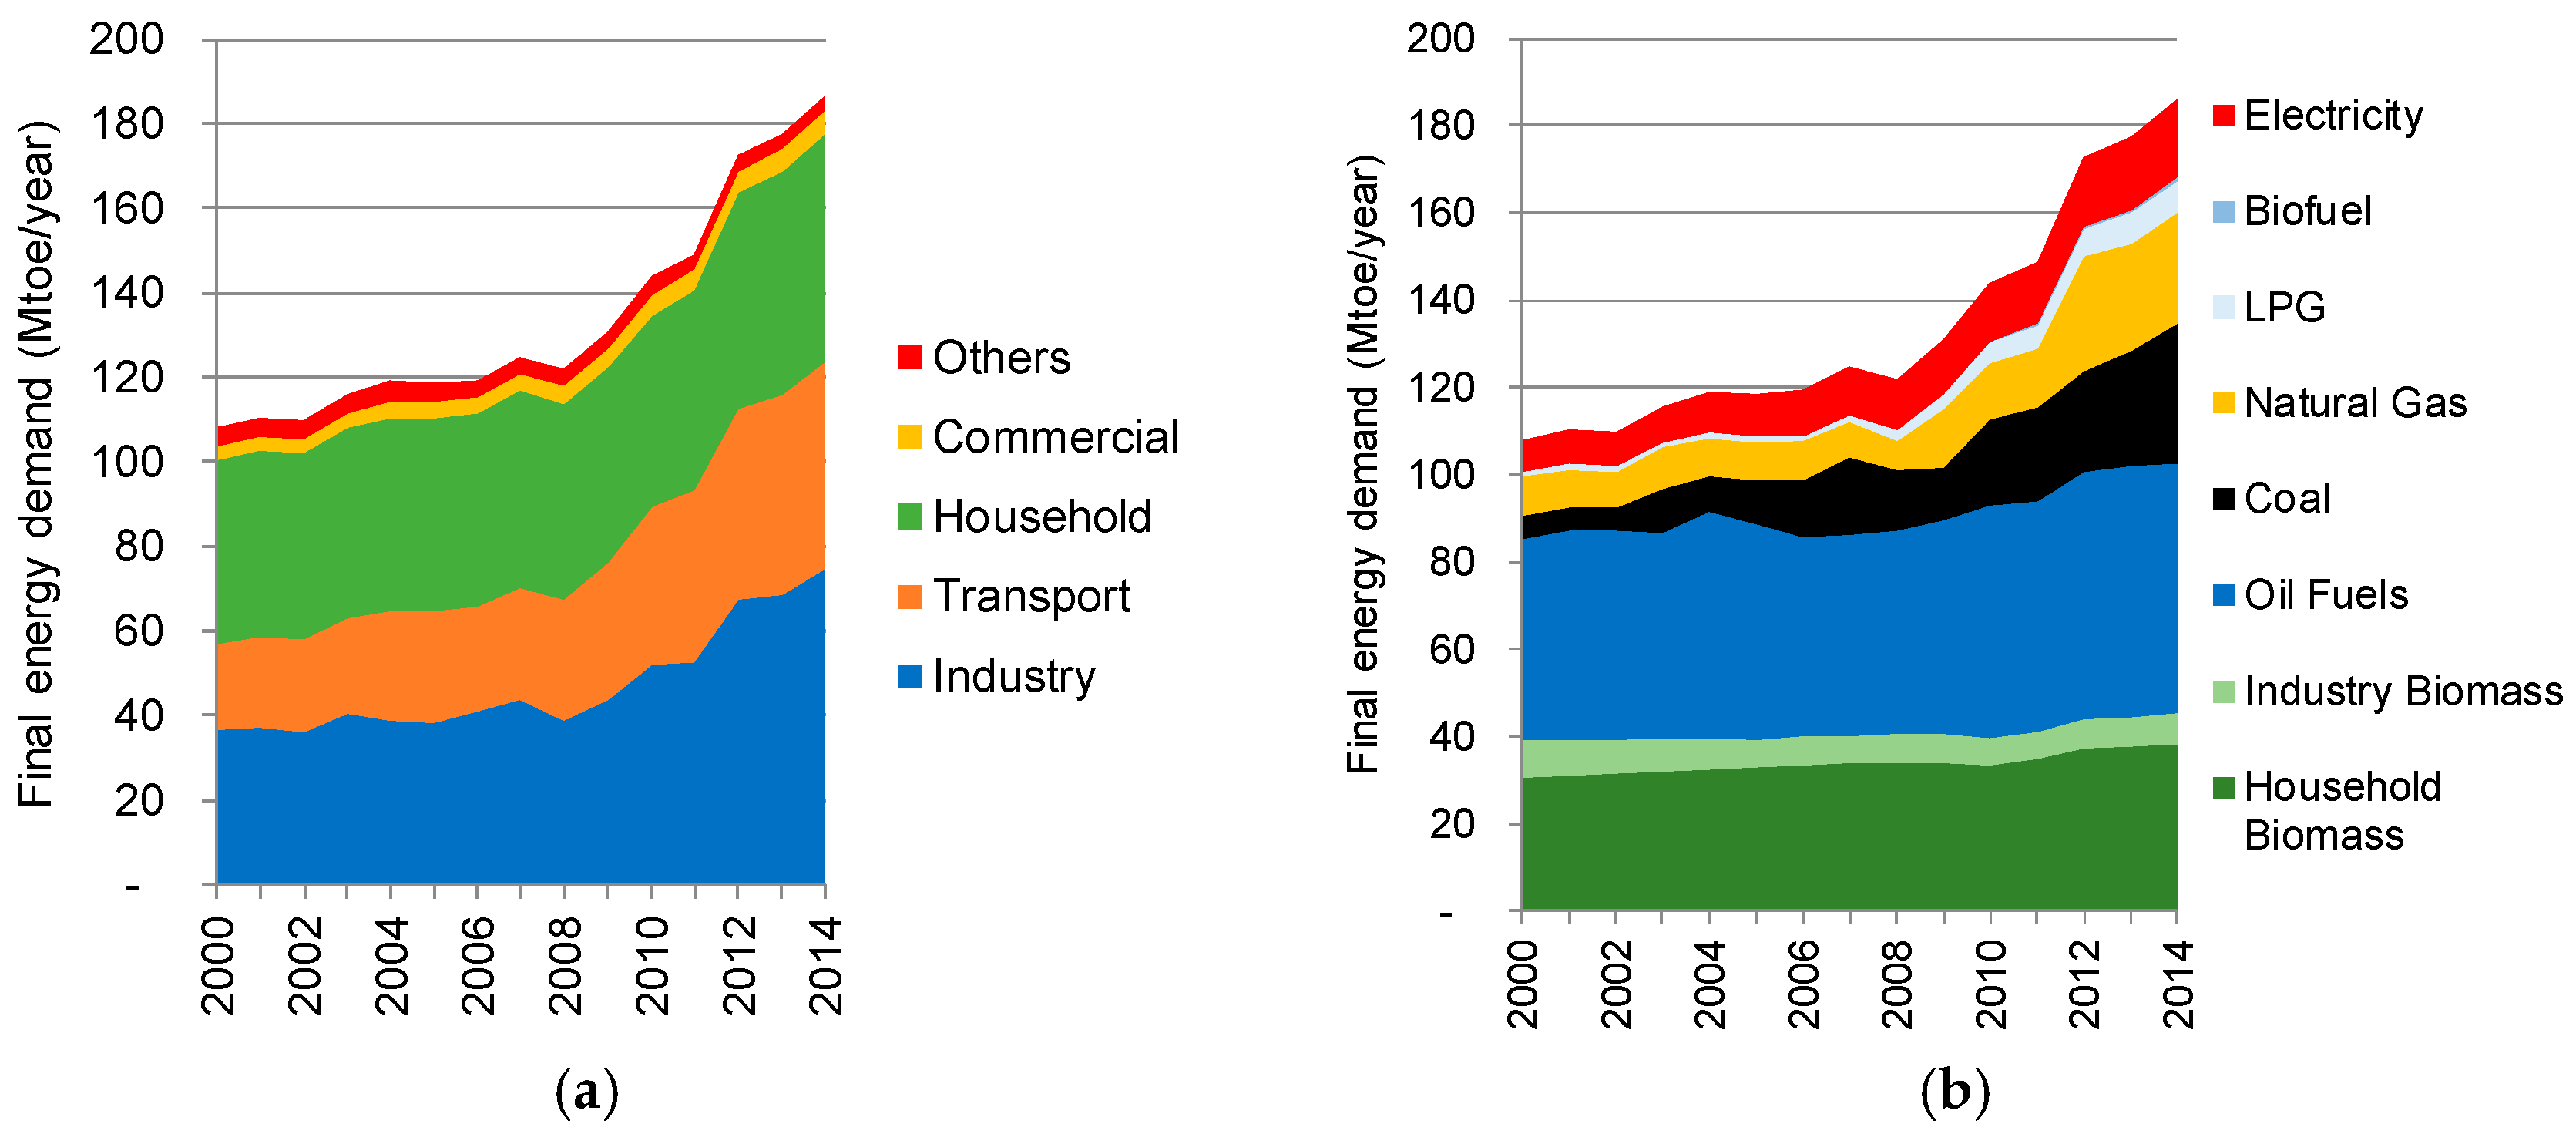
2.1. Energy Resources and Trends

Indonesia is endowed with a wide range of energy resources (Table 1). Oil, gas, and coal have been intensively exploited to meet domestic and export demands. Besides fueling the country’s economic activity, energy resource exploitation also generates government revenues from sales to domestic and export markets, through royalties and taxes. Currently, the use of renewable resources is limited because oil, fuel, and electricity have been heavily subsidized; renewable energy prices cannot compete with subsidized fossil-fuel energy.
Energy consumption has grown with economic and population growth. Between 2000 and 2013, the total energy demand grew, on average, by 3.6% annually, from 104 million tons oil equivalent (Mtoe) to 164 Mtoe (Figure 1). The industrial, residential, and transport sectors dominate total energy consumption (Figure 1a). By fuel type, Indonesian energy demand is still dominated by oil (Figure 1b).
Approximately 10% of Indonesia’s total energy consumption is in the form of electricity, and different types of power plants (i.e., coal, gas, hydropower, geothermal, and oil fuels) meet this demand (Figure 2). Coal and gas power plants dominate electricity generation in the country. Between 2000 and 2013, the primary energy supply grew at a rate of 3.8% per year, from 145 to 236 Mtoe (Figure 2). The primary energy supply is dominated by oil, followed by coal and natural gas.
With respect to energy intensity, Indonesia is a low-energy-intensity country. In the year 2014, Indonesia’s energy intensity was 0.09 tons oil equivalent (toe)/US$1000 output, which was lower than that of India (0.119 toe/US$1000), Malaysia (0.125 toe/US$1000), and Thailand (0.135 toe/US$1000; see Figure S1). The low energy intensity of Indonesia does not, however, necessarily reflect Indonesia’s energy efficiency. It may be interpreted that the Indonesian economy is not dependent on energy-intensive industries, but rather consists of traditional agriculture, extractive industries (mineral and energy mining as well as oil and gas) and supports a services-oriented economy. The fact that Indonesia’s per capita annual energy and electricity consumption levels are still low, at 850 kgoe/cap and 787 kWh/cap, respectively, corroborates this interpretation. The per capita energy and electricity consumption levels of Indonesia compared with those of other countries are shown in Figures S2 and S3, respectively. As a developing country, Indonesia’s energy consumption will continue to grow. It is expected that Indonesia’s energy growth will proceed along a low-carbon path.

2.2. Greenhouse Gas (GHG) Emissions

In 2012, energy-producing activities emitted approximately 508 million tons CO2e and were the second largest contributors after land use and land-use change as well as forestry (LULUCF) and peat fires, which together emitted 698 million tons of CO2e. Energy sector emissions came primarily from electricity generation (34%), industry (27%), and transport (26%). The remaining 13% was accounted for by residential and commercial sectors and fugitive emissions from oil and gas production.
In 2009, Indonesia’s president announced a non-binding pledge to reduce the country’s emissions to 26% below its baseline emissions by 2020 through the use of domestic funding. The pledge also promised that, with international support, these emission reductions could be increased to 41%. In absolute terms, the 26% reduction target corresponds to an emission reduction of 767 MtCO2e. To achieve the reduction targets, Indonesia has converted the pledge into a National Mitigation Action Plan (known as RAN GRK [9]). In this plan, a large part of the reduction is expected to come through mitigation actions within the forestry sector. Mitigation actions within the energy sector are expected to reduce emissions by 38 MtCO2e below 2020 levels.

3. Methodology

3.1. Model

We used the Asia-Pacific Integrated Model/Computable General Equilibrium (AIM/CGE) model for this study, which has been widely used in global assessments of climate change mitigation and adaptation policies [10,11,12,13,14,15]. It is a recursive–dynamic general equilibrium model. Industry is classified into 42 segments (shown in the Supplementary Materials). Details of the model structure and mathematical formulas have been described by Fujimori et al. [16]. The model is specified and solved as a pure mixed complementary problem (MCP). There is a national version of this model, which was used for this study [17,18,19,20,21].
As in most energy-technology-rich CGE models, parameters such as population, gross domestic product (GDP), energy service demand, extraction costs of fossil fuels, and availability and cost of renewable energy are exogenously input into the model. Model outputs include energy demand and supply structure, GHG emissions, and costs of energy and carbon emissions. More specifically, the production sectors are assumed to maximize profits subject to multi-nested constant elasticity substitution (CES) functions and relative prices of inputs. Household expenditures on each commodity are described by a linear expenditure system (LES) function. Savings are the source for domestic and foreign direct investment. They are exogenously input as a proportion of GDP change relative to the base year. To balance the saving account, the saving rate is treated as an endogenous variable. Moreover, the capital formation of each good is determined by a fixed coefficient of total investment. The Armington assumption is used for international trade, and we assume the current account to be balanced. In addition to energy-related CO2 emissions, CO2 from other sources, CH4, and N2O (including changes resulting from land use and non-energy-related emissions) are also taken into consideration.
The constraint on GHG emissions is specified based on the mitigation target. Once the emission constraint is added, the carbon tax becomes a complementary variable to the emission constraint and determines the marginal mitigation cost. In an emission-constrained scenario, the carbon tax increases the price of fossil-fuel-consuming goods, which results in energy savings and substitution of fossil fuels with lower-emission-energy sources. The carbon tax also acts as an incentive to reduce non-energy-related emissions. GHGs other than CO2 are weighted by their global warming potential and summed to estimate total GHG emissions in terms of CO2 equivalents. Households are assumed to receive revenue from the carbon tax. In the case of the power sector, fired power plants have the option of using CCS. We assume maximum annual penetration rates for CCS technology. The maximum annual penetration rate is differentiated across the penetration stages. More specifically, in the early stage, newly introduced installations are limited (if the share of CCS is under 10%, 2% per annum is the maximum), but as the technology matures, the penetration speed increases (if the share of CCS is over 10%, 4% per annum is the maximum).
The costs of wind and solar technologies are assumed to be aligned with the International Energy Agency (IEA) energy technology perspective report [22]. We changed the input coefficients in the corresponding production function. Because the output prices of these technologies are endogenously determined, they are not exactly the same as those reported by the IEA [22]; However, they are close enough.
The model used in this study assumes profit maximization in industrial activities and utility maximization in the household sector. This is sometimes unrealistic. Furthermore, a single carbon price is assumed with a single carbon market in a country. The implementation of carbon pricing (or a carbon tax) results in the lowest cost CO2 emission reductions. In the meantime, such policies may not be the priority. Eventually, the real cost of emission reductions may be larger than shown in this study.

3.2. Scenarios

3.2.1. Scenario Frameworks, Socioeconomic Assumptions, and Emission Targets

To investigate the pathways to achieve Indonesia’s INDC target and to investigate the possibility of achieving greater emission reductions, we developed three models: baseline, countermeasure 1 (CM1), and countermeasure 2. Business-as-usual (BAU) depicts future Indonesian energy and emission trajectories where the development of the country continues on its present trajectory, without climate change mitigation actions. The achievement of emission reductions by mitigation actions is measured under the baseline scenario. CM1 is the scenario whereby Indonesia’s development is linked with achieving its INDC target (i.e., a 29% reduction by 2030). CM2 is the development scenario that targets greater emission reductions.
The main inputs of the model are the social accounting matrix (SAM), historical trends, driving forces of the economy, population growth, technical constraints, and emission constraints. The assumed growth of the economy (GDP) and the population are 5% and 1.1%, respectively. The fuel share of the power sector is assumed to follow a utility expansion plan [23]. The emission reduction targets by 2030 for CM1 and CM2 are, respectively, 250 and 470 MtCO2e.

3.2.2. Power Generation Assumptions

As previously discussed, the major contributor to Indonesia’s GHG emissions within the energy sector is the power sector. Therefore, the core of our scenario setting is very closely related to the scenarios for the power sector. Deploying renewables to substitute for fossil fuels, particularly coal, would constitute mitigation in the power sector. It is likely that emission reductions will depend on the share of renewables in the power-generation mix. The shares of power generation by fuel type for the three scenarios are presented in Table 2. The renewable energy in this study was exogenously determined based on the government’s power plan. However, given the recent rapid increase in wind and solar power generation, the assumptions for solar and wind may be too pessimistic for the 2030 vision. Since this study’s purpose is to evaluate current national policy, we maintained the current framework. However, more optimistic penetration in solar and wind would contribute to efforts at reducing emissions.

3.2.3. Energy Demand Assumptions

Energy demand is mainly altered by three factors. First, GDP growth can increase each industry’s output. Second, price-driven energy efficiency improvement is formulated as a production function that allows energy and capital substitution. Third, non-price-driven energy improvement is assumed. This is the so-called AEEI (autonomous energy efficiency improvement) and we assumed a 1.25% negative number to reproduce governmental energy demand projections. Although this value diverges from normal CGE studies, we applied it to assess national policy appropriately. The values of the demand characteristic are captured from SAM and the energy database from the base year (2005).

4. Results

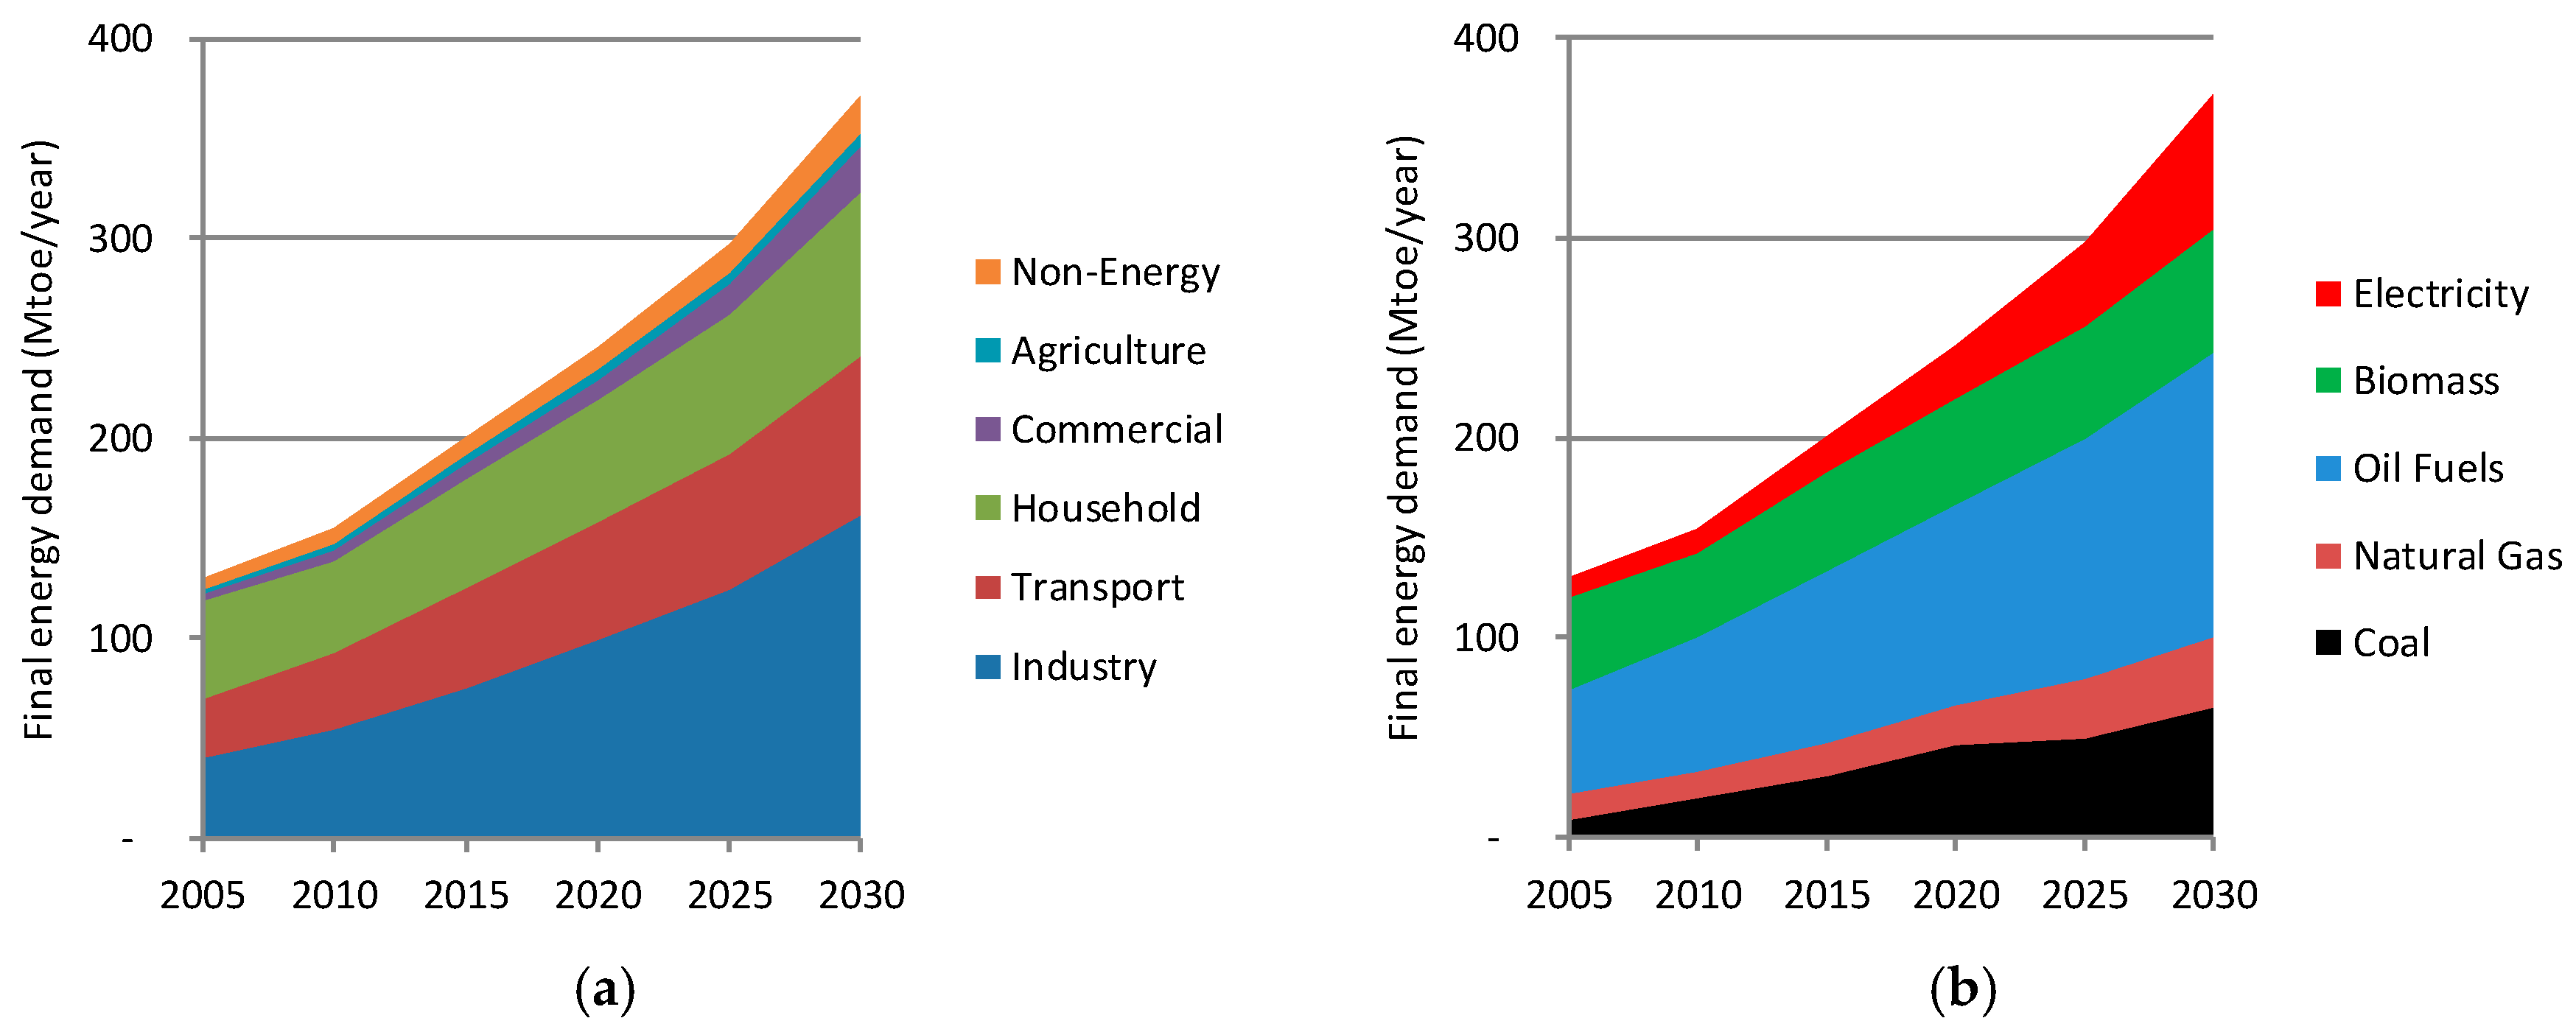
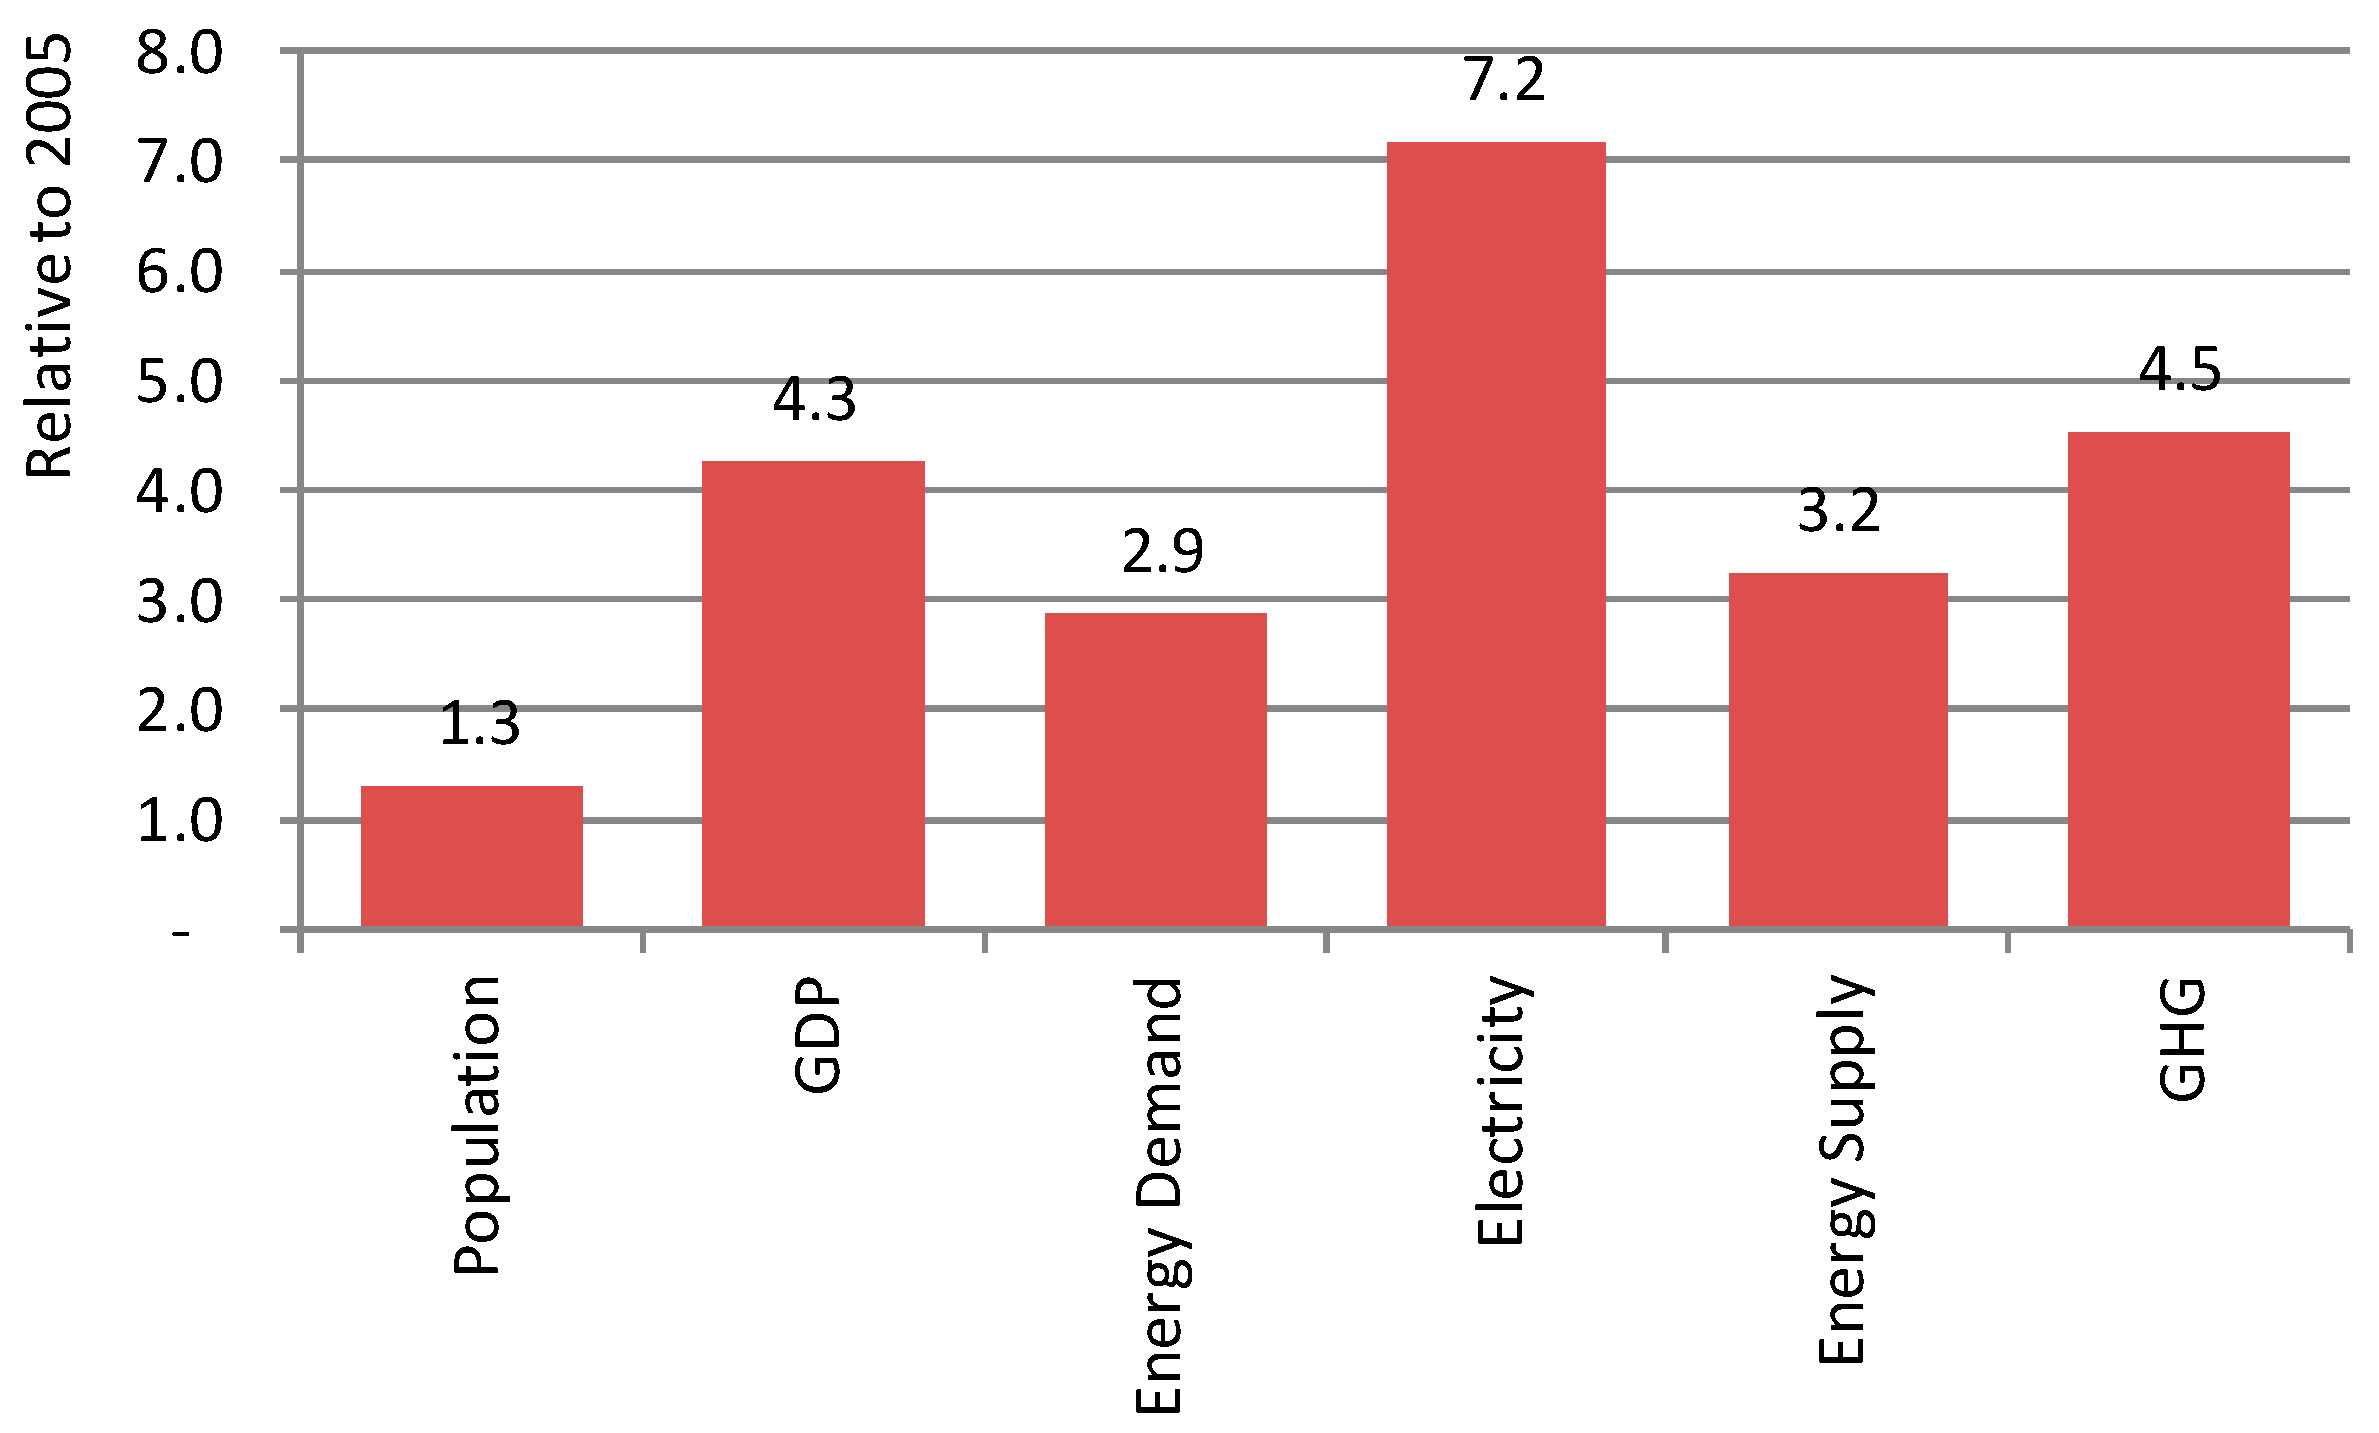
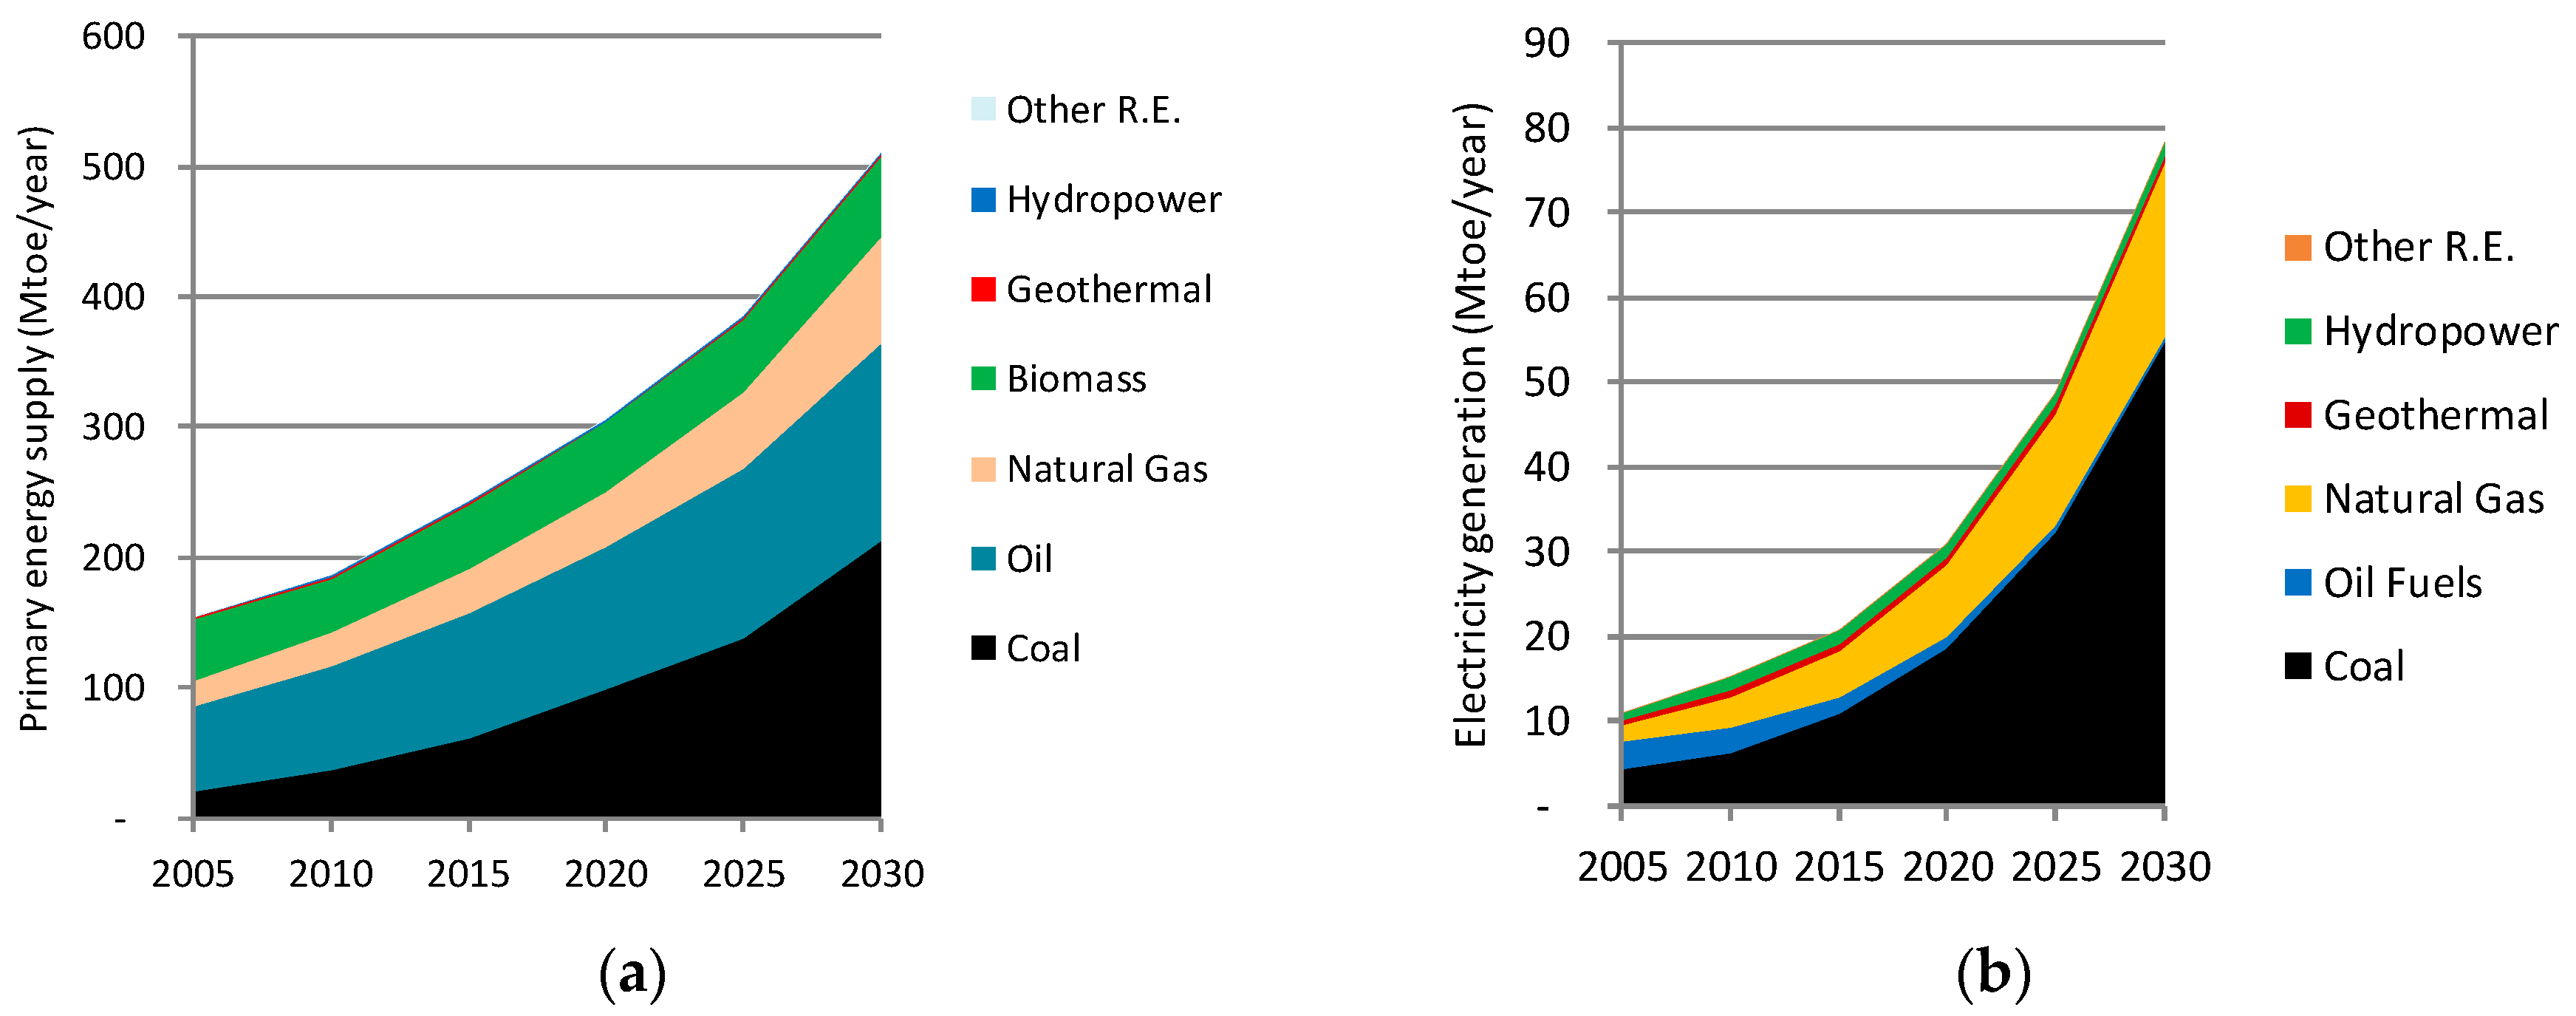
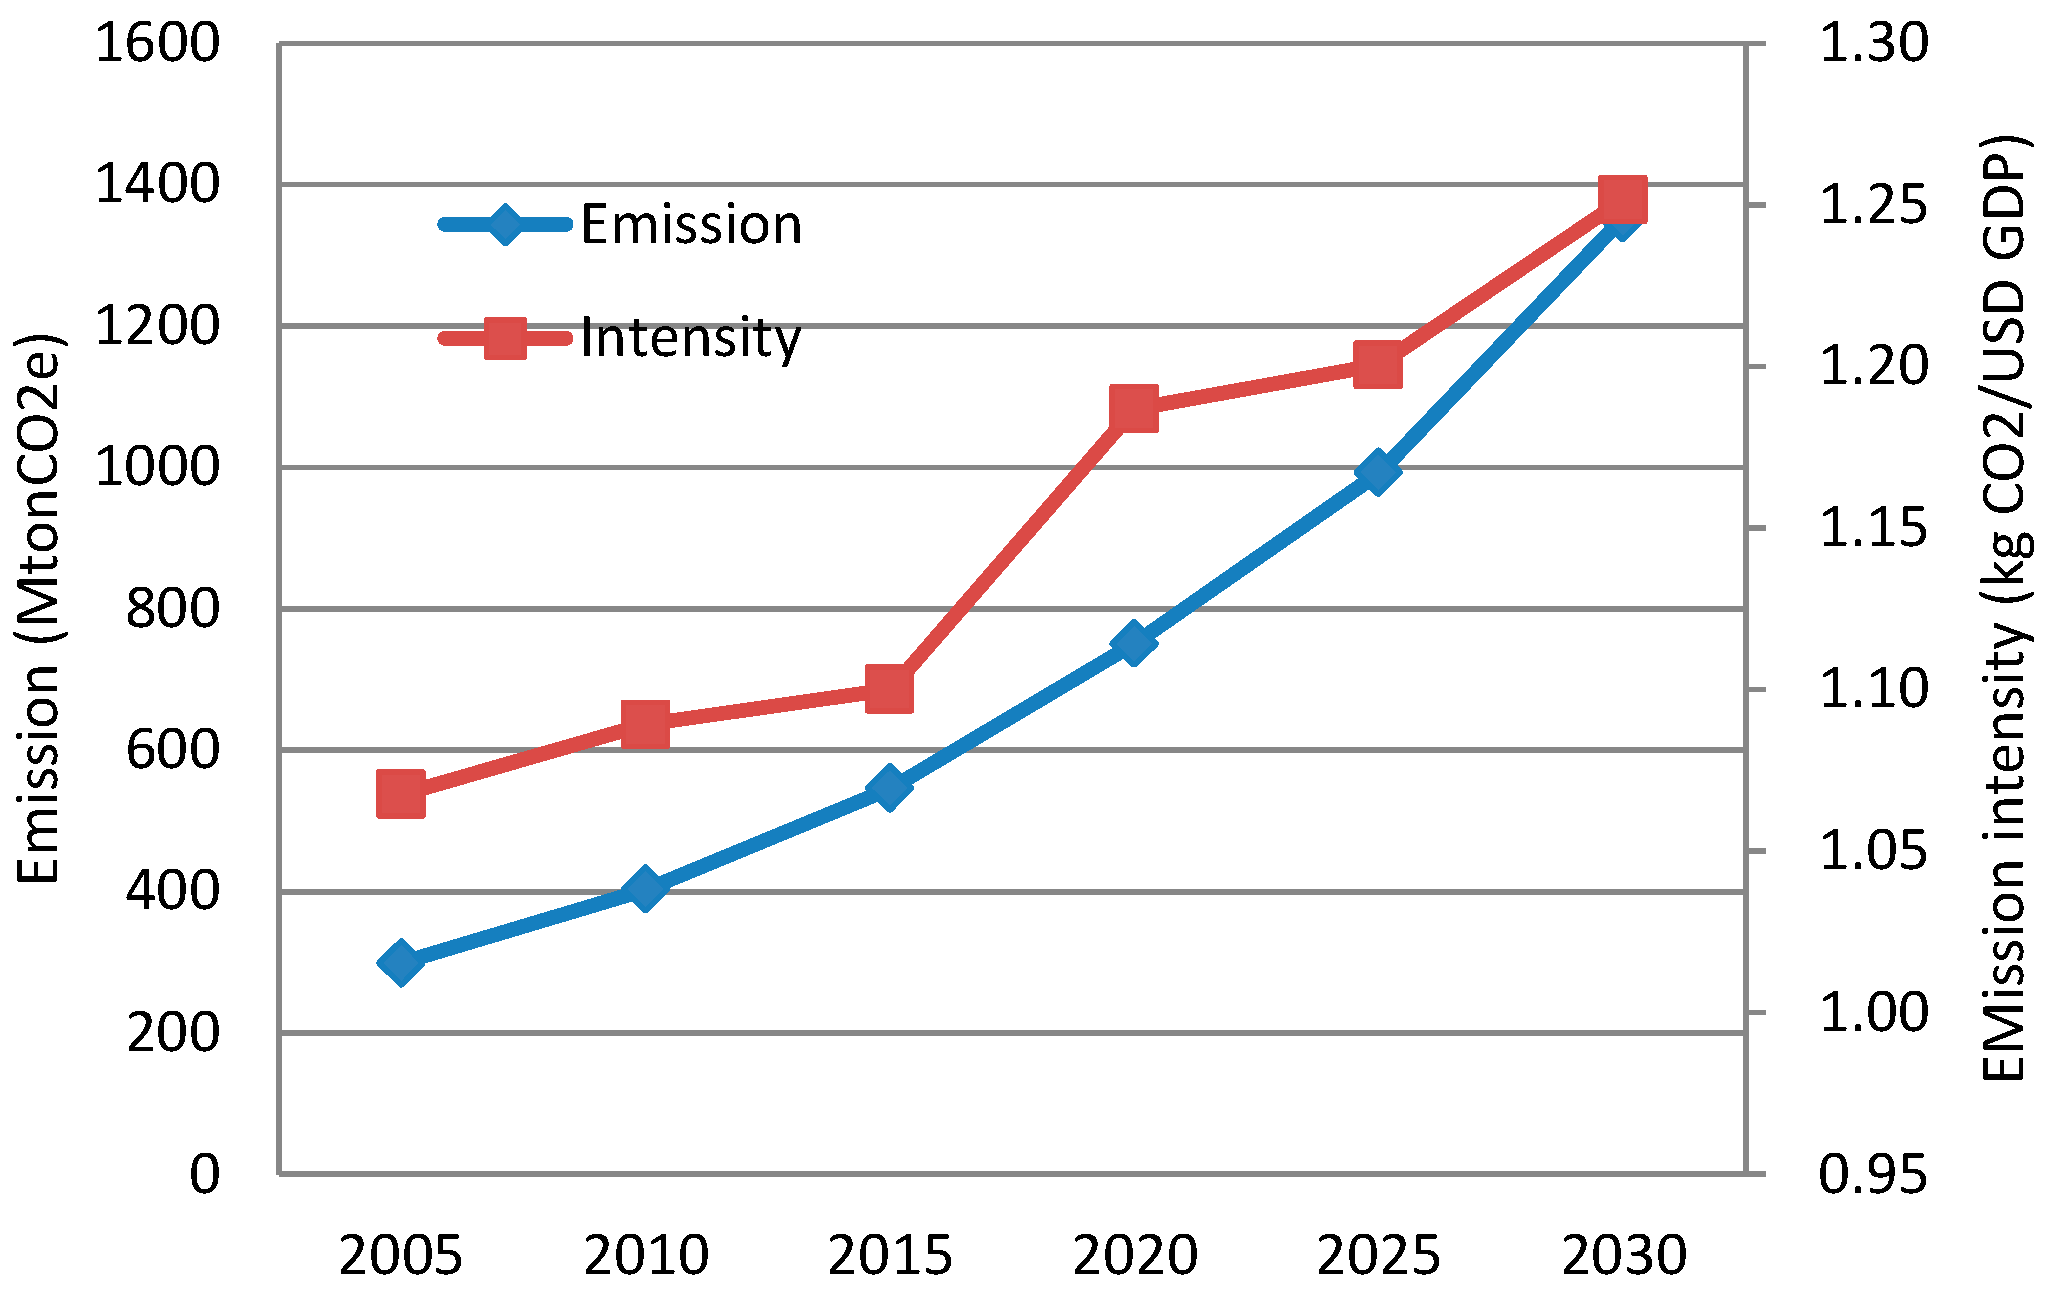
4.1. The Baseline Scenario (Baseline)

Our 2030 comparison of socio-economic, energy, and GHG emission-related factors under the baseline scenario is summarized in Figure 3. Over the period 2005–2030, the Indonesian population is projected to increase 1.3 times, while GDP is projected to increase 4.3 times. Over the same period, energy demand is expected to increase 2.9 times, while energy supply is expected to increase 3.2 times. Owing to an expansion in the power-supply infrastructure and increased wealth, energy demand in the form of electricity is projected to increase significantly. Specifically, from 2005 to 2030, electricity demand is expected to increase by 7.2 times. The increase in energy demand and supply and the types of fuels used in the energy system will result in a 4.5-fold increase in GHG emissions.
The projected final energy demands under the baseline scenario are shown in Figure 4a (by sector) and Figure 4b (by fuel type). As expected in developing countries, the fastest growing energy consumers will be the industry and transport sectors, which are projected to grow by 5.4% and 5% per year, respectively. By 2030, these two sectors will account for 70% of the total energy demand. By fuel type, high demand growth is expected to occur in coal and electricity, which are expected to grow by 7.9% and 6.5% per year, respectively. Despite lower growth (compared to coal and electricity), oil fuels will remain the dominant source of energy in Indonesia. The share of oil fuels in terms of total energy demand will be around 45% in 2030. The shares of coal and electricity in terms of total energy demand are projected to increase from 7% in 2005 to 17% in 2030, and from 7% in 2005 to 13% in 2030, respectively.
The projected development of primary energy in the baseline scenario is shown in Figure 5a. Supply growth is expected to be high in coal and natural gas, which are expected to increase by 8.7% and 5.5% per year, respectively. Despite lower growth (compared to coal and gas), the share of oil in the primary energy supply will remain high. By 2030, the share of oil in the primary energy mix is projected to be 36%. The growth of renewable energy development is projected to remain low. By 2030, the share of all hydro, geothermal, wind, and solar energies combined, in terms of total primary energy, will be less than 2%. Biomass use (in rural residential areas), however, is expected to remain significant. In 2030, the share of biomass in the total primary energy supply will be around 11%.
During the period 2005–2030, electricity supply under the baseline scenario is projected to increase 7.2 times, from 11 Mtoe (127 TWh) in 2005 to 78 Mtoe (910 TWh) in 2030. Figure 5b shows the projected Indonesian electricity supply in this baseline scenario. One can see from the figure that Indonesia’s future electricity generation is expected to rely on coal and natural gas power plants. From 2005 to 2030, the provision from coal and gas plants is projected to grow rapidly, by 11% and 10% per year, on average, respectively. By 2030, the share of coal and gas in the power supply mix will reach 70% and 26%, respectively. Oil fuels will no longer be used for power generation. The share of renewables in the future will remain the same. By 2030, the share of all renewables (hydro, geothermal, wind, and solar) is likely to reach only 4%.
With the progress of socio-economic conditions, and the associated energy development, GHG emissions from energy-intensive activities in Indonesia are projected to increase (see Figure 6). In the baseline scenario, energy-sector GHG emissions are projected to grow, on average, by 6.2% per year, from 311 MtCO2e in 2005 to 1409 MtCO2e in 2030. In terms of emission intensity, Indonesia’s GHG emissions are projected to increase from 1.11 kgCO2/USD (US dollar) GDP in 2005 to 1.25 kgCO2/USD GDP in 2030. The increase in emission intensity indicates that, in the baseline scenario, Indonesia’s energy system is likely to become more carbon-intensive. The average growth of emissions is projected to be approximately 6.2% per year, which is higher than the average growth of GDP (5.5%). This also indicates that Indonesia’s energy system is becoming more carbon-intensive.

4.2. Mitigation Scenarios

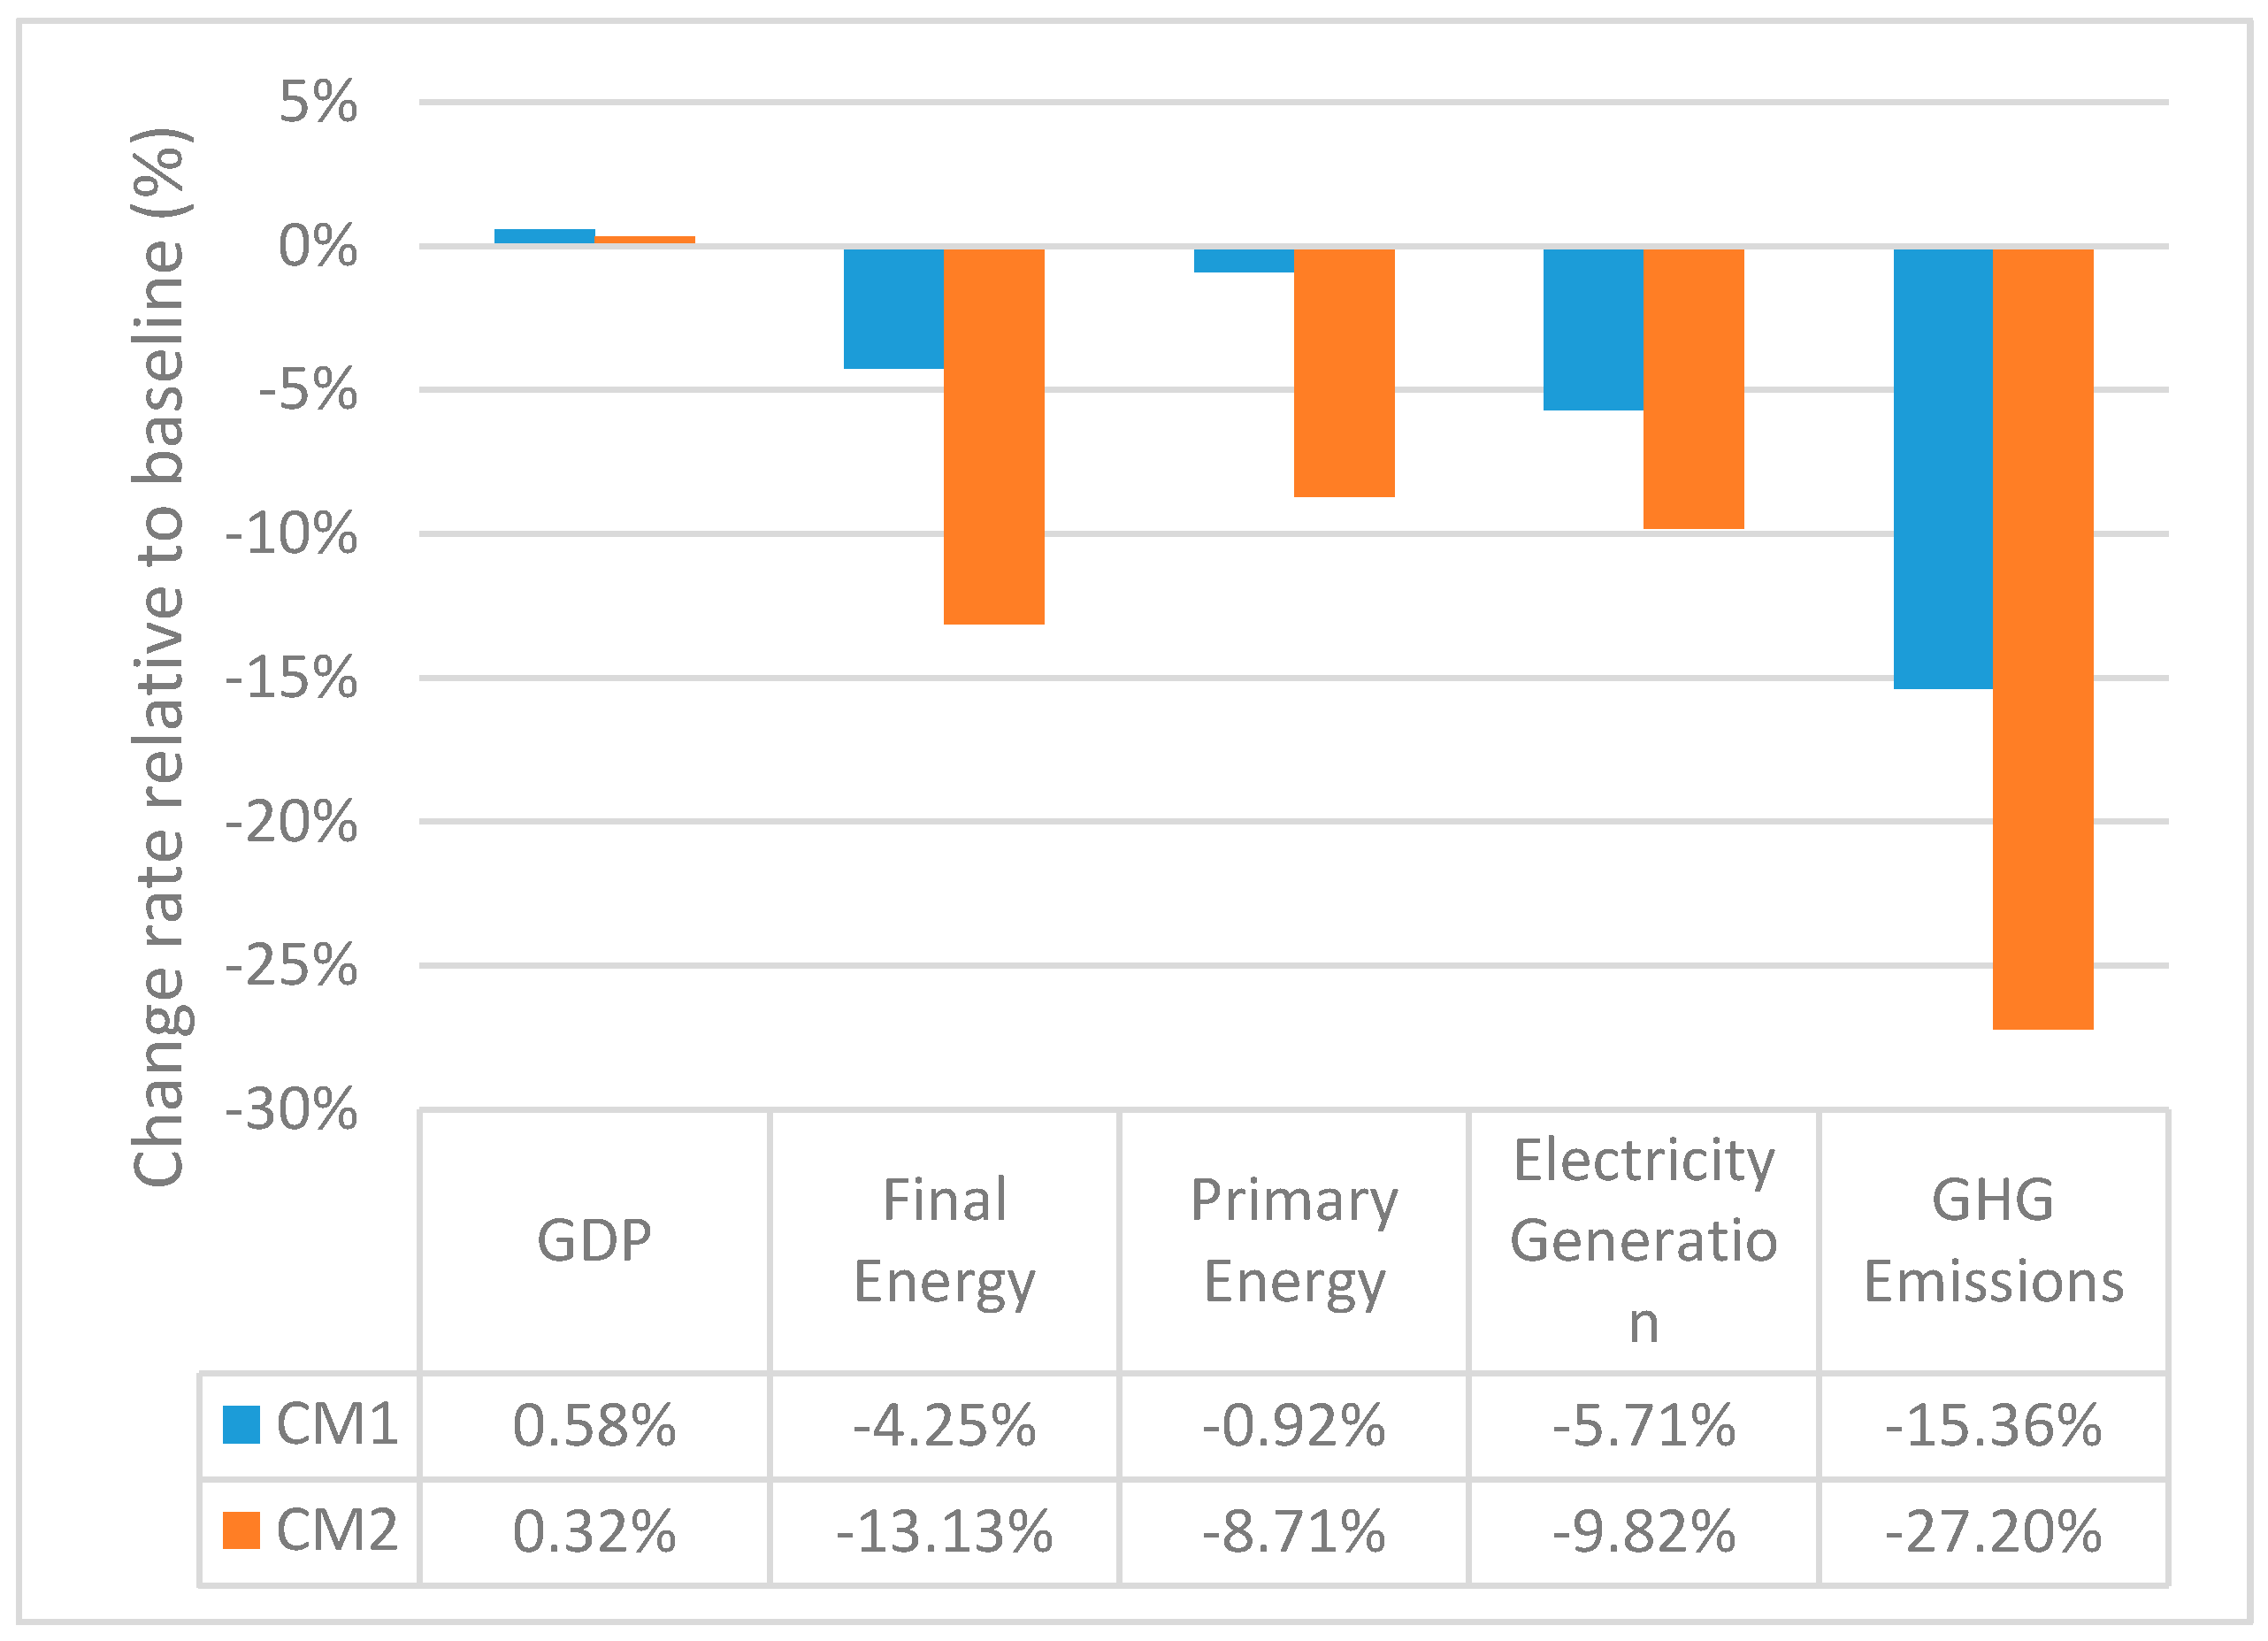
4.2.1. Overall Results
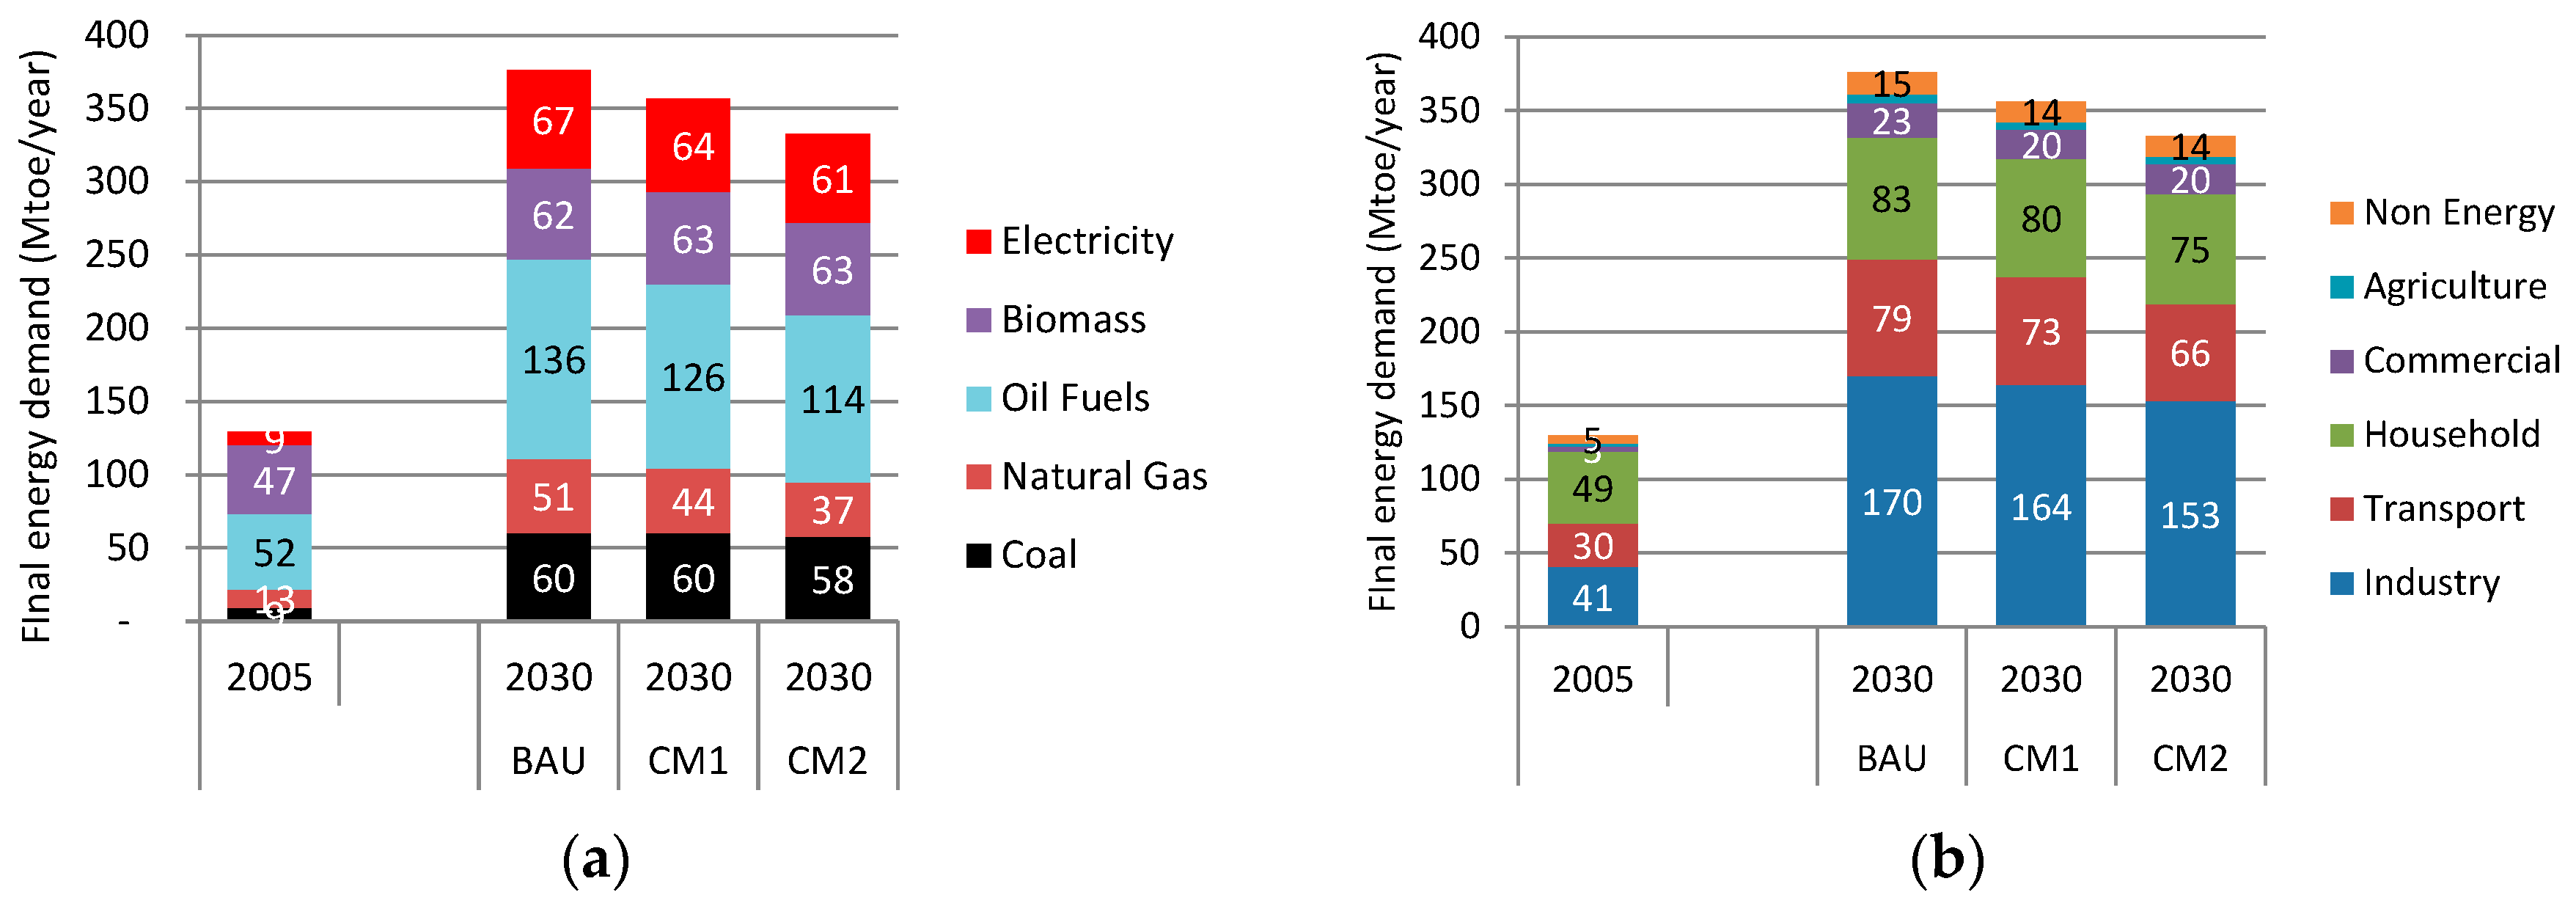
Based on the mitigation scenarios described in this study, CM1 and CM2 both result in GHG emission reductions. The general outcomes of the mitigation scenarios in terms of change with respect to values in the baseline scenario (baseline) in 2030 are summarized in Figure 7. The GDP changes are positive: 0.6% and 0.3% for CM1 and CM2, respectively. This is counterintuitive because emission reductions usually generate negative impacts on the macroeconomy. This point is discussed later. Total energy and primary energy both decrease from the baseline year. The larger the emission reductions, the larger the energy demand and supply. For example, primary energy levels in CM1 and CM2 are 0.7% and 8.6% less than in the baseline scenario, respectively. The magnitude of the energy reduction is less than the GHG emission reductions. For instance, the GHG emission reduction in CM2 is 27.2%, whereas the decrease in primary energy is 8.6%. This implies that GHG emission reductions are realized by both energy consumption reduction and fuel mix changes (this will be discussed later). The magnitude of these reductions may give the impression that they are low, but the reason for this would be the relatively large change in power generation assumptions in the CM scenarios.

4.2.2. Final Energy

The degree of total energy demand reduction for the two mitigation scenarios is shown in Figure 8a,b. From Figure 8a, it can be seen that, for the two mitigation scenarios, primary total energy reductions are likely to occur in oil and coal. With regard to sector, the major demand reduction is expected to occur within the country’s major energy-consuming sectors, namely, the industry and transport sectors (see Figure 8b).

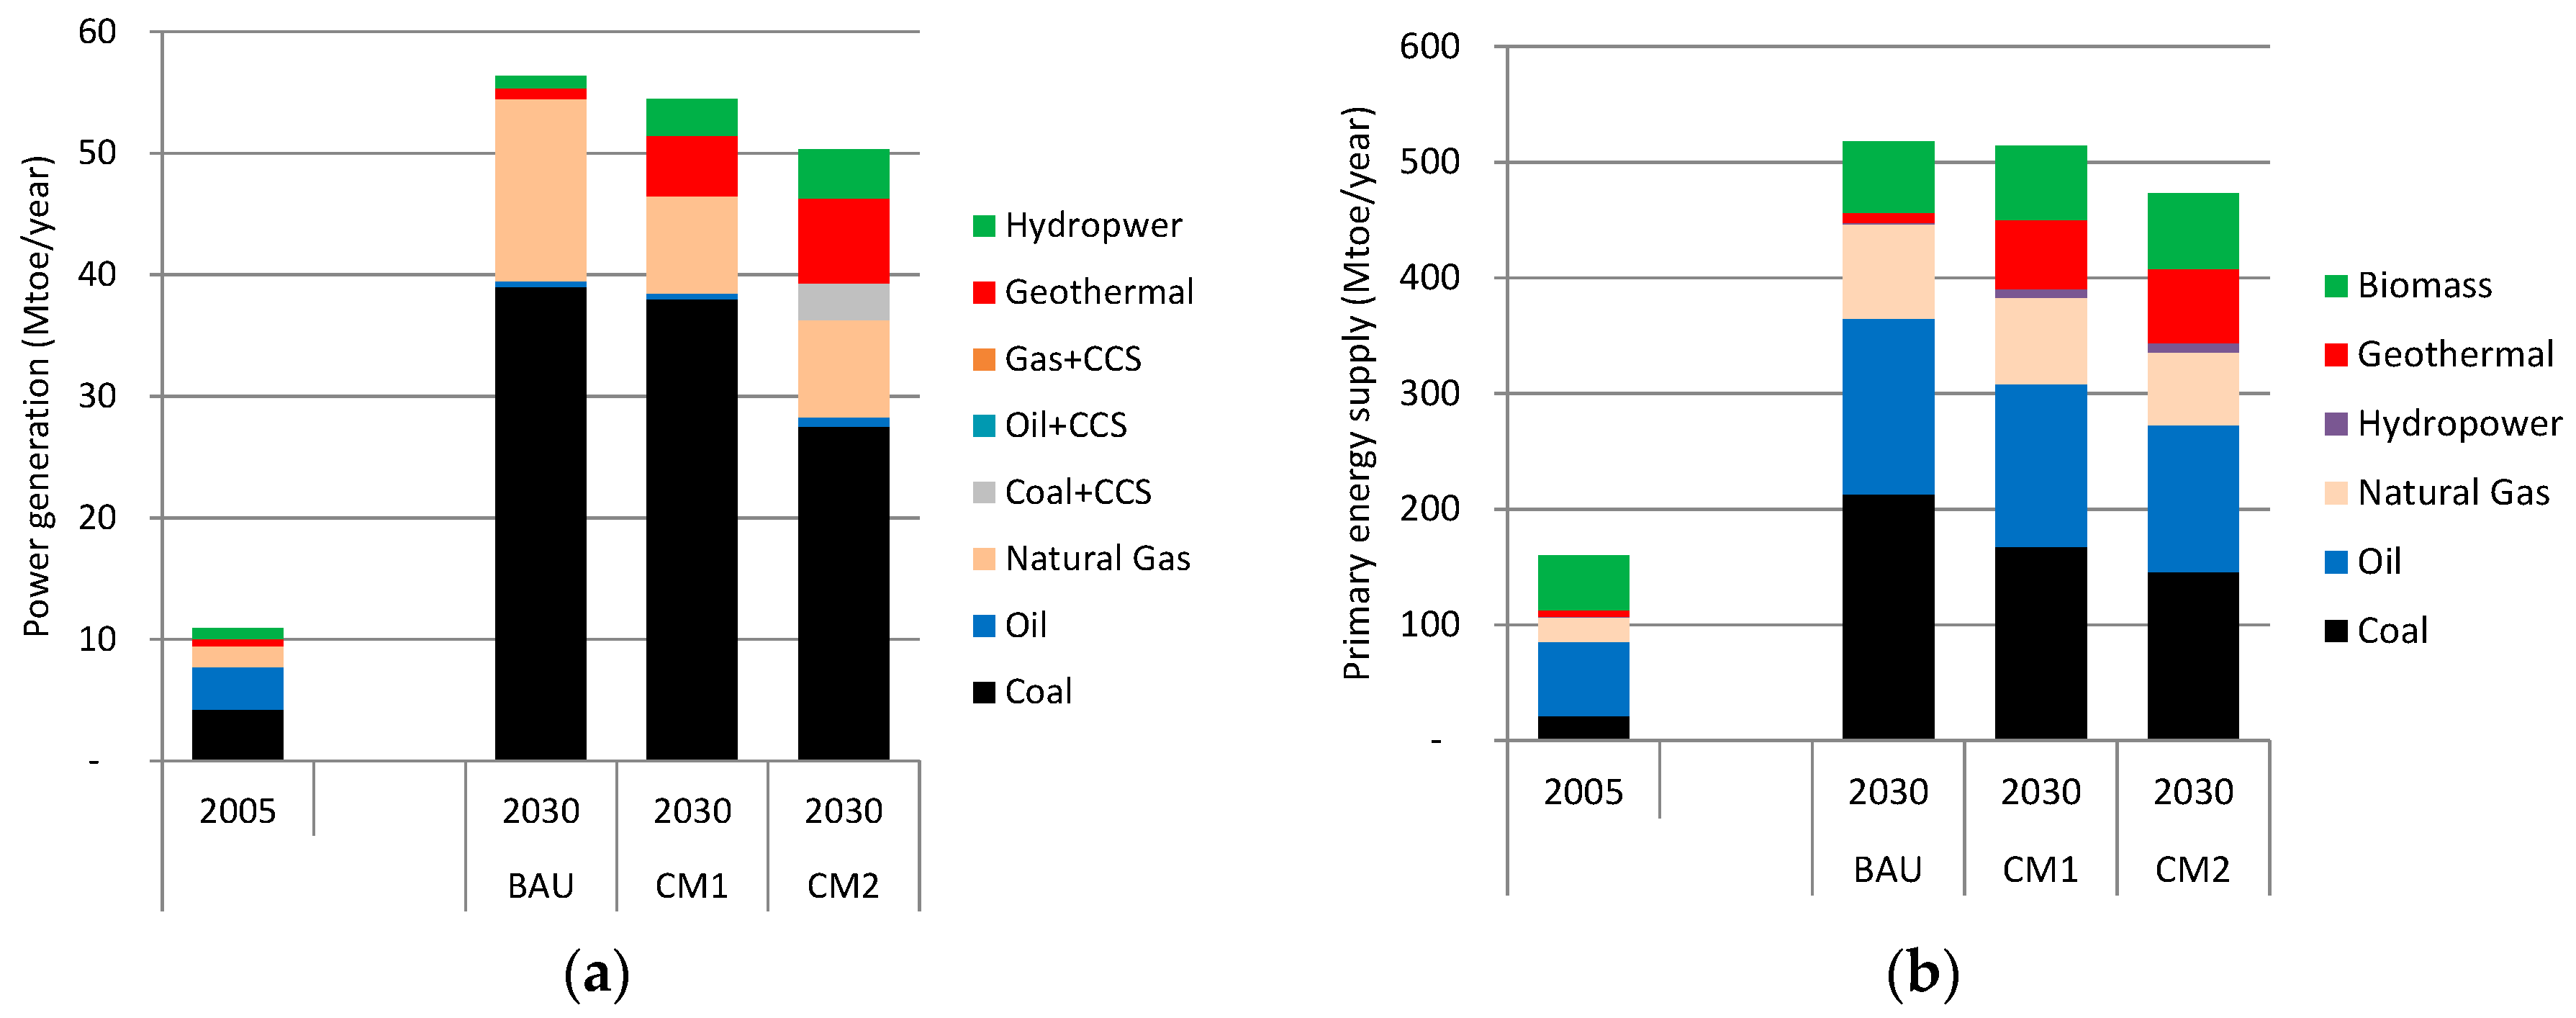
4.2.3. Electricity and Primary Energy Mix Changes

The role of fuel switching in power generation in reducing GHG emissions is shown in Figure 9a. In the CM1 scenario, emission reductions would be achieved through the reduction of gas use and the increased use of geothermal and hydropower, while in the CM2 scenario they would be achieved through the reduction of electricity demand (efficiency measures), a switch from conventional coal and gas to hydropower and geothermal plants, and the deployment of CCS in coal power plants.
The extents of primary energy reduction and fuel switching that result in emission reductions for the CM1 and CM2 scenarios are presented in Figure 9b. The figure indicates that, to achieve emission reductions in both the CM1 and the CM2 scenarios, a switch from fossil fuels to renewable energy (most notably geothermal) is necessary.

4.2.4. Mitigation Costs

The deployment of low-carbon energy systems to reduce GHG emissions requires larger technology investments than in the baseline scenario. The carbon price in the CM1 scenario is US$19 (2005)/tCO2, while that in CM2 is much higher (i.e., US$63/tCO2).
The GDP changes in both of the CM scenarios relative to baseline are positive. This is counterintuitive to the expectations of a normal climate mitigation study. The main factor generating these results is the combination of the assumptions for power generation and coal mining productivity. Power generation in all scenarios and for all energy sources is fixed in this study to assess the national energy development plan. There is a large increase in the use of coal in the baseline scenario and this assumption is forced into the model. However, as shown in Figure 10, the coalmining sector has a large share in terms of value-added industries and represents a low-productivity sector. If coal use can be reduced in such mitigation scenarios, the total factor productivities can increase. Figure 11 illustrates industrial sector shifts due to emission constraints. Clearly, coal-related industries induce negative impacts while renewable and service sectors induce positive ones. Notably, the results of our study imply that investments in low-carbon technologies are cancelled out by that factor.

5. Discussion

5.1. The Role of Low-Carbon Energy Systems

Analysis of the modeling results provides insight into the role of a low-carbon energy system in terms of achieving Indonesia’s GHG emission reduction target. To achieve a moderate emission reduction target (e.g., a 15% reduction—CM1), implementation of energy efficiency measures combined with deployment of renewable energy would be sufficient. In CM1, energy efficiency measures would eliminate 40.2 Mtoe/year of total annual energy consumption, a 4% reduction overall. This emission reduction would also be met through electrification of end-user consumption, whereby deploying renewables for power generation would decarbonize the electricity supply. Electrification of end-user consumption is indicated by increases in the share of electricity within total energy consumption. In CM1, the share of electricity in terms of total energy consumption is 12.7% in 2030, while in the baseline scenario it is only 7.2%. This increase in electricity share contributes to emission reductions since in CM1 the electricity would be supplied by power plants using higher shares of renewables, as compared to the baseline case. In the baseline scenario, the share of renewables in the power supply would only be 4%, while in CM1 it would be 16%.
To achieve relatively large emission reductions (i.e., a 27% reduction—CM2), more mitigation measures would be required than in CM1. In addition to energy efficiency measures and deployment of renewables, coal and CCS power plants would be introduced under the condition of a high carbon price. Moreover, CM2 requires greater energy efficiency measures. In this scenario, the measures result in a 60.5 Mtoe total energy demand cut, or 17% less than the baseline energy demand. The share of electricity within total energy demands is larger in CM2 than in baseline, namely, 14% vs. 7%. To decarbonize the electricity supply, the share of renewables in the power mix would increase to 22%, and 12% of coal power plants would be equipped with CCS systems. The decarbonization technologies rely heavily on commercial activities and the government should frame policies considering actual implementation [24]. Indonesia is endowed with the capacity to produce many types of renewable energy, such as geothermal, hydropower, solar energy, and bioenergy. Geothermal energy has particularly large potential and is a unique opportunity for Indonesia. Japan and New Zealand also have large potentials in geothermal and have therefore pursued technological development. Indonesia could thus benefit from technology transfer from these countries. Green general-purpose technologies, including Information and Communication Technology (ICT), would also contribute to CO2 emission reductions, and it is critical to consider these options [25,26].
The emission reductions that result from the mitigation actions in this modeling study are lower than the emission reduction targets for Indonesia’s energy sector (as proposed in the sectoral breakdown of Indonesia’s Nationally Determined Contribution (NDC)) [27]. A comparison between the results of our study and the sectoral breakdown of Indonesia’s NDC is presented in Table 3.
As in the case of our study, Indonesia’s INDC was also estimated using economic and population growth as the driver of energy development. Despite using the same assumptions for economic development and population growth, the INDC estimates larger baseline emissions. The reason for this difference cannot be analyzed because the corresponding energy level and energy mix in 2030 are not provided in the INDC document. In terms of emission levels under conditional and unconditional scenarios, the results of our study are similar because those are exogenous assumptions. However, without details of INDC energy levels in these scenarios, we cannot analyze the reason for the similarity. It is probably a coincidence.
As previously mentioned, the results of our study indicate that mitigation measures will lead to some improvement (compared to the baseline scenario) in economic development (i.e., 0.6% for CM1 and 0.3% for CM2). After observing the spread of value-added output across the economic spectrum, it is likely that economic development improvements will be a result of a shift in economic activities from the fossil-fuel energy industry to industries that have higher value-added output. It should be noted, however, that the economic gain calculation only takes into account the impact of “mitigation” actions such as technology investment, taxes, and redistribution among economic sectors. Gains resulting from avoiding climate change impacts or risks (floods, droughts, etc.), adaptation costs, and the cost–benefits of improved public health due to cleaner energy systems are not incorporated in this study. However, such implications are worthy of analysis and should be discussed further. As mentioned in the previous section, two elements impact on the results of our study, namely, strong assumptions regarding coal power plants and low productivity in coal-related industries. SAM is the basis of CGE modeling and we should be attentive to the accuracy and reliability of SAM (or the input-output table).
Compared to Indonesia’s previous pledge (i.e., RAN GRK, which targeted a 38 MtCO2 reduction by 2020), the new target (INDC), which aims for 250 MtCO2 by 2030, is a big jump for the energy sector. Such a change poses significant technical and economic, as well as psychological, challenges. An important step that must be taken to achieve the reduction target is to prepare appropriate and concrete mitigation action implementation strategies and plans. Since most of the necessary emission reductions would come from the power sector (via a fuel switch from fossil fuels to renewables), the main component of government mitigation action should be linked to PLN (Plan PT Perusahaan Listrik Negara; the state-owned electric utility). A key factor for success in achieving the reduction target will be cooperation between the government and PLN.

5.2. Limitations

There are several limitations to this study. Firstly, the trigger or shock factor in a low-carbon energy system is a carbon tax. In a country such as Indonesia, where industries have experienced energy subsidies for years, implementing a carbon tax would be difficult, but not impossible.
Secondly, our study considers the country as a point in space, rather than as a spatial region. Therefore, distances between energy resources and demand locations are not considered. In reality, there are many renewable energy resources for grid electricity (such as geothermal and hydropower) that are located in areas far from the demand centers and are often separated by seas and other water bodies. Therefore, exploitation of these resources would depend on practicality, advances in technology, and the economics of submersible electricity transmission systems.
Thirdly, to achieve the higher reduction target (CM2), advances in technologies such as CCS would be required. In reality, CCS technology is still in its infancy with regard to development. Therefore, implementation of CCS in Indonesia will depend on the logistical and economic advances in this technology.
Although the insights of this study are meaningful, there should be discussions on the problems that face this transition—these could be better elaborated on in future. Firstly, power generation is exogenously given in this study, considering the current power development plan, but it would be beneficial to have the flexibility to suggest broader energy system changes in future studies; Secondly, mitigation efforts would result in losers and winners in society. The potential losers tend to lobby for climate policy, so special treatment or strong political will would be needed; Thirdly, Indonesia is unique in the sense that its many islands are separated, and this would be a challenge for the grid system. The variable renewable energy amount in this study is small. However, if the cost reduction is so dramatic that the penetration of such renewable energy greatly increases, how to manage the variability would be a key challenge in a future low-carbon society.

6. Conclusions

Two options for low-carbon energy development in Indonesia were analyzed using an AIM/CGE model. These scenarios were simulated using socio-economic assumptions that were in accordance with the actual situation of the country. Analysis of the simulation results suggests that Indonesia’s low-carbon energy system in 2030 could be achieved with two pillars, namely, energy efficiency measures and the deployment of fewer carbon-emitting energy systems (i.e., renewable energy in the power and transport sectors, and natural gas in the power and transport sectors). Emission reductions would also be met through the electrification of end-user consumption, whereby deploying renewables in power generation would decarbonize the electricity supply.
In a moderate emission reduction scenario (CM1 scenario), a 15.5% emission reduction target (compared to the baseline scenario) could be achieved. This reduction could be achieved using efficiency measures that reduce total energy demand by 4%, with six times greater deployment of geothermal power plants than at baseline and four times greater use of hydropower than in the baseline scenario. For further carbon reductions (CM2), a 27% reduction could be achieved with similar measures but with more intensive penetration: a total energy demand cut of 13%, seven times greater deployment of geothermal power plants compared with baseline, and five times the amount of hydropower than in baseline. To decarbonize the electricity supply, the share of renewables in the power mix should be increased to 20%, and 4% of fossil-fueled power plants should be equipped with CCS systems.
In CM1, GHG reductions in 2030 will cost US$16 per ton of CO2. Further emission reductions (i.e., the CM2 scenario) would have a much higher cost (US$63 per ton of CO2). The low-carbon energy development of Indonesia will, surprisingly, have positive macro-economic implications; there are likely to be some small improvements (compared to the baseline scenario) with regard to economic development (a 0.6% increase for CM1 and a 0.3% increase for CM2).
The INDC emission reduction target of 250 MtCO2e by 2030 is a lofty goal compared to the country’s previous reduction target of only 38 MtCO2e by 2020. This large increase poses technical and financial, as well as psychological, challenges. Therefore, to reach the target, greater focus and effort are required. As the majority of the emission reductions would come from the electricity sectors, it is necessary for the government to develop a cooperative relationship with the PLN (the state-owned electric utility).

Supplementary Materials

The following are available online at www.mdpi.com/1996-1073/10/1/52/s1.

Acknowledgments

This work was supported by JSPS KAKENHI, Grant Number JP16K18177, and the Global Environmental Research Fund 2-1402 of the Ministry of Environment, Japan.

Author Contributions

Bintang B. Yuwono operated the model simulation and Ucok W.R. Siagian wrote the manuscript. Shinichiro Fujimori and Toshihiko Masui supported the modification and improvement of this paper. All authors contributed in structuring the study.

Conflicts of Interest

The authors declare no conflict of interest.

References

  1. Hasan, M.H.; Mahlia, T.M.I.; Nur, H. A review on energy scenario and sustainable energy in Indonesia. Renew. Sustain. Energy Rev. 2012, 16, 2316–2328. [Google Scholar] [CrossRef]
  2. Jupesta, J. Modeling technological changes in the biofuel production system in Indonesia. Appl. Energy 2012, 90, 211–217. [Google Scholar] [CrossRef]
  3. Bappenas. Rencana Pembangunan Jangka Menengah Nasional (RPJMN) 2015–2019; Badan Perencanaan Pembangunan Nasional: Jakarta, Indonesia, 2014.
  4. Ibrahim, H.; Thaib, N.; Abdul Wahid, L. Indonesia energy scenario to 2050: Projection of consumption, supply option and primary energy mix scenarios. In Proceedings of the Energy Links Between Russia and East Asia: Development Strategies for the XXI Century, Irkutsk, Russia, 30 August–3 September 2010.
  5. Dewi, R.G.; Kobashi, T.; Matsuoka, Y.; Gomi, K.; Ehara, T.; Kainuma, M.; Fujino, J. Low Carbon Society Scenario toward 2050: Indonesia Energy Sector; Global Partnership: Nairobi, Kenya, 2010. [Google Scholar]
  6. Siagian, U.W.R.; Dewi, R.G.; Boer, R.; Hendrawana, I.; Yuwonoa, B.B.; Ginting, G.E. Pathways to Deep Decarbonization in Indonesia; Sustainable Development Solutions Network (SDSN) and Institute for Sustainable Development and International Relations (IDDRI): New York, NY, USA, 2015. [Google Scholar]
  7. Nasional, D.E. Outlook Energi Indonesia 2015; Dewan Energi Nasional: Calgary, AB, Canada, 2015. [Google Scholar]
  8. Statistics, E. Ministry of Energy and Mineral Resource; Center of Data and Information: Jakarta, Indonesia, 2016. [Google Scholar]
  9. National Action Plan for Reducing GHG Emissions; Government of Indonesia: Jakarta, Indonesia, 2011.
  10. Fujimori, S.; Masui, T.; Matsuoka, Y. Gains from emission trading under multiple stabilization targets and technological constraints. Energy Econ. 2015, 48, 306–315. [Google Scholar] [CrossRef]
  11. Hasegawa, T.; Fujimori, S.; Shin, Y.; Tanaka, A.; Takahashi, K.; Masui, T. Consequence of climate mitigation on the risk of hunger. Environ. Sci. Technol. 2015, 49, 7245–7253. [Google Scholar] [CrossRef] [PubMed]
  12. Hasegawa, T.; Fujimori, S.; Shin, Y.; Takahashi, K.; Masui, T.; Tanaka, A. Climate change impact and adaptation assessment on food consumption utilizing a new scenario framework. Environ. Sci. Technol. 2014, 48, 438–445. [Google Scholar] [CrossRef] [PubMed]
  13. Fujimori, S.; Masui, T.; Matsuoka, Y. Development of a global computable general equilibrium model coupled with detailed energy end-use technology. Appl. Energy 2014, 128, 296–306. [Google Scholar] [CrossRef]
  14. Fujimori, S.; Kainuma, M.; Masui, T.; Hasegawa, T.; Dai, H. The effectiveness of energy service demand reduction: A scenario analysis of global climate change mitigation. Energy Policy 2014, 75, 379–391. [Google Scholar] [CrossRef]
  15. Dai, H.; Silva Herran, D.; Fujimori, S.; Masui, T. Key factors affecting long-term penetration of global onshore wind energy integrating top-down and bottom-up approaches. Renew. Energy 2016, 85, 19–30. [Google Scholar] [CrossRef]
  16. Fujimori, S.; Masui, T.; Matsuoka, Y. Discussion Paper Series: Center for Social and Environmental Systems Research; AIM/CGE [Basic] Manual; National Institute Environmental Studies: Tsukuba, Japan, 2012; pp. 1–87. [Google Scholar]
  17. Namazu, M.; Fujimori, S.; Shukla, P.R.; Matsuoka, Y. Two low-carbon development pathways in India. Glob. Environ. Res. 2013, 17, 119–128. [Google Scholar]
  18. Namazu, M.; Fujimori, S.; Jiang, K.; Matsuoka, Y. Feasibility of low-carbon development in China. Glob. Environ. Res. 2013, 17, 109–118. [Google Scholar]
  19. Mittal, S.; Dai, H.; Fujimori, S.; Masui, T. Bridging greenhouse gas emissions and renewable energy deployment target: Comparative assessment of China and India. Appl. Energy 2016, 166, 301–313. [Google Scholar] [CrossRef]
  20. Hasegawa, T.; Fujimori, S.; Masui, T.; Matsuoka, Y. Introducing detailed land-based mitigation measures into a computable general equilibrium model. J. Clean. Prod. 2016, 114, 233–242. [Google Scholar] [CrossRef]
  21. Tran, T.T.; Fujimori, S.; Masui, T. Realizing the intended nationally determined contribution: The role of renewable energies in Vietnam. Energies 2016, 9, 587. [Google Scholar] [CrossRef]
  22. International Energy Agency (IEA). Energy Technology Perspectives 2012; International Energy Agency (IEA): Paris, France, 2012. [Google Scholar]
  23. Perusahaan Listrik Negara (PLN). Electricity Supply Business Plan PT Perusahaan Listrik Negara (PLN) (Persero) 2016–2025; Perusahaan Listrik Negara: Jakarta, Indonesia, 2016.
  24. Albino, V.; Ardito, L.; Dangelico, R.M.; Messeni Petruzzelli, A. Understanding the development trends of low-carbon energy technologies: A patent analysis. Appl. Energy 2014, 135, 836–854. [Google Scholar] [CrossRef]
  25. Ardito, L.; Messeni Petruzzelli, A.; Albino, V. Investigating the antecedents of general purpose technologies: A patent perspective in the green energy field. J. Eng. Technol. Manag. 2016, 39, 81–100. [Google Scholar] [CrossRef]
  26. Cecere, G.; Corrocher, N.; Gossart, C.; Ozman, M. Technological pervasiveness and variety of innovators in Green ICT: A patent-based analysis. Res. Policy 2014, 43, 1827–1839. [Google Scholar] [CrossRef]
  27. Doeo, B. Review of RAN-GRK: Materials for NDC preparation. In Proceedings of the National Meeting “Intended Nationally Determined Contributions (INDC) to Nationally Determined Contributions (NDC)”, Jakarta, Indonesia, 30 March 2016.
Figure 1. Current energy demands and a breakdown of trends [8]. (a) Total energy demands by sector; and (b) Total energy demands by fuel type. Mtoe: million tons oil equivalent.
Energies 10 00052 g001
Figure 2. Indonesia’s current power generation and primary energy mix. (a) Power generation mix; and (b) primary energy supply. R.E.: Renewable Energy.
Energies 10 00052 g002
Figure 3. Socio-economic factors, energy, and GHG emissions under the baseline scenario in 2030 relative to 2005. GDP: gross domestic product; GHG: greenhouse gas.
Energies 10 00052 g003
Figure 4. Total energy demand in the baseline scenario. (a) Total energy demand by sector, baseline; and (b) total energy demand by fuel, baseline.
Energies 10 00052 g004
Figure 5. Primary energy supply and electricity generation projections under the baseline scenario. (a) Primary energy supply; and (b) power generation.
Energies 10 00052 g005
Figure 6. GHG emissions and emission intensity, baseline scenario. USD; US dollars. GDP; Gross domestic Production.
Energies 10 00052 g006
Figure 7. Percent change in GHG emissions, energy, and GDP by 2030 (relative to baseline values).
Energies 10 00052 g007
Figure 8. Reduction in total energy demands. (a) Reduction in total energy demands by fuel type; and (b) reduction in total energy demands by sector. BAU: business-as-usual.
Energies 10 00052 g008
Figure 9. Electricity and primary energy supply by fuel type. (a) Electricity supply; and (b) primary energy supply. CCS: carbon capture and storage.
Energies 10 00052 g009
Figure 10. Share of value-added output.
Energies 10 00052 g010
Figure 11. Sector-wise value-added output in 2030 relative to the baseline year.
Energies 10 00052 g011
Table 1. Indonesia’s energy resources [7].
Energy ResourceReserveResource
Oil, billion barrels7.4-
Natural gas, TSCF *150-
Coal, billion tons29119
CBM **, TSCF *-453
Shale gas, TSCF *-574
Potential Power
Hydro75,000 MW
Geothermal29,000 MW
Micro-hydro750 MW
Biomass14,000 MWe
Solar4.80 kWh/m2/day
Wind3–6 m/s
* TSCF: trillion standard cubic feet. ** CBM: coal bed methane.
Table 2. Power generation by fuel type for the three scenarios, in Ktoe (1000 toe)/year. CM1 and CM2: countermeasure 1 and 2 scenarios.
Power PlantBaselineCM1CM2
202020302020203020202030
Coal18,34654,85515,10237,17114,27733,217
Oil122649211914641165443
Gas860620,535885521,742866020,795
Geothermal8518632233594623156394
Hydropower158716103478773235608102
Other RE1098206847228961951719
Total31,71480,42331,33175,95030,17270,670
Table 3. Comparison of Indonesia’s sectoral breakdown with Indonesia’s Nationally Determined Contribution (NDC).
ScenarioNDC–Energy SectorPresent Study
Emission in 2030 MtCO2eReduction from BaselineEmission in 2030 MtCO2eReduction from Baseline
MtCO2e%MtCO2e%
Baseline1444--1403--
Unconditional (CM1)119125317.5%119321615.4%
Conditional (CM2)97247232.7%102638327.2%

