Article

A Dynamic Control Strategy for Hybrid Electric Vehicles Based on Parameter Optimization for Multiple Driving Cycles and Driving Pattern Recognition

1
State Key Laboratory of Mechanical Transmissions & School of Automotive Engineering, Chongqing University, Chongqing 400044, China
2
Key Laboratory of Advanced Manufacture Technology for Automobile Parts, Ministry of Education, Chongqing University of Technology, Chongqing 400054, China
3
Department of Mechanical Engineering, University of Michigan-Dearborn, Dearborn, MI 48128, USA
*
Author to whom correspondence should be addressed.
Energies 2017, 10(1), 54; https://doi.org/10.3390/en10010054
Submission received: 5 August 2016 / Revised: 24 December 2016 / Accepted: 26 December 2016 / Published: 5 January 2017
(This article belongs to the Special Issue Advanced Energy Storage Technologies and Their Applications (AESA))

Abstract

:
The driving pattern has an important influence on the parameter optimization of the energy management strategy (EMS) for hybrid electric vehicles (HEVs). A new algorithm using simulated annealing particle swarm optimization (SA-PSO) is proposed for parameter optimization of both the power system and control strategy of HEVs based on multiple driving cycles in order to realize the minimum fuel consumption without impairing the dynamic performance. Furthermore, taking the unknown of the actual driving cycle into consideration, an optimization method of the dynamic EMS based on driving pattern recognition is proposed in this paper. The simulation verifications for the optimized EMS based on multiple driving cycles and driving pattern recognition are carried out using Matlab/Simulink platform. The results show that compared with the original EMS, the former strategy reduces the fuel consumption by 4.36% and the latter one reduces the fuel consumption by 11.68%. A road test on the prototype vehicle is conducted and the effectiveness of the proposed EMS is validated by the test data.

1. Introduction

To meet user demands for vehicle power performance, the parameters of hybrid electric vehicles (HEVs) are optimized to maintain the battery state of charge (SOC) and reduce the vehicle fuel consumption. This is not only related to the design parameters of the power system, but also the control parameters of the energy management strategy (EMS). To improve HEV performance in terms of fuel economy and ensure excellent driving performance, the simultaneous optimization for the main parameters of powertrain components and control system is necessary [1]. Recently, numerous works have been proposed to find the best solution. The genetic algorithm is used for the optimization of HEV control parameters which effectively improves the fuel economy [2,3,4,5]. The energy management algorithms based on adaptive multi-operating modes proposed in [6] solve the problem that different driving cycles should be provided with different control algorithms. Besides, the matching method of the powertrain based on driving cycles is presented for fuel cell HEVs [7]. The above optimization algorithms are used to optimize the parameters of the power system or energy control strategy of HEVs. Several algorithms have been employed to optimize the parameters of both the power system and control strategy, such as the particle swarm optimization (PSO) algorithm [8,9,10] and multi-objective genetic algorithm [11]. A genetic algorithm with simulated annealing is proposed in [12] to balance between economy and dynamic performance. The DIRECT algorithm global optimization method has been used for calibrating the parameters of the vehicle EMS from the perspective of fuel economy [13]. Compared with the mentioned optimization algorithms, simulated annealing particle swarm optimization (SA-PSO) has the advantages of achieving a global optimal solution [14]. It is difficult but necessary to develop a set of global optimal solutions for the simultaneous optimization of power system and control parameters.
It’s well known that the effectiveness of EMS for HEVs is greatly influenced by the driving patterns. However, the optimized parameters of HEVs based on a certain driving pattern may not maintain the battery SOC balance in other patterns, not to mention the best fuel consumption [15]. Therefore, energy management strategies based on driving pattern recognition have recently been put forward in the literature [16,17]. To optimize the vehicle performance on a random driving pattern, a multi-mode driving control algorithm using driving pattern recognition is developed for HEVs [18,19]. An intelligent energy management for parallel HEV based on driving cycle identification is proposed using a fuzzy logic controller or fuzzy neural network [20,21,22]. The machine-learning methods intelligently and automatically discriminate between the driving conditions [23,24]. To solve the multi-objective optimization problem for the longevity and energy efficiency of the energy storage system, a new optimization framework for determining an instantaneously optimized power management strategy has been proposed by Zhang et al. in [25], which shows excellent real-time power optimization performance against unknown diving cycles and operating conditions.
In these studies, the parameter optimization of the energy storage system, which is also very important for the effectiveness of EMS, is not taken into consideration. As mentioned above, the advantage of SA-PSO compared with other optimization algorithms is that it can obtain global optimization results, so it is meaningful to utilize the SA-PSO to realize the parameter optimization based on multiple driving cycles. Meanwhile the EMS based on driving pattern recognition should take advantage of the optimized parameters. However, few works have comprehensively analyzed how to combine the optimized parameters with the EMS based on driving pattern recognition. Besides, the EMS based on driving pattern recognition should emphasize more the influence of the variation range of battery SOC while focusing on the vehicle fuel economy. In general, the simultaneous optimization for parameters of power system and control strategy on this premise of maintaining balance of the battery SOC is worth studying and meaningful to improve the fuel economy.
In this paper, a new methodology for parameter optimization using a SA-PSO algorithm is proposed to pursue the best fuel consumption without impairing the dynamic performance. The parameters of the power system and control strategy for HEV are both optimized based on multiple driving cycles. In addition, an algorithm of the dynamic EMS based on driving pattern recognition is proposed in this paper. Twenty-three typical driving cycles from ADVISOR (2002, National Renewable Energy Laboratory, Golden, CO, USA) have been selected and classified according to the clustering analysis method through the Euclidean distance. Furthermore, the Euclid approach degree is used to realize the driving pattern recognition. The control parameters have been optimized at each class of driving patterns based on the optimization of multiple driving cycles. The proposed energy management strategies based on parameter optimization under multiple driving cycles and driving pattern recognition are both simulated on the Matlab/Simulink (R2010a, MathWorks, Natick, MA, USA) platform under the comprehensive driving cycles. Furthermore, road tests of the prototype vehicle with the proposed control strategy are conducted. The results of both the simulation and road tests validate the effectiveness of the proposed control strategies.

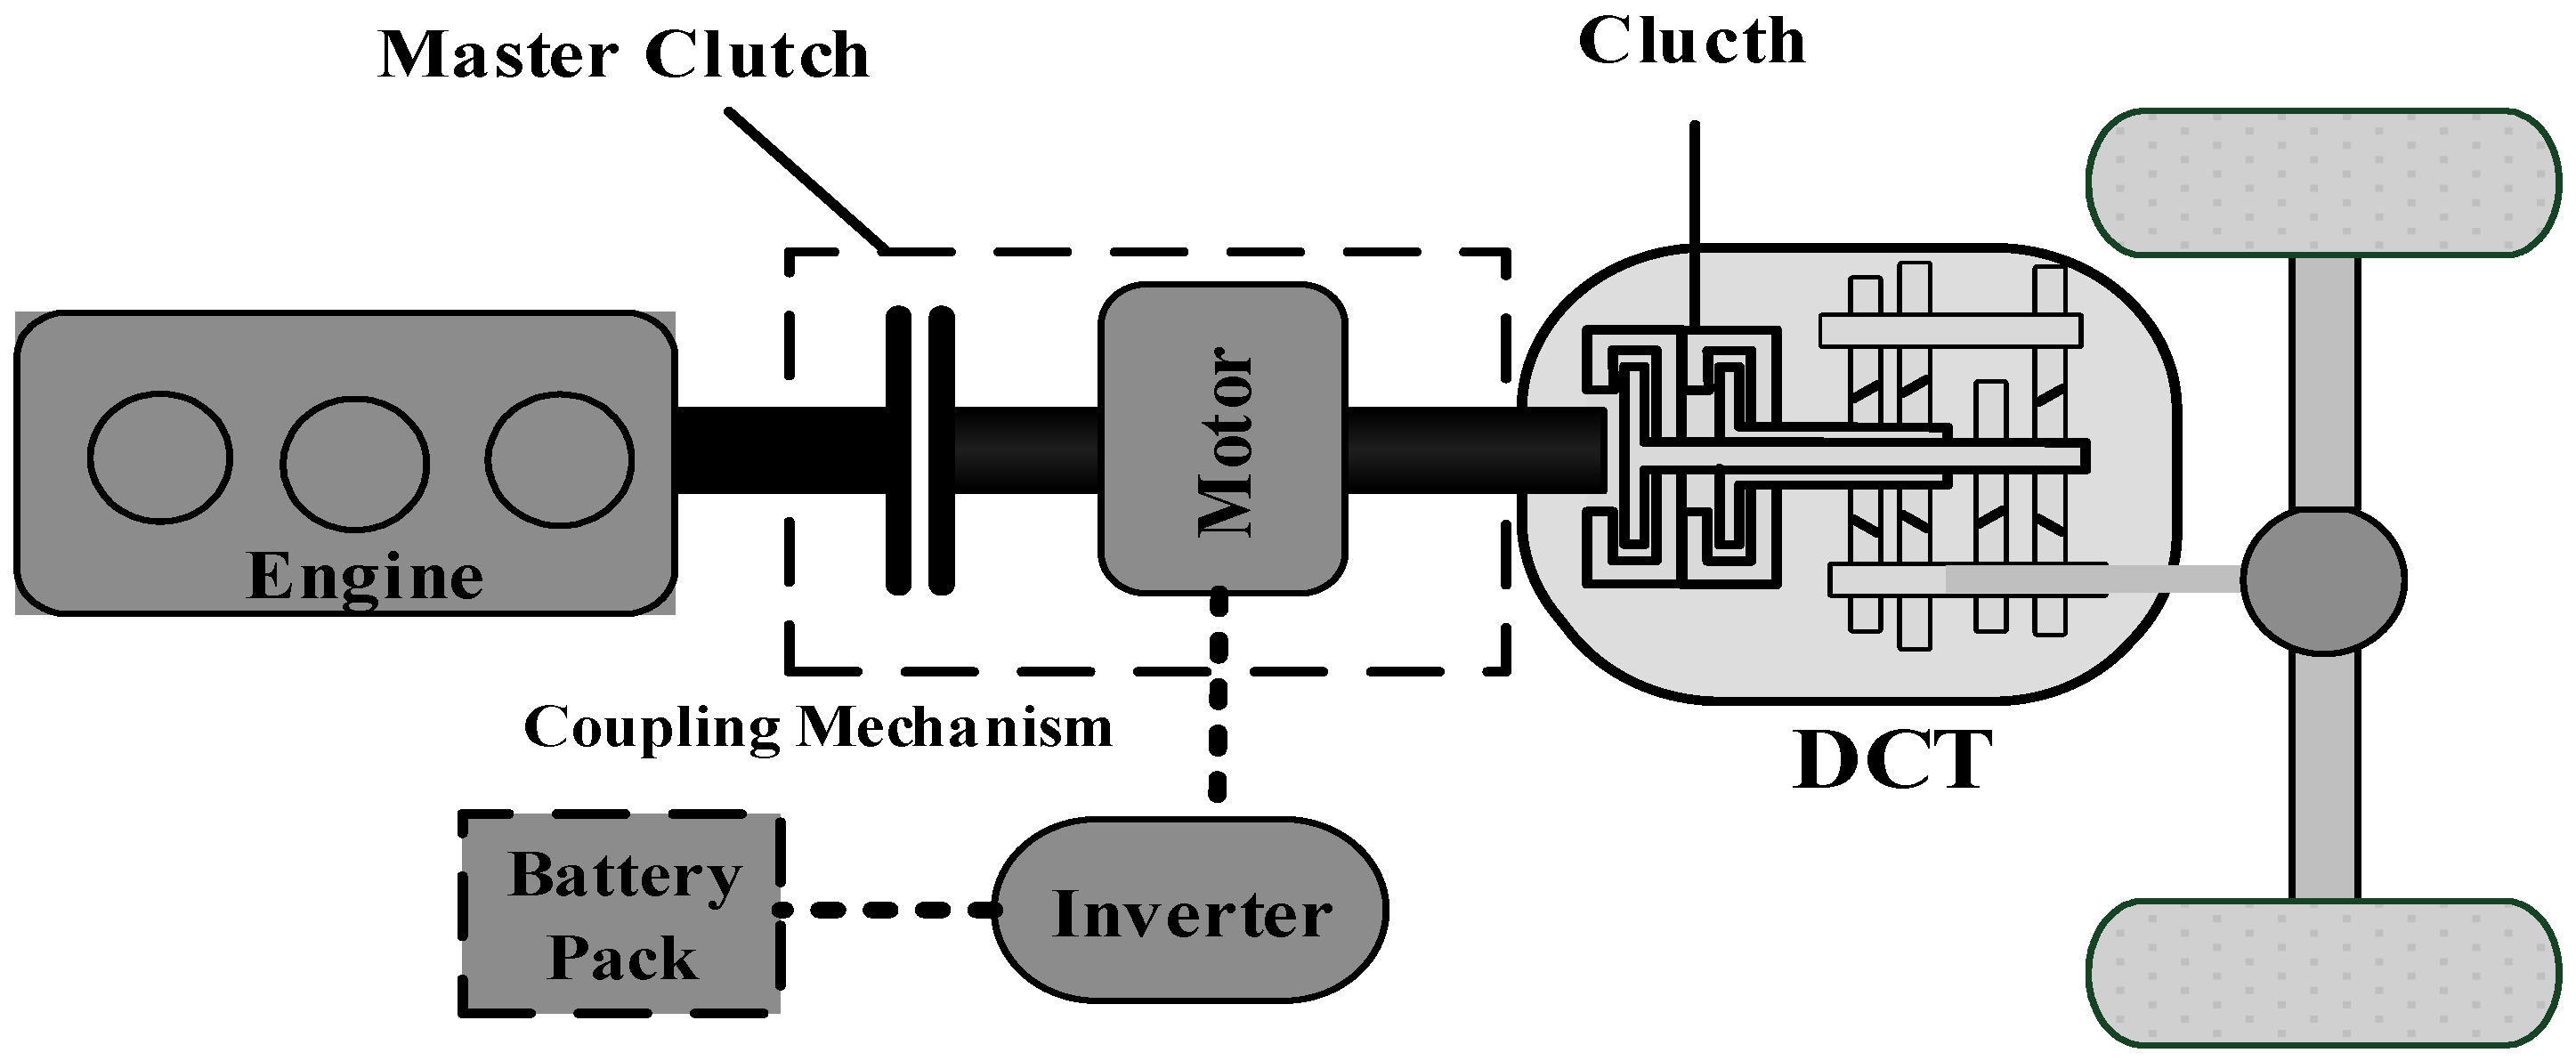
2. Hybrid Electric Vehicle (HEV) Rule-Based Energy Management Control Strategy

The hybrid power system considered in this paper is a typical parallel Integrated Starter and Generator (ISG) hybrid system, as shown in Figure 1. The engine and ISG motor are connected through a master clutch, and either of them can drive the vehicle alone. The ISG motor can also be used as a generator to charge the battery.
As shown in Figure 2, the basic control strategy in this paper is a rule-based logic threshold EMS which relies on several modes or states of operation and its decision to change modes is dependent on the power requirement of acceleration or deceleration, the SOC of the energy storage unit, and the vehicle speed [26,27]. In order to ensure that the engine operates more in high efficiency regions, in this paper, the coefficients of the engine torque in high efficiency regions (Fup and Flow) are designed to obtain the maximum and minimum engine torques based on the existing results presented in [28]. As shown in Figure 2a, when the battery SOC is higher than the low limit SOClow and if the required speed is less than a certain value V1, the vehicle will operate at pure electric mode. When the battery SOC is lower than SOClow in Figure 2b, an additional torque Tchg is required from the engine to charge the battery. Therefore, the revised rule-based EMS is proposed as shown in Table 1. The parameters of the control strategy are shown in Table 2.

3. Power System and Control Strategy Parameter Optimization Based on Multiple Driving Cycles

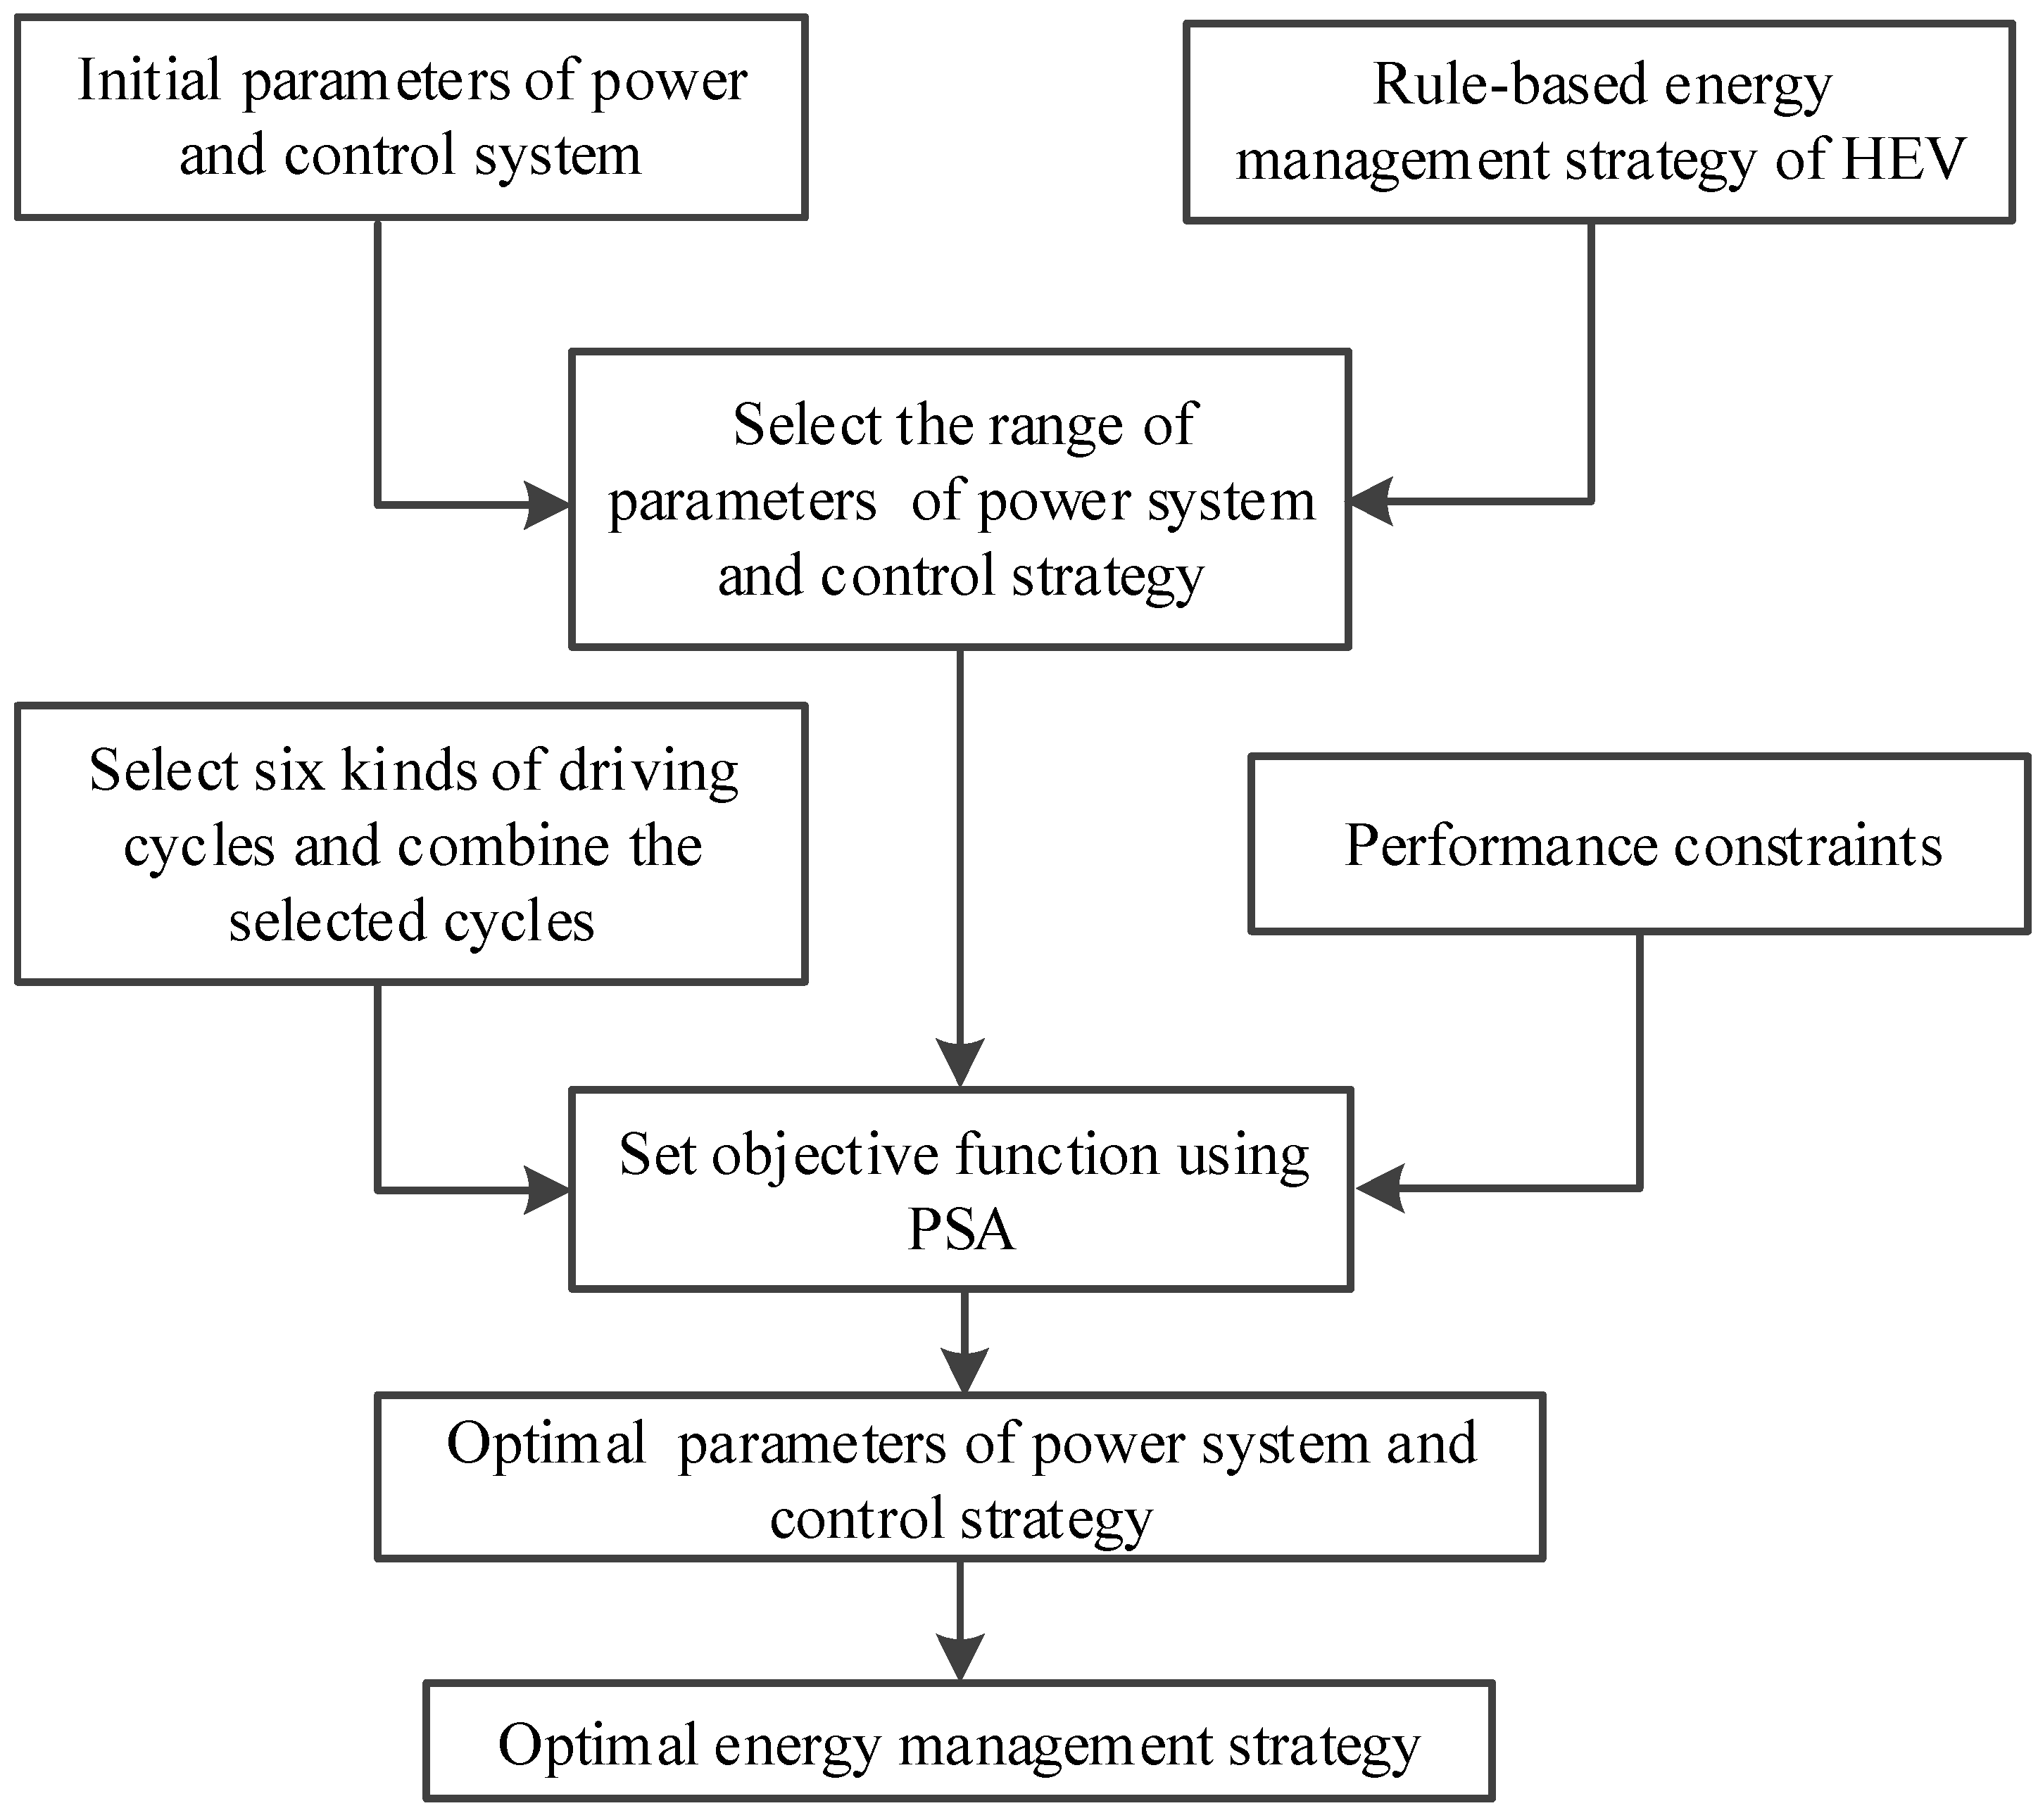
3.1. Basic Idea for Parameter Optimization

To pursue the best fuel consumption under actual driving cycle conditions, the parameter optimization of the power system and control strategy of HEV based on multiple driving cycles has been proposed. Six types of typical cycles are employed, considering the influence of urban congestion, suburban and highway conditions. The constraints of dynamic performance for the vehicle are shown in Table 3. The six types of driving cycles are shown in Table 4. The parameters of the vehicle’s power system are shown in Table 5. The optimization method for the main parameters of power system and control strategy based on multiple driving cycles is generalized as follows:
(1)
The assumption that the revised rule-based EMS is used for HEV.
(2)
The initial parameters of power system and control strategy are selected and their values are chosen.
(3)
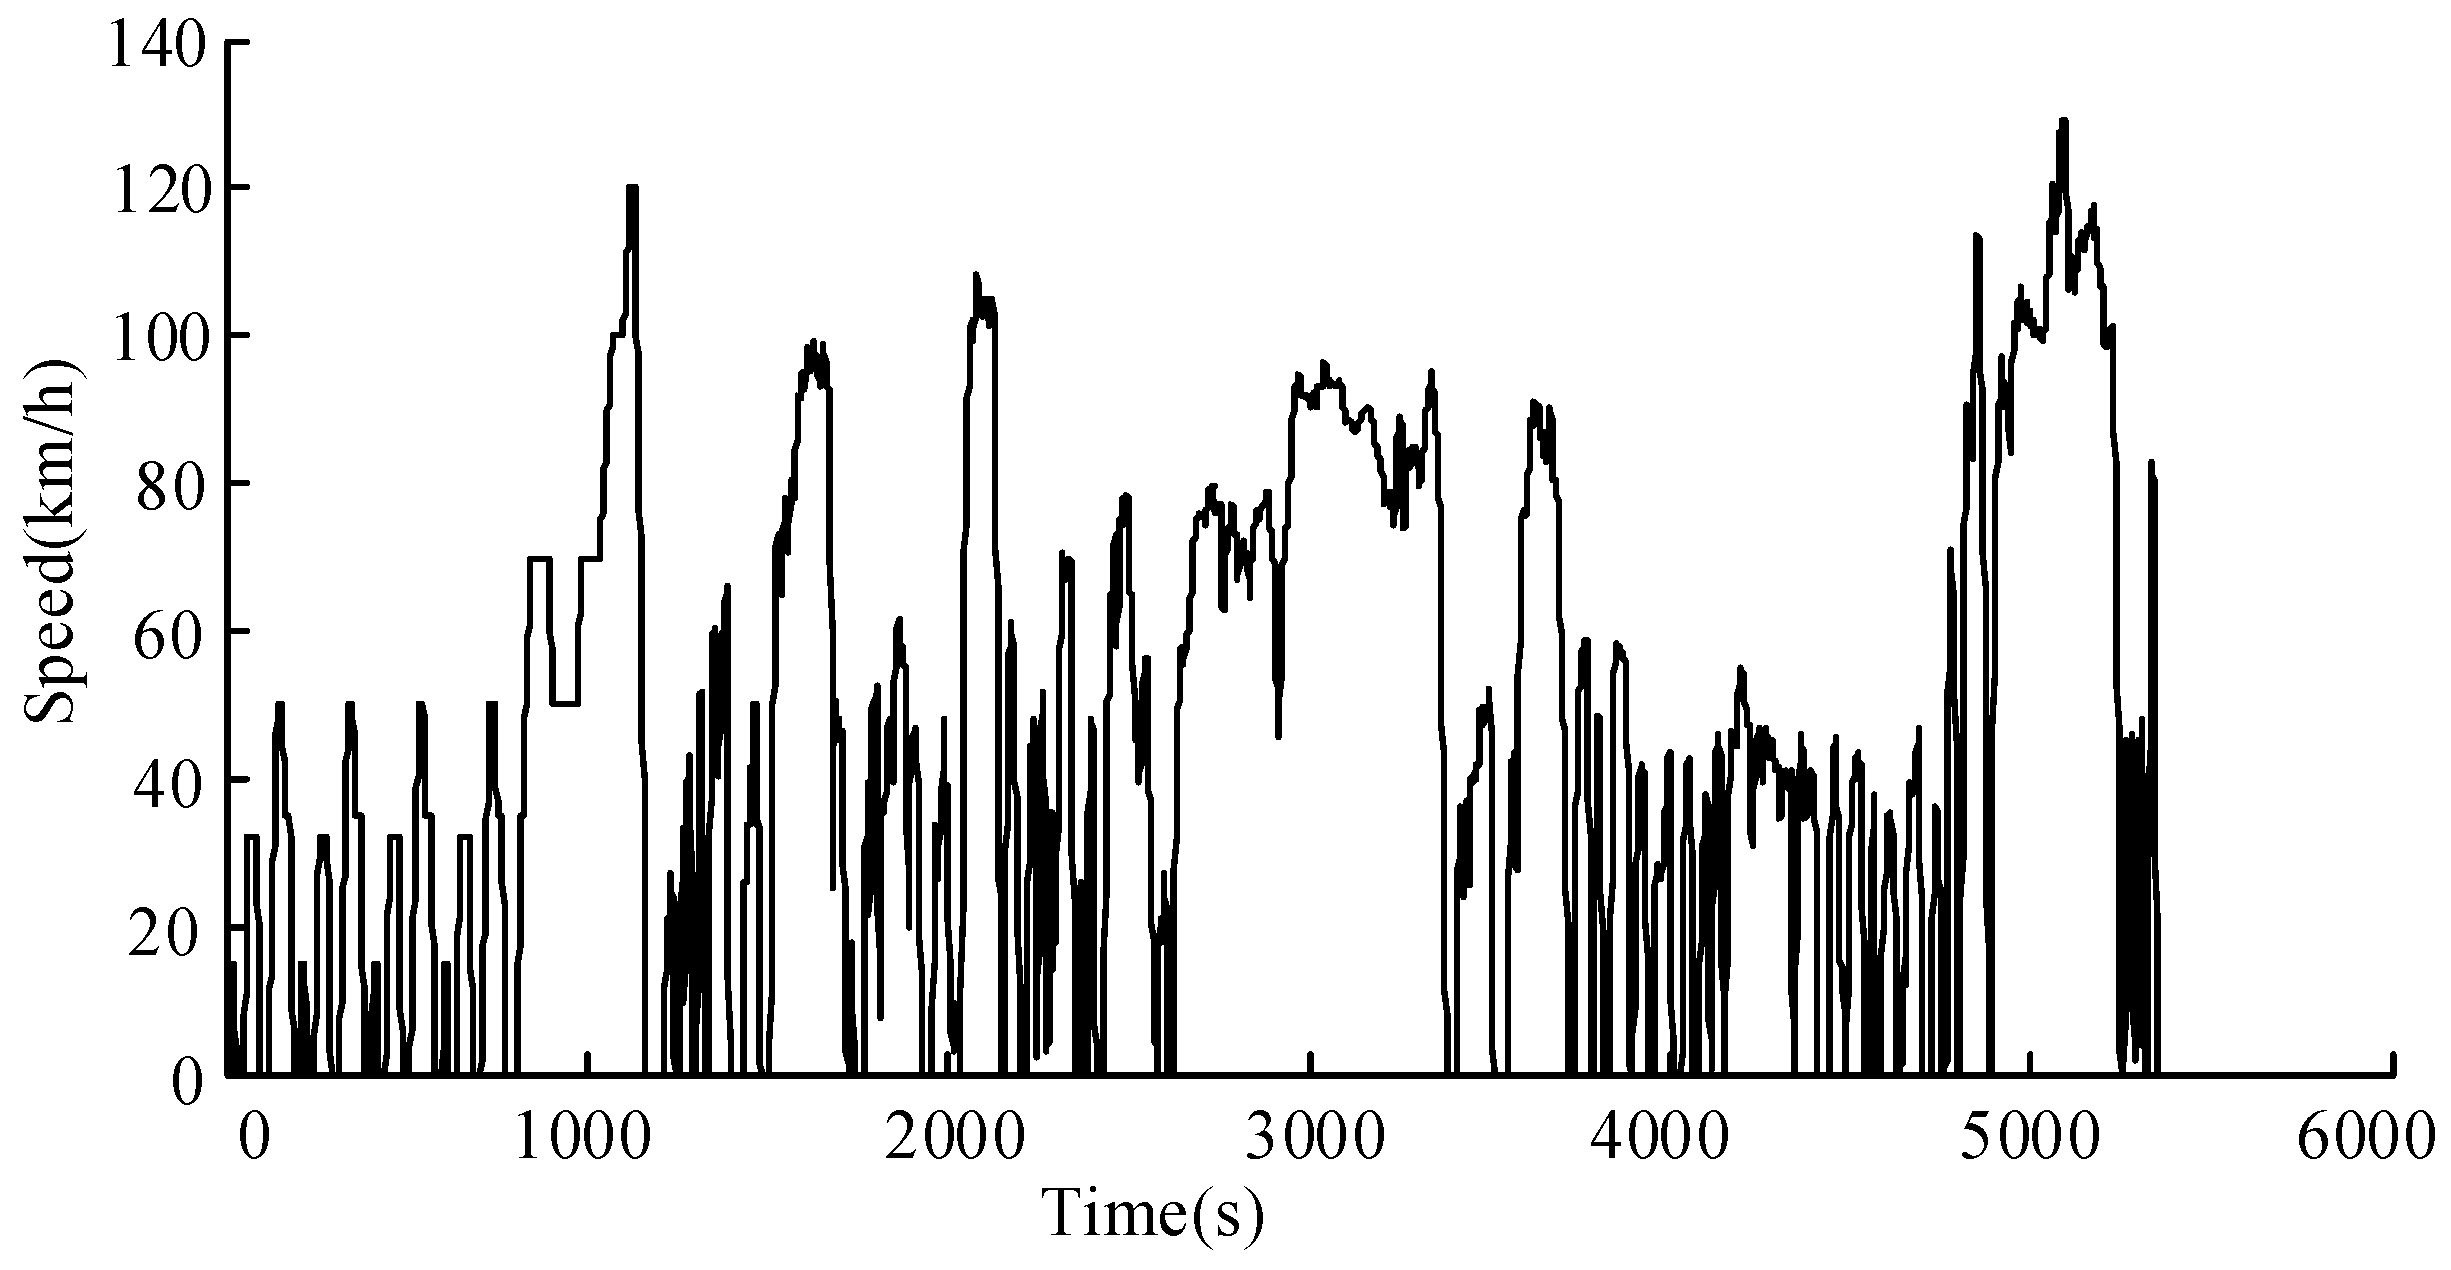
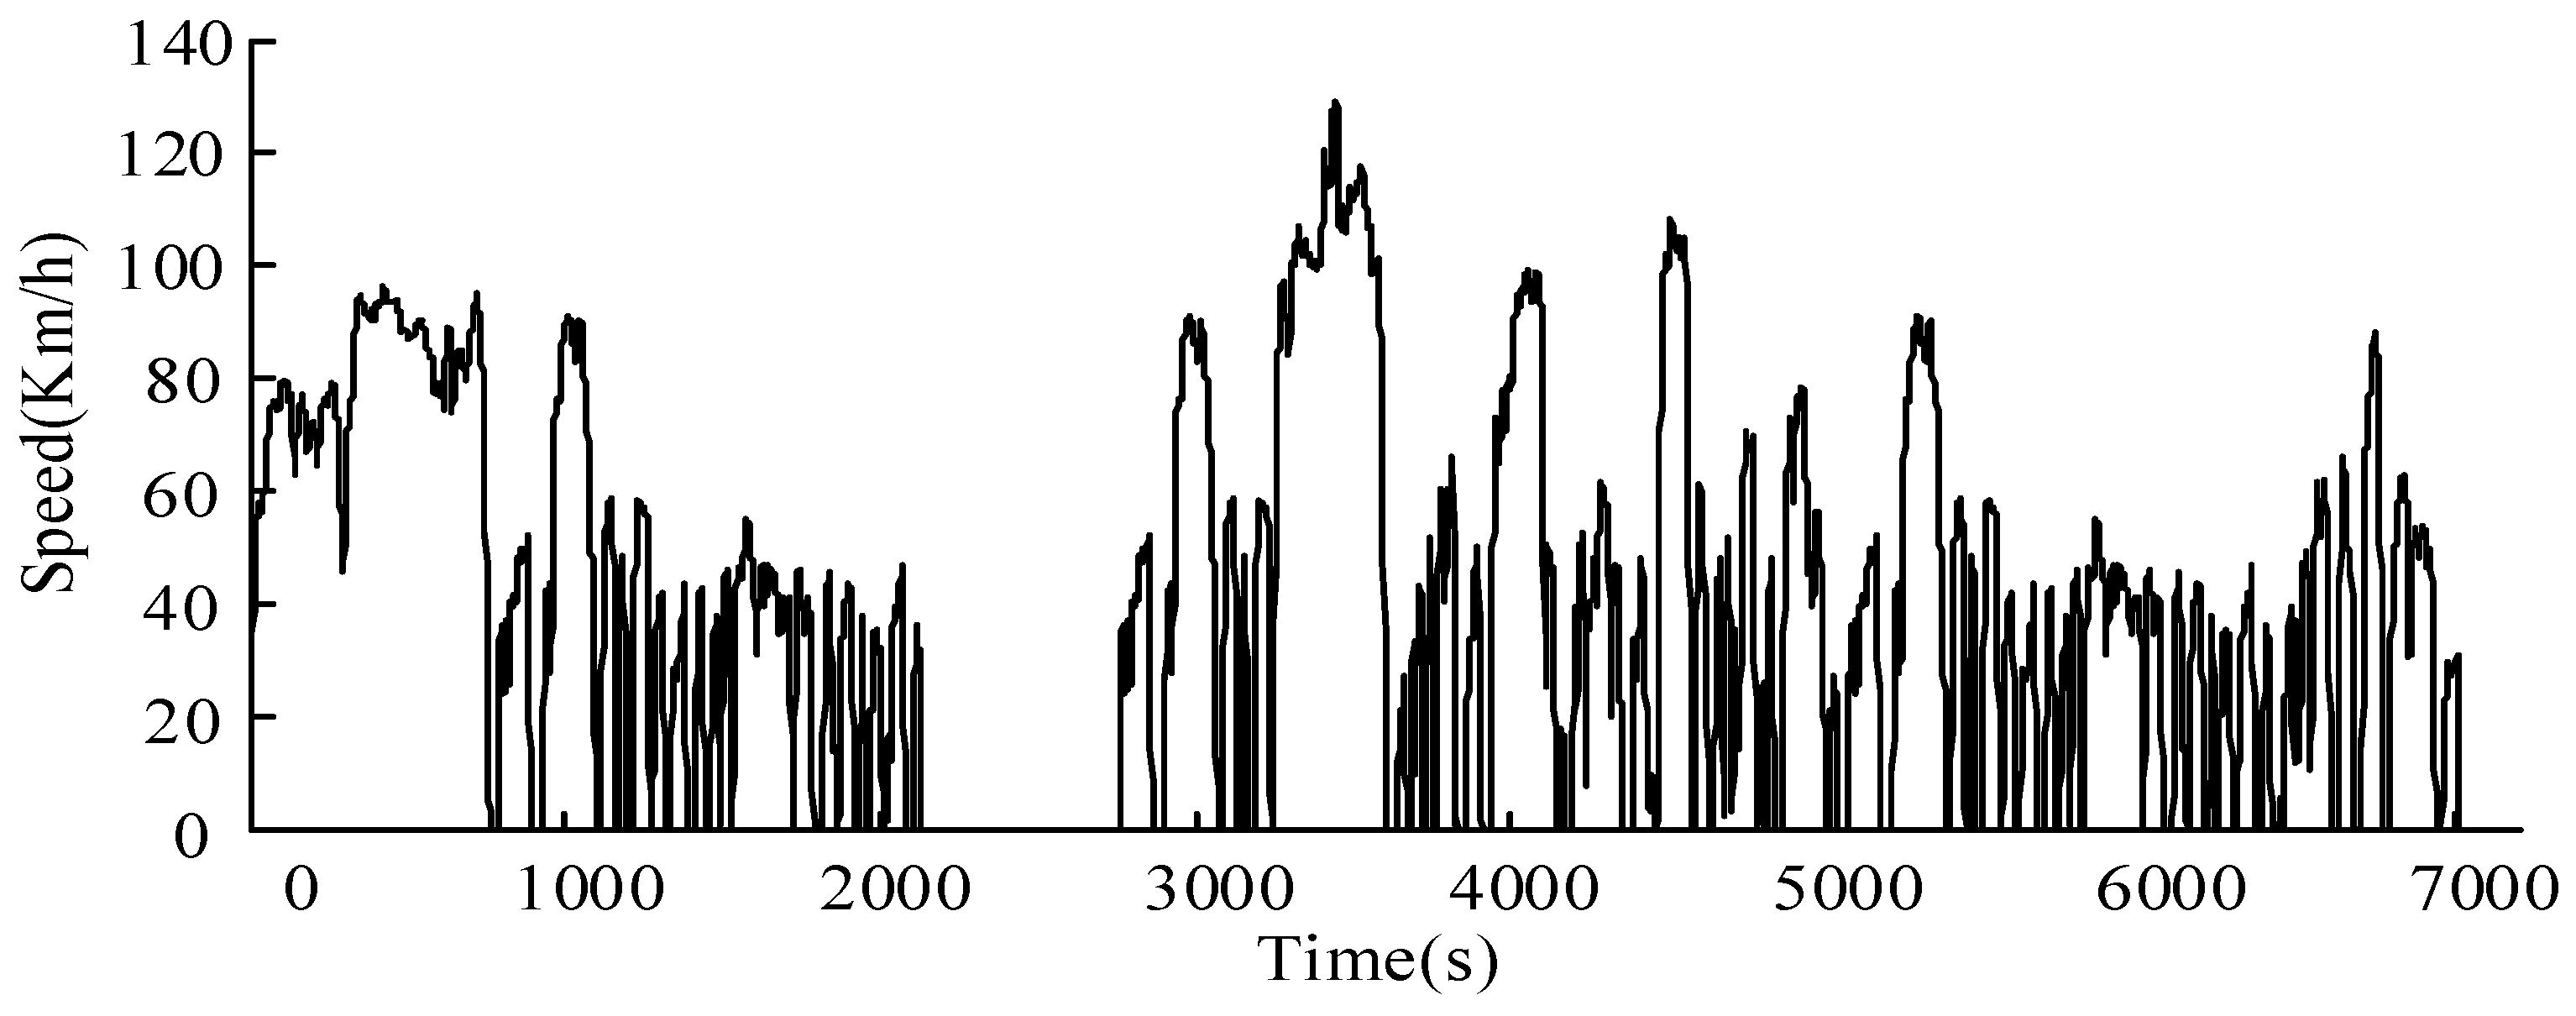
Six types of driving cycles are selected and combined into a comprehensive driving cycle.
(4)
The simultaneous optimization for the main parameters of power system and control strategy is carried out using SA-PSO algorithm with vehicle performance constraints.
(5)
The optimal power system and control parameters are applied to the HEV EMS.
The diagram of optimization method based on multiple driving cycles is shown in Figure 3.

3.2. Parameter Definition of Power System and Control Strategy

The parameters of the power system and control strategy in terms of engine power (PIC) and ISG power (PISG) are optimized in this paper to make sure that the engine and motor work in high efficiency regions on the premise of satisfying the requirements of vehicle dynamic performance. The variation of each design parameter of the power system (PIC and PISG) is considered ±70% about the initial values, according to the results presented in [15]. The control parameters (Flow, Fup, Foff, SOClow, SOCup and Vl) are designed to ensure that the engine can work in high efficiency regions without interference with each other, as shown in Table 6. The initial values of selected parameters are obtained from the prototype vehicle.

3.3. State of Charge-Fuel Consumption Correction Method

In order to eliminate the influence of SOC on the vehicle fuel consumption evaluation, the battery SOC correction method should be used to correct fuel economy in the case initial and final battery SOC are not the same during a driving cycle. The SOC-fuel consumption correction method used in this paper is as follows:
Δ f u e l = Δ S O C Q c a p U b a t ¯ η e n g _ c h g ¯ 1000 ρ
where Δfuel is the equivalent fuel consumption (L), ΔSOC is the variation of battery SOC between the starting and ending points, Qcap is the total battery capacity (Ah), U b a t ¯ is the average battery bus voltage during drive cycles (V), η e n g _ c h g ¯ is the average the engine power efficiency (g/kWh), and ρ is the gasoline density (g/L).

3.4. Optimization Objective Function

Taking the characteristics of different driving cycles into consideration, the target of parameter optimization of the power system and energy management control strategy is to achieve a set of optimal parameters to reduce fuel consumption as much as possible without impairing the dynamic performance. The fuel consumption is the optimization objective with the dynamic performance as the constraint. In order to prevent the excessive variation of battery SOCSOC), and specifically avoid exceeding the lower limit of SOC range, the weight coefficient of Δfuel under different driving cycles is set to enable the motor to drive alone. The fitness function is as follows:
Min   f ( x ) = F u e l u s e ( t ) d t + i = 1 6 w i | Δ f u e l i |
s . t .   u j ( x ) 0             j = 1 , 2 , 3 , ... , m           x i l x i x i k     i = 1 , 2 , 3 , ... , n
where u j ( x ) are the constraint conditions of vehicle dynamic performance (e.g., maximum speed and accelerating ability) as shown in Table 3, n is the number of optimization variables, which equals 8 in this study, x i l and x i k are the upper and lower bounds on the optimization variables respectively.
Considering the difference of the speed range and mileage of each driving cycle, the weight coefficients w i of Δfuel under driving cycles HWFET, FTP, LA92, US06_HWY, UDDS, SC03 through enumerative technique based on experience and simulation are chosen as 1.0, 1.0, 1.5, 1.3, 1.3 and 1.0, respectively.

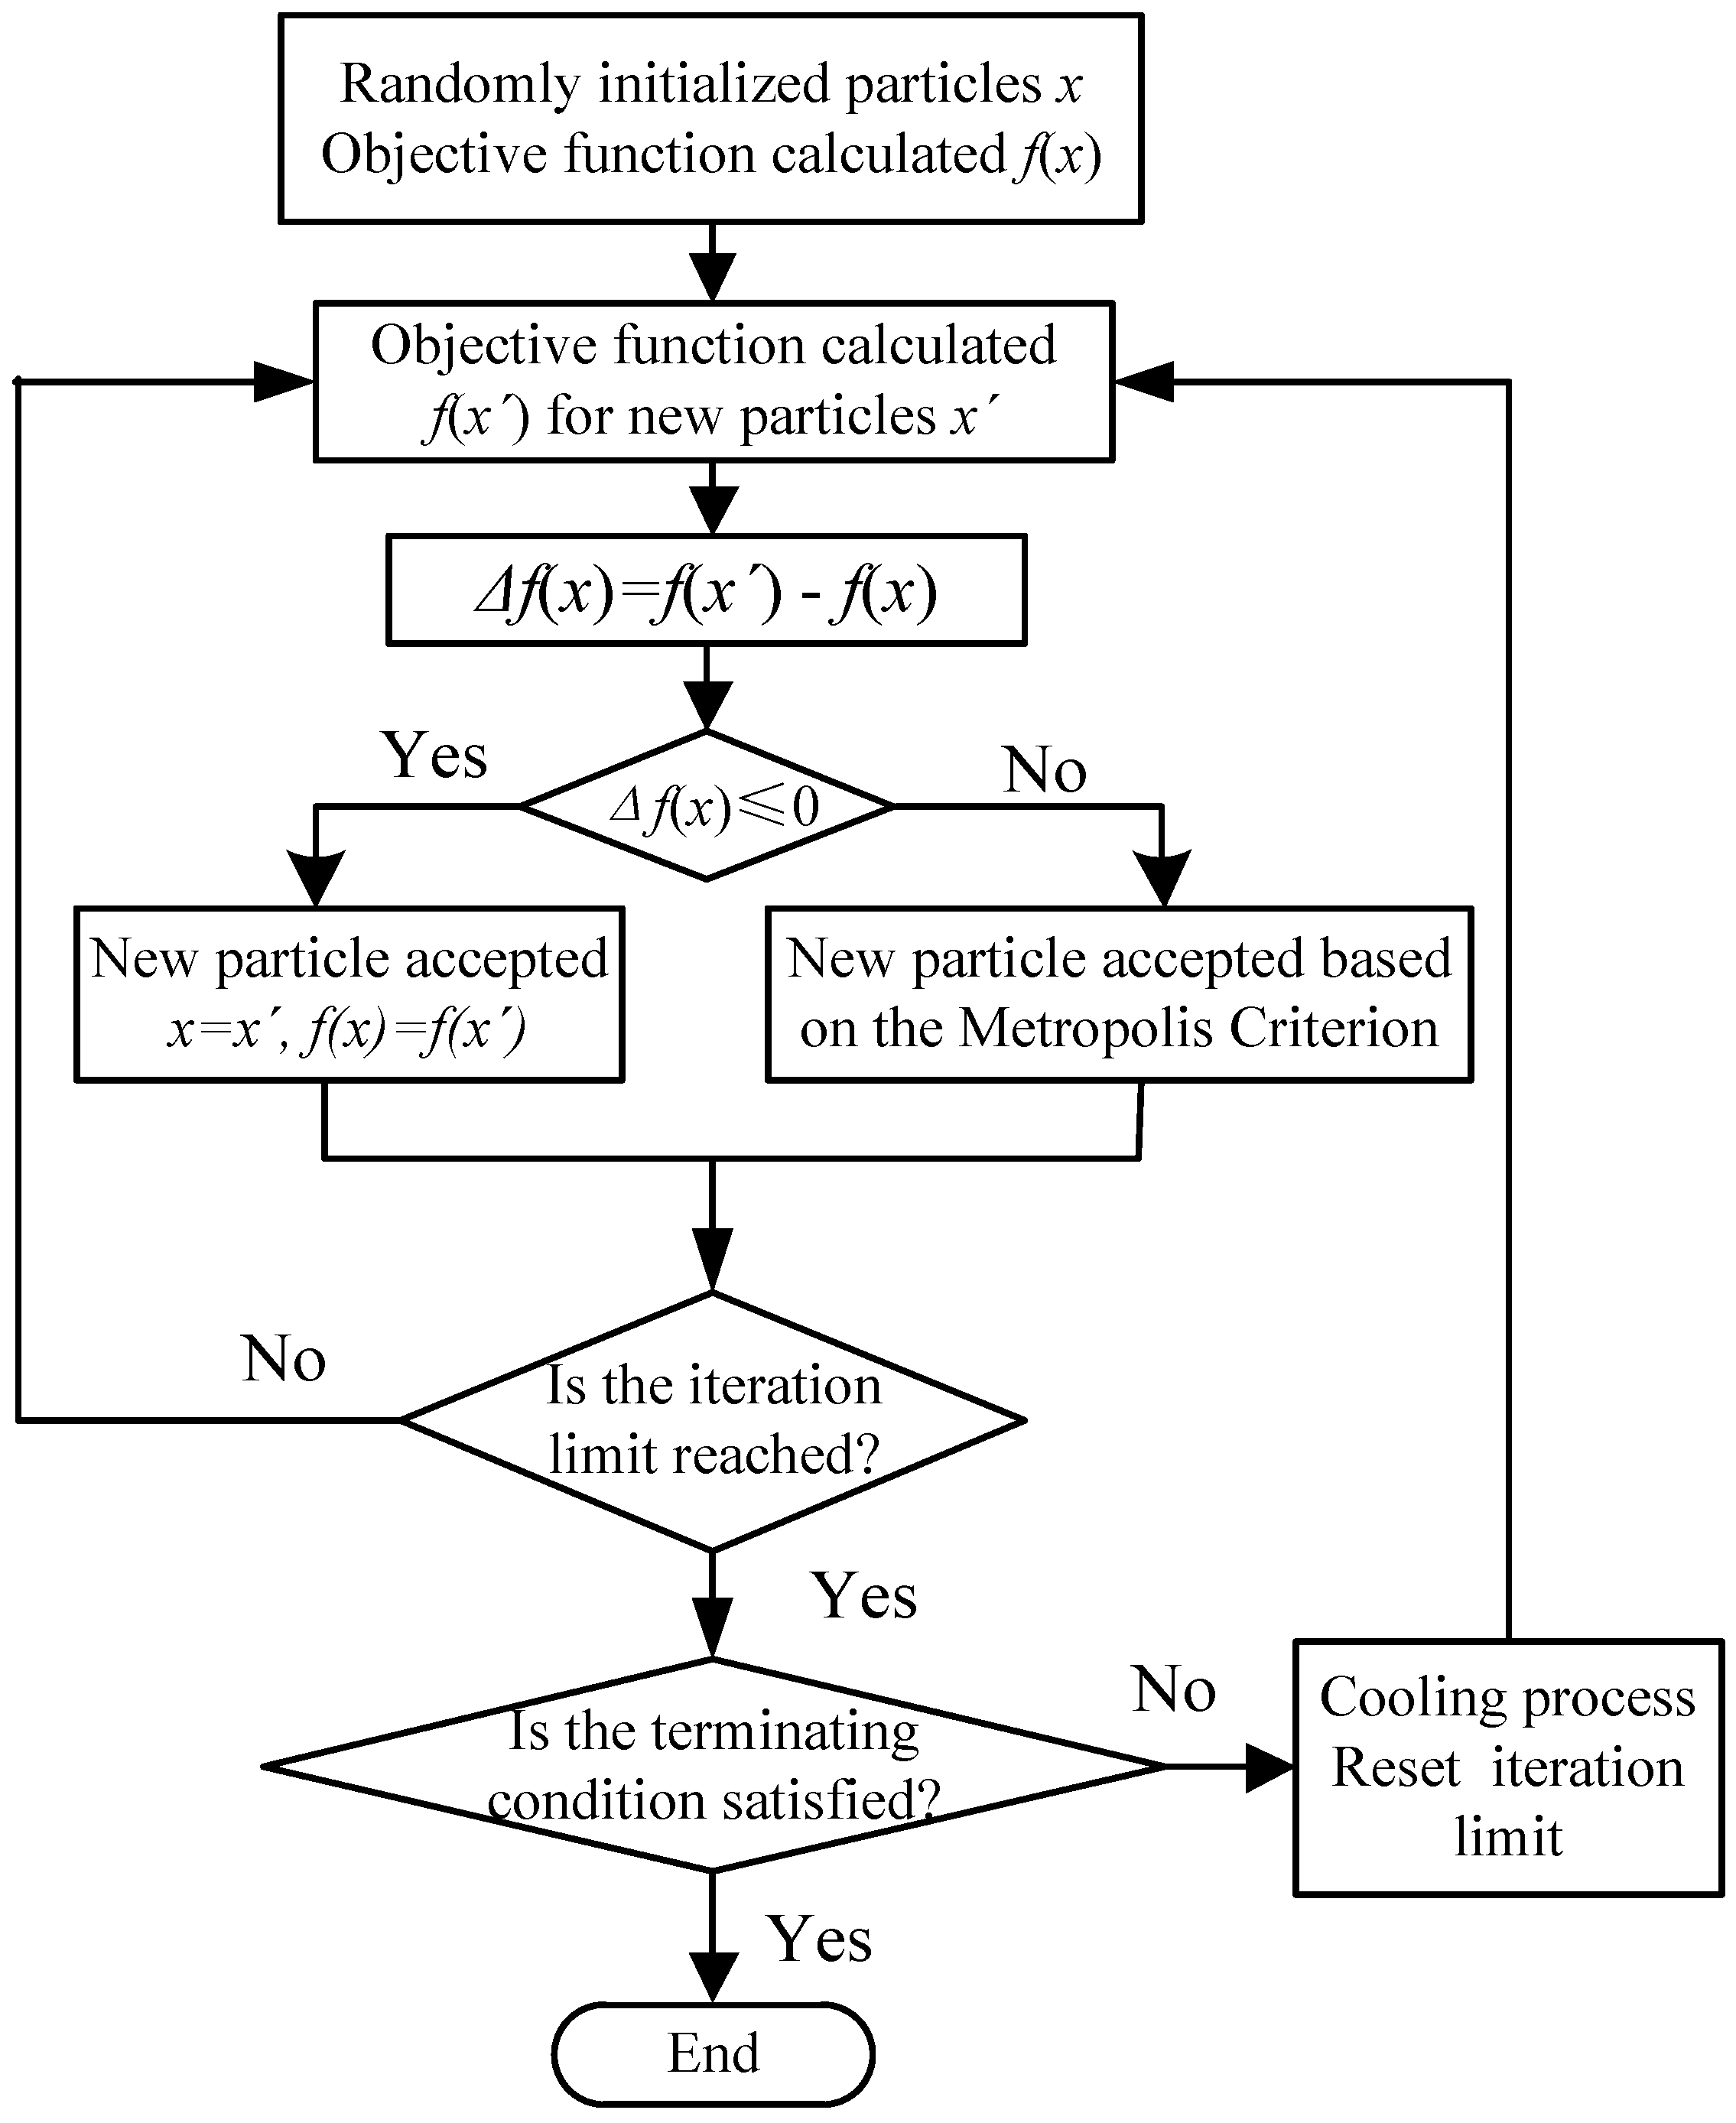
3.5. Parameter Optimization for HEV Based on Simulated Annealing Particle Swarm Optimization Algorithm

The SA-PSO algorithm, firstly introduced by Metropolis et al. [29], is an optimization algorithm which combines the PSO with the Simulated Annealing method. This method has high efficiency in searching the global minimum value and the characteristics that it is easily realizable and has the advantages of both SA and PSO algorithms [30]. The particle swarm will gravitate towards the optimum solution after continuous iterations. All particles’ positions and velocities are updated according to the following formulas:
v i t + 1 = w ( t ) v i t + c 1 r 1 ( p i t x i t ) + c 2 r 2 ( p g i t x i t )
x i t + 1 = x i t + v i t + 1
where p i t is the individual best optima for particle i after t iterations, p g i t is the group optima after t iterations, w ( t ) is the inertia weight, c1 and c2 are two positive constants, r1 ∈ [0, 1] and r2 ∈ [0, 1] are two random parameters independent of each other, v i t is the velocity of particle i in iterative t, and x i t is the position of particle i in iterative t.
Based on the above analysis, the complete SA-PSO algorithm flowchart is shown in Figure 4.
The detailed procedure of SA-PSO algorithm for parameter optimization is explained as follows:
  • Step 1: Initialize a group of random particles. The inertia should be chosen to provide a balance between the global and local exploration. The initialization consists of the following major parameters:
    • Generation number: 25 Constants; c1 and c2: 2.05, 2.05; Initial temperature T: 9000 °C; Final temperature T0: 0.05 °C; Anneal speed K: 0.9.
  • Step 2: Calculate and update the fitness function f(x) of all particles. Determine p i t and p g i t of the current generation. Update new velocities and positions of each particle according to Equations (3) and (4).
  • Step 3: Calculate the difference between the optimal and non-optimal function value Δf(x). Accept the optimal solution if Δf(x) is greater than 0, otherwise generate a random number r within (0, 1). When r is lower than min [ 1 , exp ( Δ f ( x ) / t ) ] , accept the optimal solution and go to Step 2, or go to the next step.
  • Step 4: Introduce the simulated annealing mechanism. Stop the program and output the optimal solution if the convergence criteria is satisfied, otherwise carry out the annealing process and the command “T = 0.9 × T”.

3.6. Simulation of Optimal Parameters Based on Multiple Driving Cycles

The simulation studies for the vehicle fuel economy are carried out using the Matlab/Simulink platform. The selected six types of driving cycles (HWFET, FTP, LA92, US06_HWY, UDDS, SC03) are successively combined into a comprehensive cycle according to driving cycles. The time-speed relationship of the comprehensive driving cycle is shown in Figure 5. The eight parameters of the power system and control strategy are optimized by the SA-PSO algorithm based on the comprehensive driving cycle, and the optimization results of the parameters are shown in Table 7.
The optimized parameters satisfy the requirements of vehicle dynamic performance. The variation of the battery SOC and engine operation points of HEVs are simulated under the comprehensive cycle conditions, as shown Figure 6 and Figure 7. The variation of battery SOC stays within 0.05 which meets the requirements for HEV in terms of the battery SOC consistency. Meanwhile, the battery SOC always fluctuates around the initial SOC value, which enables the battery to work in its high charging/discharging efficiency region. Furthermore, the engine can work in its high efficiency region and the vehicle can be driven in the electric driving mode with low speed and torque, which effectively improves the overall efficiency of whole system.

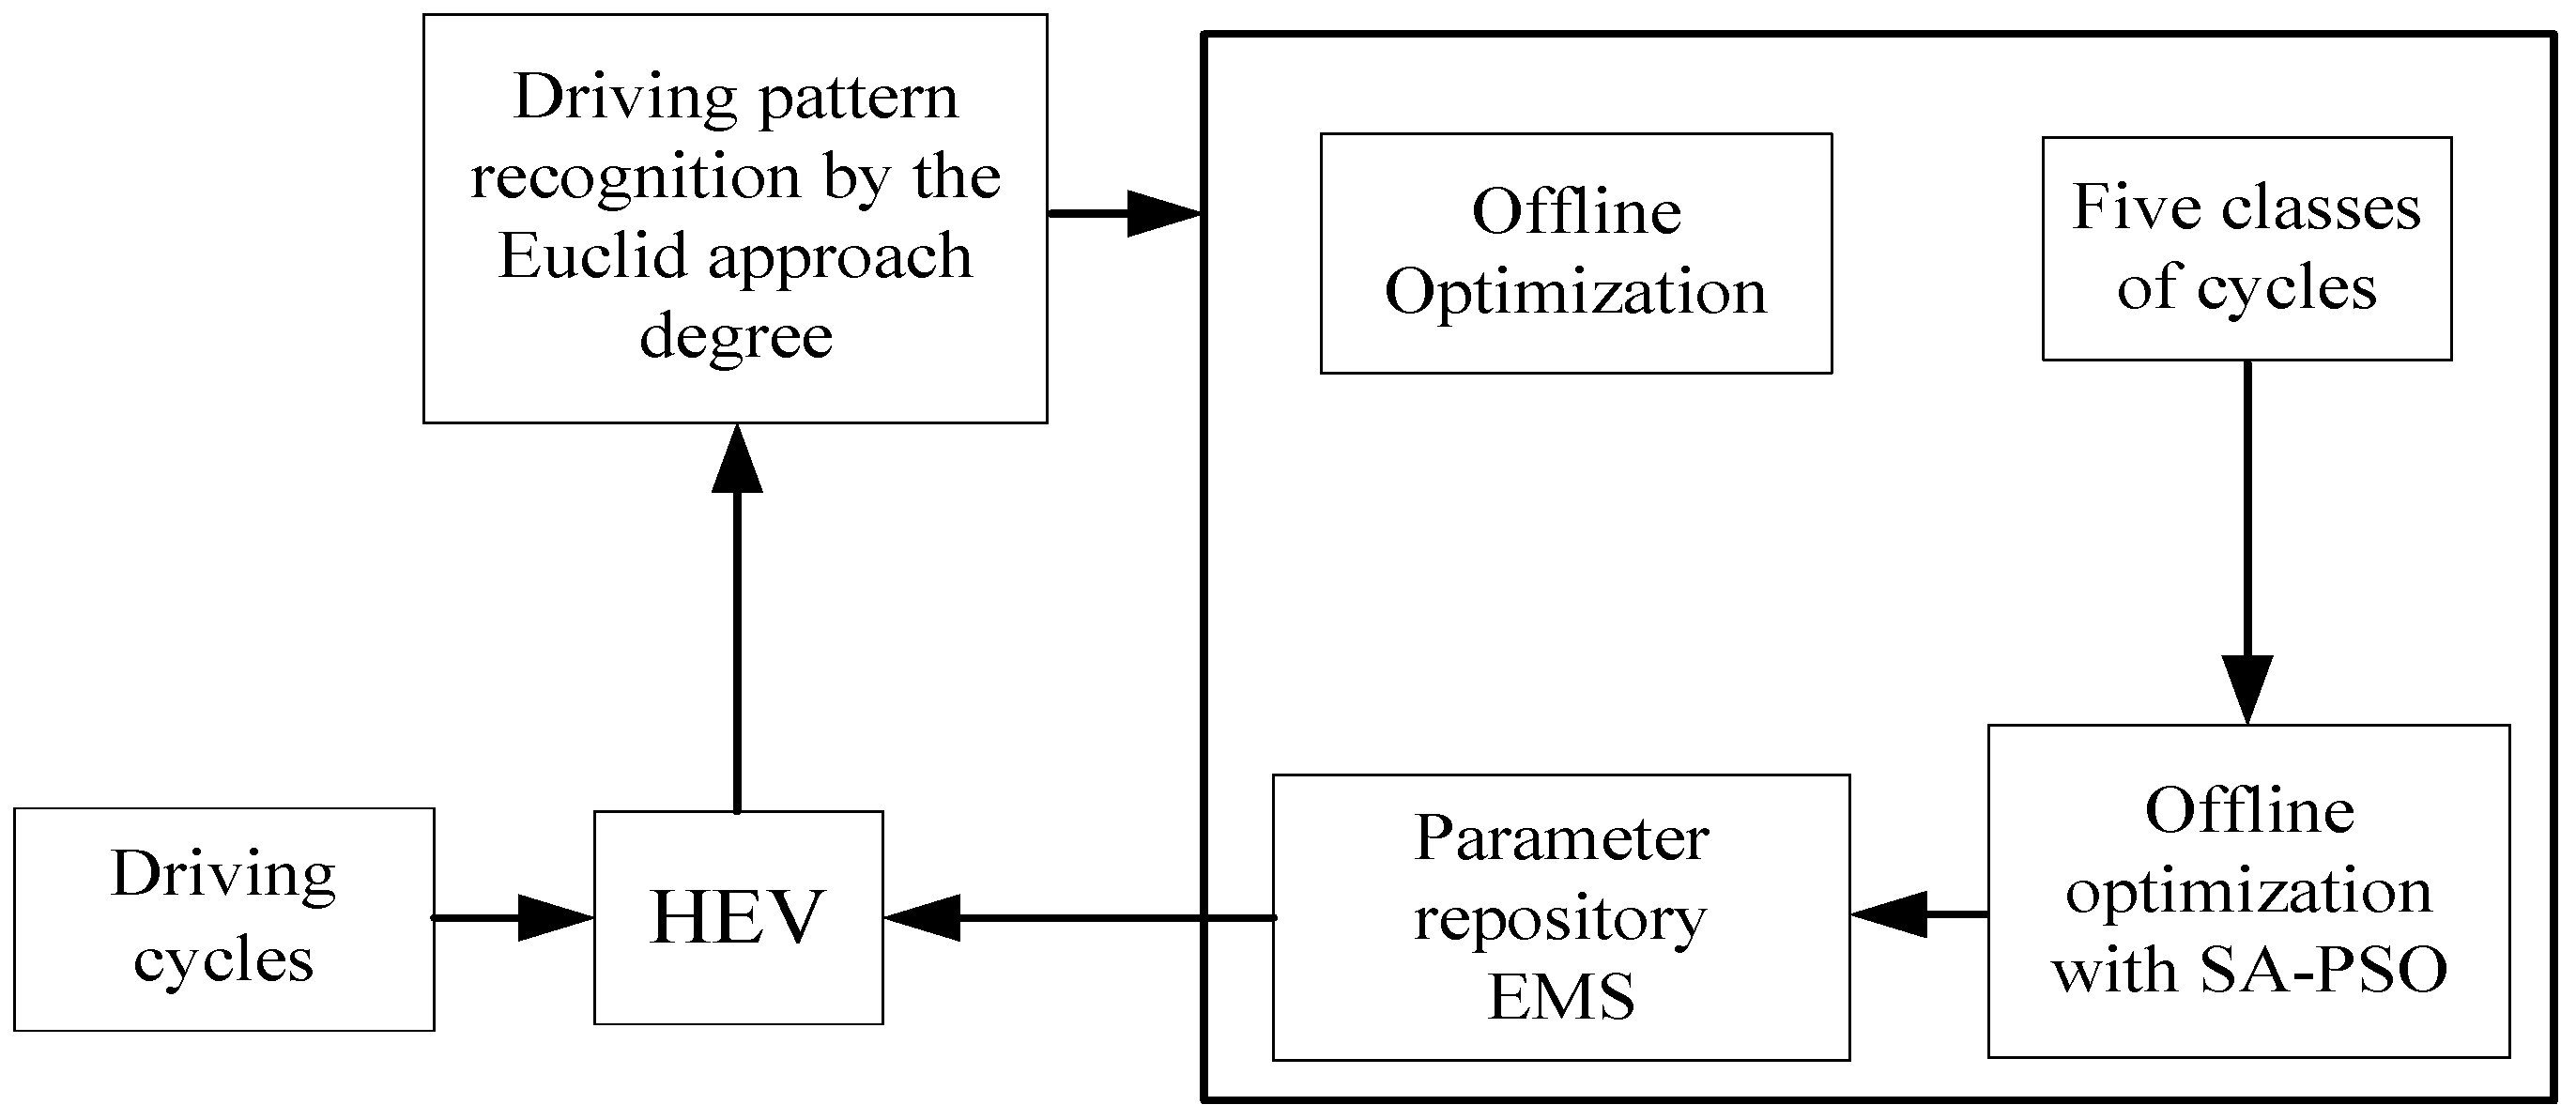
4. HEV Dynamic Control Strategy Based on Driving Pattern Recognition

As mentioned above, the control parameters optimization based on multiple driving cycles is analyzed under known driving cycle conditions. However, in practice, the vehicle actual driving cycle is a random and uncertain process. In order to achieve better fuel economy, the EMS of HEVs based on driving pattern recognition is proposed after the parameter optimization under multiple driving cycles, which can optimize the control parameters in vehicle real-time control.
The diagram of EMS for HEVs based on driving pattern recognition is shown in Figure 8. Firstly, the characteristic parameters of different typical driving cycles are picked up, which are used for the clustering analysis. The control parameters of each class of the driving cycle are optimized offline based on multiple driving cycles as mentioned in Section 3. The driving pattern recognition has been realized using the Euclid approach degree. At last, the dynamic energy management control strategy for HEVs based on driving pattern recognition is achieved for vehicle real-time control.

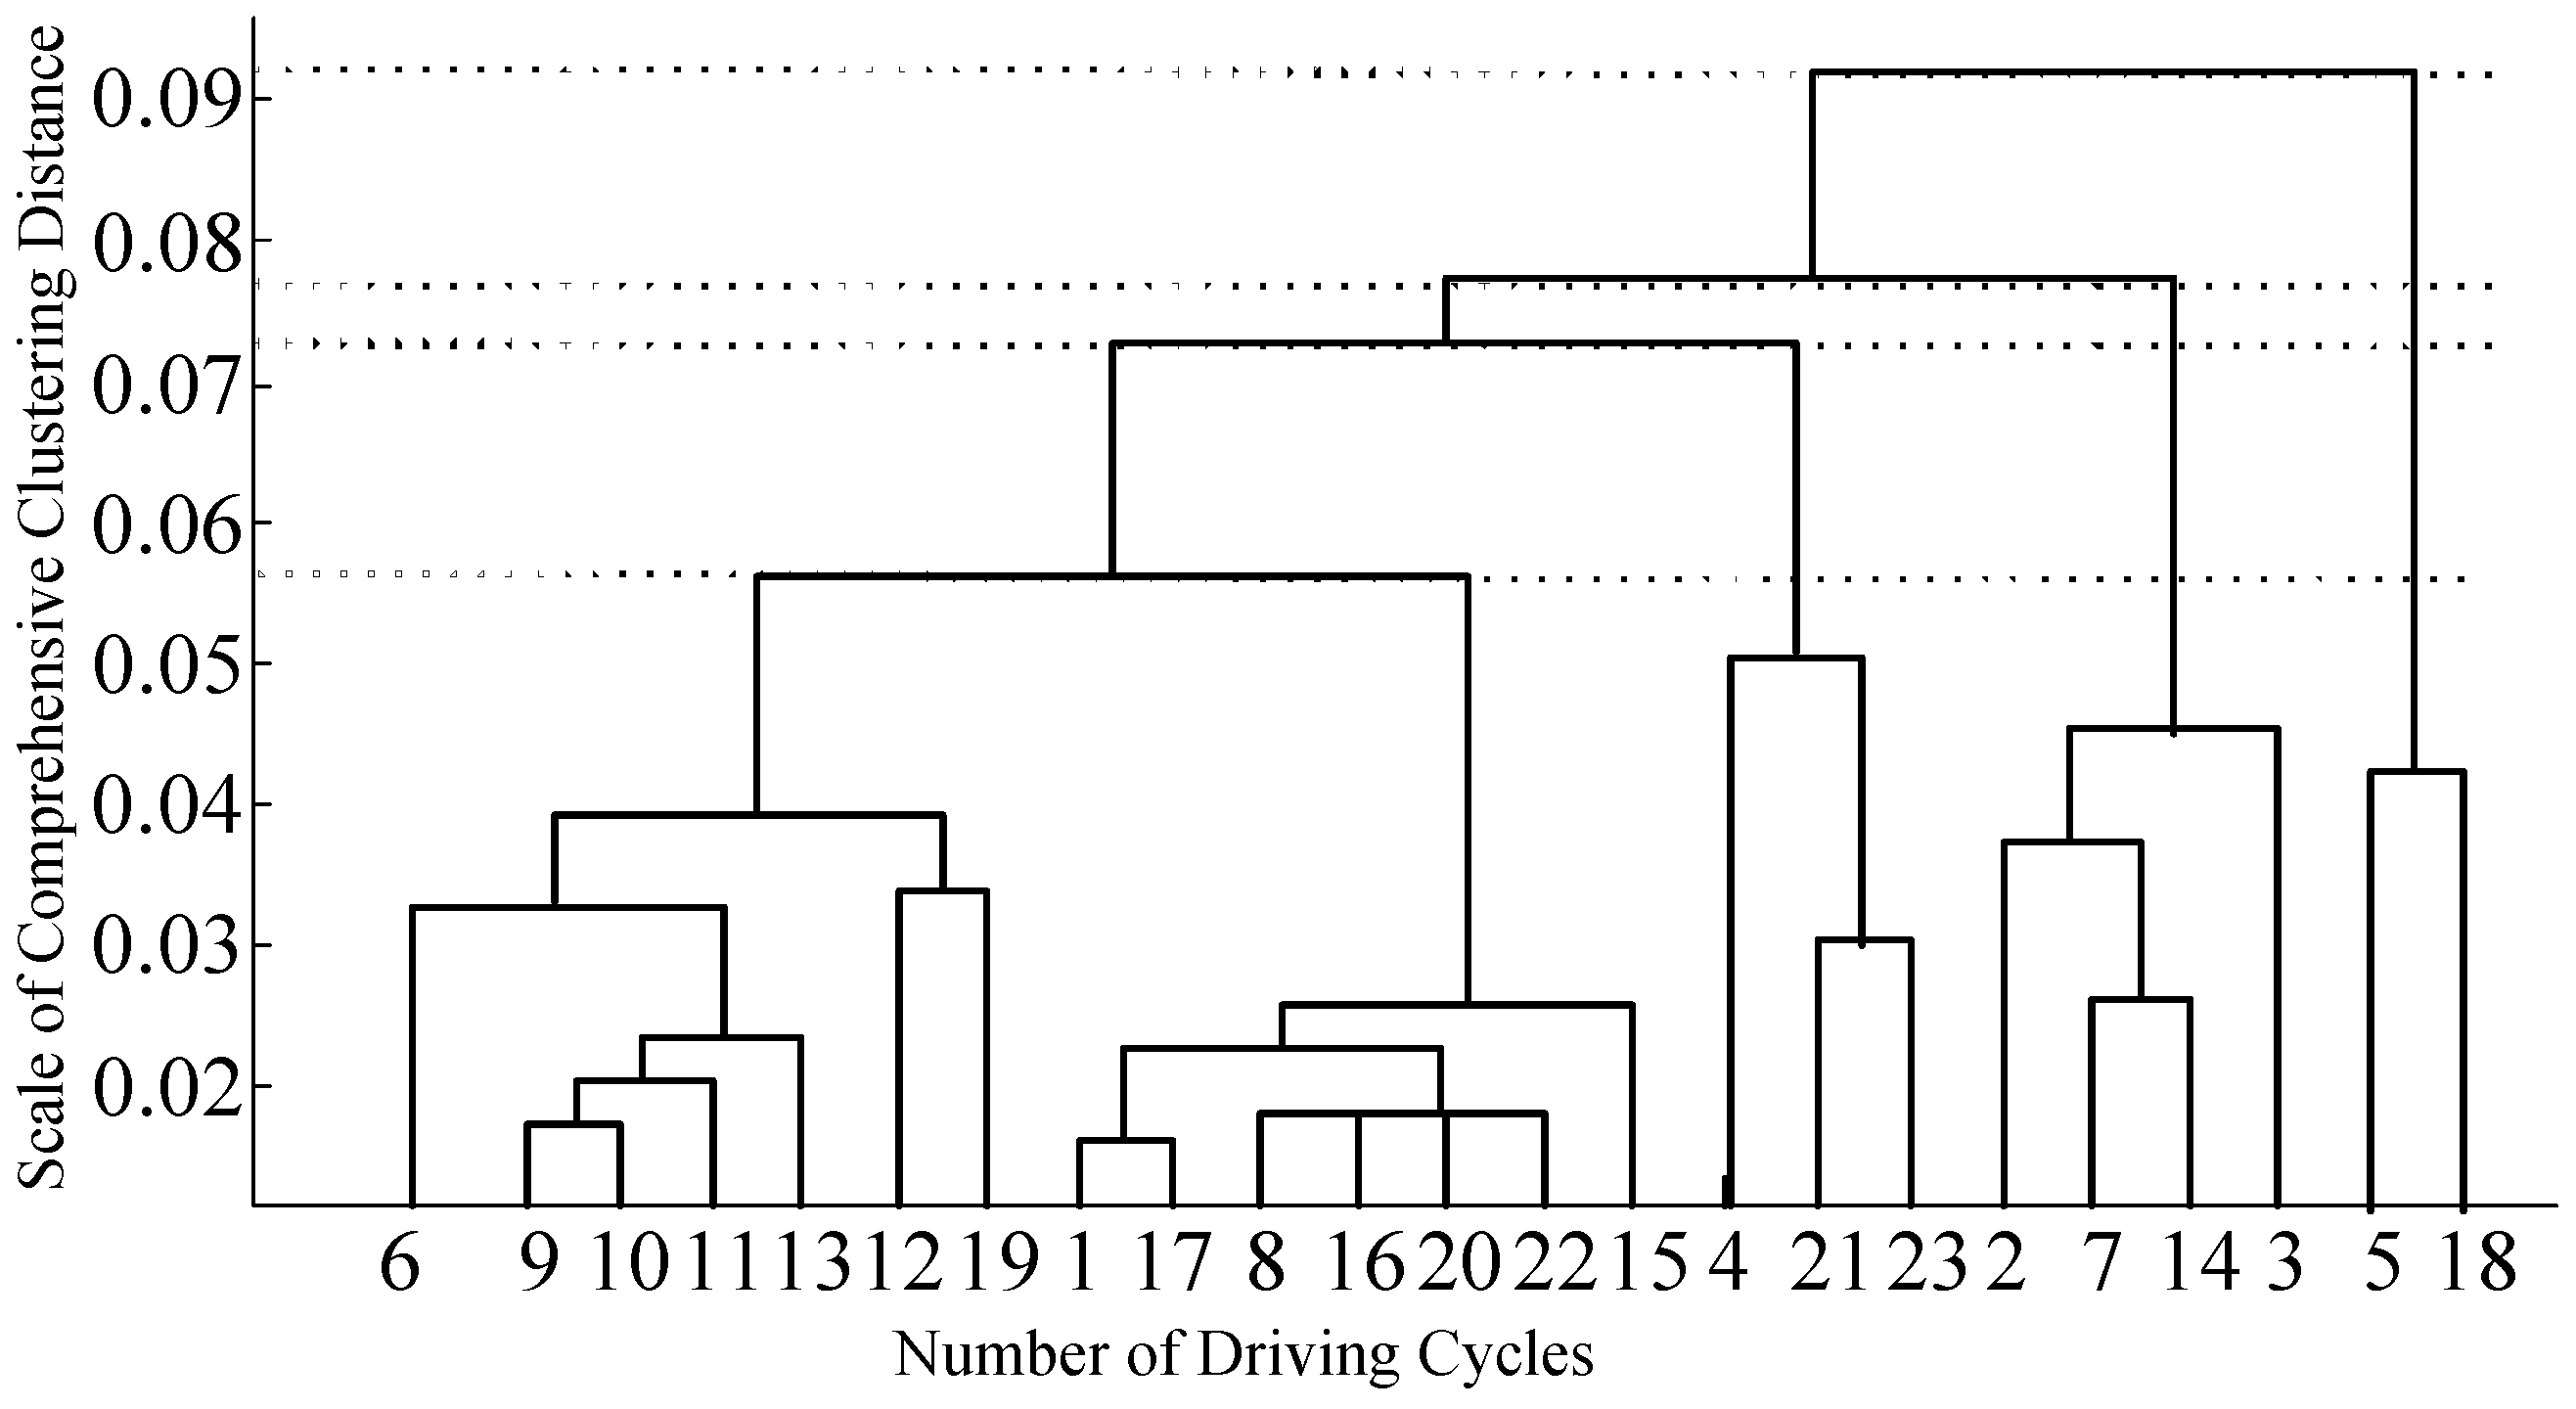
4.1. Selection and Classification of Characteristic Parameters for Typical Patterns

In view of the variety and complexity of vehicle driving patterns, it is significant to take all types of driving patterns into account. However, this is impractical due to the massive workload and limitation of calculation ability. Therefore, twenty-three typical driving cycles from ADVISOR are used as the research object. These driving cycles shown in Table 8 are Mode 1: JPN1015; Mode 2: ARTERIAL; Mode 3: CBD14; Mode 4: CBDTRUCK; Mode 5:COMMUTER; Mode 6: ECE_EUDC; Mode 7: HL07; Mode 8: LA92; Mode 9: MANHATTAN; Mode 10: NYCC; Mode 11: NYCCOMP; Mode 12: NYCTRUCK; Mode 13: NurembergR36; Mode 14: REP05; Mode 15: SC03; Mode 16: UDDS; Mode 17: UDDSHDV; Mode 18: US06_HWY; Mode 19: WVUCITY; Mode 20: WVUSUB; Mode 21: ARB02; Mode 22: ECE; Mode 23: IM240.
There have been some works in the literature about the selection of characteristic parameters for typical cycles [20,21,22,23,24]. Based on the relative importance of each parameter in driving pattern recognition, seven parameters are chosen as the characteristic parameters of driving pattern recognition in this paper. They are the maximum vehicle speed vmax, average vehicle speed vavg, maximum acceleration amax, maximum deceleration dmax, average acceleration aavg, average deceleration davg and engine idle time ratio ri, respectively. The clustering analysis is used for classification of the typical cycles. The distance between each two driving patterns of the twenty-three typical ones is calculated by the characteristic parameters with Euclidean distance, as expressed by Equation (5):
{ y i y j = ( y i 1 y j 1 ) 2 + ( y i 2 y j 2 ) 2 + ... + ( y i m y j m ) 2                             = m = 1 10 ( y i m y j m ) 2 i j i , j Z + i , j [ 1 , 23 ]
Before the calculation, the feature matrix of driving cycles and under-recognition cycles should be dealt with by min–max Normalization due to the inconsistency between the physical dimension and quantity of feature vectors of driving cycles, as described in Equation (6):
y i = y i y min y max y min
where yi is the original variable, ymin is the minimum value of unscaled variable and ymax is the maximum value of an unscaled variable. The feature vectors are scaled to the closed interval [0, 1].
The clustering-feature tree shown in Figure 9 is obtained through Statistical Product and Service Solutions (SPSS) software (20.0, IBM SPSS, New York, NY, USA). As the clustering scale of samples decreases and the sample space is more subtly divided, the driving cycles of each category become higher. In this paper, in order to ensure the similarity of each driving cycle and the accuracy of the classes, the twenty-three types of typical driving patterns are divided into five classes when the scale of clustering distance is 0.057 (the first class includes 6, 9–13, 19; the second class includes 1, 8, 17, 20, 22; the third class includes 4, 21, 23; the forth class includes 3, 7, 14; the five class includes 5 and 18).

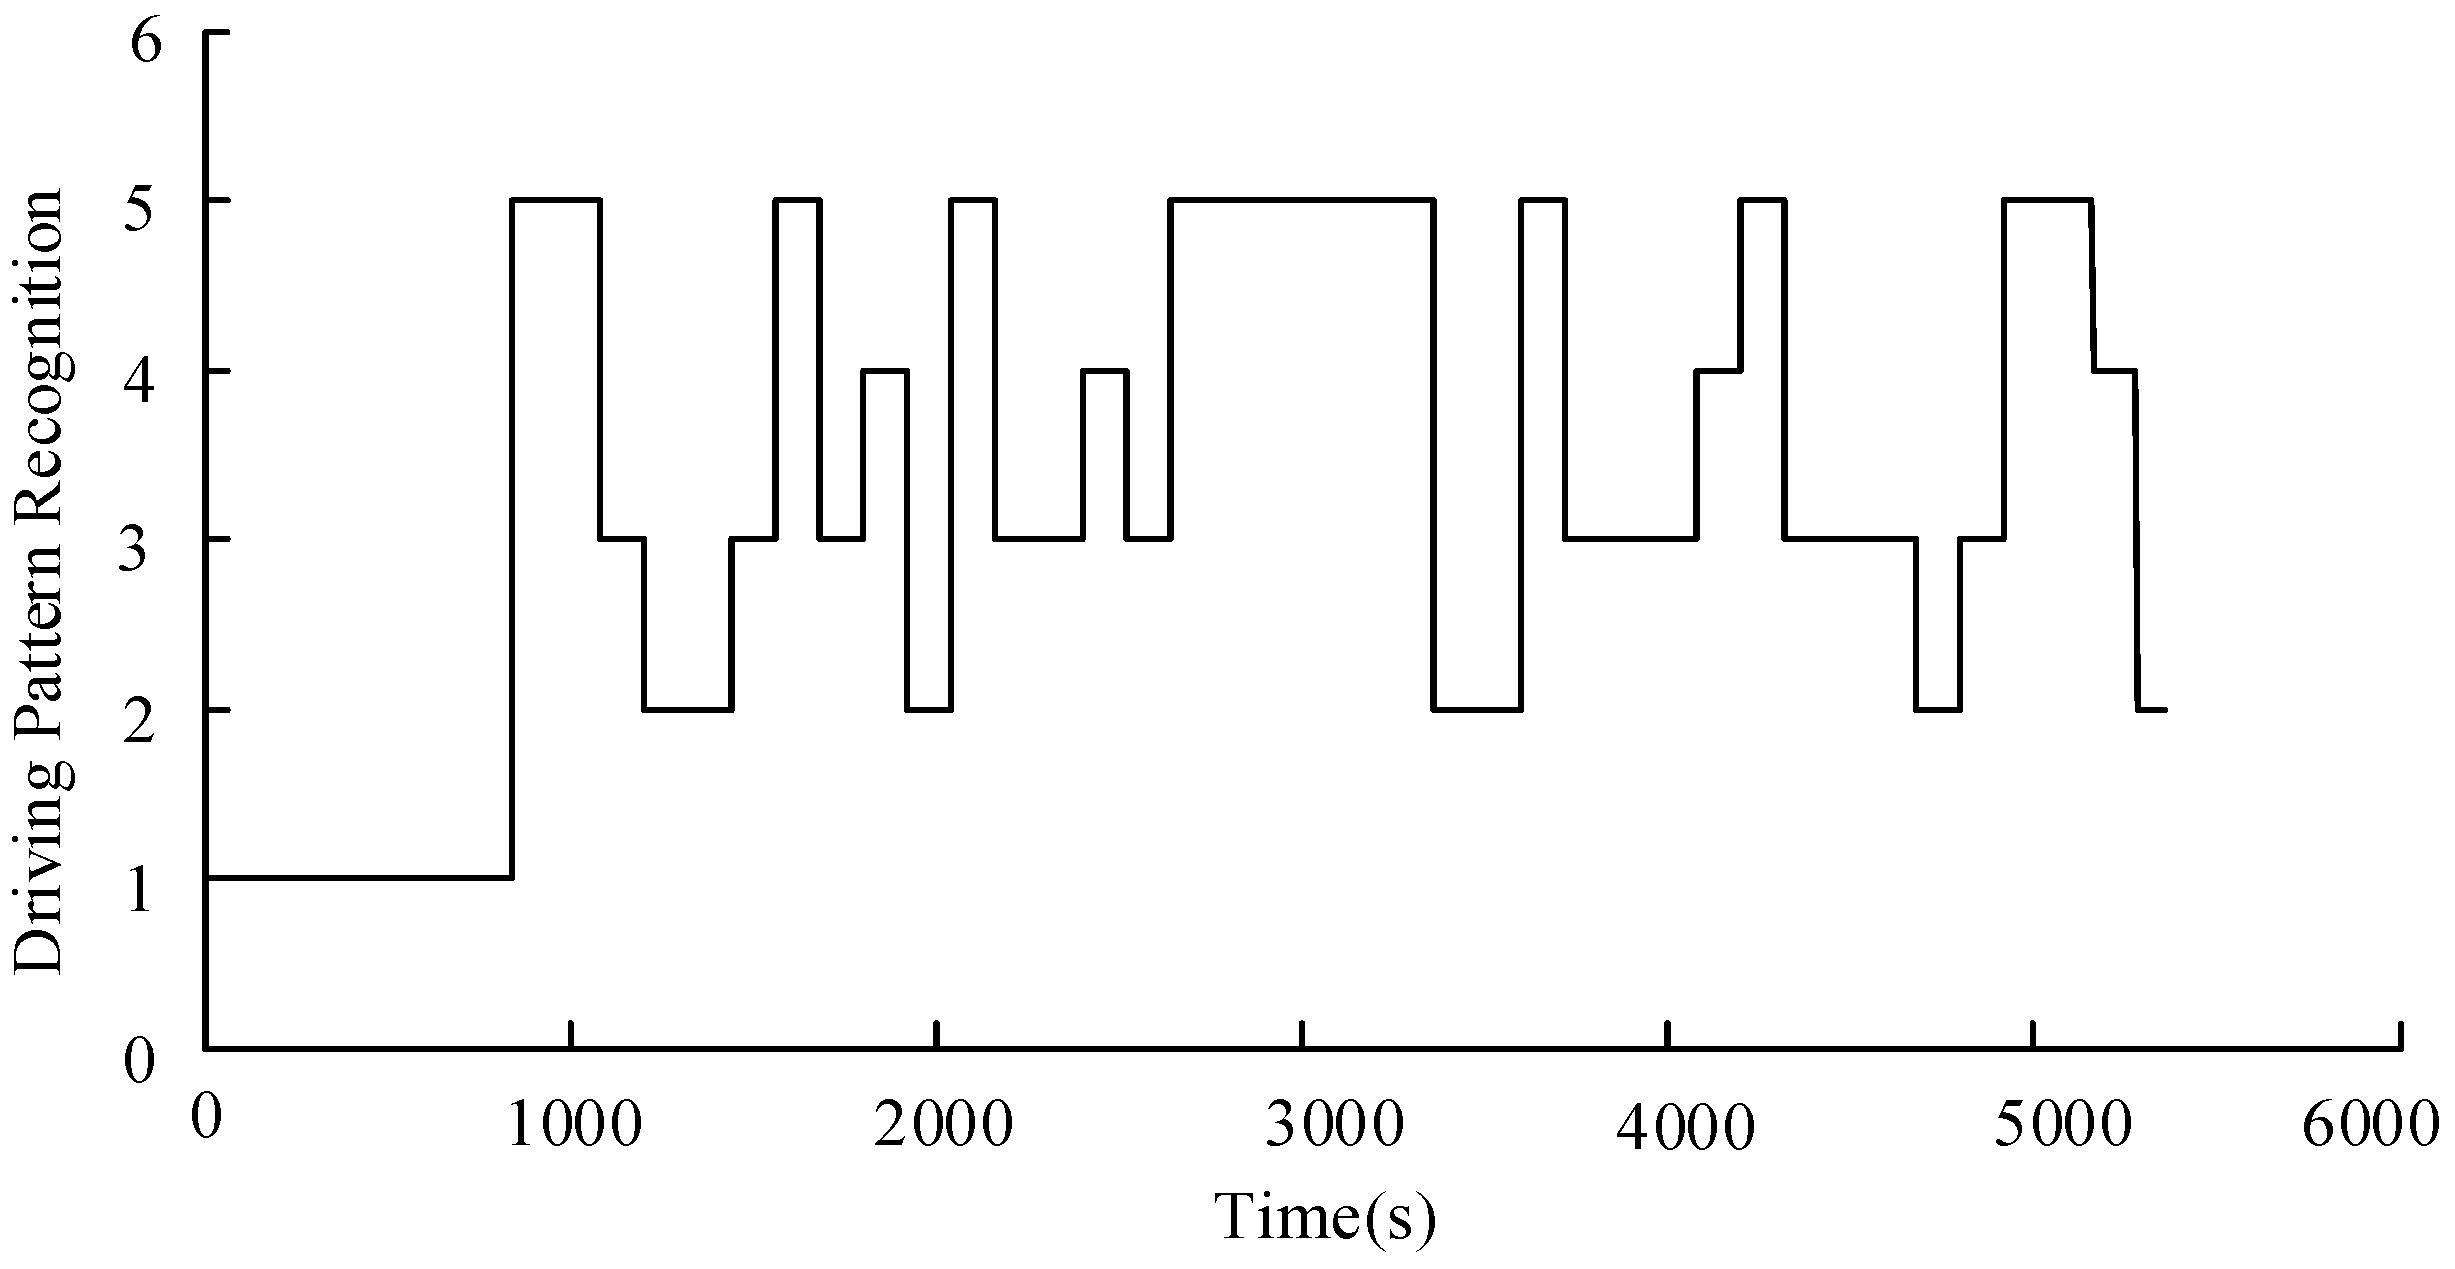
4.2. Recognition and Parameter Optimization of Driving Patterns

Although the actual vehicle driving patterns are random and uncertain, one of the twenty-three typical patterns can be selected to represent the actual driving pattern with the maximum similarity as the recognition result, and this is the basic idea of the dynamic control strategy for HEVs.
The driving pattern recognition is achieved using the Euclid approach degree. The representative feature vector An (n = 1, 2, …, 23) stands for the selected twenty-three reference driving patterns, and each vector contains seven characteristic parameters of the reference driving patterns shown in Table 8. The vector B also contains seven characteristic parameters of the driving patterns. The distance between the feature vector of actual driving pattern and reference feature vectors is calculated by the Euclidean distance σ (An, B):
σ ( A n , B ) = 1 1 m ( k = 1 m ( A n ( k ) B ( k ) ) 2 ) 1 2
where m is the number of the characteristic parameters (m = 7). In order to eliminate the deviation caused by different parameter units, parameters are standardized using the method of Maximum magnitude of 1.
The driving pattern showing the maximum similarity is recognized as the reference driving cycle as expressed:
σ ( B , A i ) = max { σ ( B , A 1 ) , σ ( B , A 2 ) , ... , σ ( B , A n ) }
As shown in Equation (8), the result of driving pattern recognition means that the historical actual driving pattern B belongs to the driving pattern Ai. In order to verify the effectiveness of driving pattern recognition, a comprehensive test driving cycle is established to represent the actual driving pattern. The comprehensive test driving cycle consists of five different types of typical cycles including NEDC, LA92, HWFET, UDDS and US06, as shown in Figure 10. An algorithm for real-time driving pattern recognition is proposed based on the assumption that the driving pattern will not change suddenly within a short period of time. This real-time driving pattern recognition algorithm can predict future driving cycles through the past sampling data analysis within a short time window. The time window for the information extraction of characteristic parameters is 120 s based on the research as presented in [31,32]. The recognition of driving patterns for each time window is realized using the Euclid approach degree. The result of driving pattern recognition under the comprehensive test driving cycles is shown in Figure 11.

4.3. Optimization of Control Parameters Based on Driving Pattern Recognition

In this section, the control parameters (Flow, Fup, Foff and V1) of each class have been optimized based on multiple driving cycles, which has been introduced in Section 3 in detail. The optimization results of control parameters of each class are shown in Table 9.
In order to verify the effectiveness of the control parameter optimization, the driving cycles of the first class is taken as an example. The seven typical driving cycles of the first class are set as a comprehensive driving cycle (ECE_EUDC + MANHATTAN + NYCC + NYCCOMP + NYCTRUCK + NurembergR36 + WVUCITY) as shown in Figure 12. The variation of battery SOCSOC) in the first class of driving cycles is shown in Figure 13 and Table 10, where the control parameters are effective in controlling the variation of battery SOC.

5. Simulation

The proposed dynamic control strategy for HEVs based on parameter optimization at multiple driving cycles and driving pattern recognition has been simulated using the Matlab/Simulink platform under the comprehensive driving cycle (NEDC + LA92 + HWFET + UDDS + US06).
As shown in Figure 14, the variation of battery SOC stays within 0.01 under comprehensive driving cycle conditions with the proposed EMS based on driving pattern recognition. Meanwhile, the battery SOC always fluctuates around the initial SOC during the whole process, which enables the battery maintain to work in the high efficiency region. Compared with the EMS without driving pattern recognition, the battery SOC variation is more reasonable.
Besides, the engine output power with the proposed EMS is generally larger than that with the EMS without driving pattern recognition, as shown in Figure 15. Therefore, the load of the engine is improved, which means that the engine will operate in higher efficient regions. The motor output torque at the comprehensive driving cycle is shown in Figure 16. The proposed EMS based on driving pattern recognition can adjust the control parameters to drive the vehicle in pure electric driving mode with low speed and torque, which prevents the engine from working in the low efficiency region and reduces fuel consumption. The reduction of the engine fuel consumption is shown in Figure 17.
The comparison results of fuel economy among control strategies of rule-based, multiple driving cycles optimization and driving pattern recognition are shown in Table 11 where Q100 is the fuel consumption of 100 km. For fuel economy comparison, SOC correction is very necessary. Therefore the SOC correction method in the SAE standards [33] is applied to compensate for the SOC difference. Compared with the rule-based control strategy, the fuel consumptions of energy management strategies based on multiple driving cycle optimization and driving pattern recognition are improved by 4.36% and 11.68%, respectively. Meanwhile the variation of battery SOC becomes smaller, which effectively improves the economic performance of the HEV vehicle.

6. Road Test on the Prototype Vehicle

The proposed dynamic control strategy for HEVs based on driving pattern recognition has been experimentally validated on a prototype HEV. The specifications of the prototype vehicle are shown in Table 12. The vehicle control software is developed on the Development to Production (D2P, DEV+PROD, Germany E.ON, Essen, Germany) and Matlab/Simulink platforms. The experiment is performed under the following conditions:
(1)
Since the prototype HEV can only be tested on campus, for the sake of safety, the road test is only carried out at the low speed. Although the campus condition is only classified as an urban driving cycle, it is still valid to analyze the effectiveness of the proposed optimization method of HEV control strategy.
(2)
The required torque during the whole test is too small compared with the maximum capacity of the HEV power system. To ensure that the vehicle operates in each mode without loss of generality, the parameters Foff = 0.20, Flow = 0.44, Fup = 0.64, Vl = 15 are designed as the optimal control strategy parameters according to the actual test conditions.
The results of the road test have been presented in Figure 18 where the vehicle speed ranges from 0 to 45 km/h. The operation modes include the electric driving mode, driving & charging mode, engine driving mode and hybrid driving mode. The prototype HEV operates at electric driving mode during the starting process, and the small required torque prevents the engine from working in the low efficiency region. The engine driving mode is mostly activated during cruising (30–35 km/h).
The effectiveness of the control strategy proposed in this paper is well verified, as seen in Figure 18. The engine can operate in the designed operating region, which effectively improves the system efficiency. Meanwhile, the battery SOC fluctuates smoothly and the magnitude of SOC variation is only 0.005, which well meets the requirements to keep the battery SOC as constant as possible. The engine is able to work in tandem with the motor, so as to improve the vehicle economy.
In order to show the effectiveness of the proposed algorithm better, the comparison results of road tests among different control strategies have shown in Table 13. However, during the different road rests, the vehicle can’t be ensured to operate under the same working conditions among the several road tests with different control strategies. Therefore, these comparison results are roughly taken as a reference.

7. Conclusions

(1)
A new methodology for parameter optimization under multiple driving cycles using SA-PSO algorithm is proposed to the simultaneous optimization for parameters of power system and control strategy. It’s beneficial to achieve the best fuel consumption without impairing the dynamic performance.
(2)
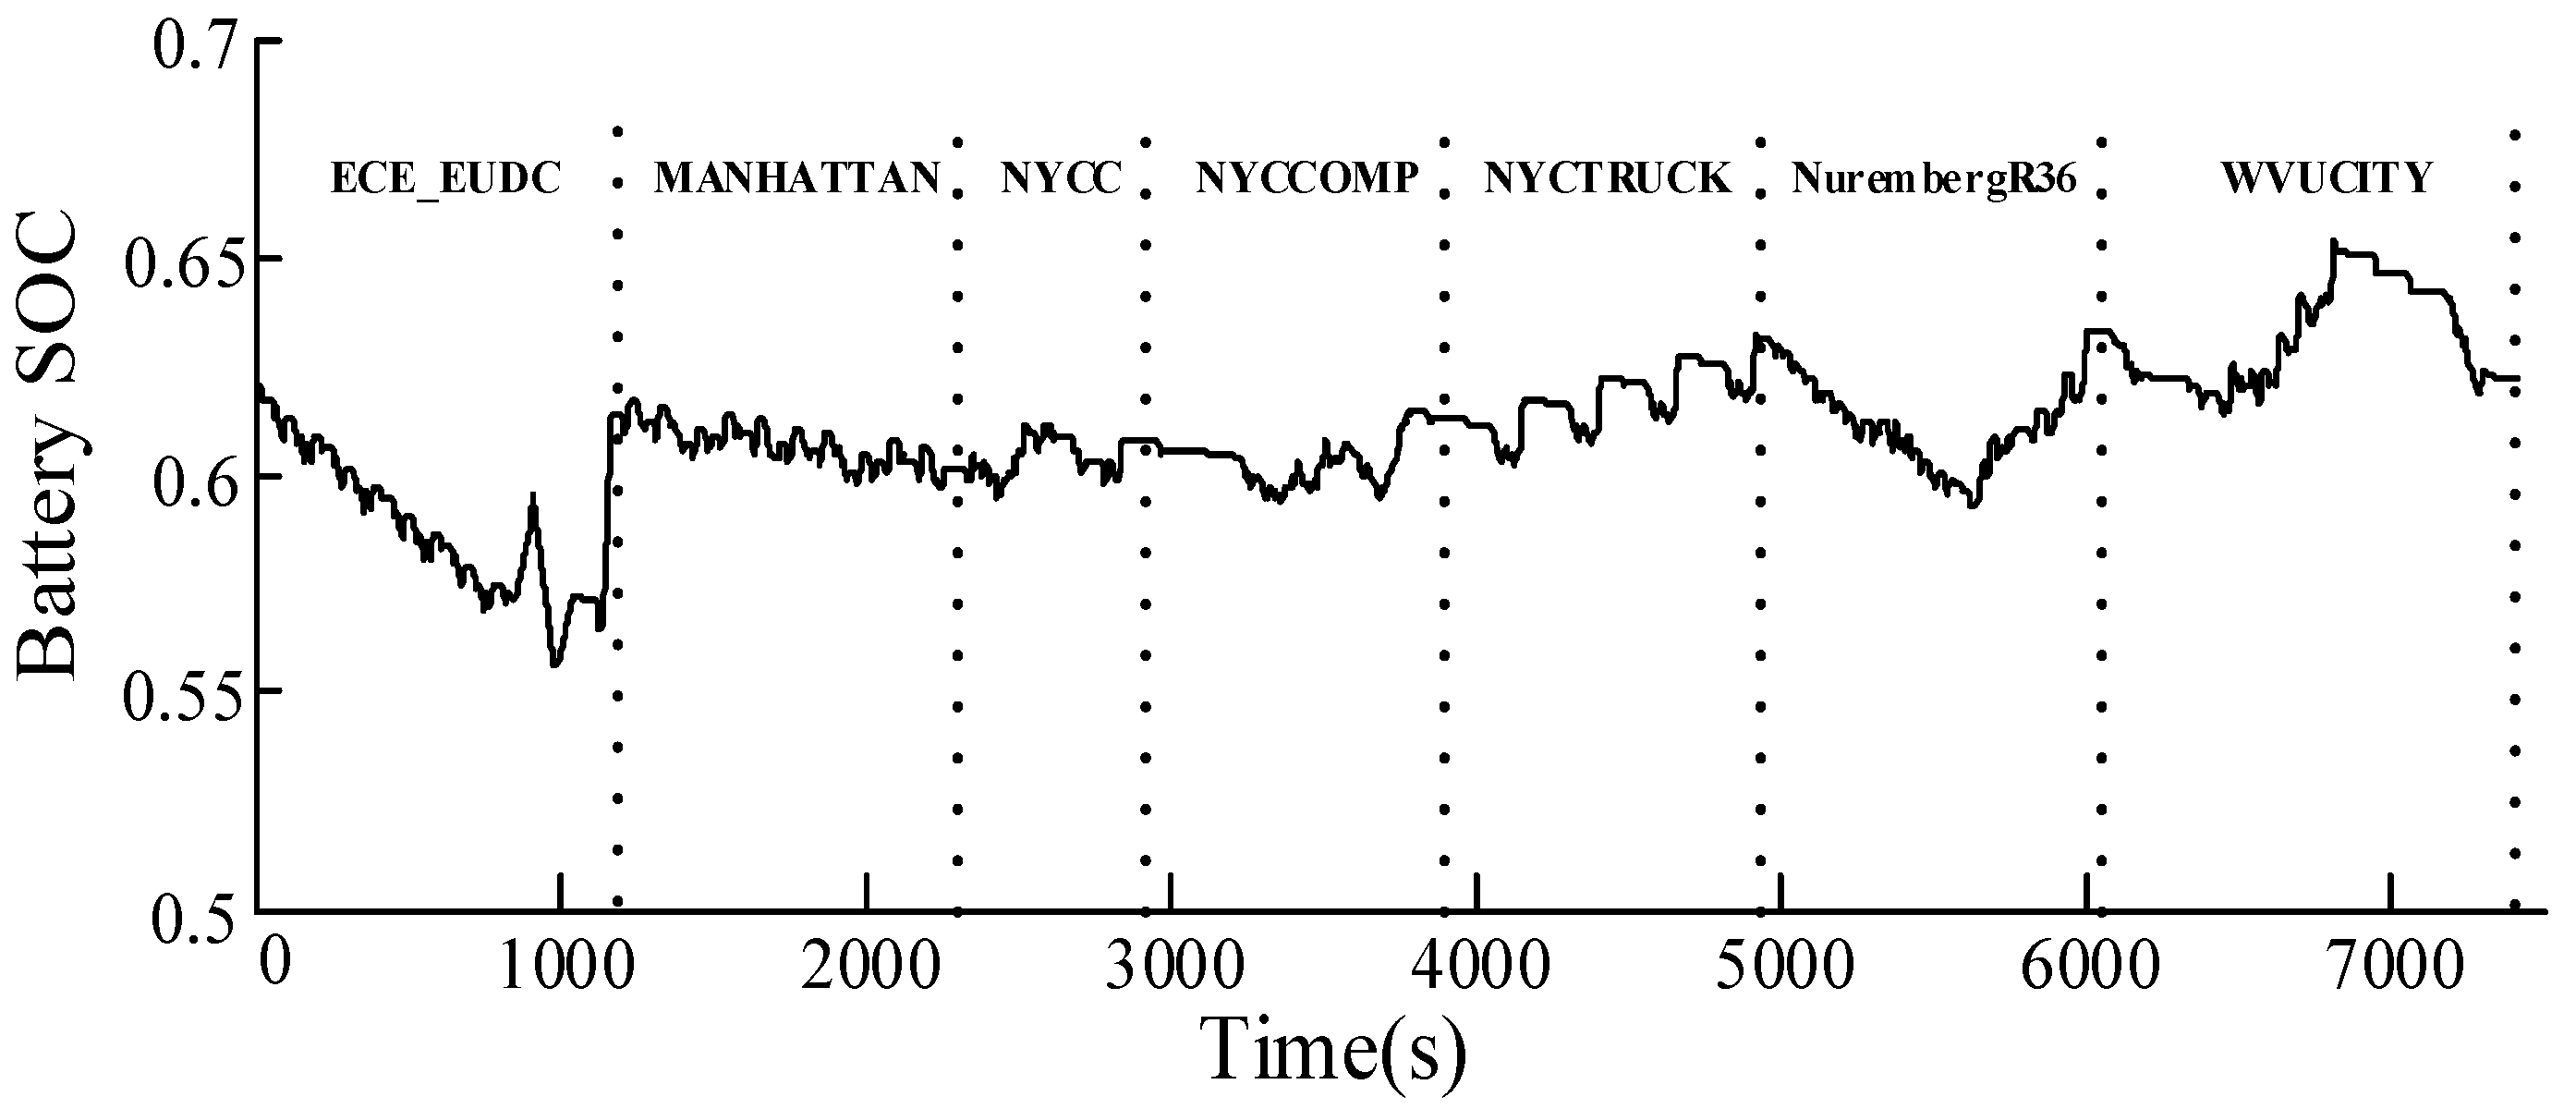
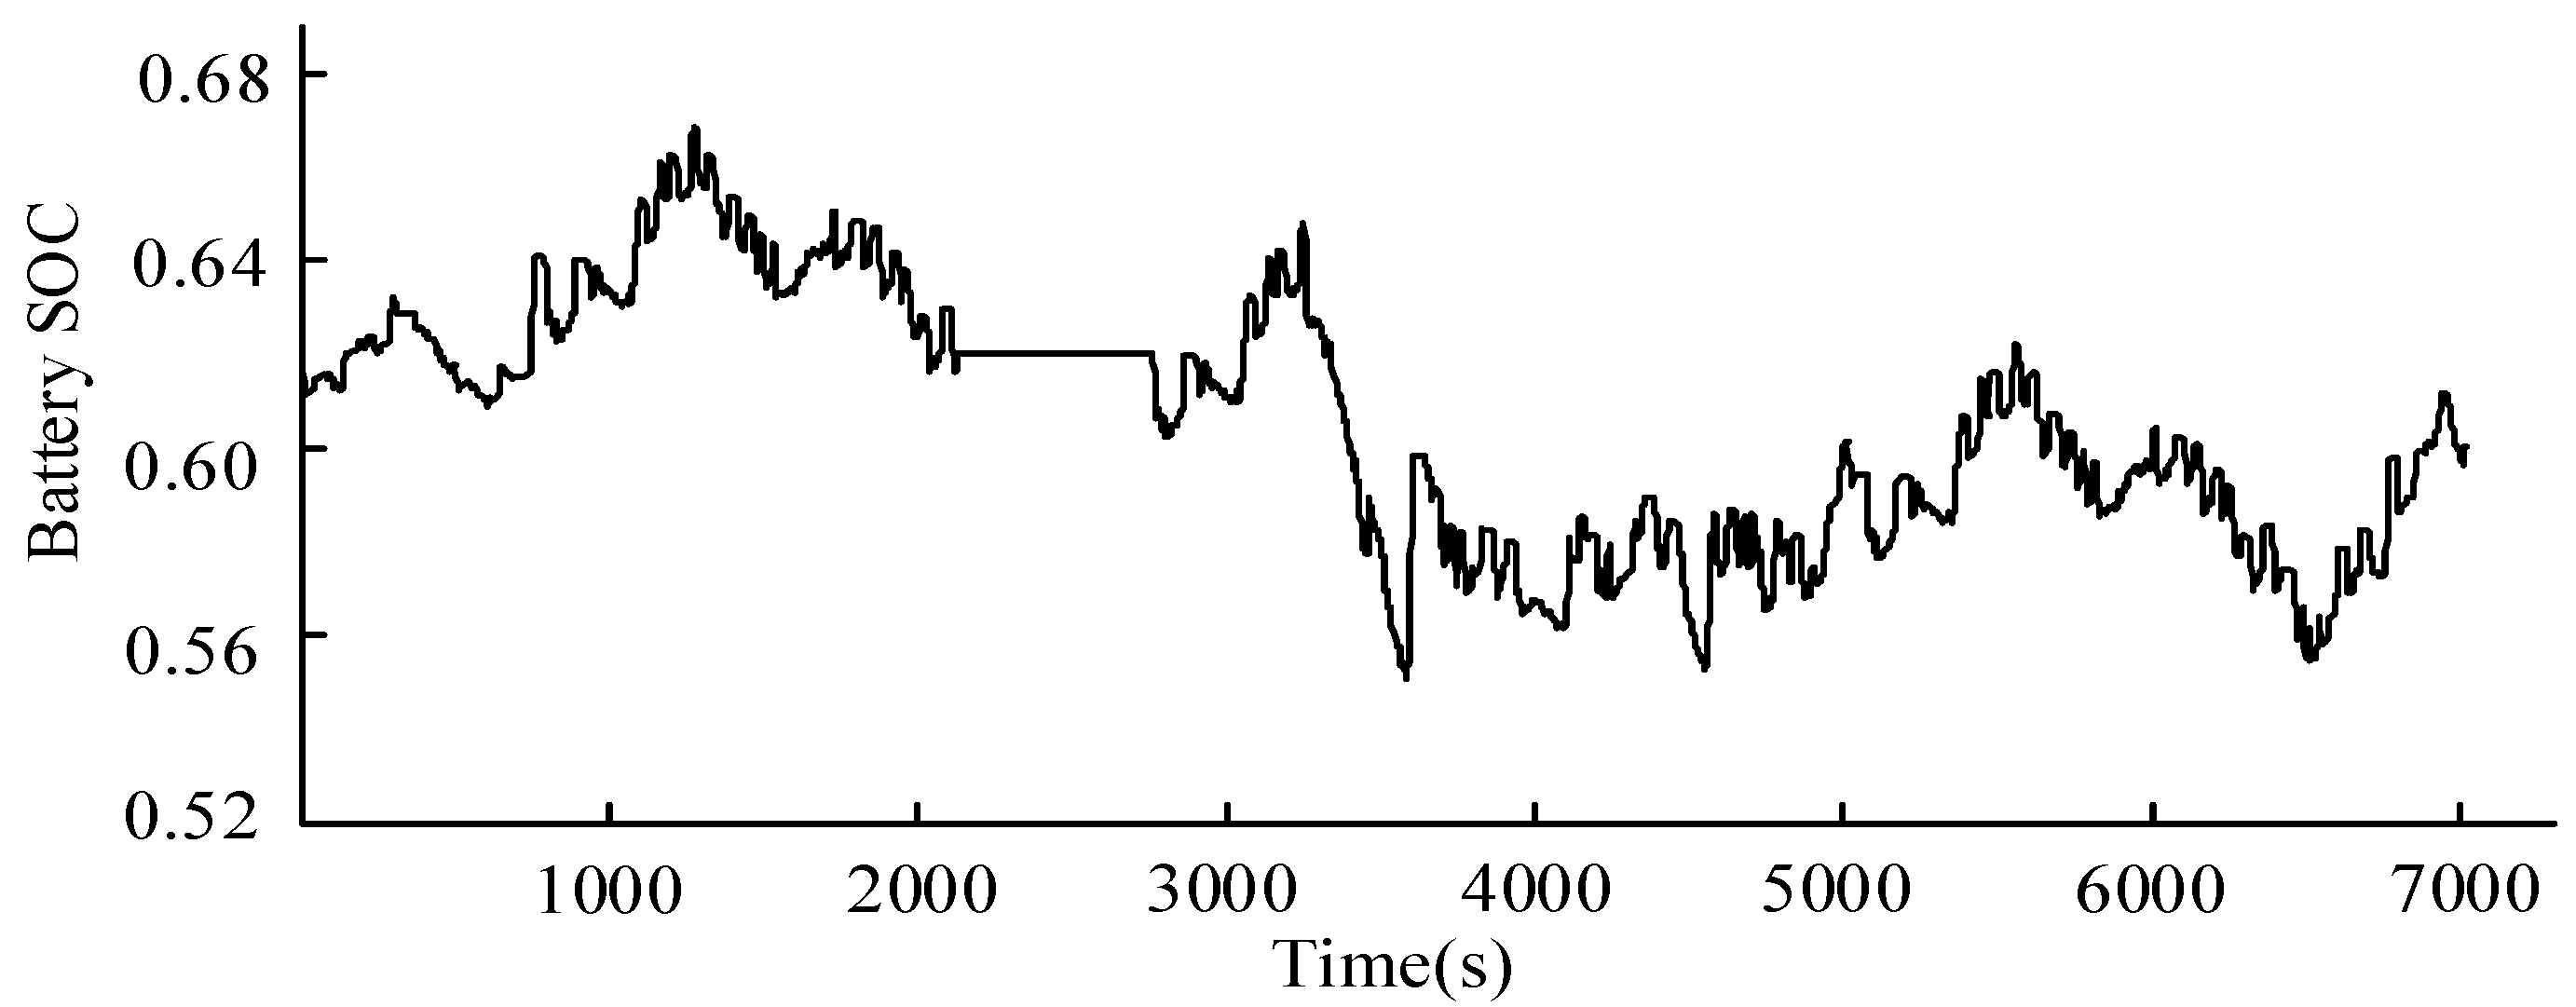
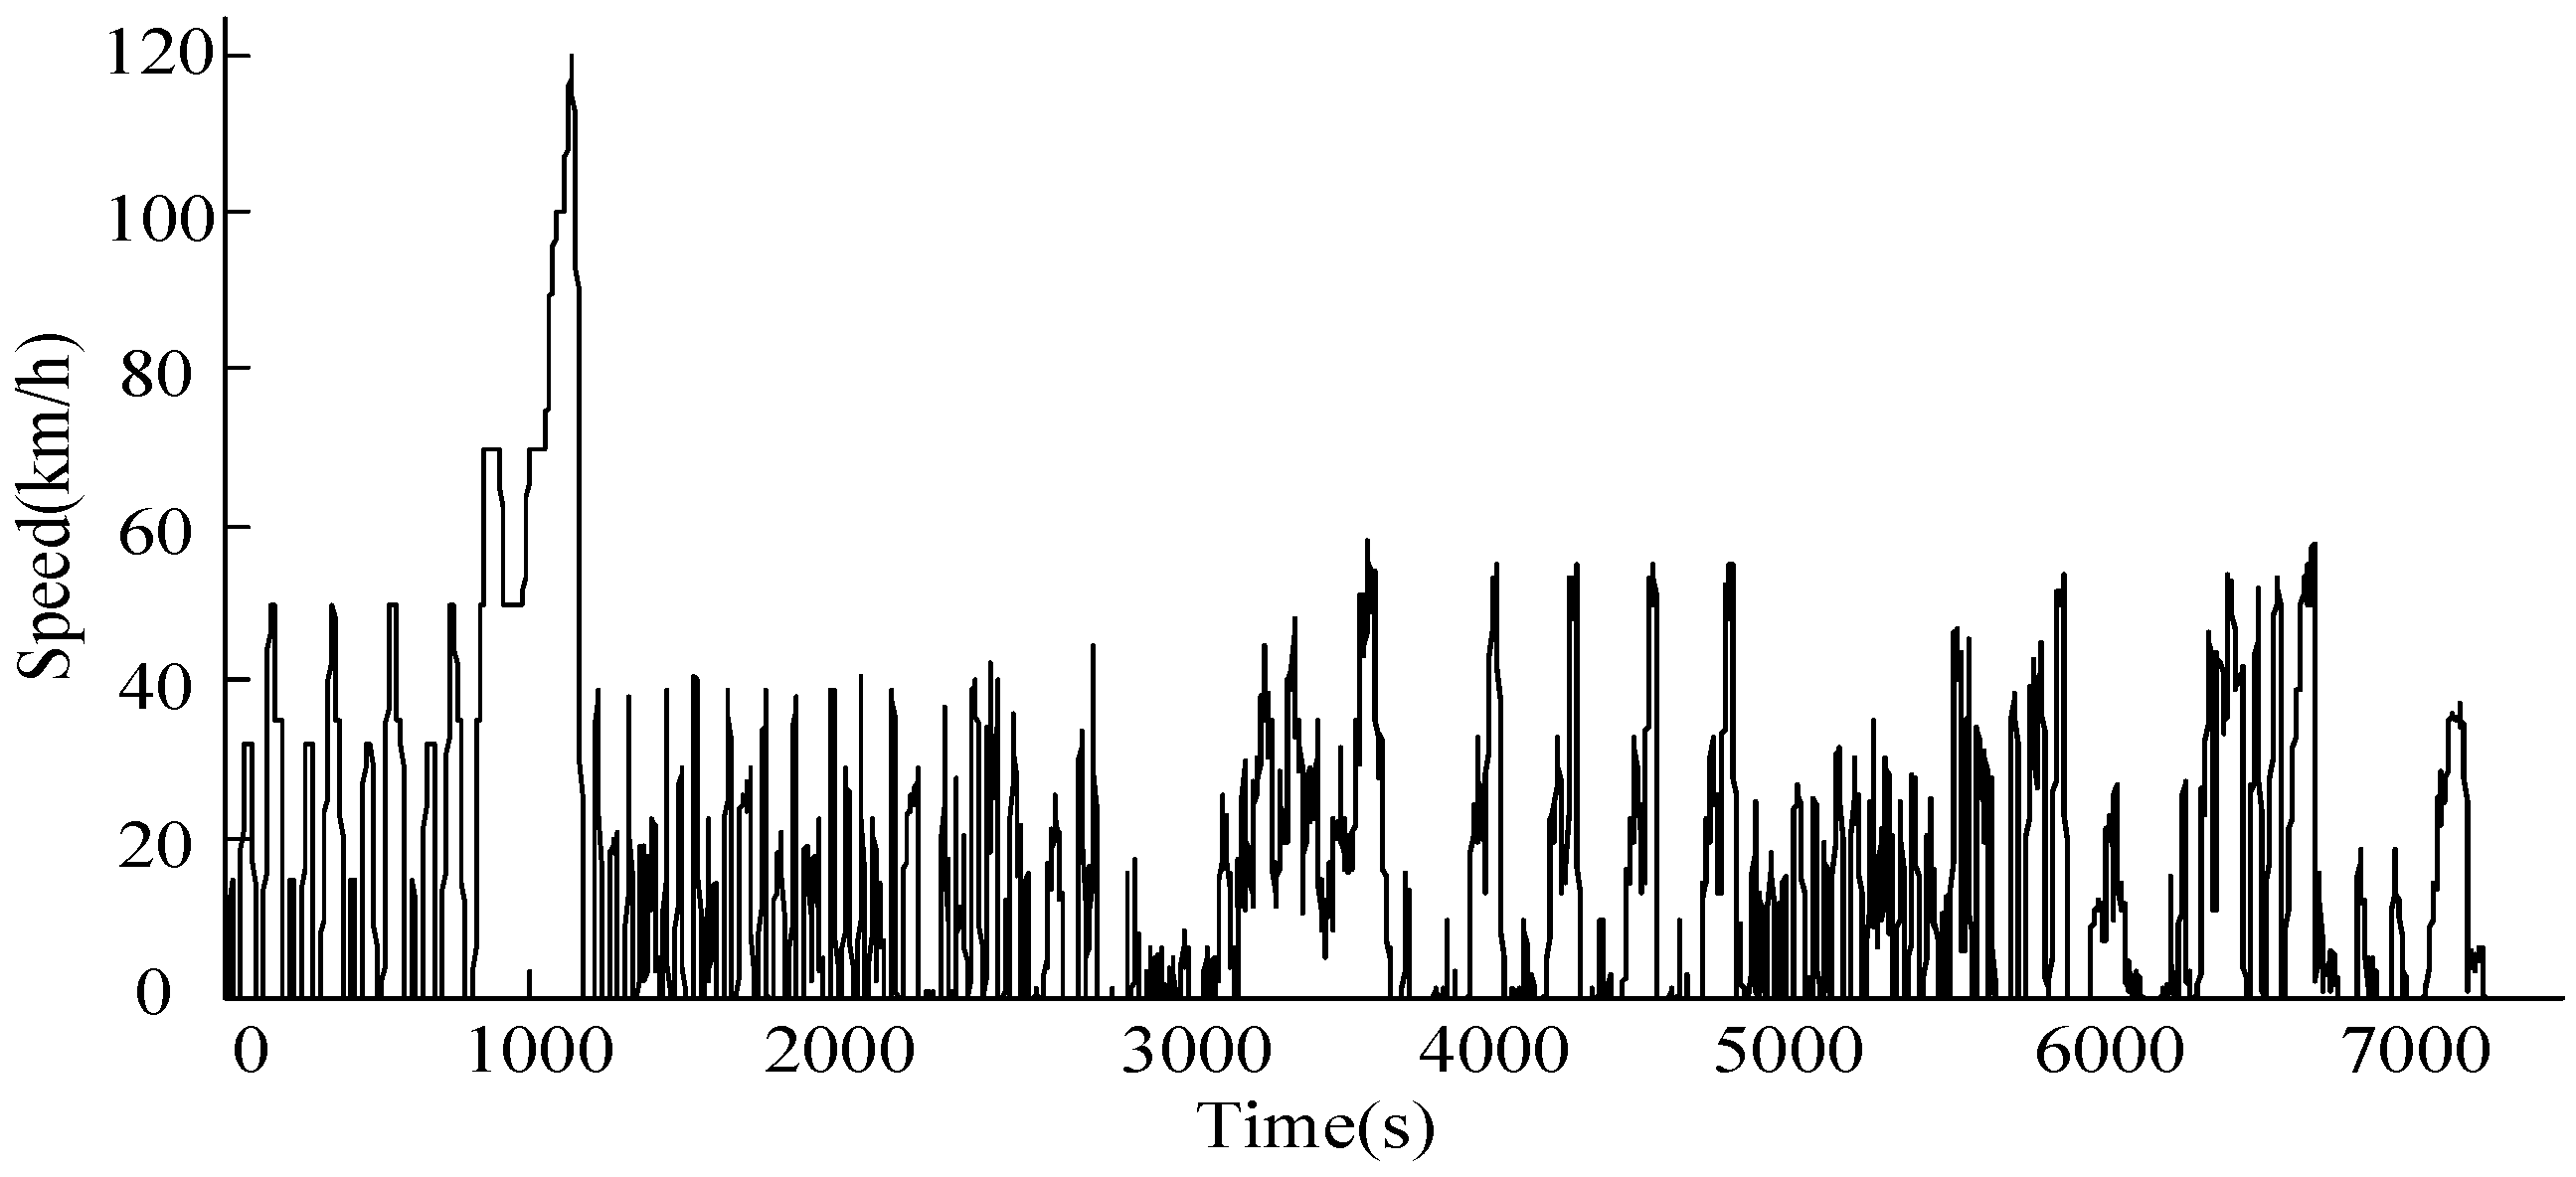
The EMS of HEVs based on driving pattern recognition, which optimizes the control parameters in real-time, is proposed after the parameter optimization under multiple driving cycle conditions. The proposed dynamic control strategy for HEVs based on parameter optimization under multiple driving cycles and driving pattern recognition has been simulated using Matlab/Simulink platform under the comprehensive driving cycle. Basically, the problem that the optimization based on a certain driving cycle cannot keep the battery SOC balance in other cycles has been solved in this paper.
(3)
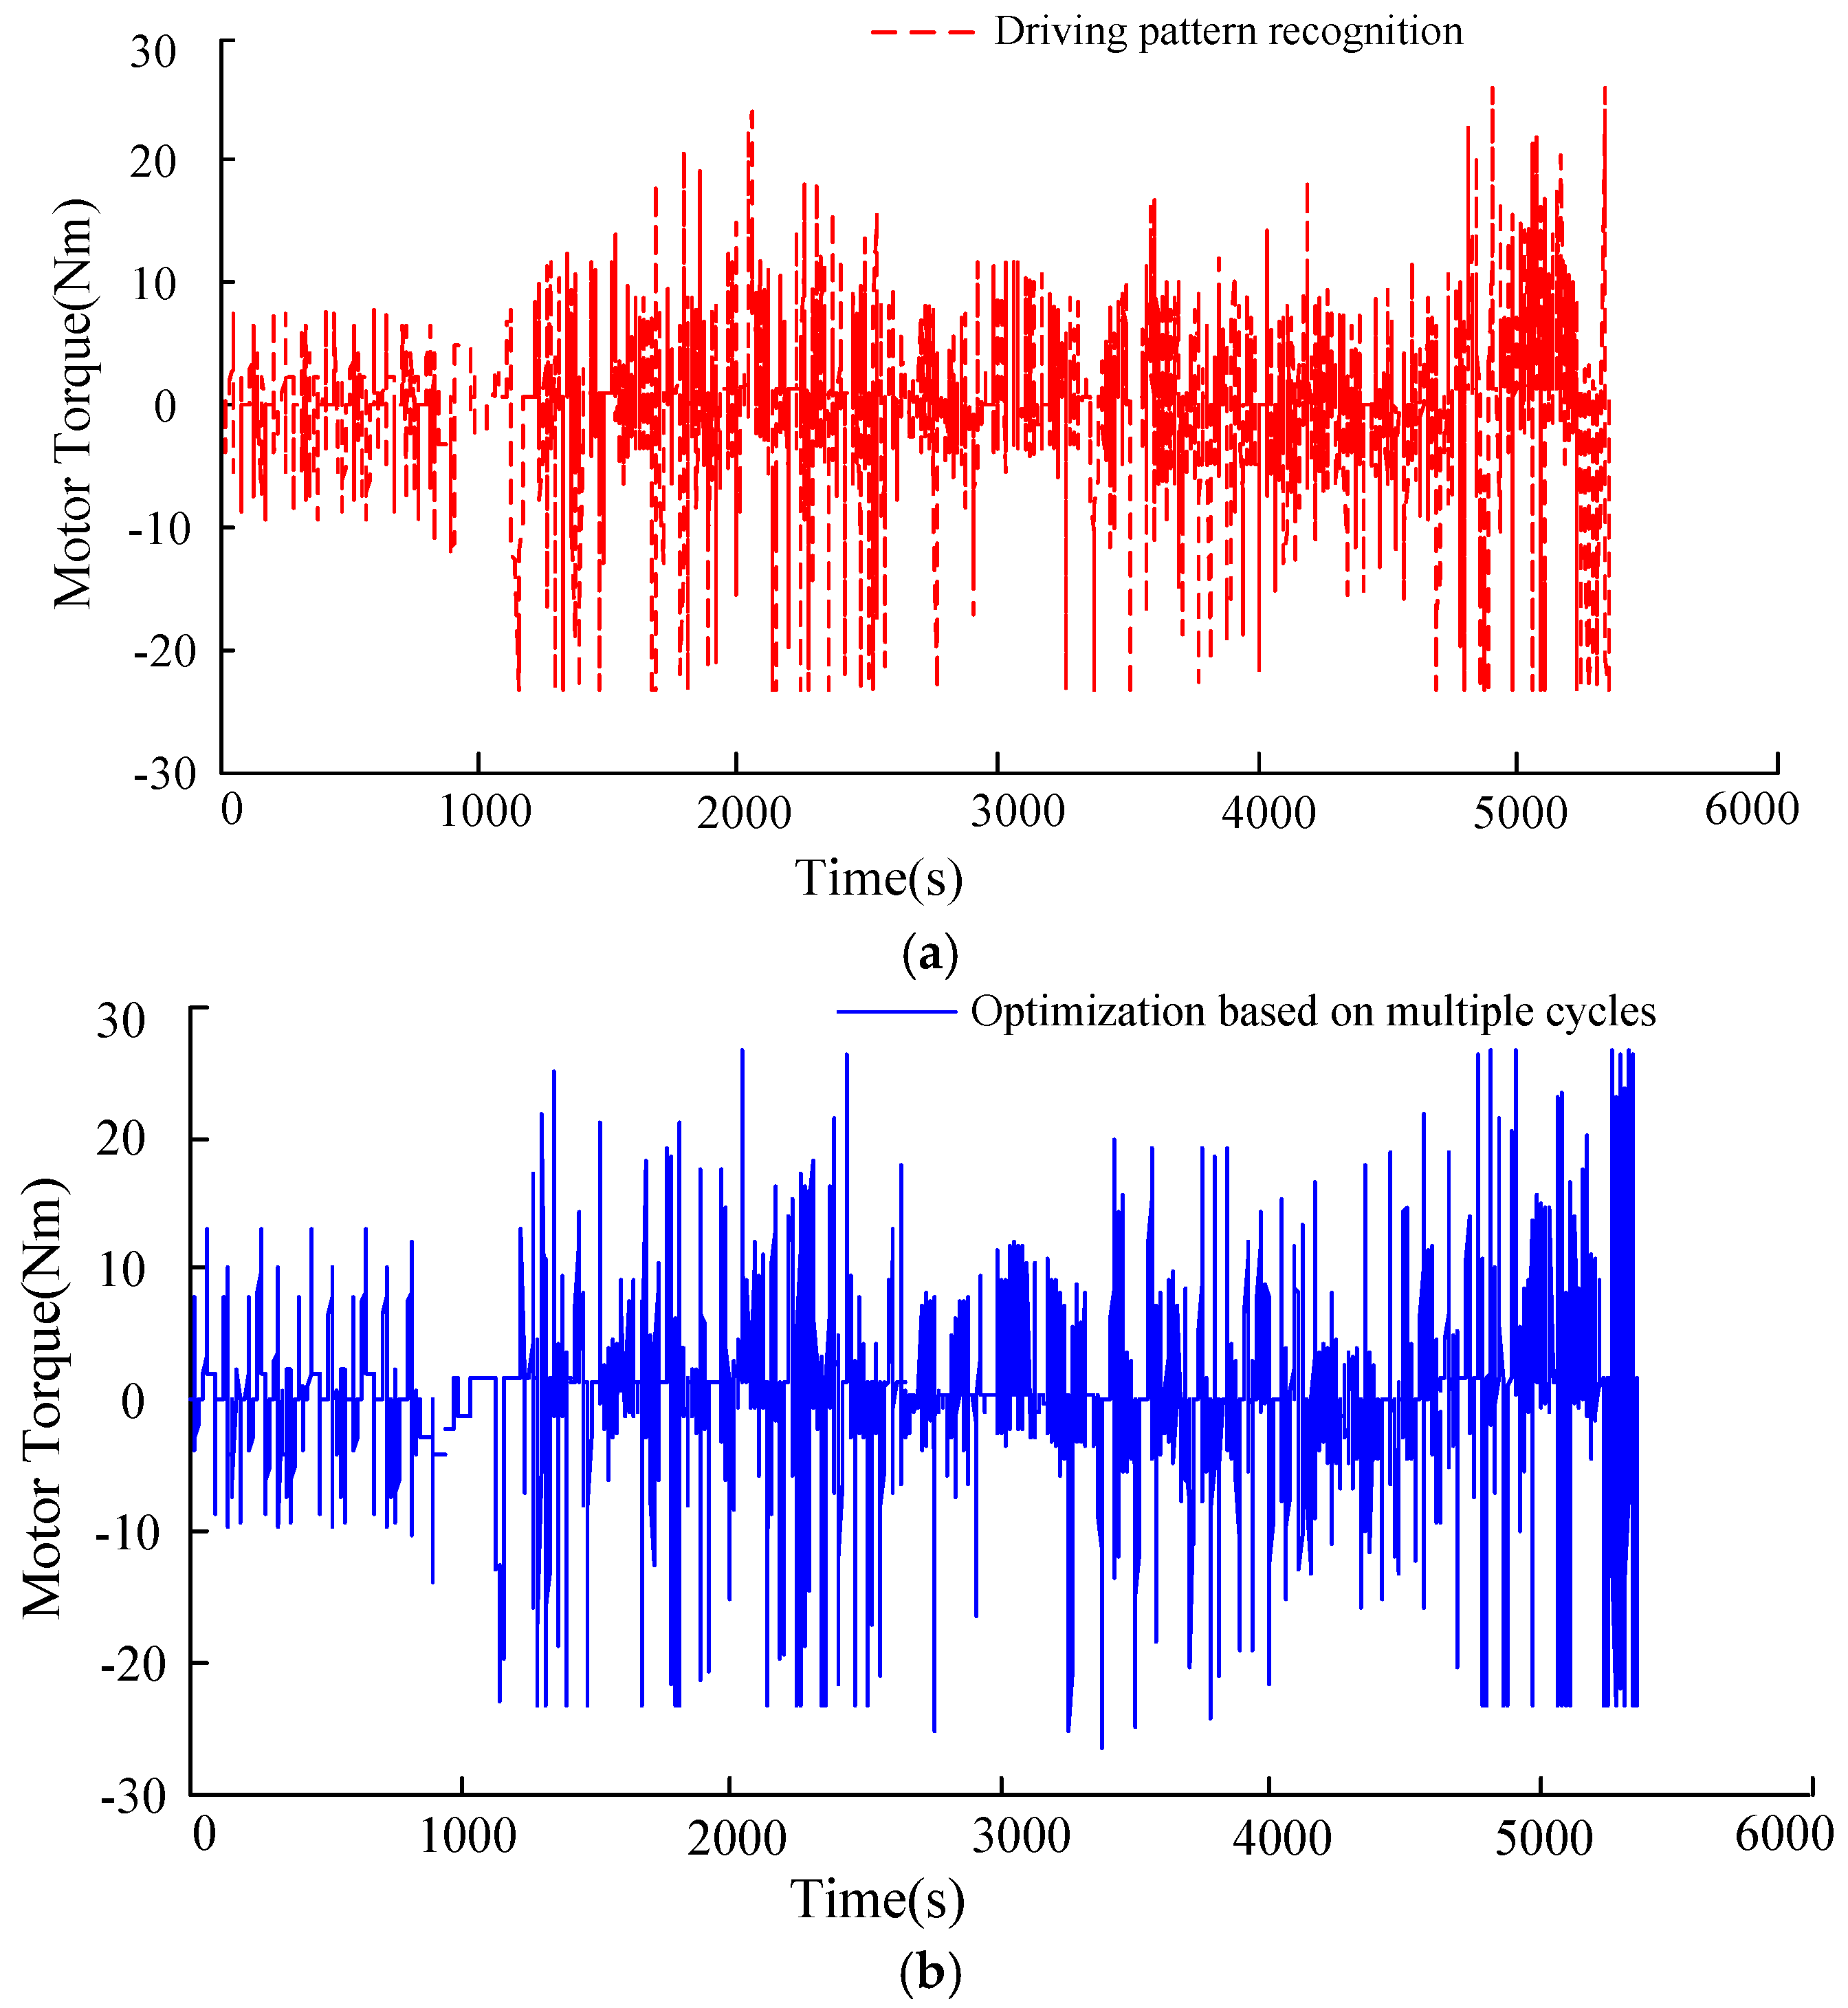
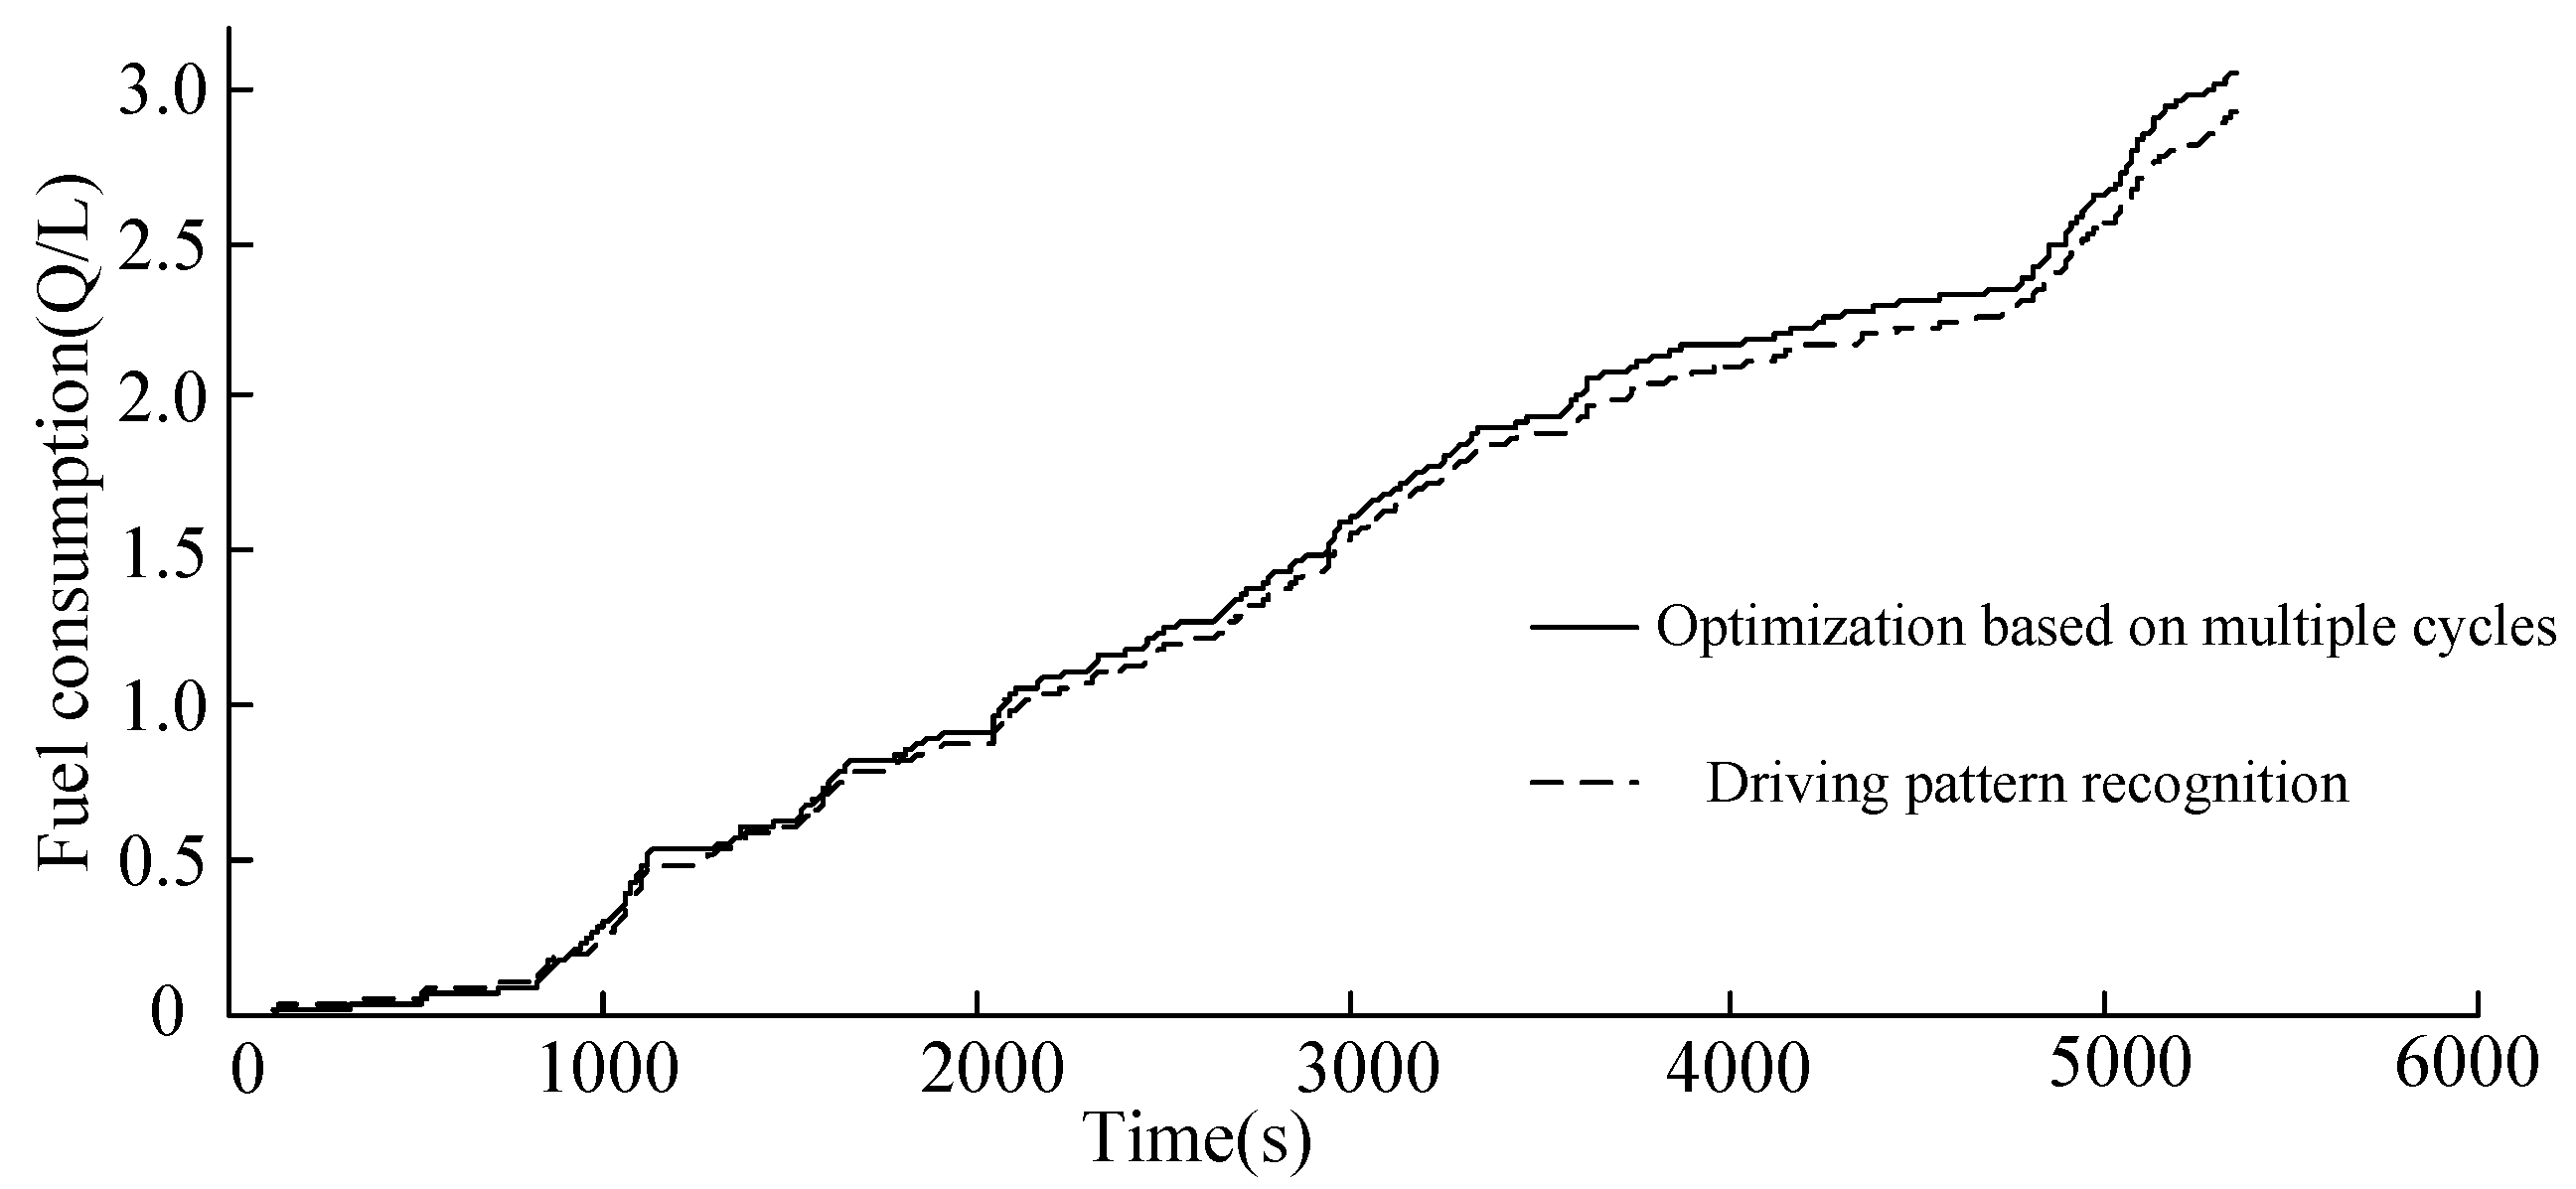
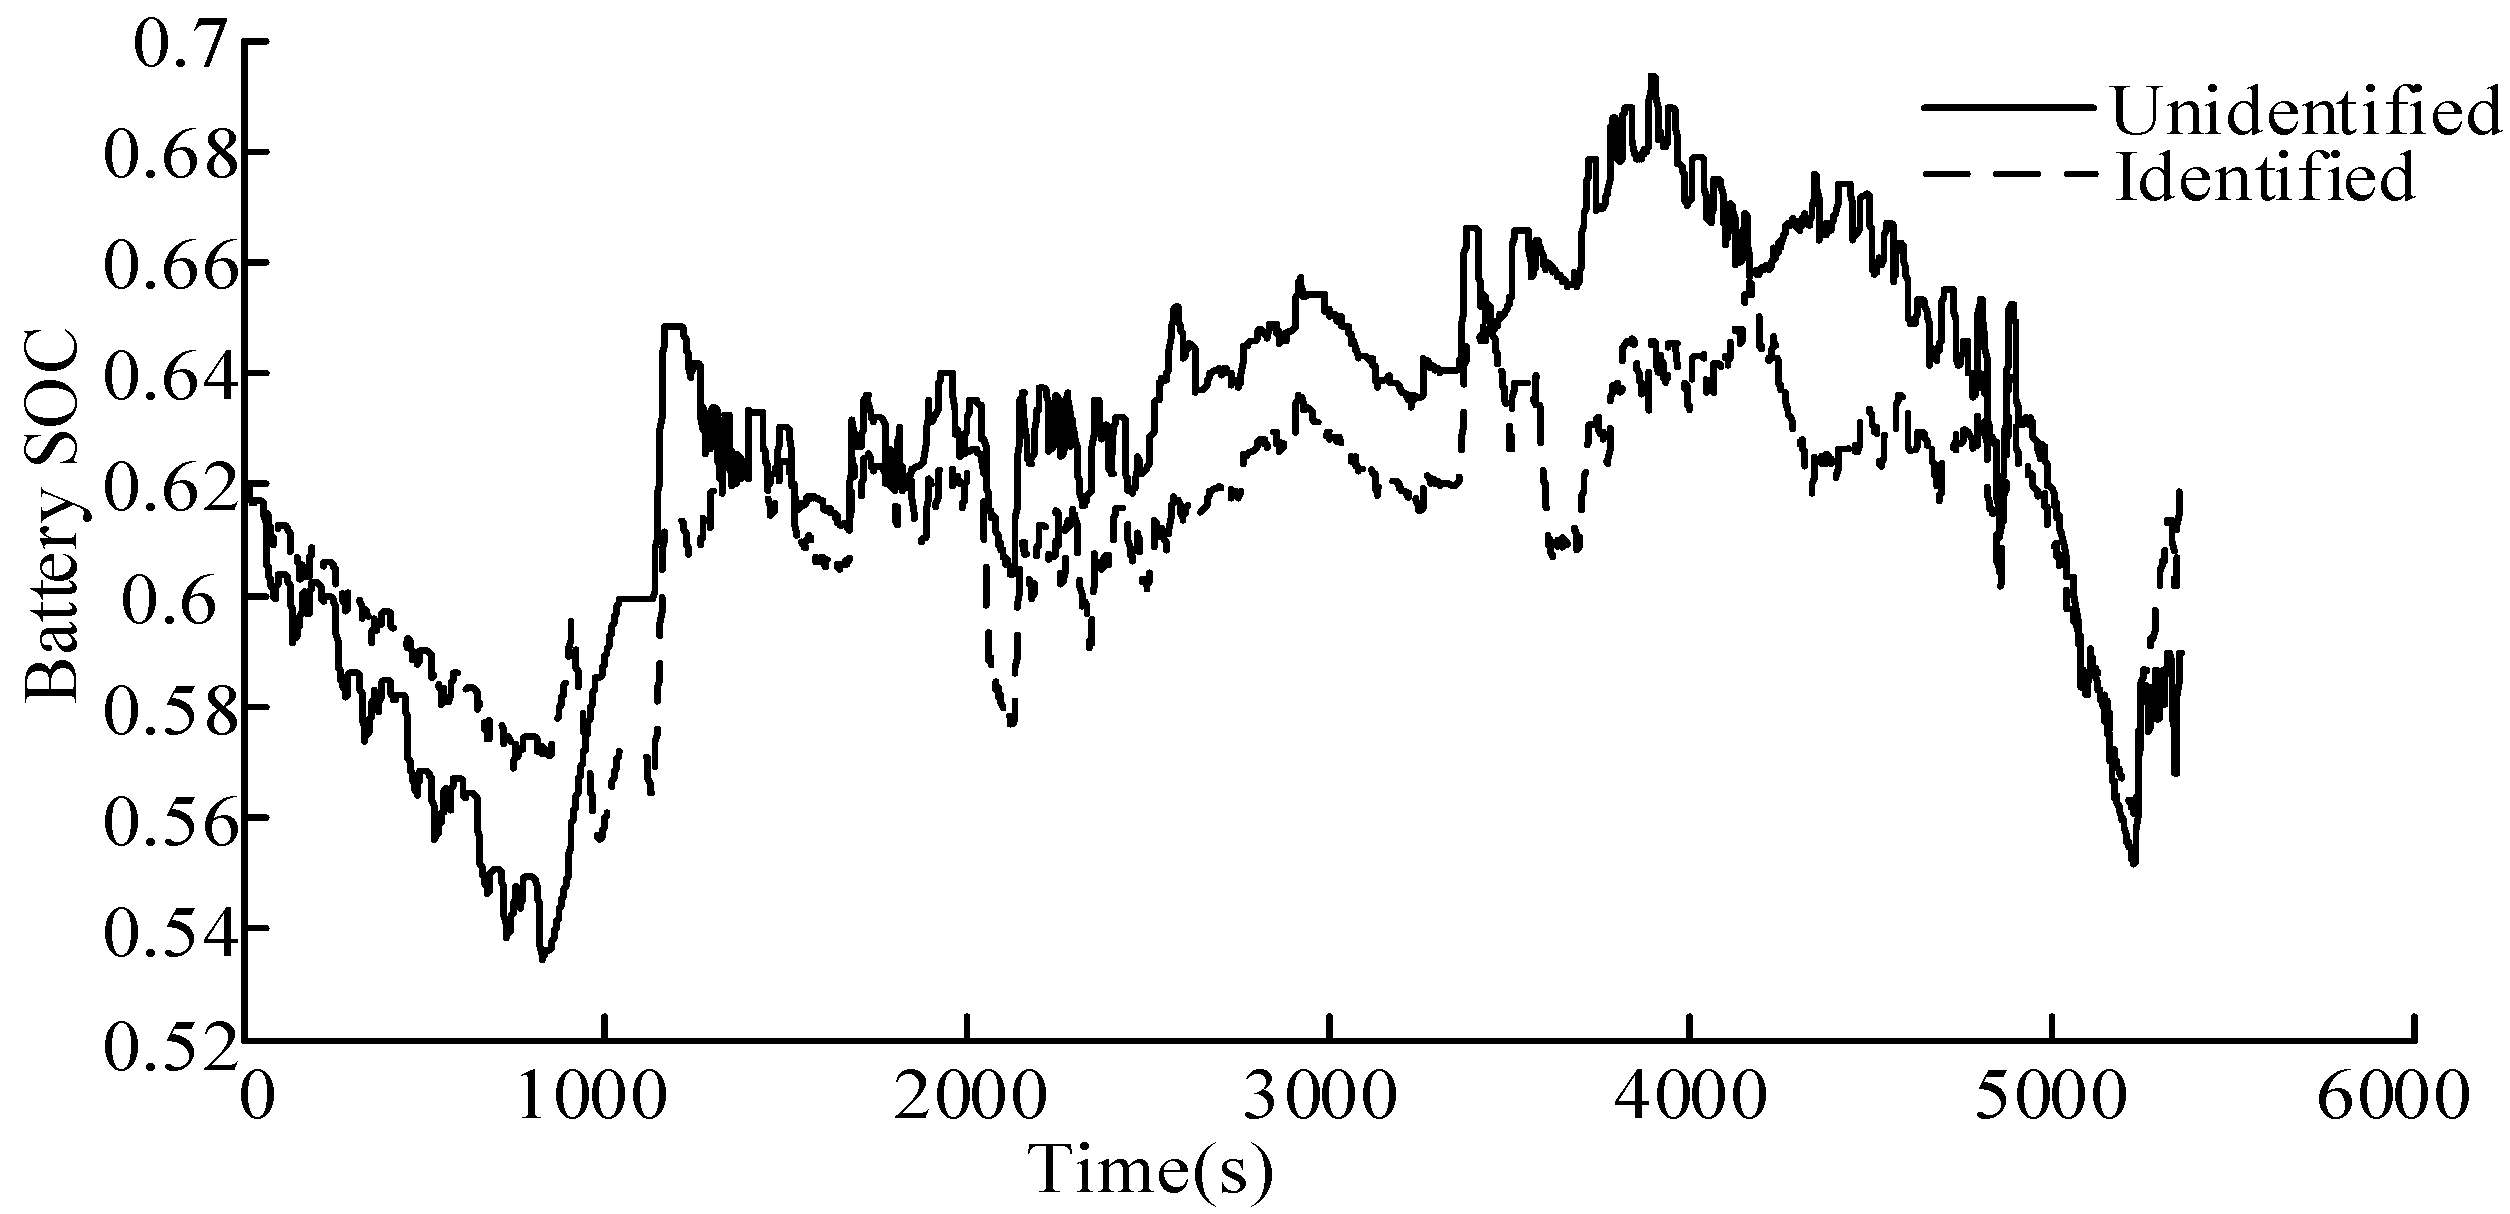
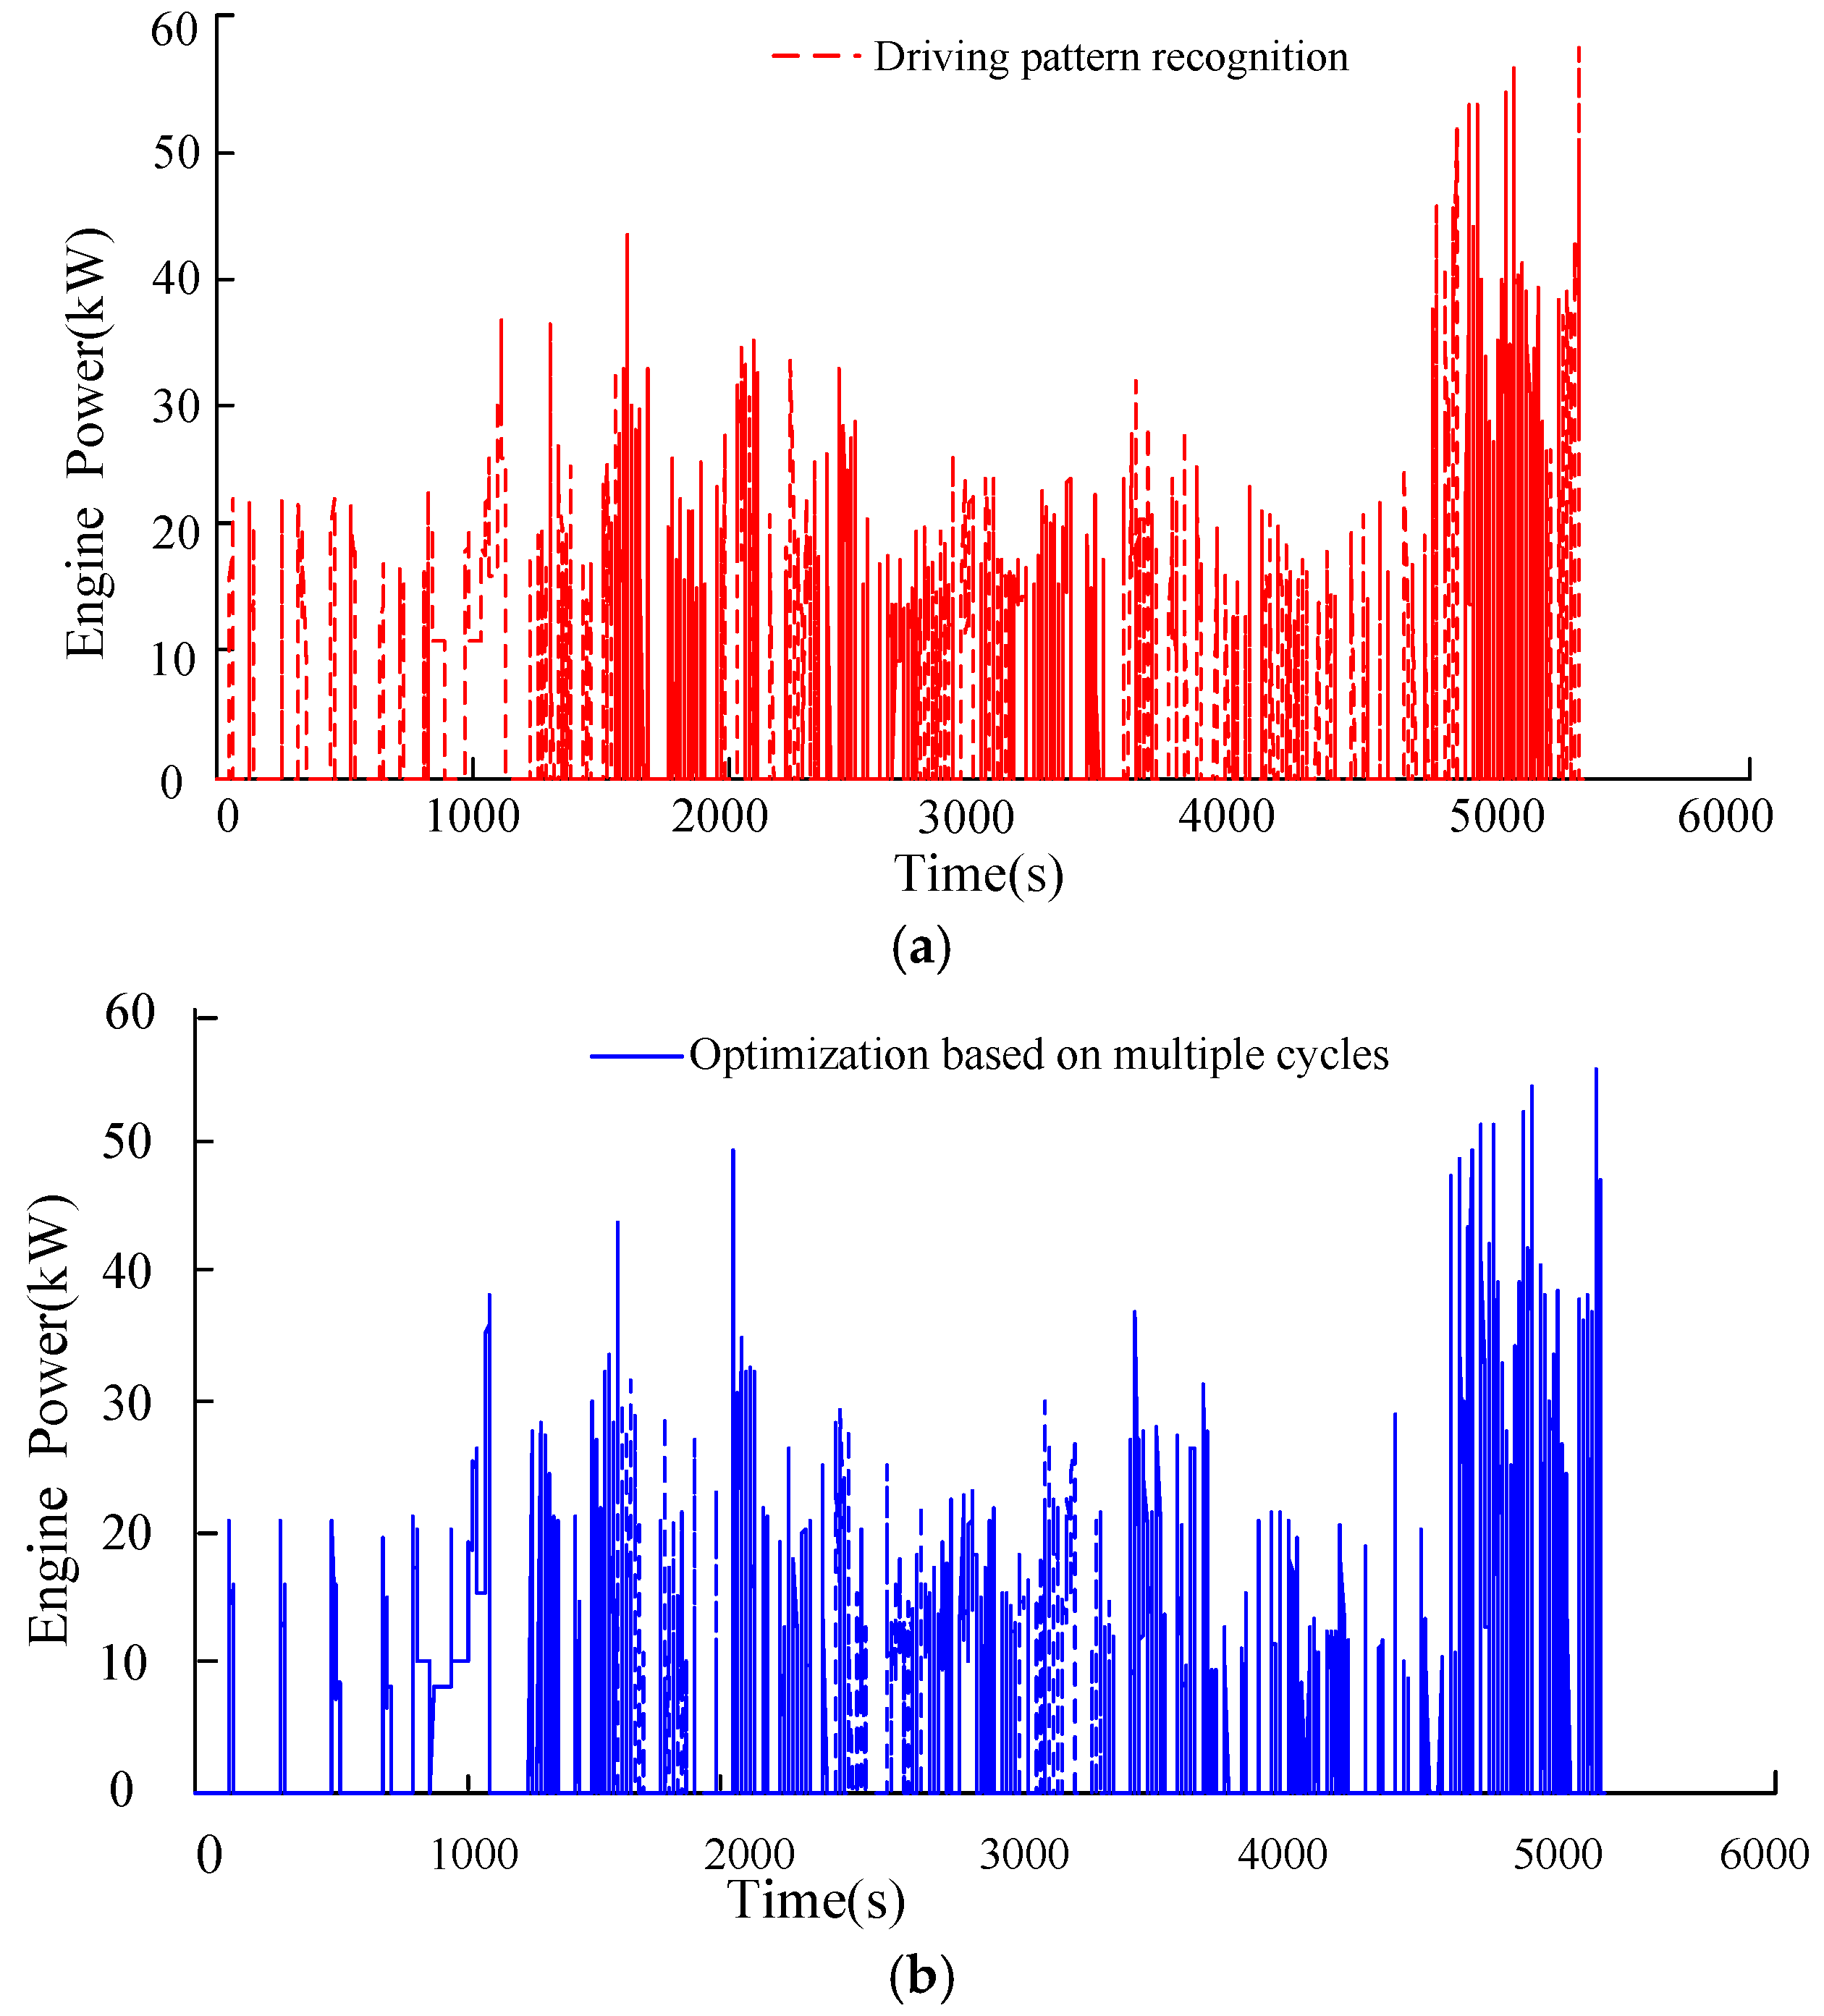
The simulation results show that compared with the original EMS, the former strategy reduces the fuel consumption by 4.36% and the latter one reduces the fuel consumption by 11.68%. The results validate the fact that the fuel consumption of EMS based on driving pattern recognition is greatly improved compared with that of the rule-based control strategy and more effective than that of multiple driving cycles. Meanwhile, the variation of battery SOC with the EMS based on driving pattern recognition is more reasonable than that of the optimization based on multiple driving cycles. It will serve as a guideline for calibrating the key parameters for road test.
(4)
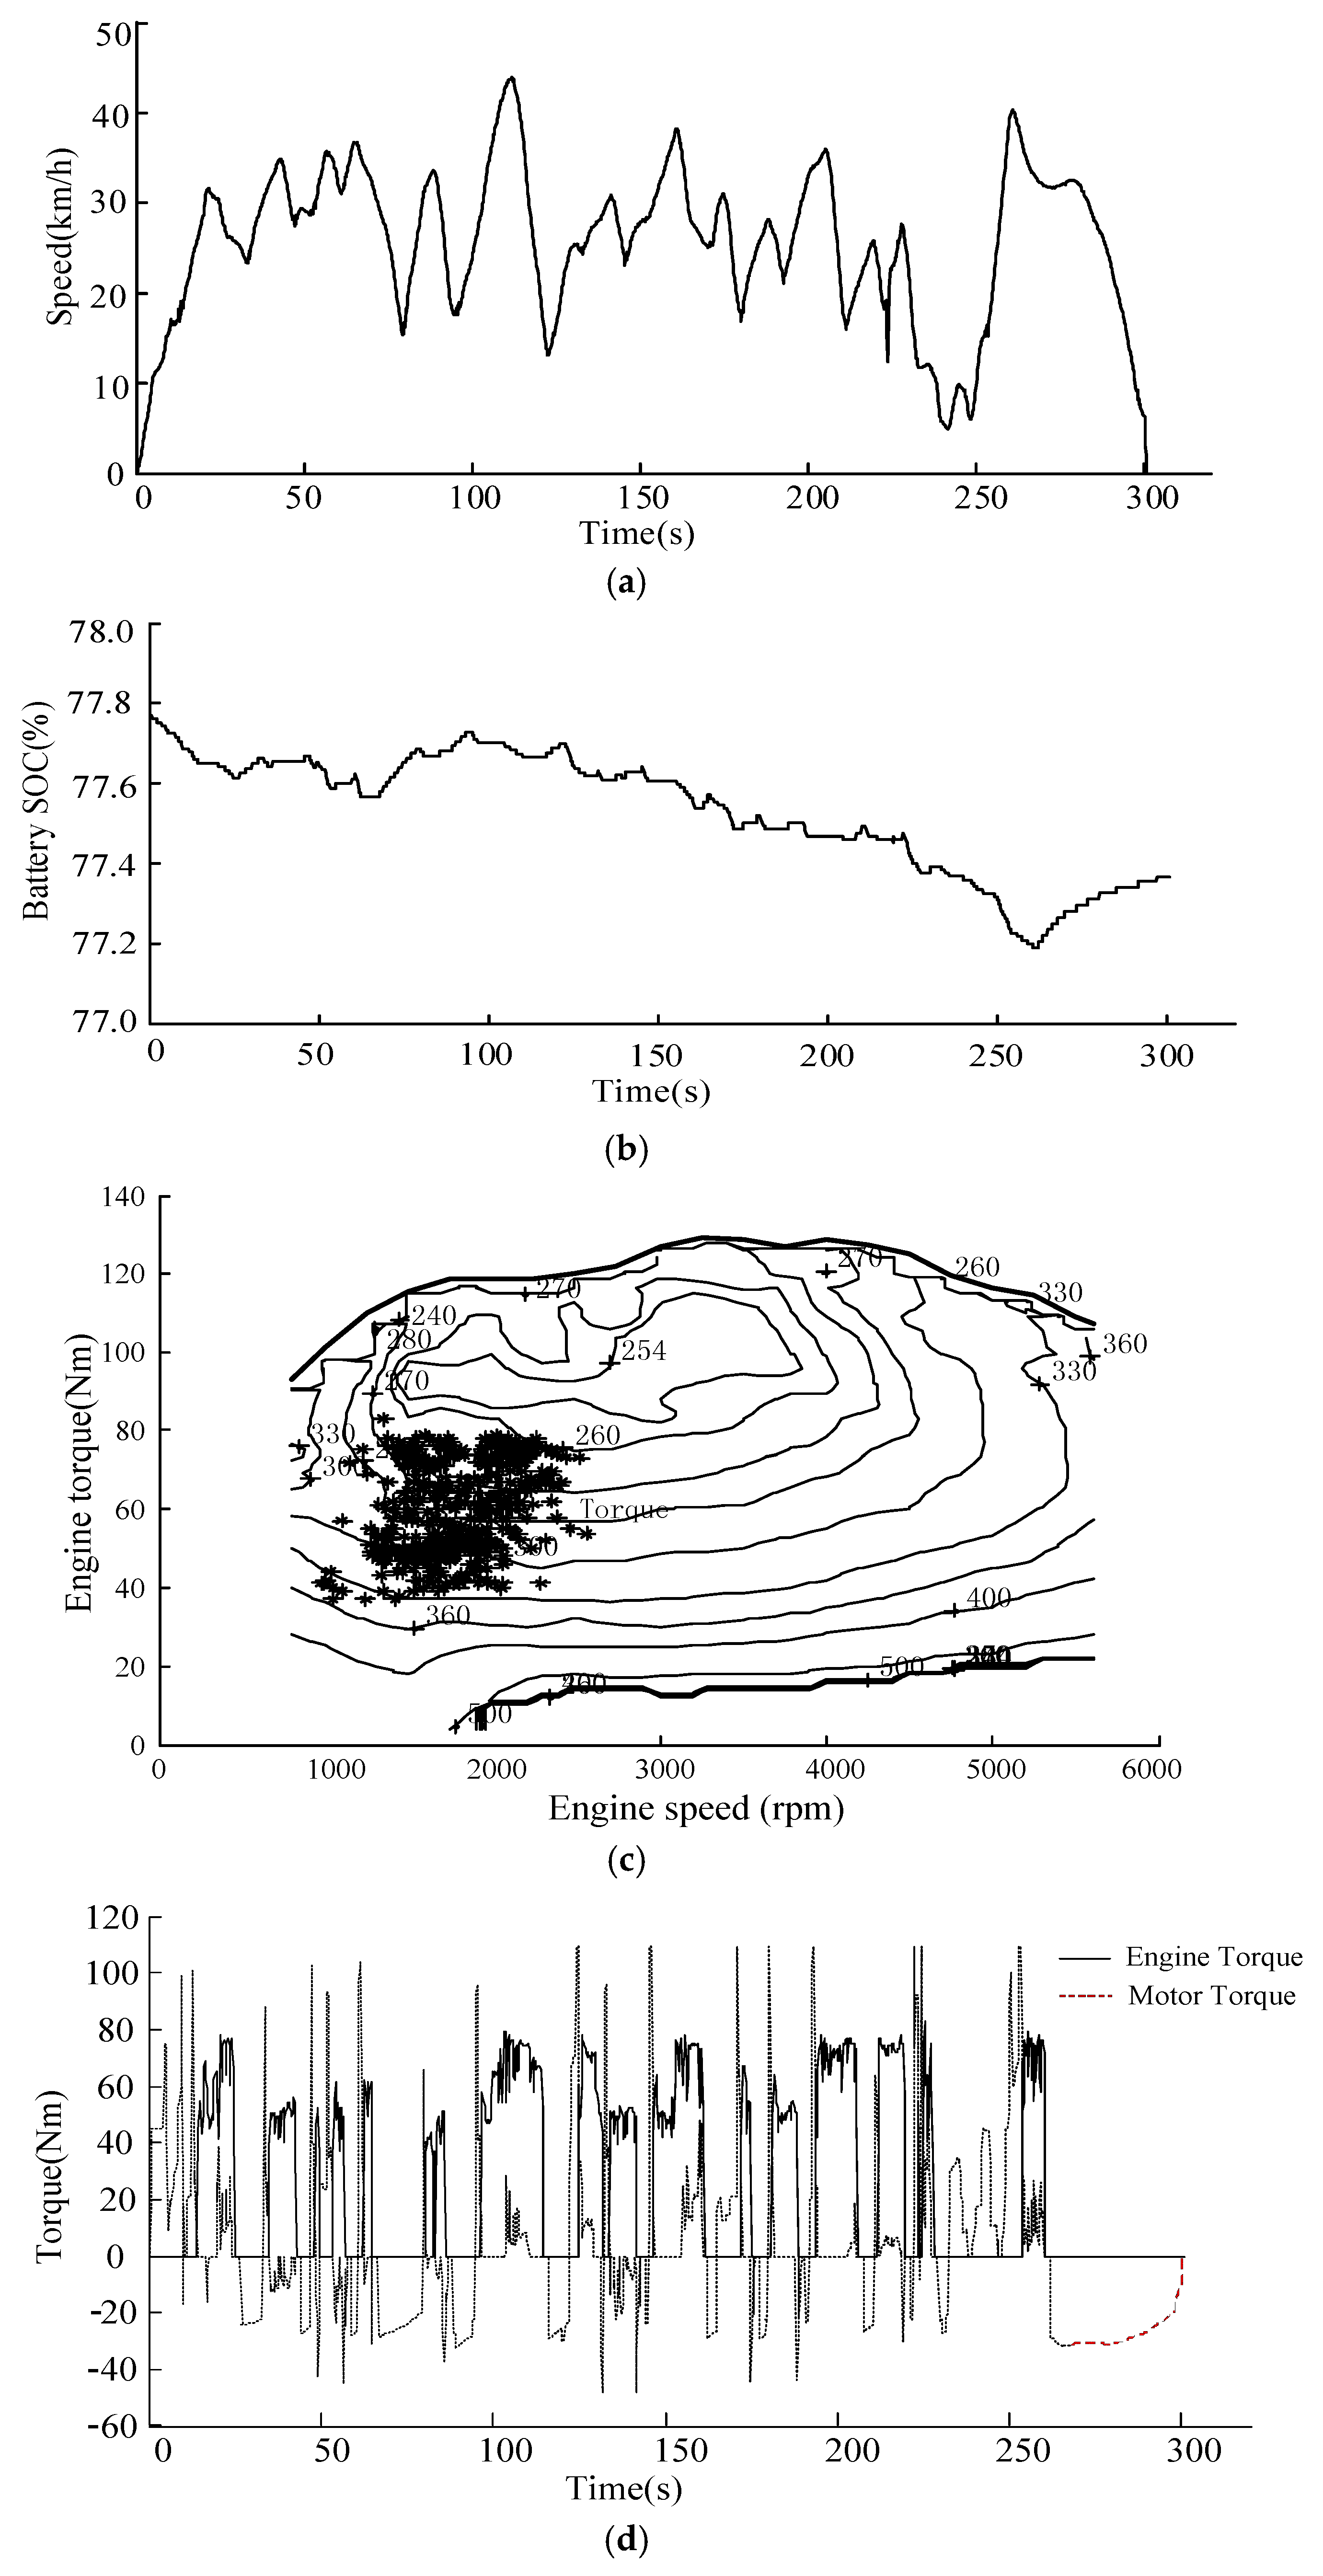
The proposed dynamic control strategy for HEVs based on driving pattern recognition is validated on a prototype HEV by a road test. The test results show that the EMS developed in this paper can effectively distribute the engine torque and motor torque, and significantly improve the fuel consumption of the vehicle. Furthermore, the battery SOC fluctuates smoothly and the battery SOC balance is well maintained during the test process. It will serve a reference role in dynamic control strategy for HEVs in real world.

Acknowledgments

The work presented in this paper is funded by the National Natural Science Foundation (No. 51305468), China Postdoctoral Science Foundation (No. 2016M602925XB), and the Fundamental Research Funds for the Central Universities (No. CDJZR14110005) and the Key Laboratory of Advanced Manufacture Technology for Automobile Parts, Ministry of Education (No. 2016KLMT06).

Author Contributions

Yonggang Liu provided algorithms and designed the experiments; Zhenzhen Lei wrote the paper and completed the simulation for case studies; Dong Cheng and Qingbo Xie performed the experiments and analyzed the data; Datong Qin and Yi Zhang conceived the structure and research direction of the paper.

Conflicts of Interest

The authors declare no conflict of interest.

References

  1. Fang, L.; Qin, S.; Xu, G.; Li, T.; Zhu, K. Simultaneous optimization for hybrid electric vehicle parameters based on multi-objective genetic algorithms. Energies 2011, 4, 532–544. [Google Scholar] [CrossRef]
  2. Montazeri-Gh, M.A. Application of genetic algorithm for optimization of control strategy in parallel hybrid electric vehicles. J. Frankl. Inst. 2006, 343, 420–435. [Google Scholar] [CrossRef]
  3. Panday, A.; Bansal, H.O. Energy Management strategy for hybrid electric vehicles using genetic algorithm. Renew. Sustain. Energy 2016, 8, 741–746. [Google Scholar] [CrossRef]
  4. Wang, J.; Wang, Q.; Wang, P.; Han, B. The optimization of control parameters for hybrid electric vehicles based on genetic algorithm. In Proceedings of the SAE World Congress, Detroit, MI, USA, 8–10 April 2014.
  5. Varesi, K.; Radan, A. A Novel GA Based Technique for Optimizing Both the Design and Control Parameters in Parallel Passenger Hybrid Cars. Int. Rev. Electr. Eng. 2011, 63, 1279–1286. [Google Scholar]
  6. Wang, J.; Wang, Q.; Zeng, X.; Zhou, N.; Li, L. The Algorithmic Research of Multi-Operating Mode Energy Management System; SAE Technical Paper 2013-01-0988; SAE International: Warrendale, PA, USA, 2013. [Google Scholar]
  7. Gao, S.A.; Wang, X.M.; He, H.W.; Guo, H.Q.; Tang, H.L. Powertrain matching based on driving cycle for fuel cell hybrid electricvehicle. Mech. Mater. 2013, 288, 142–147. [Google Scholar] [CrossRef]
  8. Wu, J.; Zhang, C.H.; Cui, N.X. PSO Algorithn-based parameter optimization for HEV powertrain and its control strategy. Int. J. Automot. Technol. 2008, 38, 53–59. [Google Scholar] [CrossRef]
  9. Sun, F.; Xiong, R.; He, H. A systematic state-of-charge estimation framework for multi-cell battery pack in electric vehicles using bias correction technique. Appl. Energy 2016, 162, 1399–1409. [Google Scholar] [CrossRef]
  10. Chen, Z.; Xiong, R.; Wang, K.; Jiao, B. Optimal energy management strategy of a plug-in hybrid electric vehicle based on a particle swarm optimization algorithm. Energies 2015, 8, 3661–3678. [Google Scholar] [CrossRef]
  11. Fang, L.; Qin, S. Concurrent optimization for parameters of powertrain and control system of hybrid electric vehicle based on multi-objective genetic algorithms. In Proceedings of the 2006 SICE-ICASE International Joint Conference, Busan, Korea, 18–21 October 2006.
  12. Li, L.; Zhang, Y.; Yang, C.; Jiao, X.; Zhang, L.; Song, J. Hybrid genetic algorithm-based optimization of powertrain and control parameters of plug-in hybrid electric bus. J. Frankl. Inst. 2015, 352, 776–801. [Google Scholar] [CrossRef]
  13. Hao, J.; Yu, Z.; Zhao, Z.; Shen, P.; Zhan, X. optimization of key parameters of energy management strategy for hybrid electric vehicle using DIRECT algorithm. Energies 2016, 9, 997. [Google Scholar] [CrossRef]
  14. Deng, Y.W.; Chen, K.L. Simulated Annealing Particle Swarm Algorithm Based Parameters Optimization for Hybrid Electric Vehicles. Autom. Eng. 2012, 34, 580–584. [Google Scholar]
  15. Roy, H.K.; McGordon, A.; Jennings, P.A. A generalized powertrain design optimization methodology to reduce fuel economy variability in hybrid electric vehicles. IEEE Trans. Veh. Technol. 2014, 63, 1055–1070. [Google Scholar]
  16. Zhang, S.; Xiong, R. Adaptive energy management of a plug-in hybrid electric vehicle based on driving pattern recognition and dynamic programming. Appl. Energy 2015, 155, 68–78. [Google Scholar] [CrossRef]
  17. Chen, Z.; Xiong, R.; Cao, J. Particle swarm optimization-based optimal power management of plug-in hybrid electric vehicles considering uncertain driving conditions. Energy 2016, 96, 197–208. [Google Scholar] [CrossRef]
  18. Jeon, S.I.; Jo, S.; Park, Y.; Lee, J. Multi-mode driving control of a parallel hybrid electric vehicle using driving pattern recognition. J. Dyn. Syst. Meas. Control Trans. ASME 2002, 124, 141–149. [Google Scholar] [CrossRef]
  19. Lin, C.C.; Jeon, S.; Peng, H. Driving pattern recognition for control of hybrid electric trucks. Veh. Syst. Dyn. 2004, 42, 41–58. [Google Scholar] [CrossRef]
  20. Tian, Y.; Zhang, X.; Zhang, L.; Zhang, X. Intelligent energy management based on driving cycle identification using fuzzy neural network. In Proceedings of the Second International Symposium on Computational Intelligence and Design, Changsha, China, 12–14 December 2009; pp. 501–504.
  21. Dayeni, M.K.; Soleymani, M. Intelligent energy management of a fuel cell vehicle based on traffic condition recognition. Clean Technol. Environ. Policy 2016, 18, 1945–1960. [Google Scholar] [CrossRef]
  22. Wang, J.; Wang, Q.N.; Zeng, X.H.; Wang, P.Y.; Wang, J.N. Driving cycle recognition neural network algorithm based on the sliding time window for hybrid electric vehicles. Int. J. Automot. Technol. 2015, 16, 685–695. [Google Scholar] [CrossRef]
  23. Park, J.; Chen, Z.; Kiliaris, L.; Kuang, M.L.; Masrur, M.A.; Phillips, A.M.; Murphey, Y.L. Intelligent vehicle power control based on machine learning of optimal control parameters and prediction of road type and traffic congestion. IEEE Trans. Veh. Technol. 2009, 58, 4741–4756. [Google Scholar] [CrossRef]
  24. Huang, X.; Tan, Y.; He, X. An Intelligent Multifeature Statistical Approach for the Discrimination of Driving Conditions of a Hybrid Electric Vehicle. IEEE Trans. Intell. Transp. Syst. 2010, 12, 1–13. [Google Scholar] [CrossRef]
  25. Zhang, S.; Xiong, R.; Cao, J.Y. Battery durability and longevity based power management for plug-in hybrid electric vehicle with hybrid energy storage system. Appl. Energy 2016, 179, 316–328. [Google Scholar] [CrossRef]
  26. Alonso, E.; Ruiz, J.; Astruc, D. Power Management Optimization of an Experimental Fuel Cell/Battery/Supercapacitor Hybrid System. Energies 2015, 8, 6302–6327. [Google Scholar]
  27. Meintz, A.; Ferdowsi, M. Control strategy optimization for a parallel hybrid electric vehicle. In Proceedings of the 2008 IEEE Vehicle Power and Propulsion Conference (VPPC ‘08), Harbin, China, 3–5 September 2008.
  28. Wu, L.; Wang, Y.; Yuan, X.; Chen, Z. Multiobjective optimization of HEV fuel economy and emissions using the self-adaptive differential evolution algorithm. IEEE Trans. Veh. Technol. 2011, 60, 2458–2470. [Google Scholar] [CrossRef]
  29. Metropolis, N.; Rosenbluth, A.W.; Rosenbluth, M.N.; Teller, M.; Teller, E. Equation of state calculations by very fast computing machines. J. Chem. Phys. 1953, 21, 1087. [Google Scholar] [CrossRef]
  30. Shieh, H.L.; Kuo, C.C.; Chiang, C.M. Modified particle swarm optimization algorithm with simulated annealing behavior and its numerical verification. Appl. Math. Comput. 2011, 218, 4365–4383. [Google Scholar] [CrossRef]
  31. Johnson, V.H.; Wipke, K.B.; Rausen, D.J. HEV Control Strategy for Real Time Optimization on Fuel Economy and Emission. In Proceedings of the 2000 Future Car Congress, Arlington, VA, USA, 2–6 April 2000.
  32. Pisu, P.; Rizzoni, G. A comparative study of supervisory control strategies for hybrid electric vehicles. IEEE Trans. Control Syst. Technol. 2007, 15, 506–518. [Google Scholar] [CrossRef]
  33. Clark, N.; Xie, W.; Gautam, M.; Lyons, D.W.; Norton, P.; Balon, T. Hybrid Diesel-Electric Heavy Duty Bus Emissions: Benefits of Regeneration and Need for State of Charge Correction. In Proceedings of the 2000 International Fall Fuels and Lubricants Meeting and Exposition, Baltimore, MD, USA, 16–19 October 2000.
Figure 1. Configuration of the integrated starter and generator (ISG) type hybrid electric vehicle (HEV).
Energies 10 00054 g001
Figure 2. Logic diagram of control strategy. (a) SOC > SOClow; (b) SOCSOClow.
Energies 10 00054 g002
Figure 3. Diagram of optimization method under multiple driving cycles.
Energies 10 00054 g003
Figure 4. Optimization model based on the simulated annealing particle swarm optimization algorithm.
Energies 10 00054 g004
Figure 5. Time-speed relationship of the comprehensive driving cycle.
Energies 10 00054 g005
Figure 6. Variation of battery SOC under the comprehensive cycle conditions.
Energies 10 00054 g006
Figure 7. Engine operating points under the comprehensive cycle conditions.
Energies 10 00054 g007
Figure 8. Diagram of EMS based on driving pattern recognition.
Energies 10 00054 g008
Figure 9. Clustering-feature tree of twenty-three typical patterns.
Energies 10 00054 g009
Figure 10. Time-speed relationship of the comprehensive test cycle conditions.
Energies 10 00054 g010
Figure 11. Result of driving pattern recognition under the comprehensive test cycle conditions.
Energies 10 00054 g011
Figure 12. Time-speed relationship in the first class of driving cycles.
Energies 10 00054 g012
Figure 13. Variation of SOC in the first class of driving cycles.
Energies 10 00054 g013
Figure 14. Variation of SOC under comprehensive driving cycle conditions.
Energies 10 00054 g014
Figure 15. Engine power under the comprehensive driving cycle. (a) Engine power based on driving pattern recognition; (b) engine power based on multiple driving cycle optimization.
Energies 10 00054 g015
Figure 16. Motor torque under comprehensive driving cycle. (a) Motor power based on driving pattern recognition; (b) motor power based on multiple driving cycle optimization.
Energies 10 00054 g016
Figure 17. Fuel consumption under comprehensive driving cycle conditions.
Energies 10 00054 g017
Figure 18. Road test results under the comprehensive driving cycle. (a) Time-speed curve of the road test; (b) variation of battery SOC; (c) engine operating points during testing; and (d) engine and motor toque distribution during testing.
Energies 10 00054 g018
Table 1. Revised rule-based energy management strategy (EMS).
Operating ModeConstraint ConditionTorque Distribution
Electric Driving Mode0 < TvToff
SOCup > SOC > SOClow; V > Vl
SOCup > SOC > SOClow; VVl
SOC > SOCup
Tm = Tv; Te = 0
Driving & Charging ModeToff < TvTlow
SOClowSOCSOCup; V > Vl
0 ≤ TvTup
Te = Tlow
Tm = TvTlow
Te = Tup
Tm = max(TvTup, Tchg max)
Engine Driving ModeTlowTvTup
SOCup > SOC > SOClow; V > Vl
TupTv; SOCSOClow
Te = Tv; Tm = 0
Motor Driving ModeTup < Tv; SOC > SOClow; V > VlTe = Tup; Tm = TvTup
Regenerative Braking ModeTv ≤ 0; SOC < SOCupTv = Tm + Tmechanic
Tv ≤ 0 and SOC > SOCupTv = Tmechanic
Table 2. Parameters of control strategy.
NameUnitDescription
SOCup-Maximum expectation of battery SOC
SOClow-Minimum expectation of battery SOC
Vkm/hCurrent speed
Vlkm/hSpeed floor. When SOC > SOClow and V < Vl, pure electric mode starts
TmaxNmMaximum steady-state torque of engine
Foff-Engine off torque coefficient, T o f f   =   T max   ×   F o f f
Flow-Minimum torque coefficient of engine in high efficiency regions, T l o w   =   T max   ×   F l o w
Fup-Maximum torque coefficient of engine in high efficiency regions, T u p   =   T max   ×   F u p
TchgNmActive charging torque of ISG motor. Tchg max is the maximum charging torque of motor
TvNmVehicle demand torque
TmNmOutput torque of the ISG
TeNmOutput torque of the engine
TmechanicNmMechanic braking torque
Table 3. Constraints of dynamic performance for the HEV.
Max. SpeedMax. Slope of ClimbAcceleration Time from 0 to 100 km/h
km/h%s
160≥50≥30≤12
(Engine Driving Mode)(Electric Driving Mode)(Engine Driving Mode)(Hybrid Driving Mode)
Table 4. Six types of typical driving cycles.
ModeFTPLA92SC03UDDSHWFETUS06_HWY
Typeurban congestionsuburbanhighway
Table 5. Power source parameters of the HEV.
DescriptionEngine (PIC)ISG Motor (PISG)
Max Power (kW)7230
Max Torque (Nm)137115
Table 6. Variation of each parameter.
Optimal VariableInitial ValueVariation Range
PIC (kW)72.021.6–122.4
PISG (kW)30.09–51
Flow0.60.43–0.73
Fup0.90.75–0.93
Foff0.2350.2–0.4
SOClow0.250.2–0.4
SOCup0.80.75–0.9
Vl3210–50
Table 7. Comparison of optimization results.
Optimal VariableInitial ValueOptimal Value
PIC (kW)72.067.0
PISG (kW)30.026.0
Flow0.60.48
Fup0.90.90
Foff0.2350.23
SOClow0.250.30
SOCup0.80.78
Vl3235.06
Table 8. Related characteristic parameters of twenty-three typical cycles.
Modevmaxvavgamaxdmaxaavgdavgri
169.9722.680.790.830.570.650.32
264.3739.701.072.010.601.790.22
332.1920.420.982.060.811.790.214
432.1914.850.360.620.290.560.187
588.5170.281.032.010.281.890.122
6119.9932.111.051.390.540.790.277
7128.7585.753.582.551.290.800.097
8108.1539.613.083.930.670.750.163
940.7210.982.062.500.540.670.362
1044.5811.412.682.640.620.610.351
1157.9414.104.113.880.480.540.331
1254.7212.151.961.870.550.650.52
1353.7014.341.882.110.580.550.31
14129.2382.883.793.190.440.500.034
1588.1934.502.282.730.500.600.195
1691.2531.511.481.480.510.580.189
1793.3430.321.962.070.480.580.333
18129.2397.913.083.080.340.410.033
1957.6513.581.143.240.300.390.303
2072.1025.861.302.160.330.420.252
21129.2070.033.533.620.660.700.075
2249.9918.261.060.830.640.740.33
2391.2347.071.471.560.440.680.05
Table 9. Optimization results of control parameters.
ClassesFlowFhighFoffVl
First0.500.800.2523.66
Second0.480.900.2335.06
Third0.630.830.3211.77
Forth0.590.9170.3323.64
Fifth0.680.800.4015.98
Table 10. Variation of state of charge.
ModeECE_EUDCMAN-HATTANNYCCNYC-COMP
ΔSOC−0.007−0.0170.010.009
ModeNYC-TRUCKNuremberR36WVU-CITYComprehensive
ΔSOC0.020.006−0.0150.005
Table 11. Fuel economy comparison results.
FactorRule-Based Control StrategyMultiple Driving Cycles OptimizationDriving Pattern Recognition
Fuel Consumption (L)3.233.102.96
Corrected Fuel Consumption (L)3.433.283.03
Q100 (L/100 km)4.754.554.36
Corrected Q100 (L/100 km)5.054.834.46
Fuel Saving-4.24%8.24%
Fuel Saving (SOC corrected)-4.36%11.68%
ΔSOC−0.28−0.250−0.098
Table 12. Specifications of the prototype vehicle.
Main ParameterValue
Curb weight (kg)1350
Rated payload (kg)1875
Effective radius (m)0.295
Frontal area (m2)2.28
Maximum engine torque (Nm)137
Nominal motor power (kW)20
Rated voltage (V)288
Table 13. Road test comparison results.
FactorRule-Based Control StrategyMultiple Driving Cycles OptimizationDriving Pattern Recognition
Total Mileage (km)21.6722.2321.24
Fuel Consumption (L)1.381.341.25
Corrected Fuel Consumption (L)1.451.401.27
Corrected Q100 (L/100 km)6.696.305.98

