1. Introduction
With the increasing penetration of renewable energy generation into the modern electric girds, meshed DC distributed power systems (DPS) have been widely adopted [
1,
2,
3]. The meshed DC DPS physically is composed of smaller power modules/subsystems. Usually, these smaller power modules/subsystems are designed only based on the stability requirement in its stand-alone operation, and thus it can operate well in the stand-alone application. However, the meshed DC DPS may become unstable due to the interaction among the modules/subsystems and the network [
4]. Furthermore, the negative resistance characteristic of the constant power load (CPL) is an important unstable factor.
Many stability methods in previous researches are given to analyze the stability of the single-source-single-load system or the parallel-source-parallel-load system [
4,
5,
6]. However, the network dynamics of the meshed DC DPS are often ignored, which affects the derivation of the equivalent system impendence. In addition, few of them have considered the meshed DC DPS including multiple sources with voltage-controlled converters and CPLs. A general approach for the stability analysis of the meshed DC DPS is to build its whole state-space model, and to identify the eigenvalues of the state matrix [
7]. However, this method requires the detailed models of loads and network dynamics, and the formulation of the system matrices may be very complex. To overcome this problem, the component connection method (CCM) is introduced for the stability analysis [
8]. In the CCM, the dynamics of network and power modules/subsystems are modeled separately by a set of two vector-matrix equations, which is beneficial to reduce the computation burden of formulating the system transfer matrices [
9]. For the ac power-electronics-based power system, the CCM is employed to derivate the closed-loop response transfer matrix of the overall power which can predict the instability of the power system [
10], but it does not separate the source impedance and load admittance with the network node admittance matrix. Thus, it is difficult to obtain the general stability criterion intuitionally. In this paper, the CCM is also employed and expanded to derive the stability criterion for the meshed DC DPS with the CPLs. The stability criterion can be simplified to relate only with the network node admittance matrix, the output impendence of the source, and the input admittance of the CPLs which can be separately obtained by theoretical calculation or impedance analyzer measurement.
Many stability enhancement methods have been given in previous researches. An adaptive active capacitor converter (AACC) is introduced to effectively stabilize the cascaded system [
11], but this method needs additional hardware devices. Another approach is to add a virtual adaptive parallel impedance [
12] or adaptive series-virtual-impedance [
13] in the input of the load converter to improve the stability in the cascaded DC/DC converter system. However, in the meshed DC DPS, it is not very effective due to the existence of an electromagnetic interference (EMI) filter for the CPL with a switching-mode power converter. The input admittance of the CPLs is mainly determined by the EMI filter, and the virtual impedance is difficult to be added by the load converter control part. Another way is to adjust the source output impedance. Modifying the source output impedance to be zero [
14] and adding virtual impedances in the source output filters [
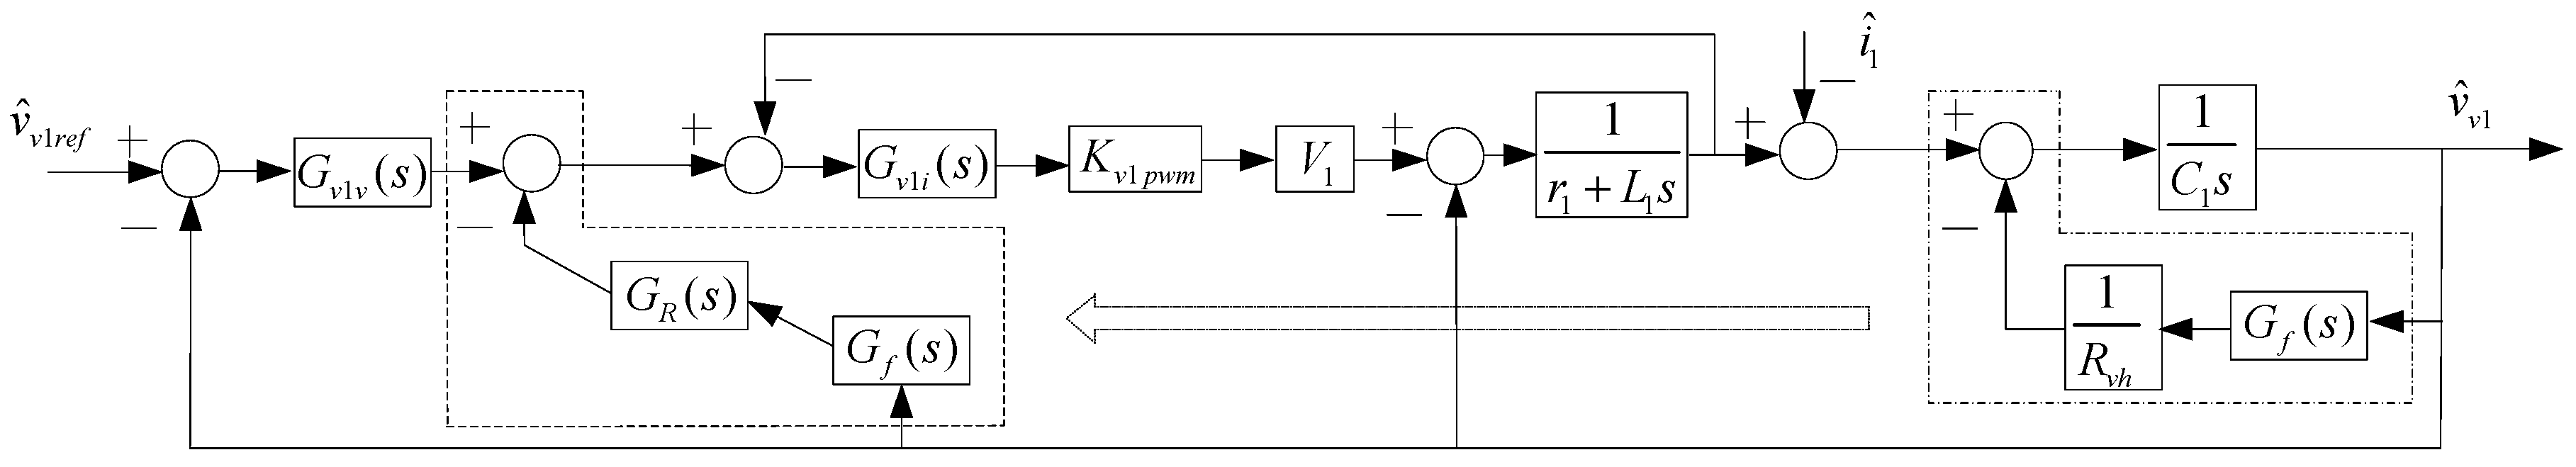
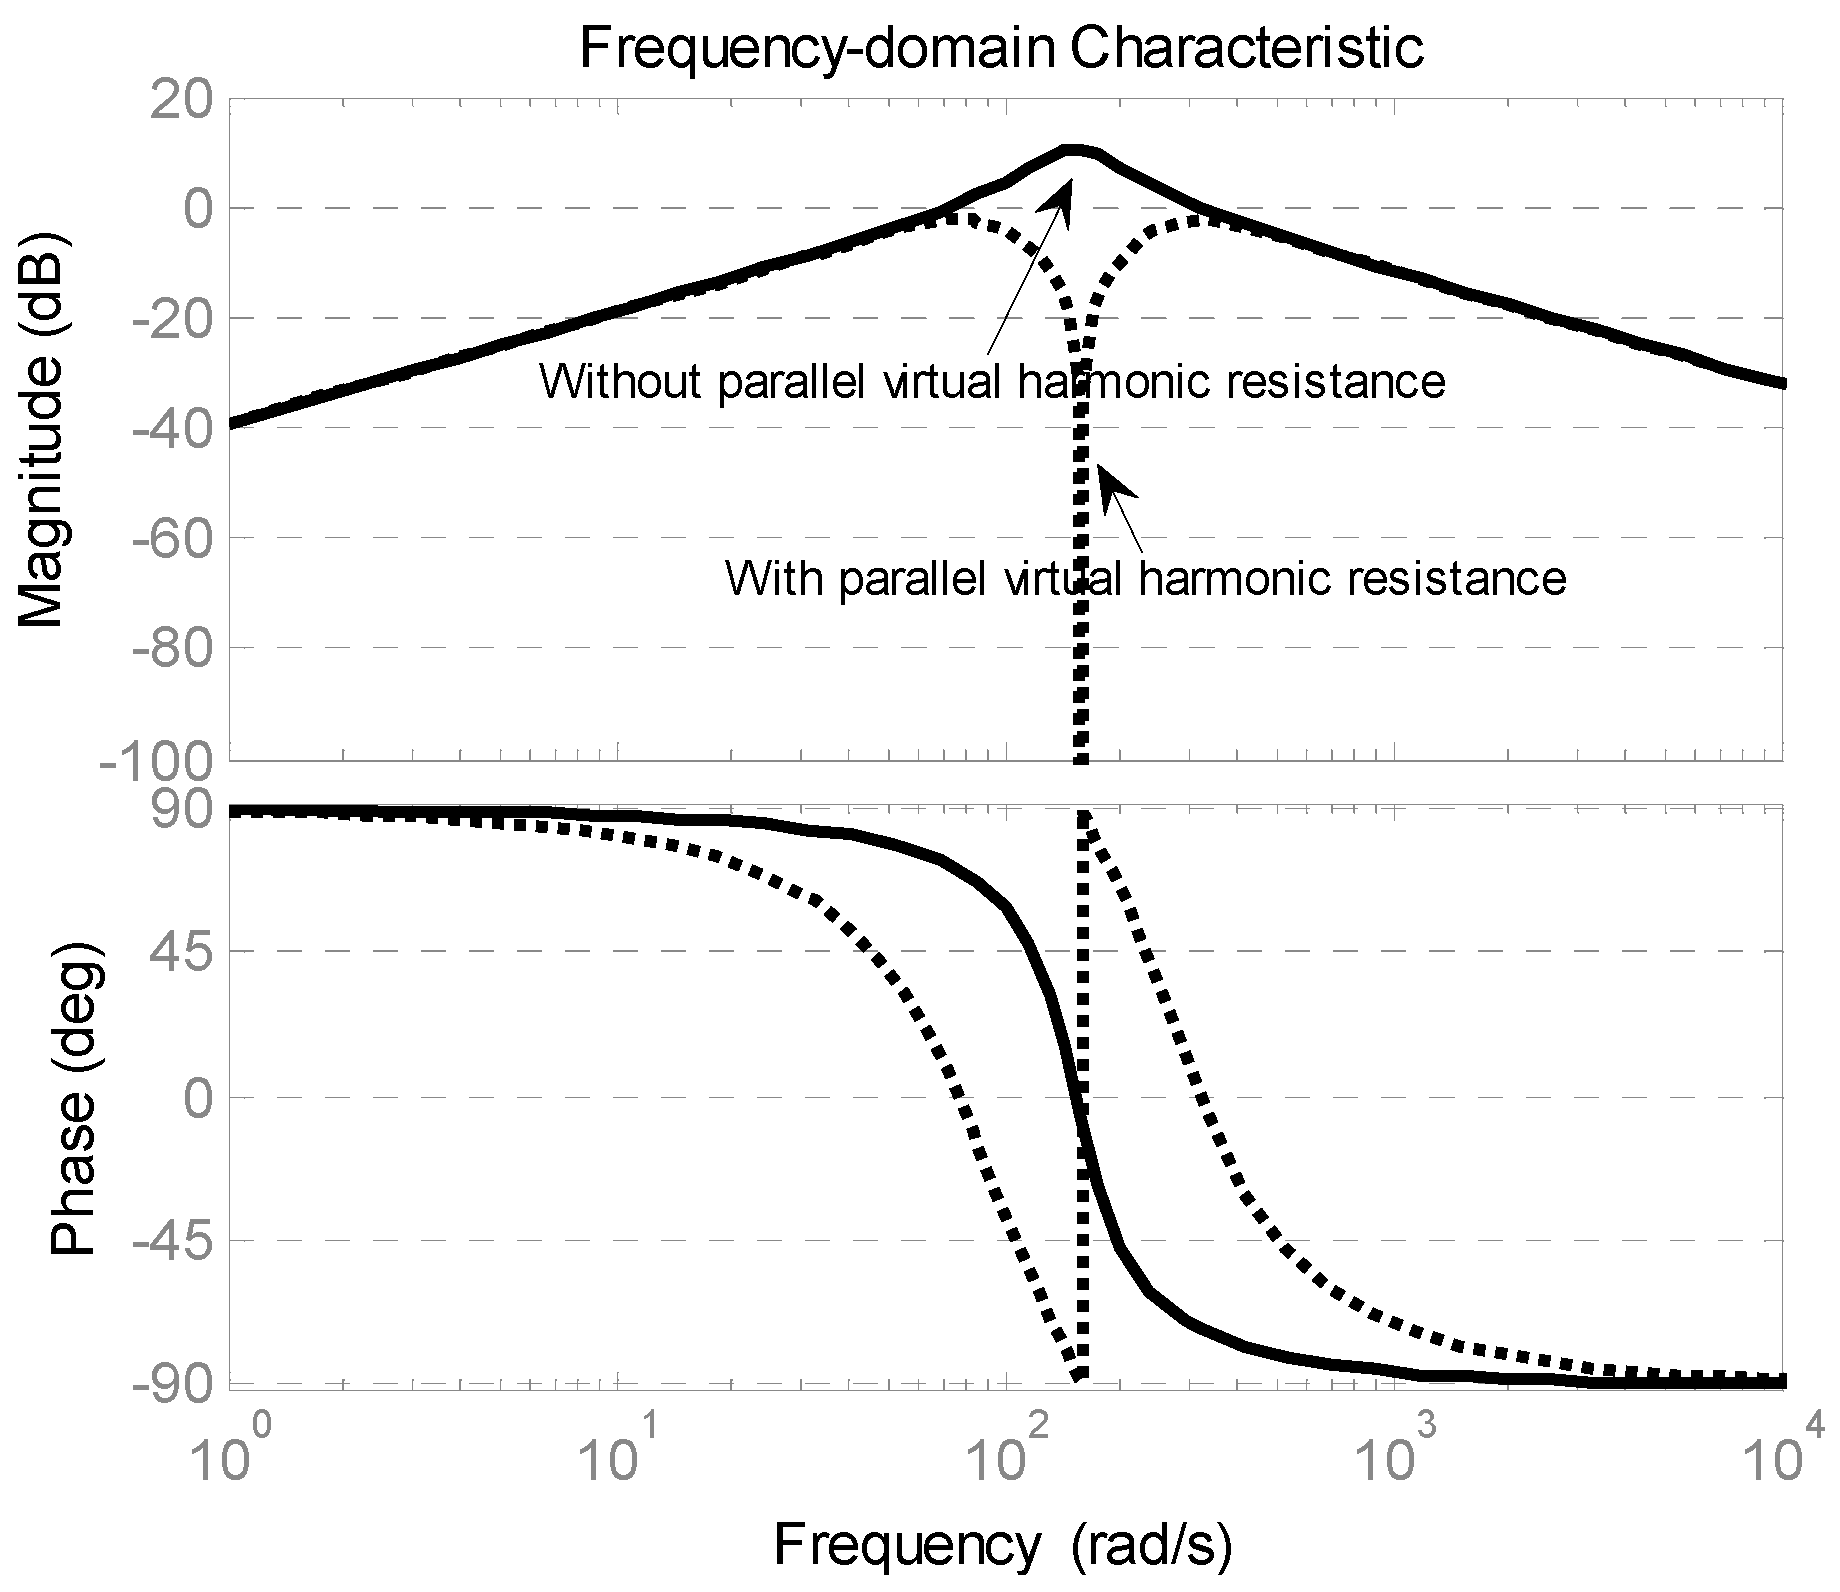
15] are both feasible strategies by the source converter control part, but both of them will influence the low and high frequency characteristics of the source output impedance. To overcome the problem, this paper proposes an effective and achievable method, which is to add a virtual harmonic resistance through the second-order generalized integrator (SOGI) in the source converter control part to lower the peak of the source output impendence.
The main contributions of this paper are follows. Firstly, the stability criterion for the meshed DC DPS is derived, which has been simplified to relate only with the network node admittance matrix, the output impendence of the source, and the input admittance of the CPLs. It is easy to implement, as the impedance and the admittance can both be separately obtained by the theoretical calculation or impedance analyzer measurement. Secondly, an effective stability enhancement method by adding a virtual harmonic resistance is proposed, with which only the small range middle frequency characteristic of the source output impedance is modified, while the low and high frequency characteristics of the source output impedance are still unmodified. The results of the nonlinear dynamic simulations verify the effectiveness of the proposed stability criterion and stability enhancement method.
The remainder of this paper is organized as follows. The stability criterion for the meshed DC DPS is given in
Section 2. The modeling of the source with voltage-controlled converters and the CPLs are derived, and the proposed stability enhancement method and the stability analysis for the meshed DC DPS are given in
Section 3. Then, the nonlinear dynamic simulations are conducted in
Section 4. At last, conclusions are drawn in
Section 5.
2. Stability Criterion for the Meshed DC DPS
The general form of DC DPS is given in [
4], but it ignores the network dynamics. In [
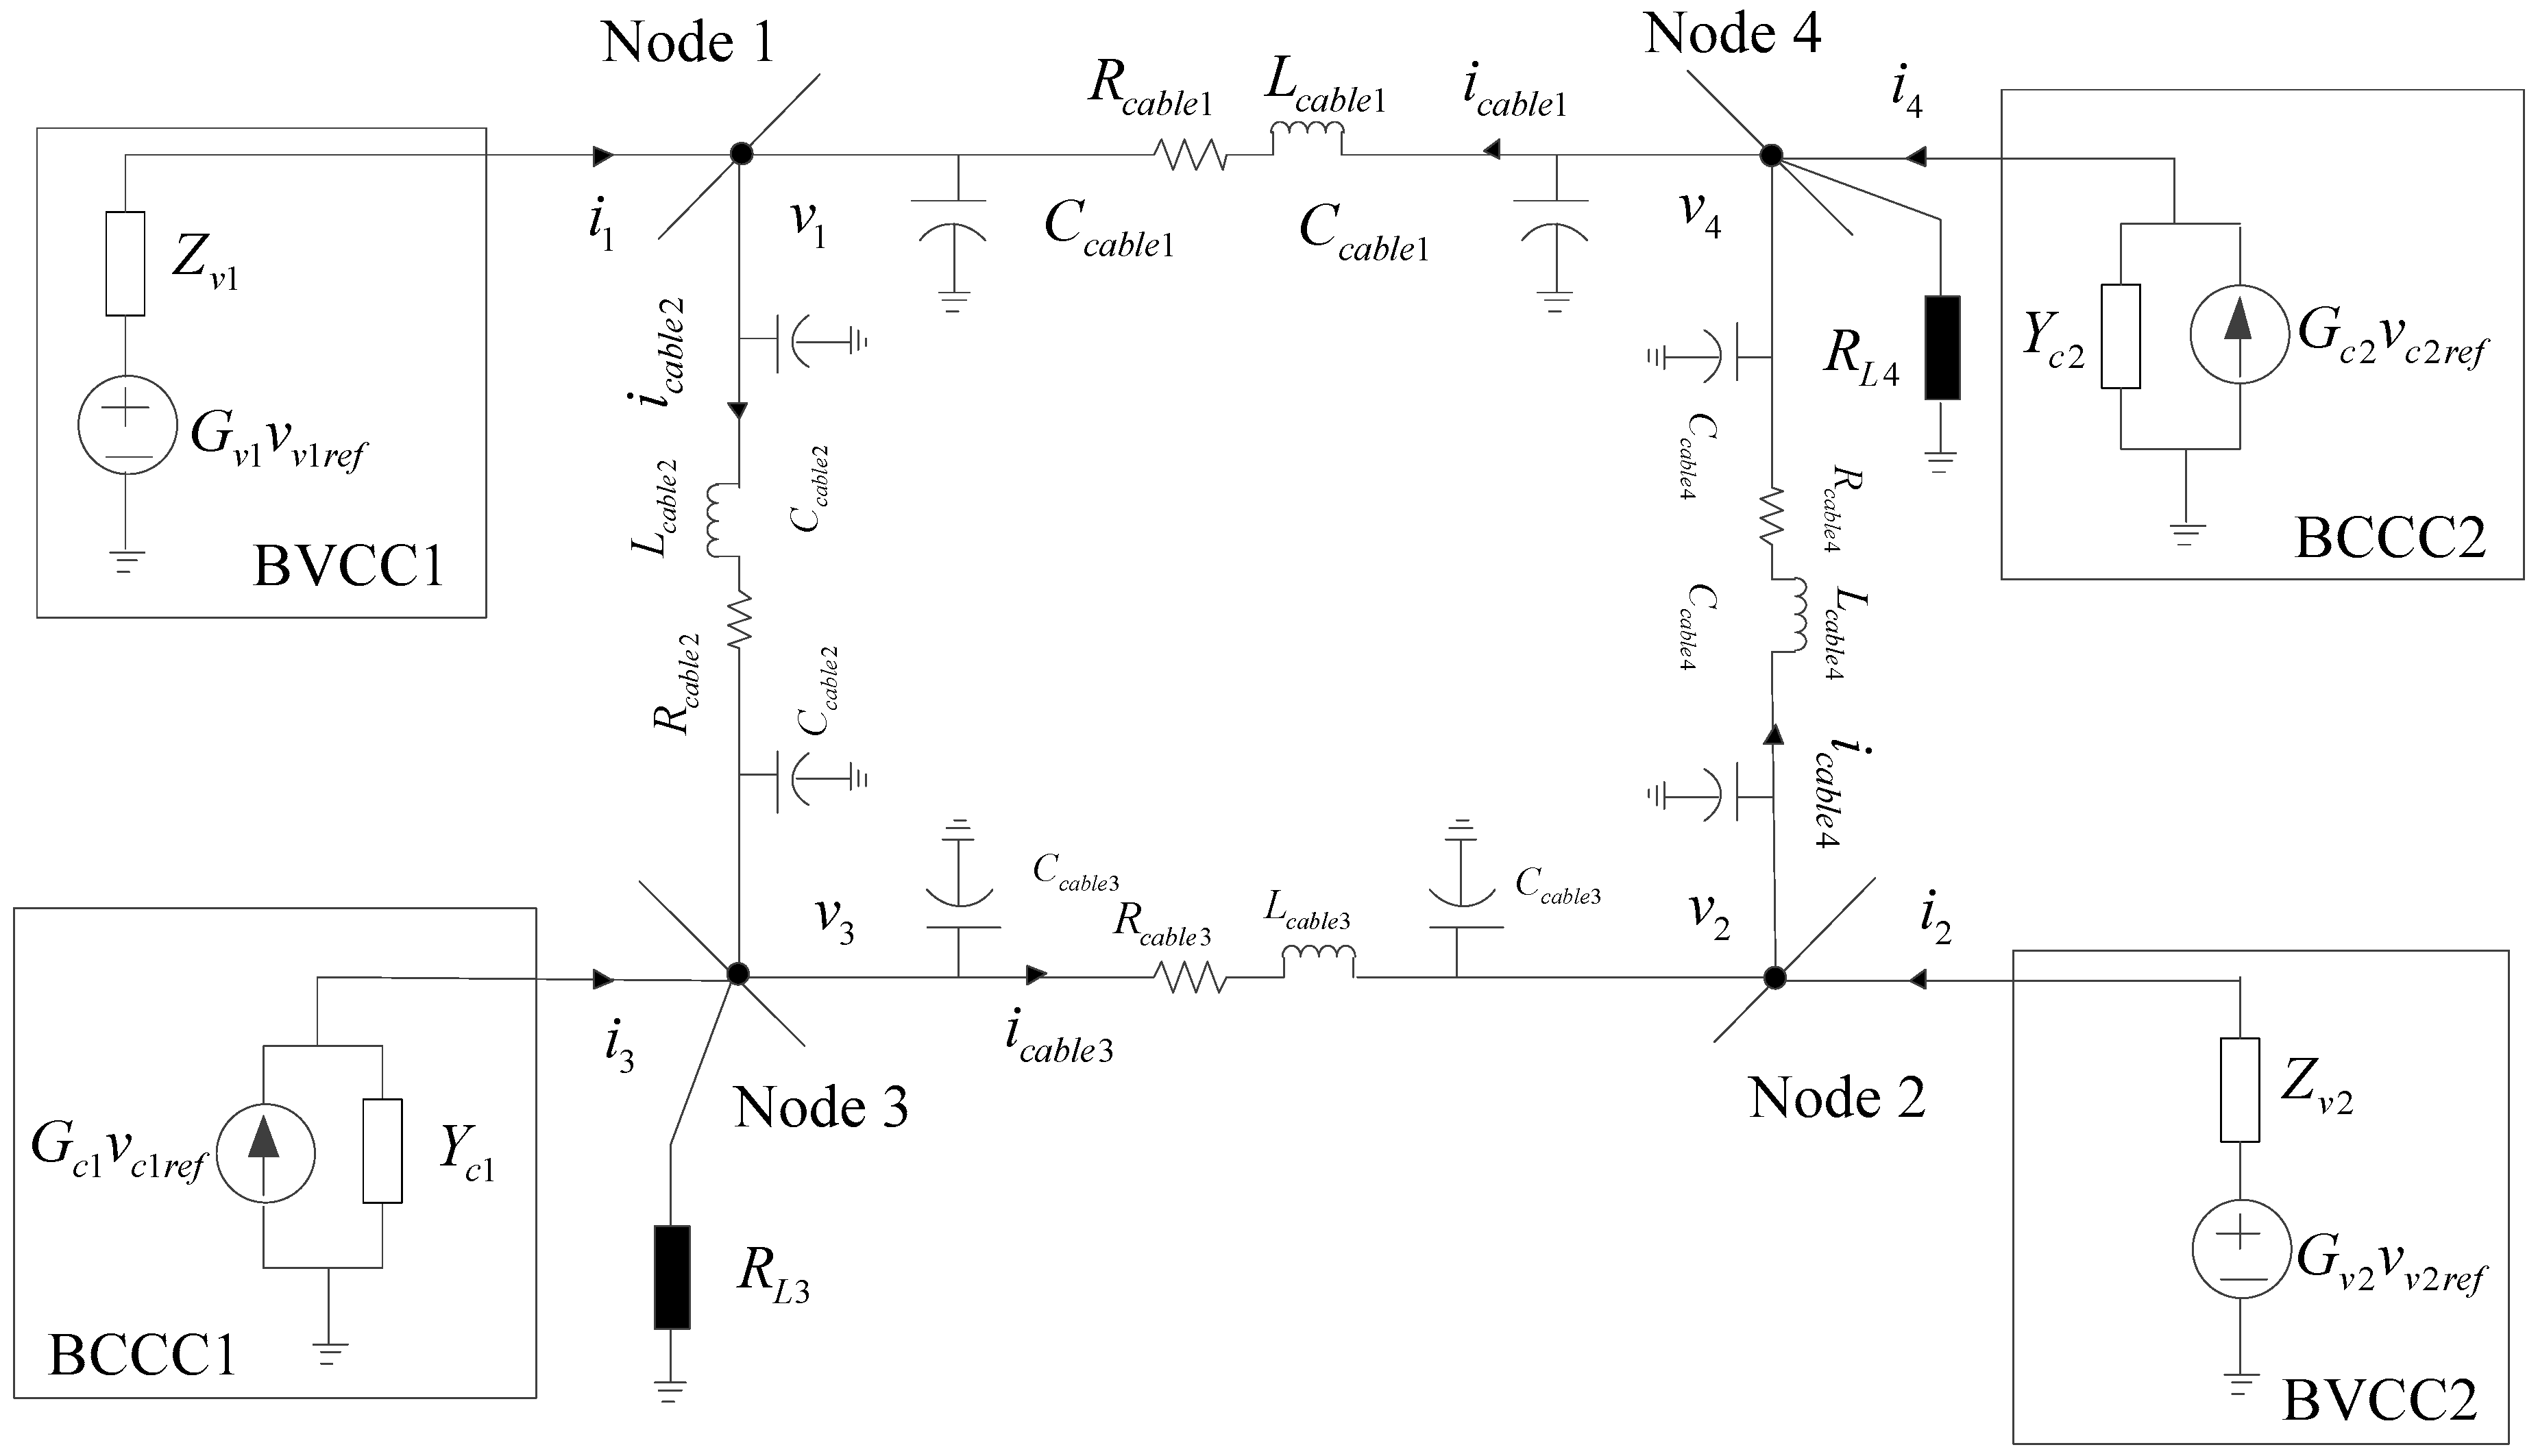
4], any converter in a DC DPS can be classified as either a bus voltage controlled converter (BVCC) or a bus current controlled converter (BCCC). In this study, a four node meshed DC DPS as
Figure 1 is considered as an example, which is composed by two sources with voltage-controlled converters and two CPLs. The sources with voltage-controlled converters are controlled with constant voltage, hence they can be treated as BVCCs. The CPLs are controlled to absorb constant power from the meshed DC DPS, hence they can be treated as BCCCs.
Although all of the sources and CPLs are independently designed well, there will be complex interactions through the power cables in the meshed DC DPS. This consequently necessitates the use of CCM to analyze the stability of the meshed DC DPS.
The block diagram of the CCM applied for the studied meshed DC DPS is shown in
Figure 1, where the CCM decomposes the overall DPS into four subsystems and the network. The two BVCCs are modeled by the Thevenin equivalent circuits [
16], and the two BCCCs are modeled by the Norton equivalent circuits [
17].
In
Figure 1,
and
are the closed-loop output impedances of the sources, and
and
are the closed-loop input admittances of the CPLs.
is the node voltage column vector, and
is the node injection current column vector.
is the cable current column vector.
and
are the resistive loads connected to node 3 and node 4, respectively.
is the inductance column vector of cables,
is the parasitic resistance column vector of cables, and
is the capacitance column vector of cables.
is the voltage reference-to-output transfer function column vector of the source and CPLs.
is the reference voltage column vector of the source and CPLs, respectively.
Generally, the source is designed to be a voltage source that is stable when unloaded, and the CPL is designed to be stable when supplied by an ideal voltage source. That is, the unterminated behaviors of inverters are stable, and are stable, which means that there are no right-half plane poles.
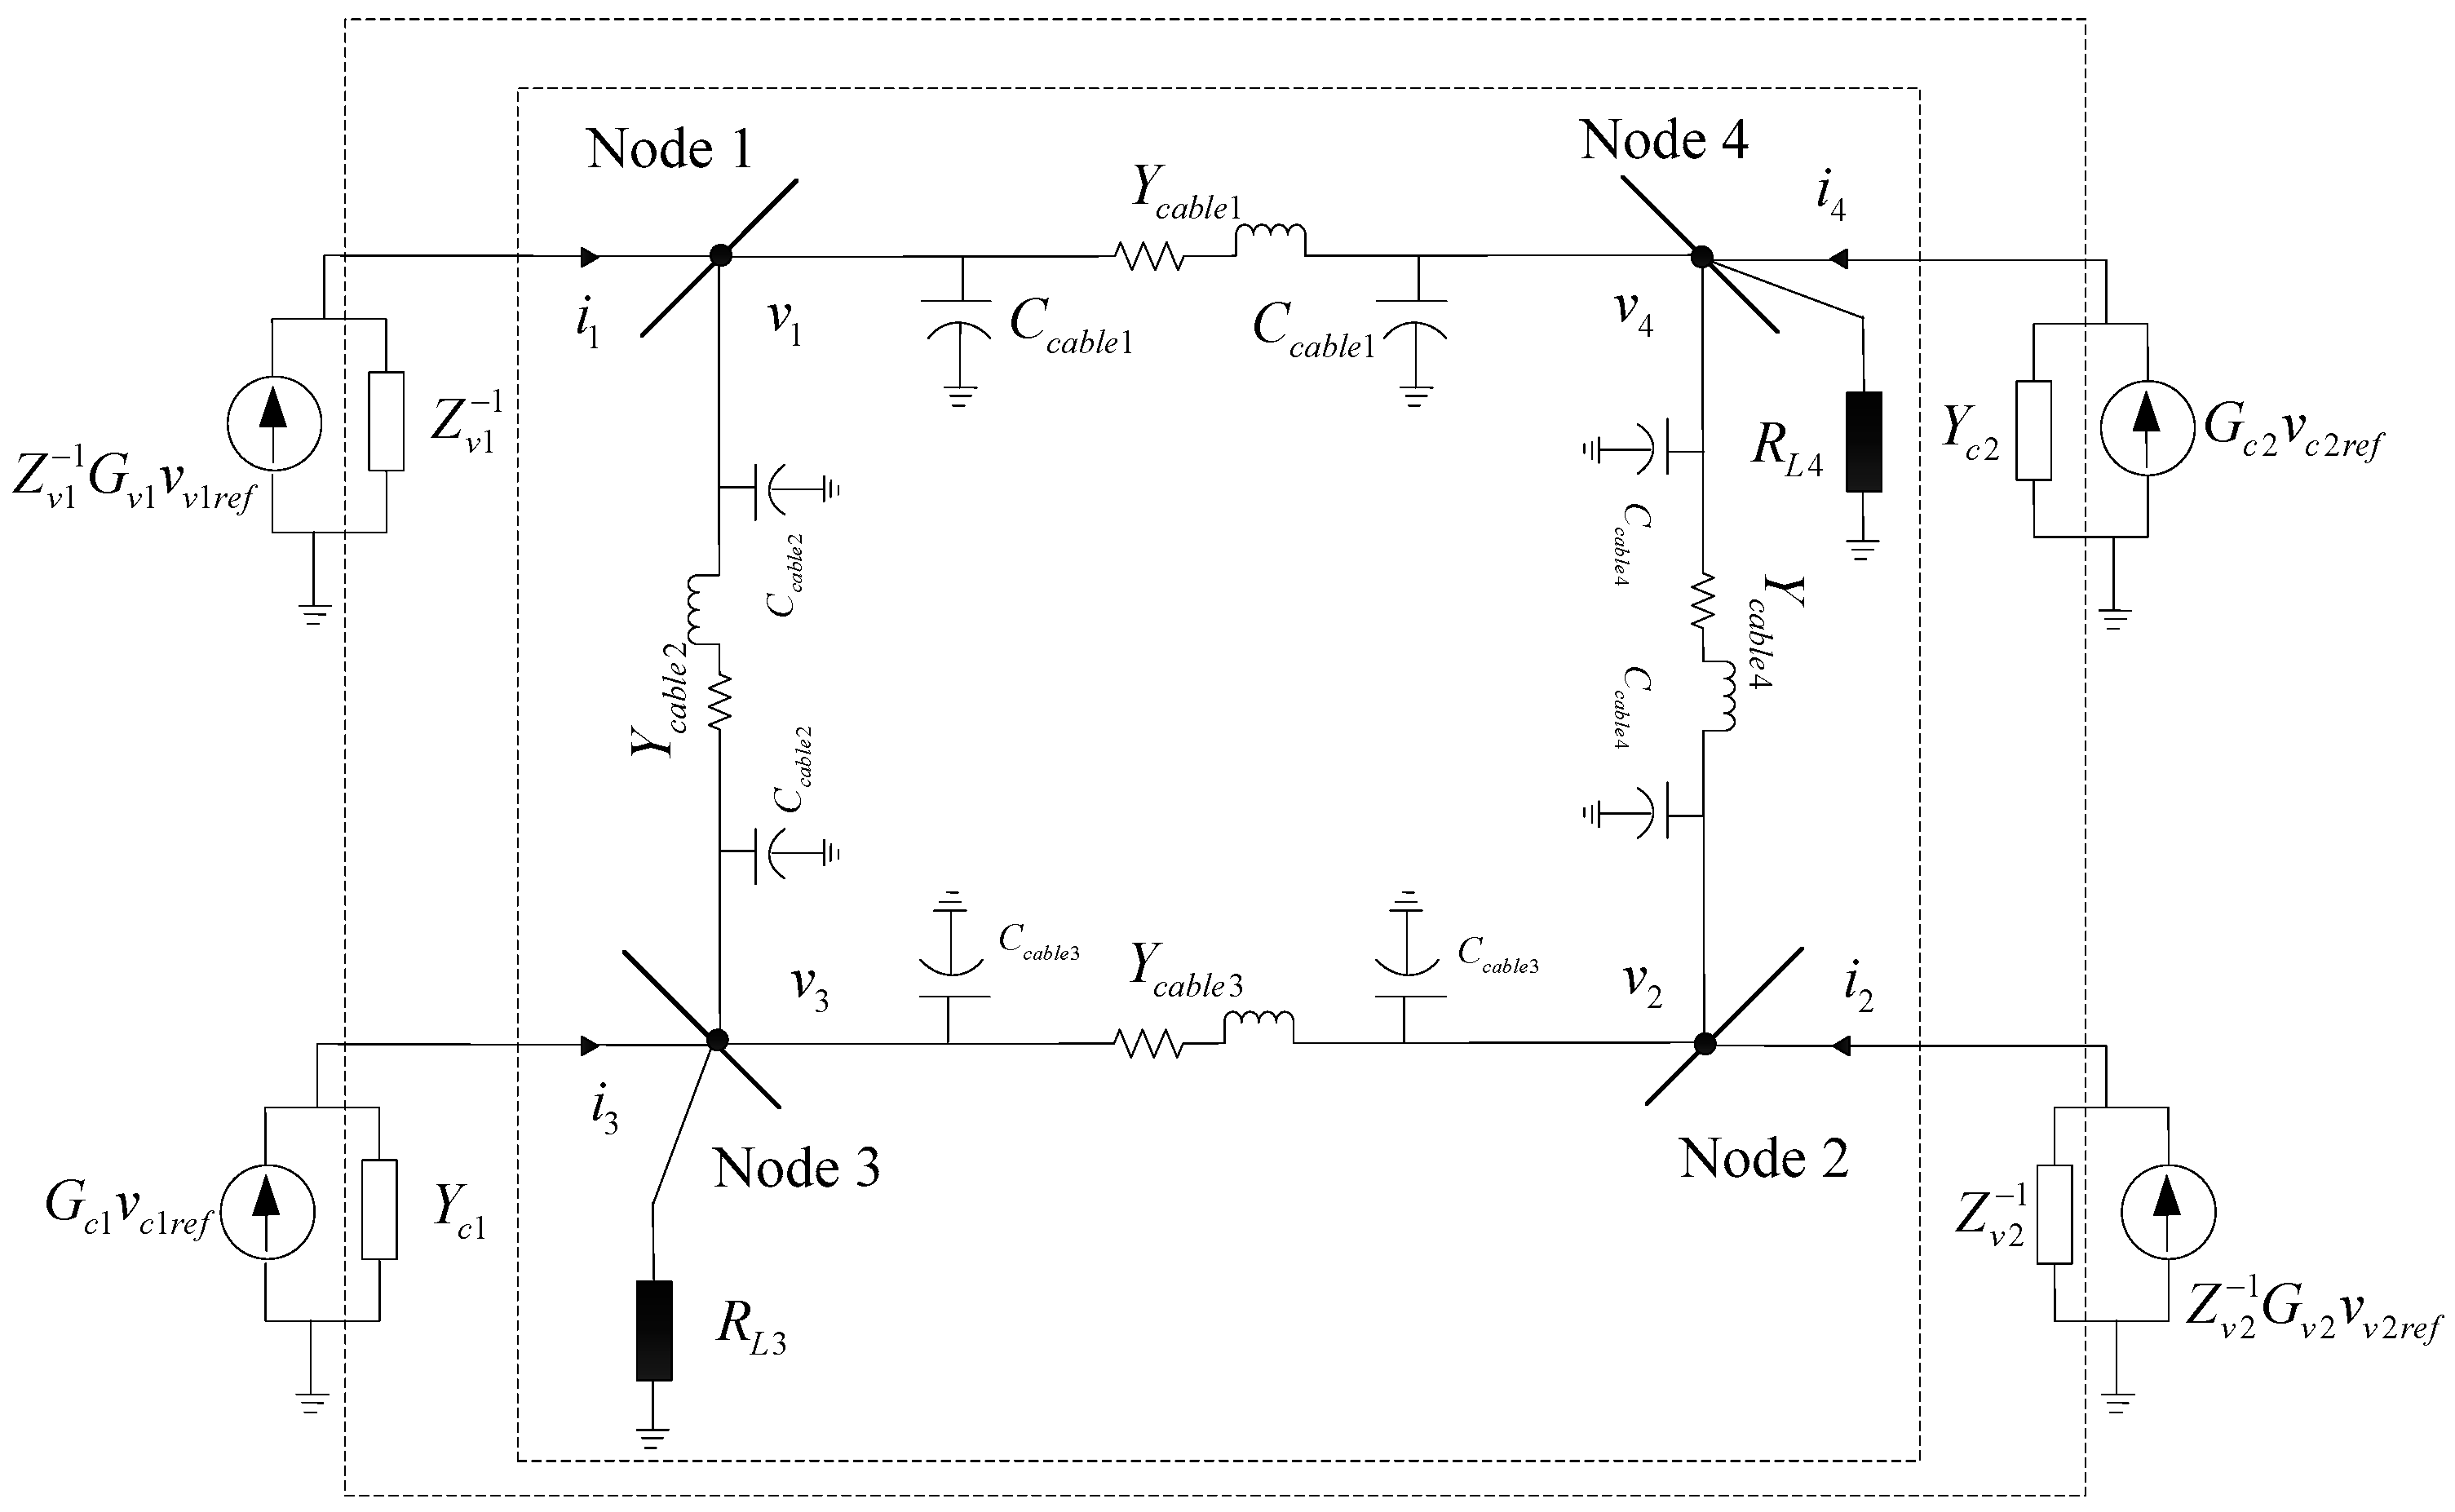
To facilitate the formulation of the nodal admittance matrix, the Thevenin circuits of the BVCCs are converted to Norton circuits [
10]. Then, the studied meshed DC DPS is represented as
Figure 2.
Applying the node voltage equation to the external dashed box part in
Figure 2, it can be derived as
where
is the network nodal admittance matrix as
where
and
are the admittances for loads connected to node 3 and node 4, respectively.
~
are the admittances for cables and
.
Then, the node voltage can be derived from (1) as follows:
where
is the set of the closed-loop output impedances of the sources, and
is the set of the closed-loop input admittances of the CPLs.
is the set of node voltages, and
is the set of the node injection currents.
is the the set of voltage reference-to-output transfer functions of the source,
is the the set of voltage reference to output transfer functions of the CPLs,
is the set of voltage references of the source, and
is the set of voltage references of the CPLs.
is a unit diagonal matrix whose dimension is equal to
.
is a unit diagonal matrix whose dimension is equal to
. And they satisfy the following relations:
Applying the node voltage equation to the internal dashed box part in
Figure 2,
can be derived as:
In the above equation,
is the network nodal admittance matrix for a real physical system, which means
is stable and has no right-half plane poles.
and
are both stable as in the above analysis. Therefore, the stability criterion of the meshed DC DPS
is
If the stability criterion has right-half plane poles, the meshed DC DPS will be unstable. Through the analysis of the stability criterion , it can be found that the stability of the meshed DC DPS is only related to the network node admittance matrix , the output impendence of the sources , and the input admittance of the CPLs , which can be separately obtained by theoretical calculation or impedance analyzer measurement.
4. Nonlinear Dynamic Simulations
To validate the effectiveness of the proposed stability criterion and stability enhancement method, the meshed DC DPS in
Figure 1 is built in the nonlinear time-domain simulation by using Matlab/Simulink. The electrical and controller parameters are all given in
Appendix B.
To compare the proposed stability criterion
and the previous stability criterion
, the cables are chosen to be long cables with parameters
, the nonlinear dynamic simulation results of the node 1 voltage
and the cable 1 current
are shown in
Figure 15. As can be seen in
Figure 15, before 2.5 s, the meshed DC DPS gradually becomes to a stable state with
, and once the power of resistive load 4
reduces to 15 kW at 2.5 s, the meshed DC DPS becomes to an oscillation state. The oscillation amplitude gradually grows, and the oscillation period is about 0.066 s, which satisfy the theoretical analysis in
Figure 10. The results verify the effectiveness of the proposed stability criterion
compared to the previous stability criterion
which does not take the network dynamics into account.
To verify the effectiveness of the proposed stability criterion
with power changes of the resistive load and CPL, and the proposed stability enhancement method, the nonlinear dynamic simulation results are shown as the following
Figure 16,
Figure 17 and
Figure 18.
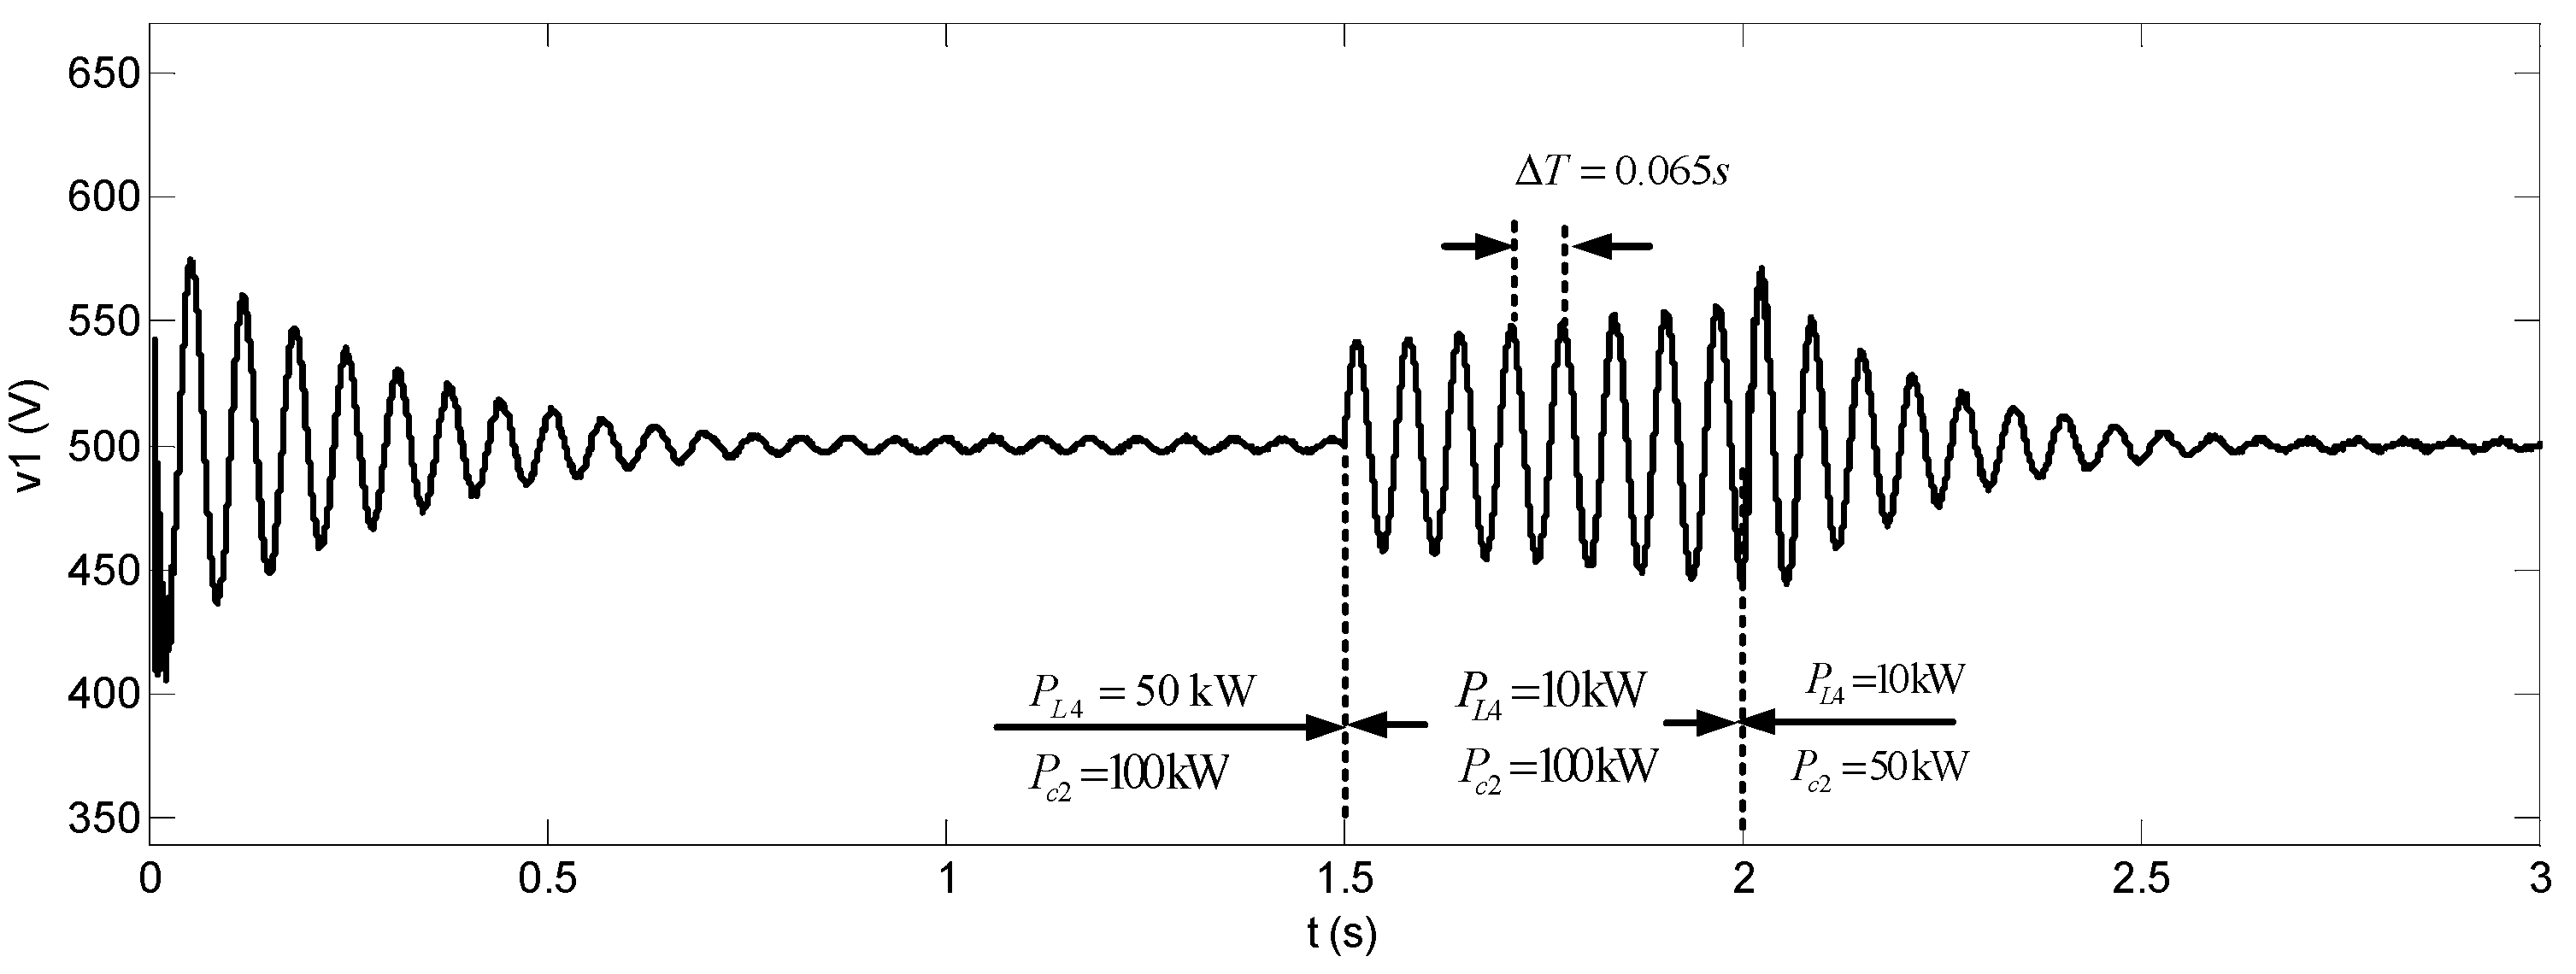
As can be seen in
Figure 16, before 1.5 s, the meshed DC DPS gradually becomes to stable state with
and
, which confirms the theoretical analysis in
Figure 11. Then, the power of resistive load 4
reduces to 10 kW at 1.5 s, the meshed DC DPS becomes to the oscillation state with about period 0.065 s, which confirms the theoretical analysis in
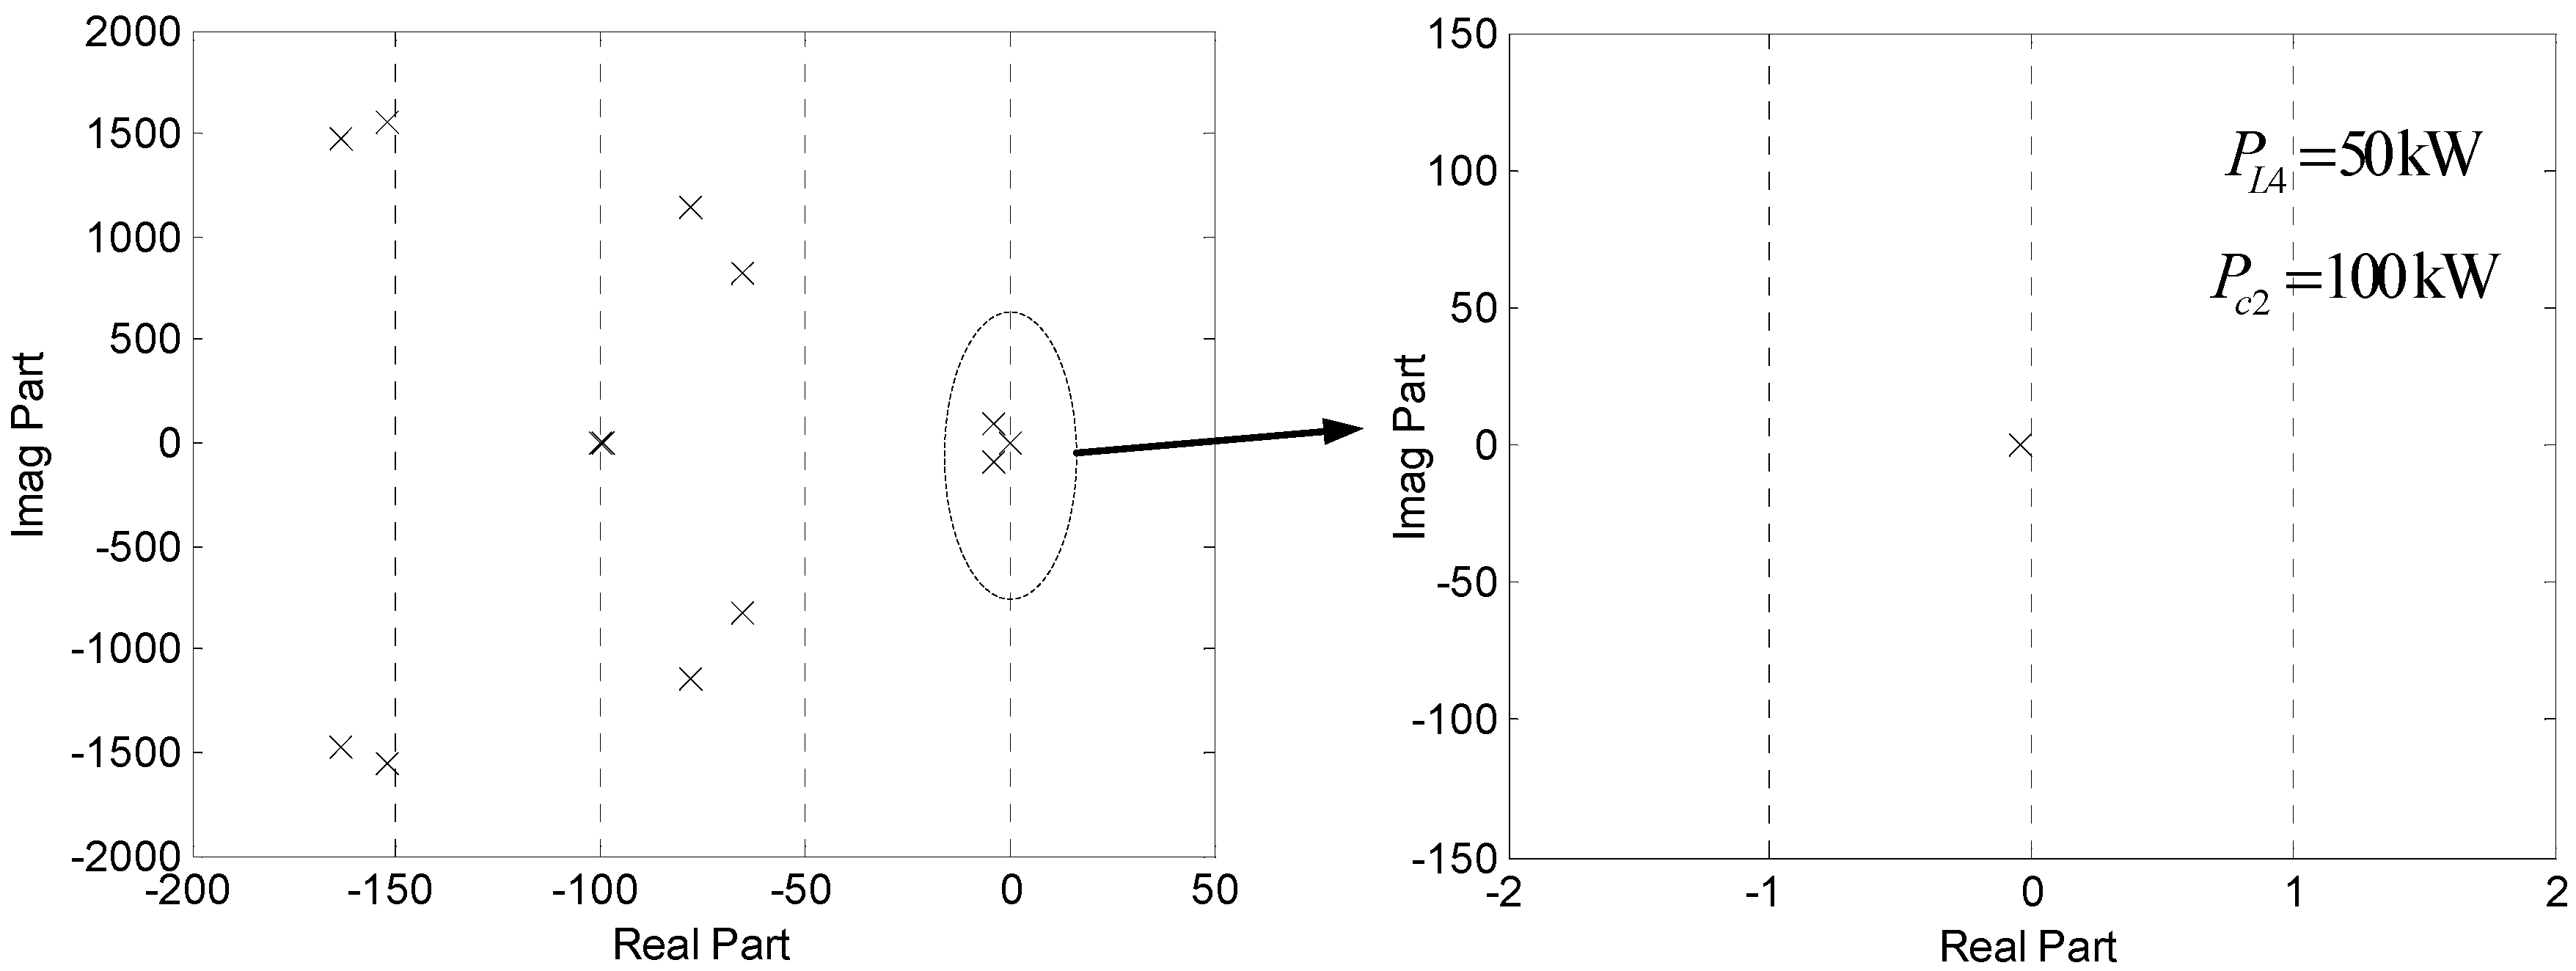
Figure 12. The power of CPL2 reduces from 100 kW to 50 kW at 2 s, and the meshed DC DPS becomes to a stable state again, which confirms the theoretical analysis in
Figure 13.
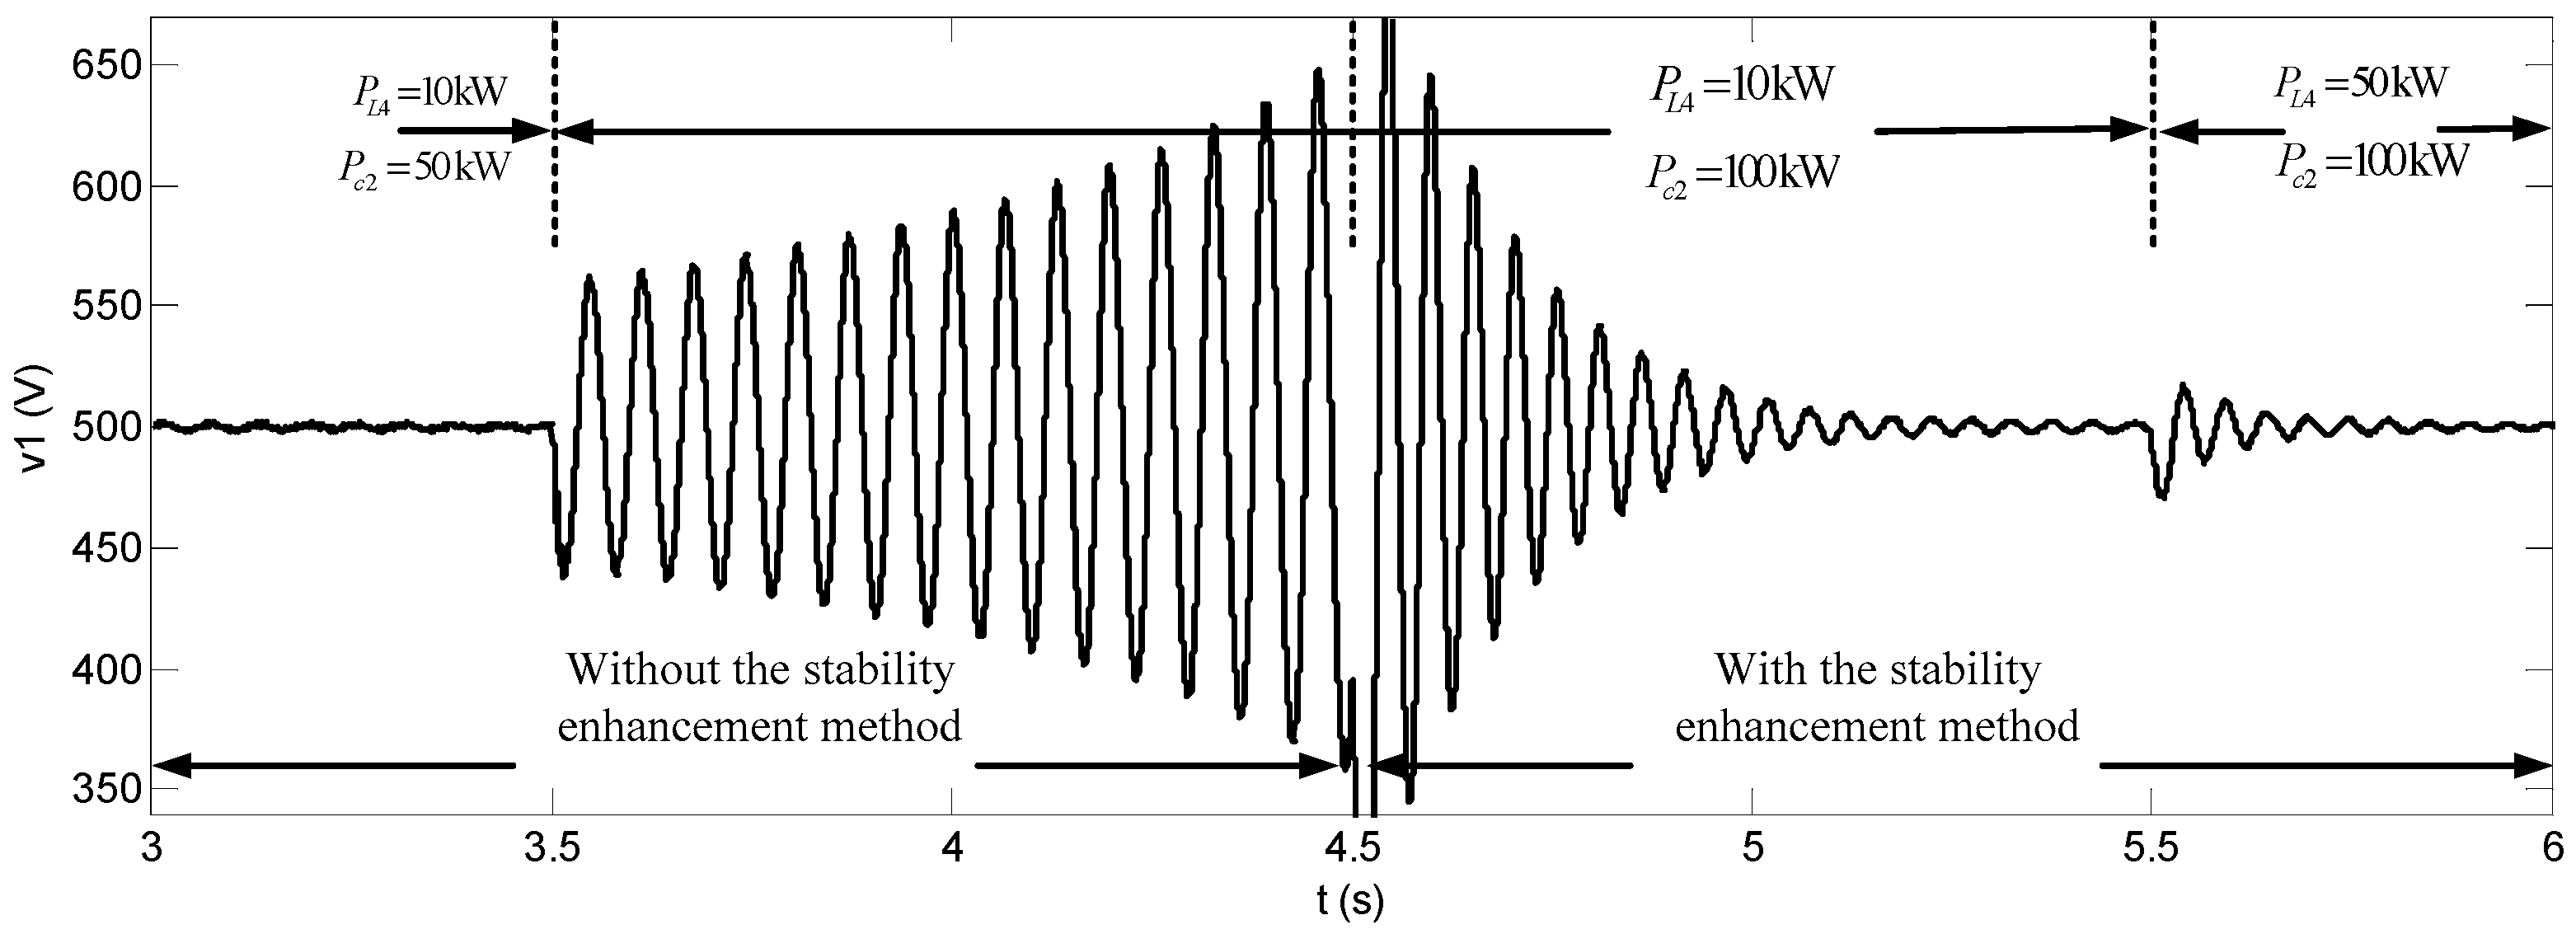
As can be seen in
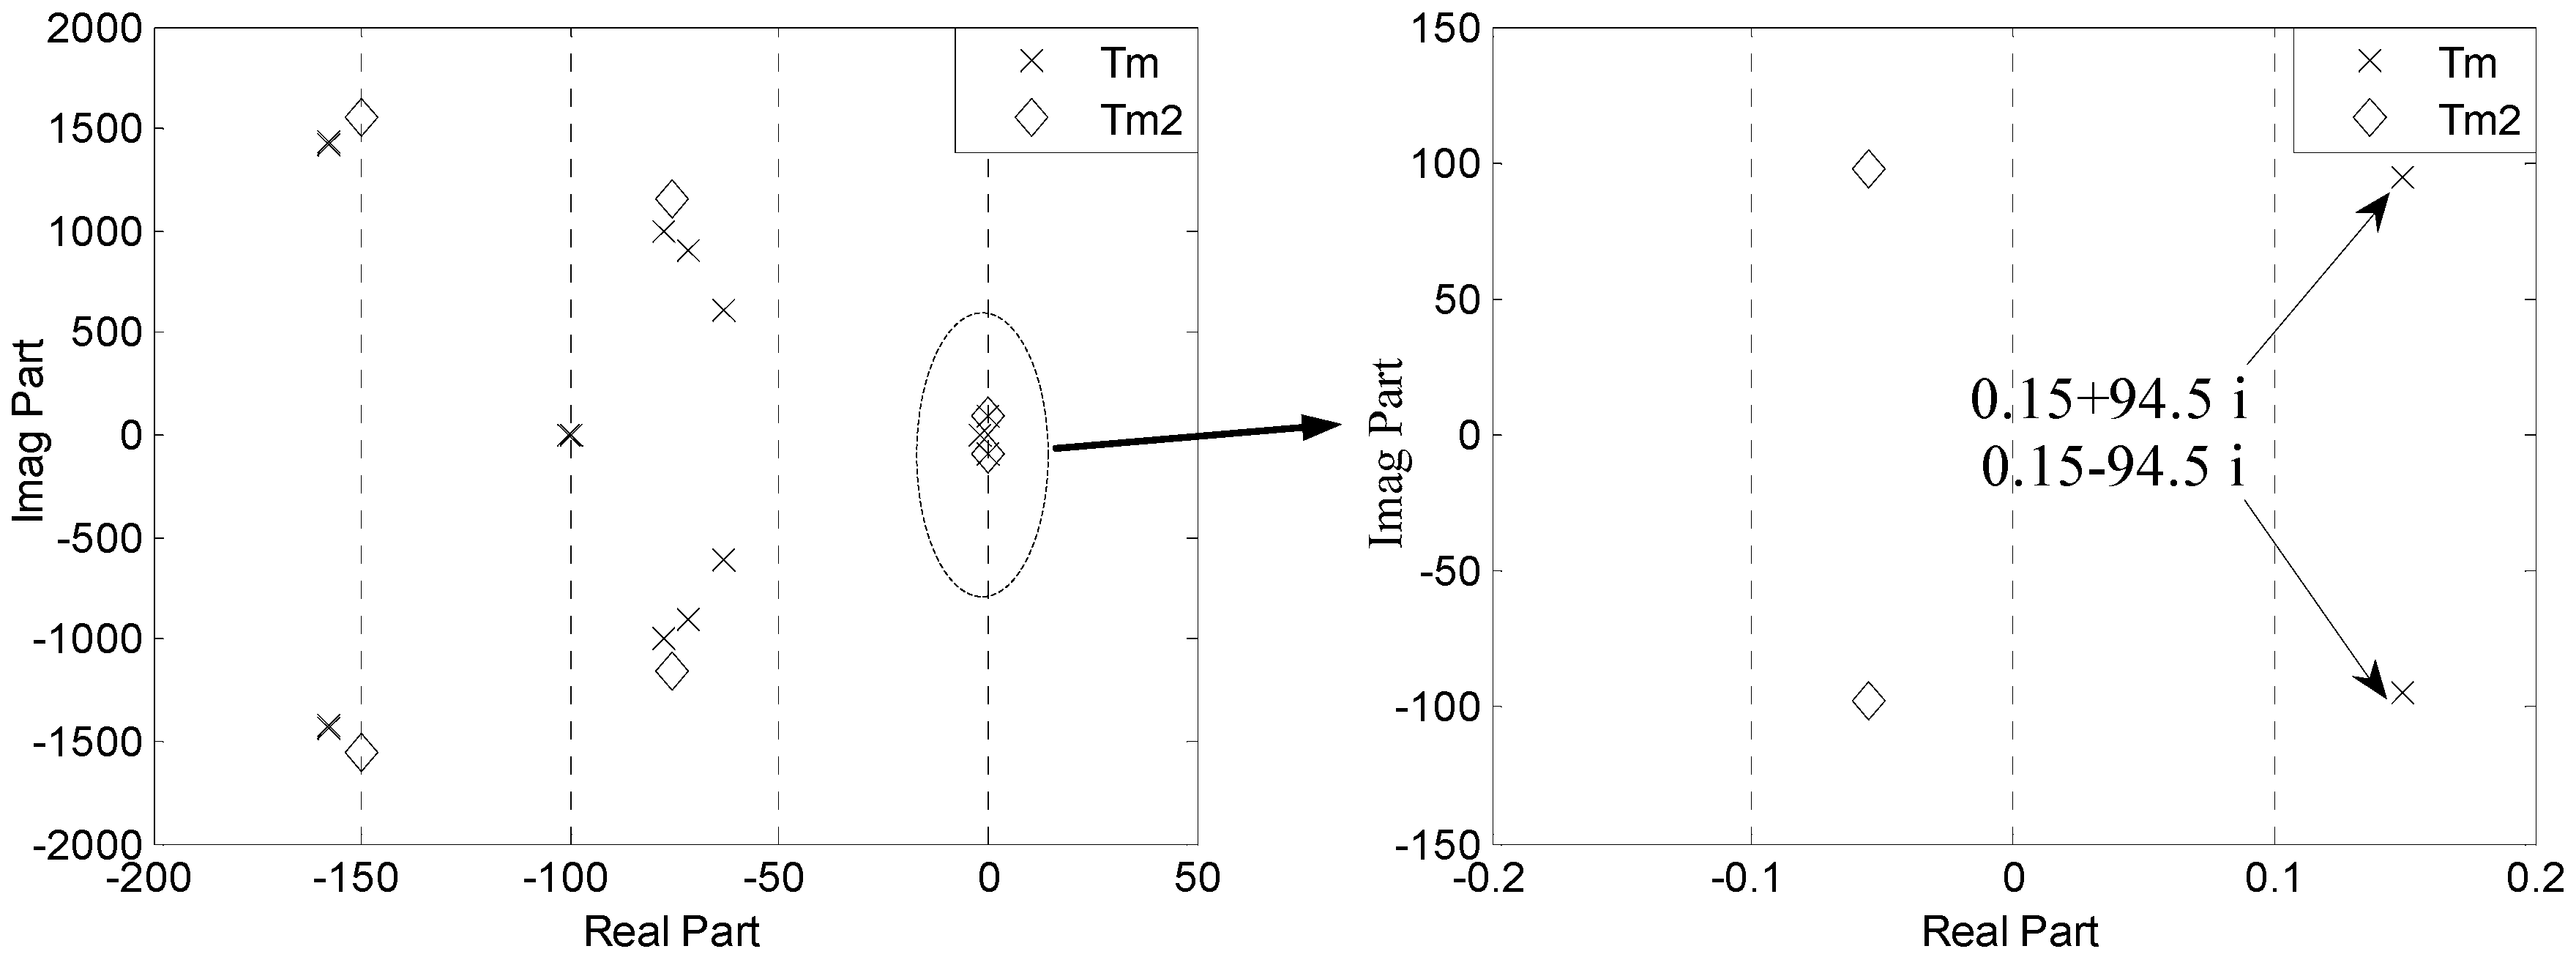
Figure 17, when the power of CPL2 increases from 50 kW to 100 kW at 3.5 s, the meshed DC DPS becomes to the oscillation state again between 3.5–4.5 s. Then, the vitural harmonic resistances are added in the controllers of source 1 and source 2 at 4.5 s. With the vitural harmonic resistance, the meshed DC DPS becomes to the stable state again, and the node 1 voltage
converges again to the steady value 500 V. The simulation results between 4.5–5.5 s confirm the theoretical analysis results in
Figure 14. The power of resistive load 4
increases to 50 kW at 5.5 s, and the meshed DC DPS is maintained at a steady state.
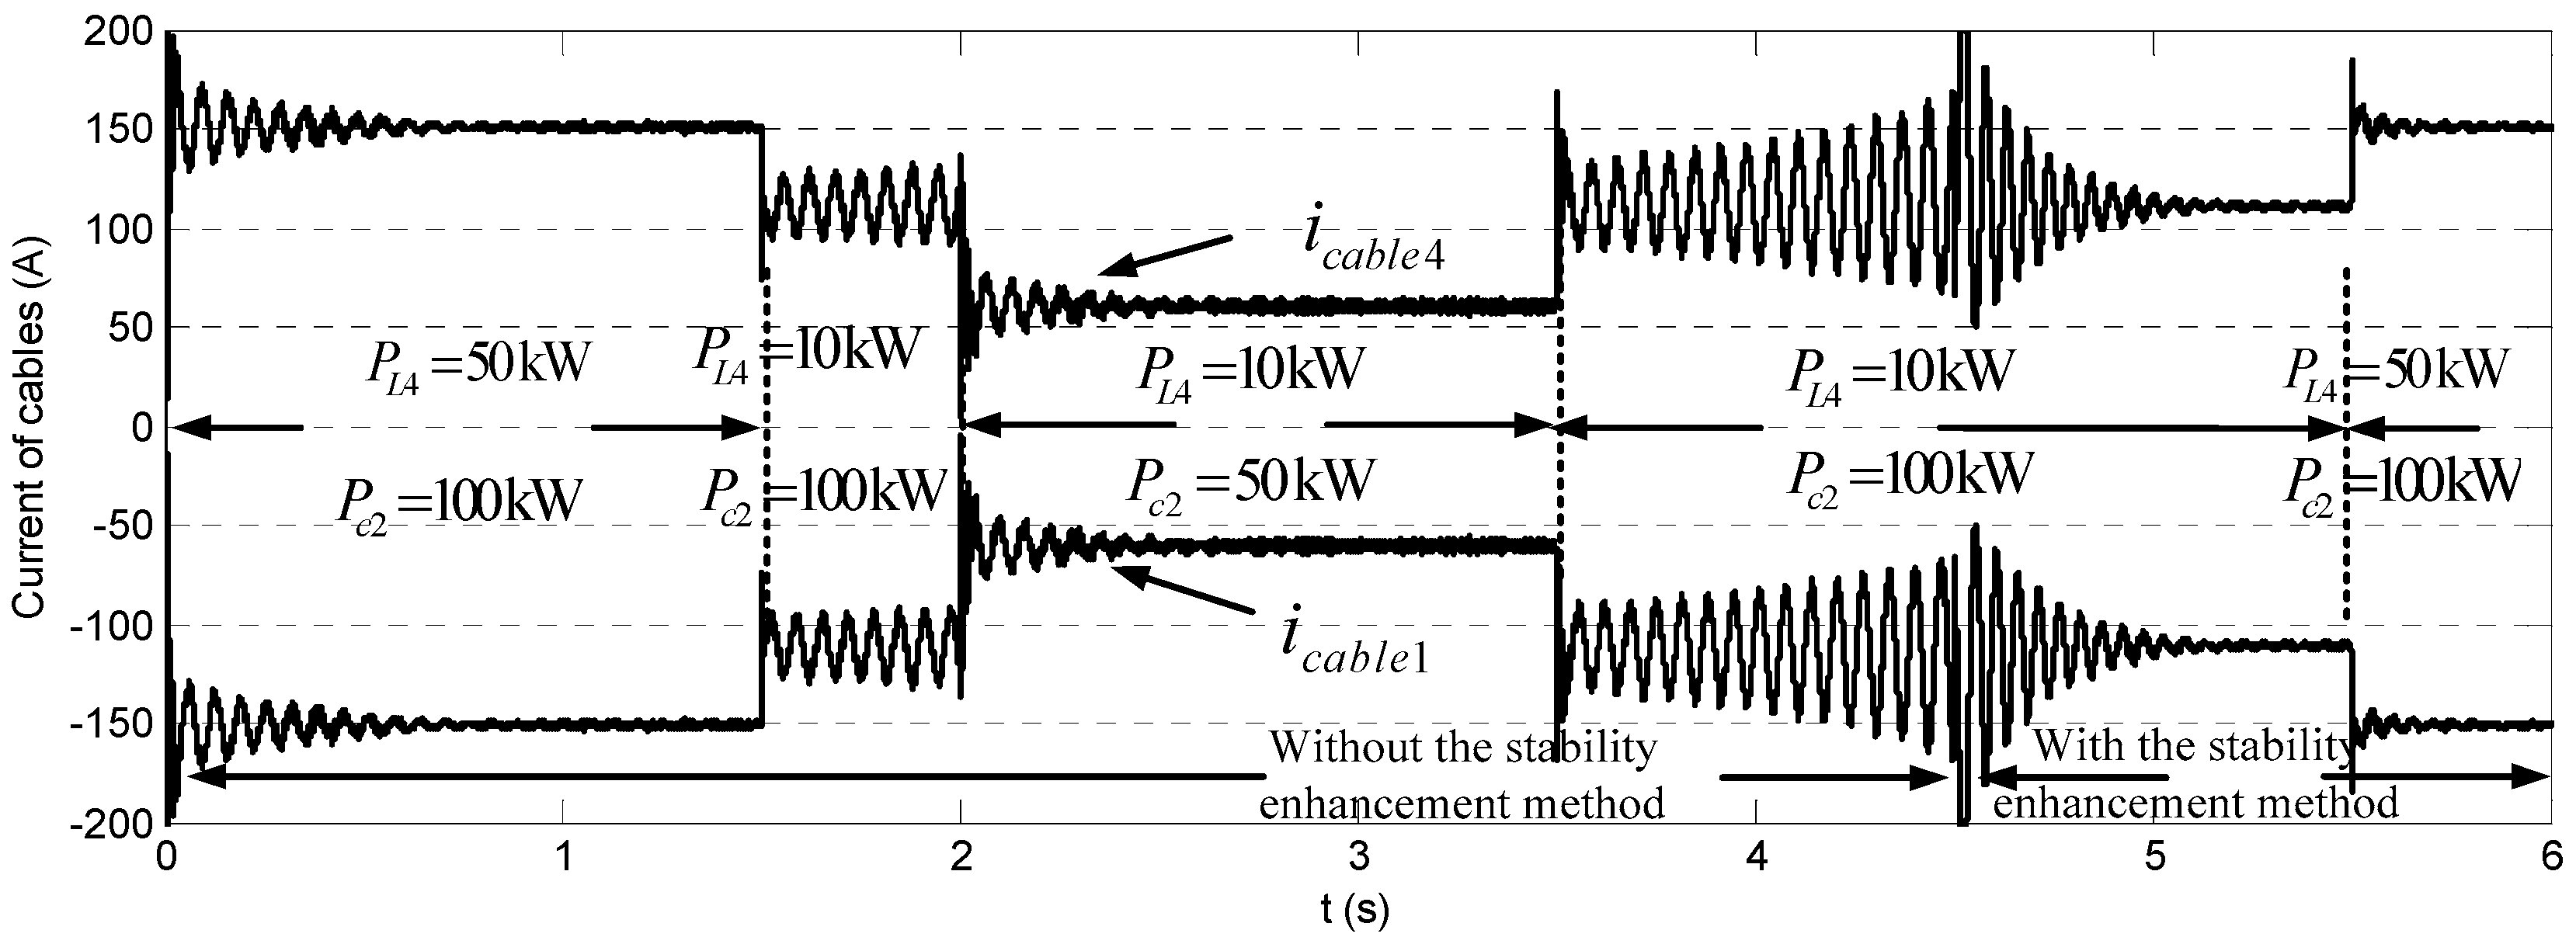
The currents of cable 1
and cable 4
are displayed as
Figure 18. The steady state and unstable state are similar to the node 1 voltage
as shown in
Figure 16 and
Figure 17. It is worth noting that the steady state current values in 0–1.5 s and 5.5–6 s are the same, which means that with or without the proposed stability enhancement method, the current distributions in the meshed DC DPS are not affected, which verifies that the low frequency characteristic of the source output impedance has not been modified.


