
Detection of Internal Short Circuit in Lithium Ion Battery Using Model-Based Switching Model Method

Abstract
:1. Introduction
2. Switching Model Method
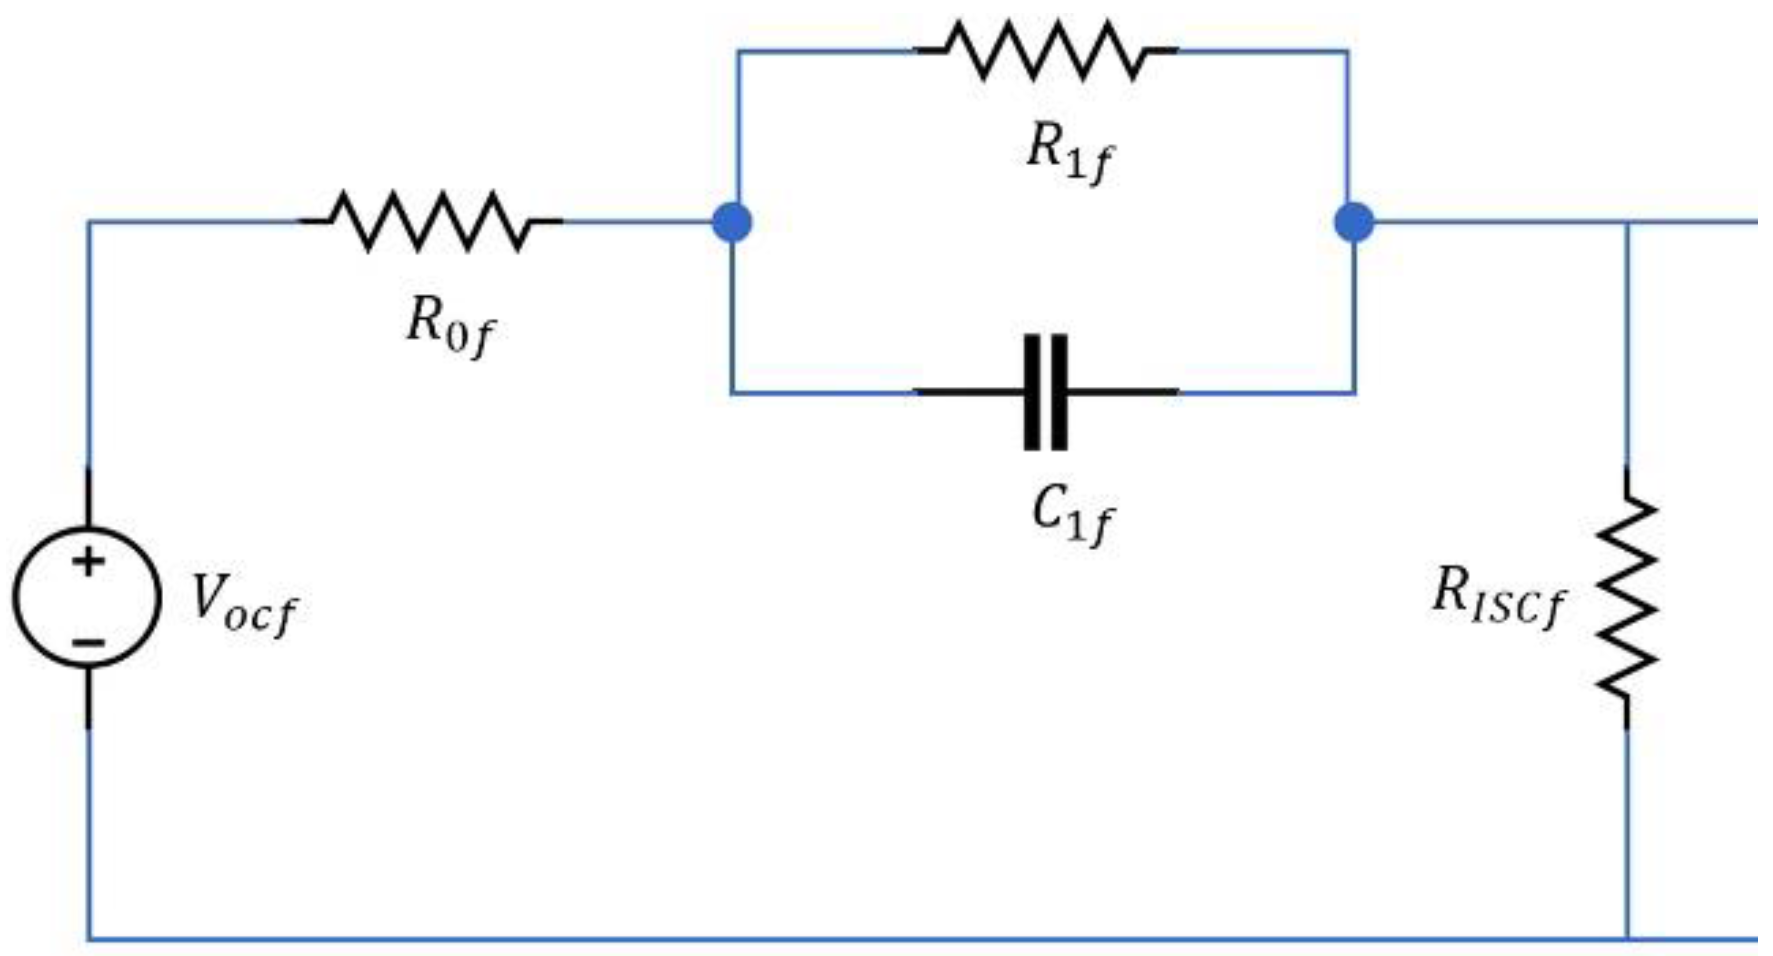
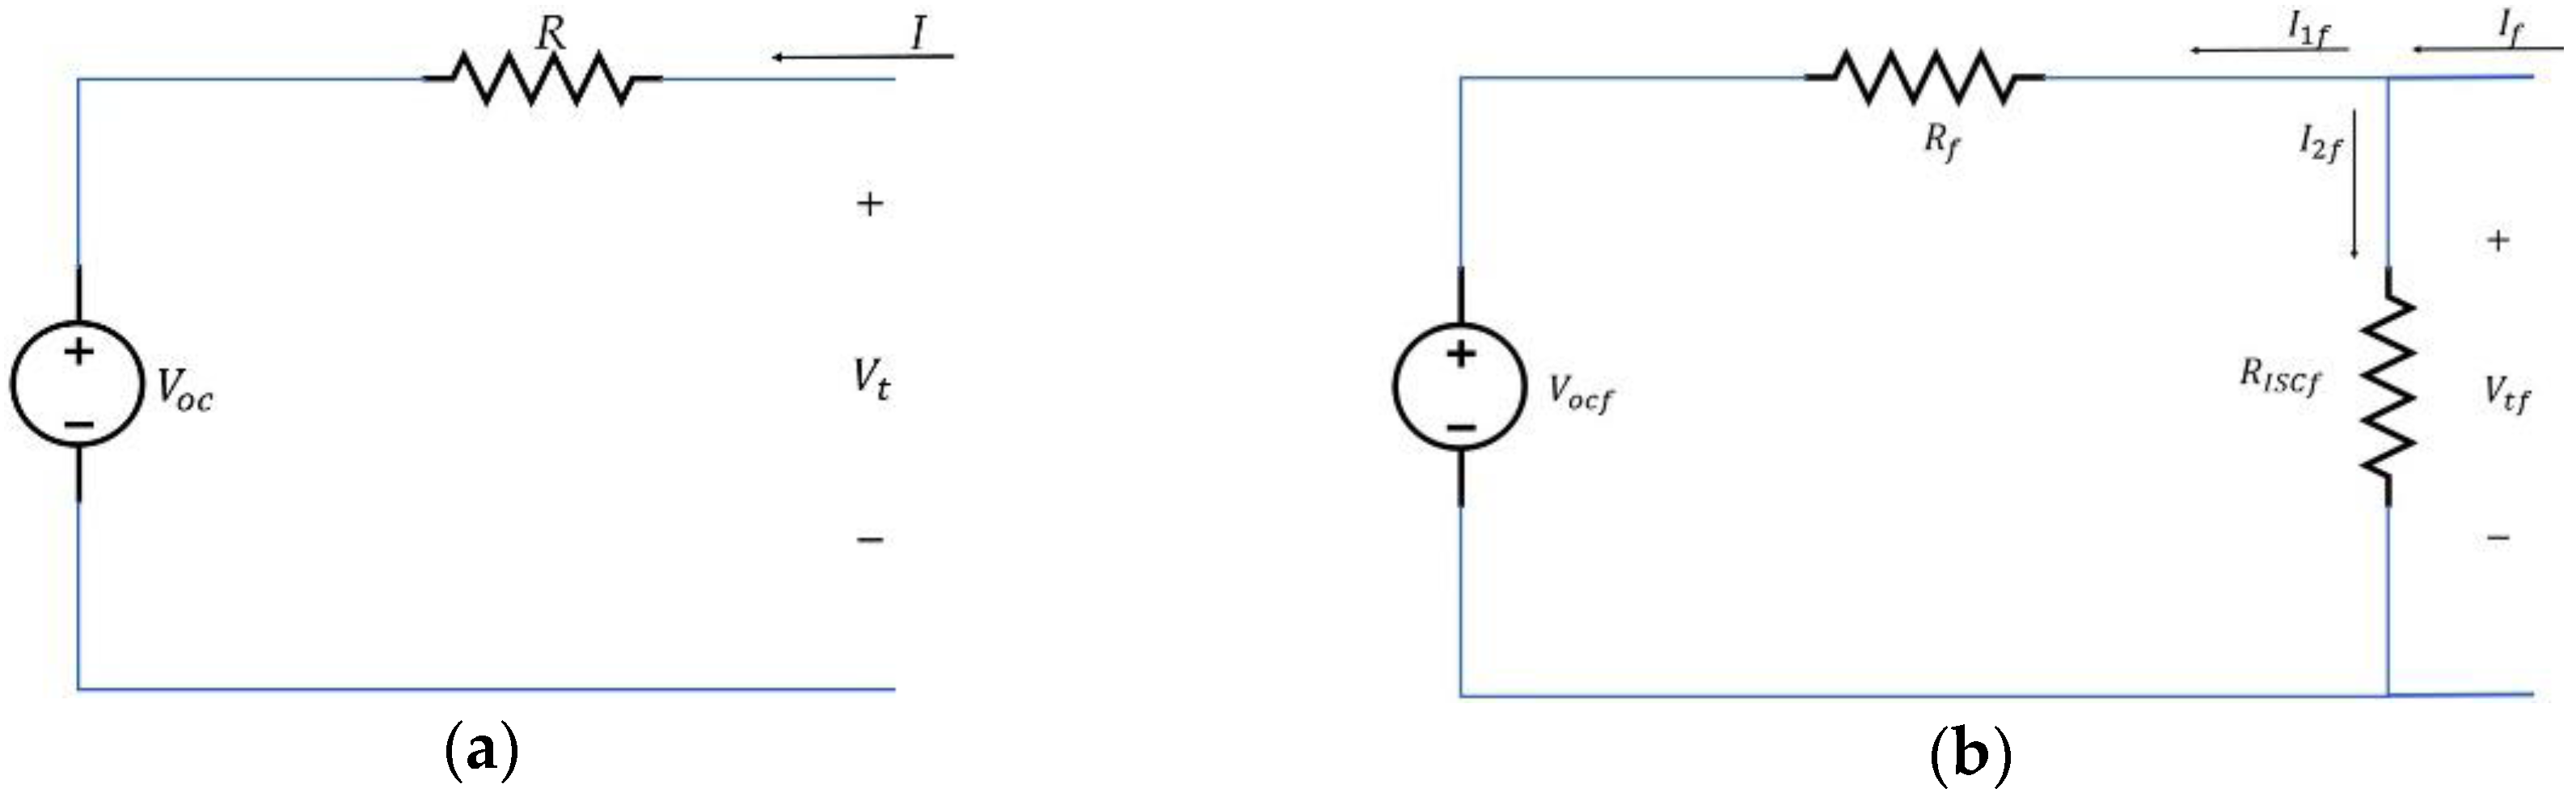
2.1. Equivalent Circuit Models
2.2. OCV Estimation
2.3. SOC and Estimation
3. Simulation and Experiment
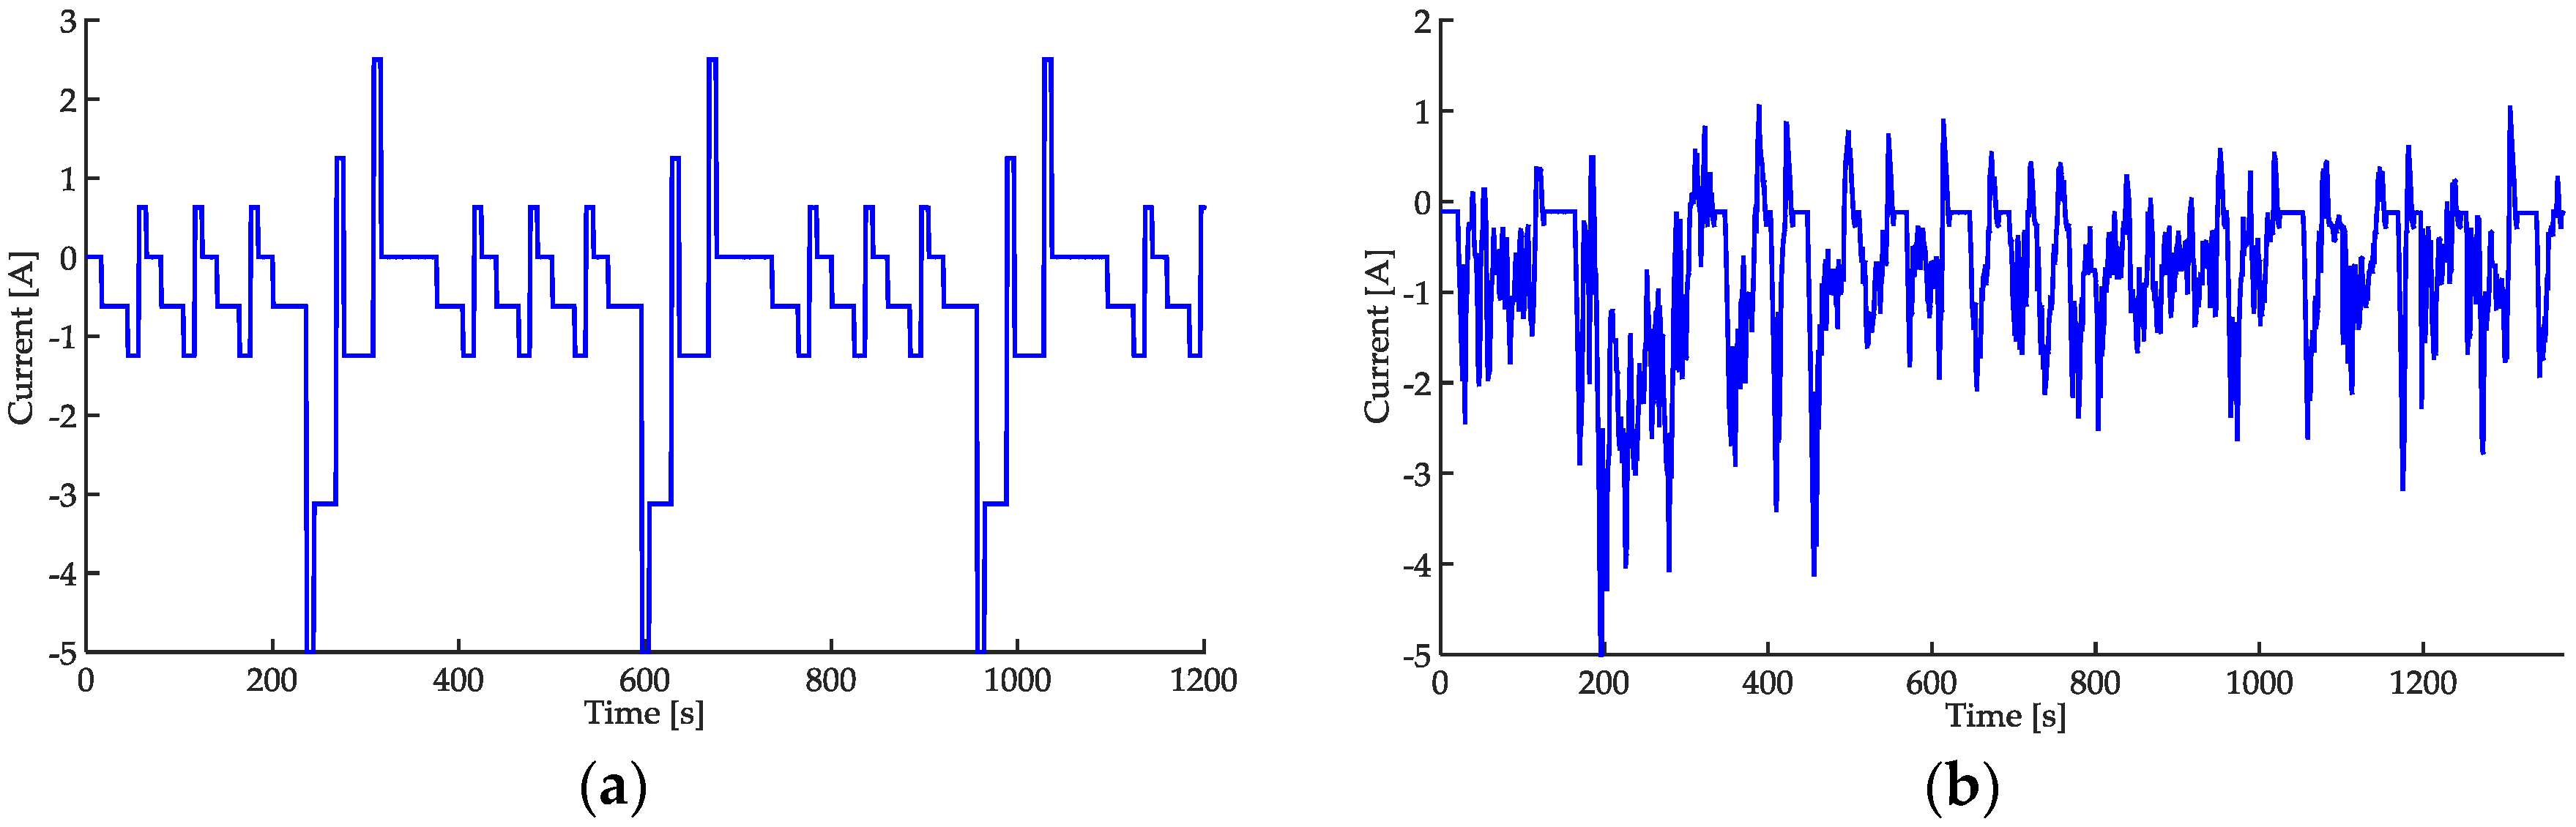
3.1. Load Current Profiles
3.2. Configuration of Simulation Environment
3.3. Configuration of Experiment Environment
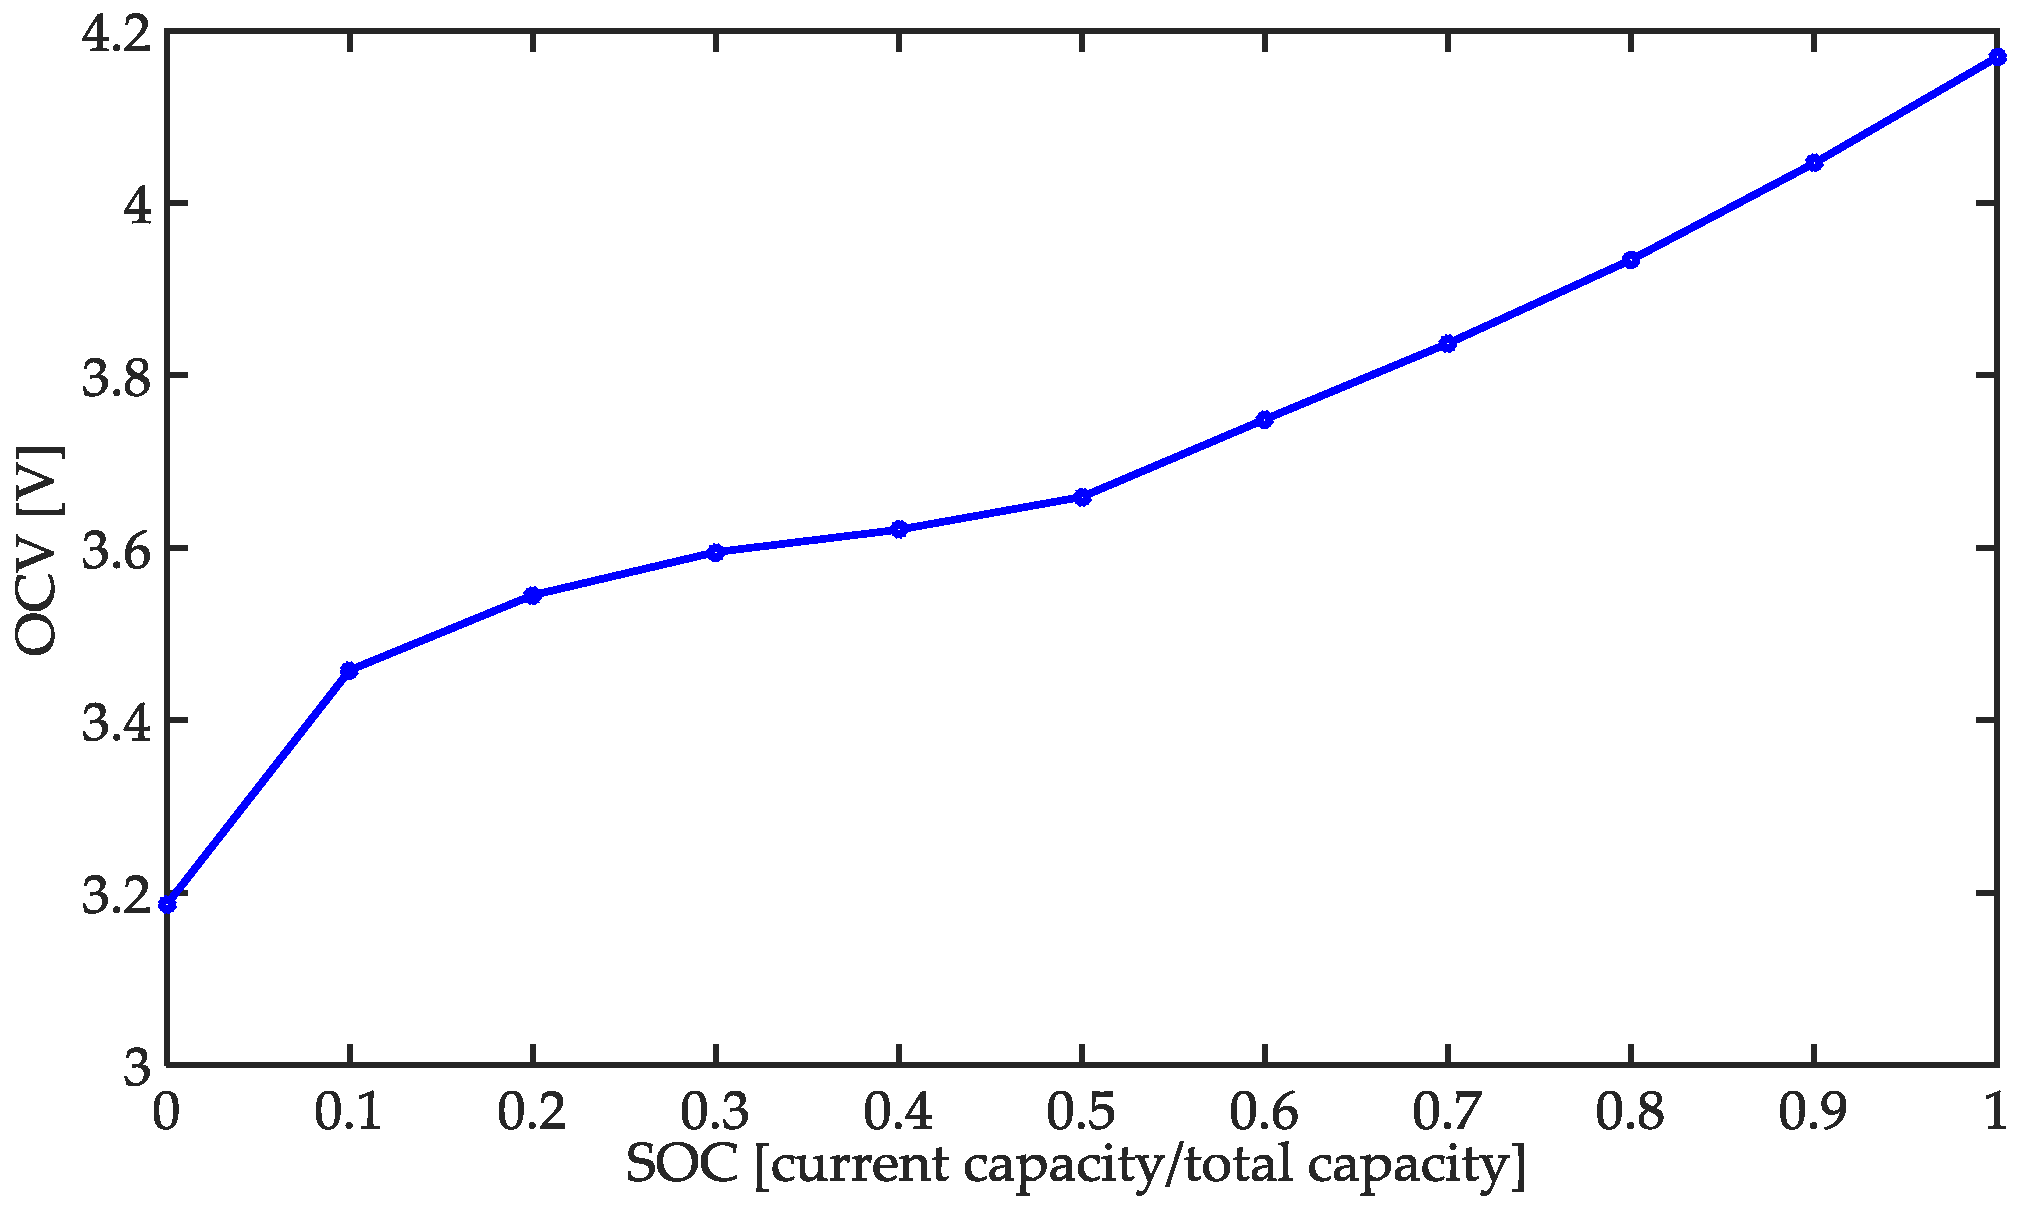
3.4. Relation between OCV and SOC Test
4. Results
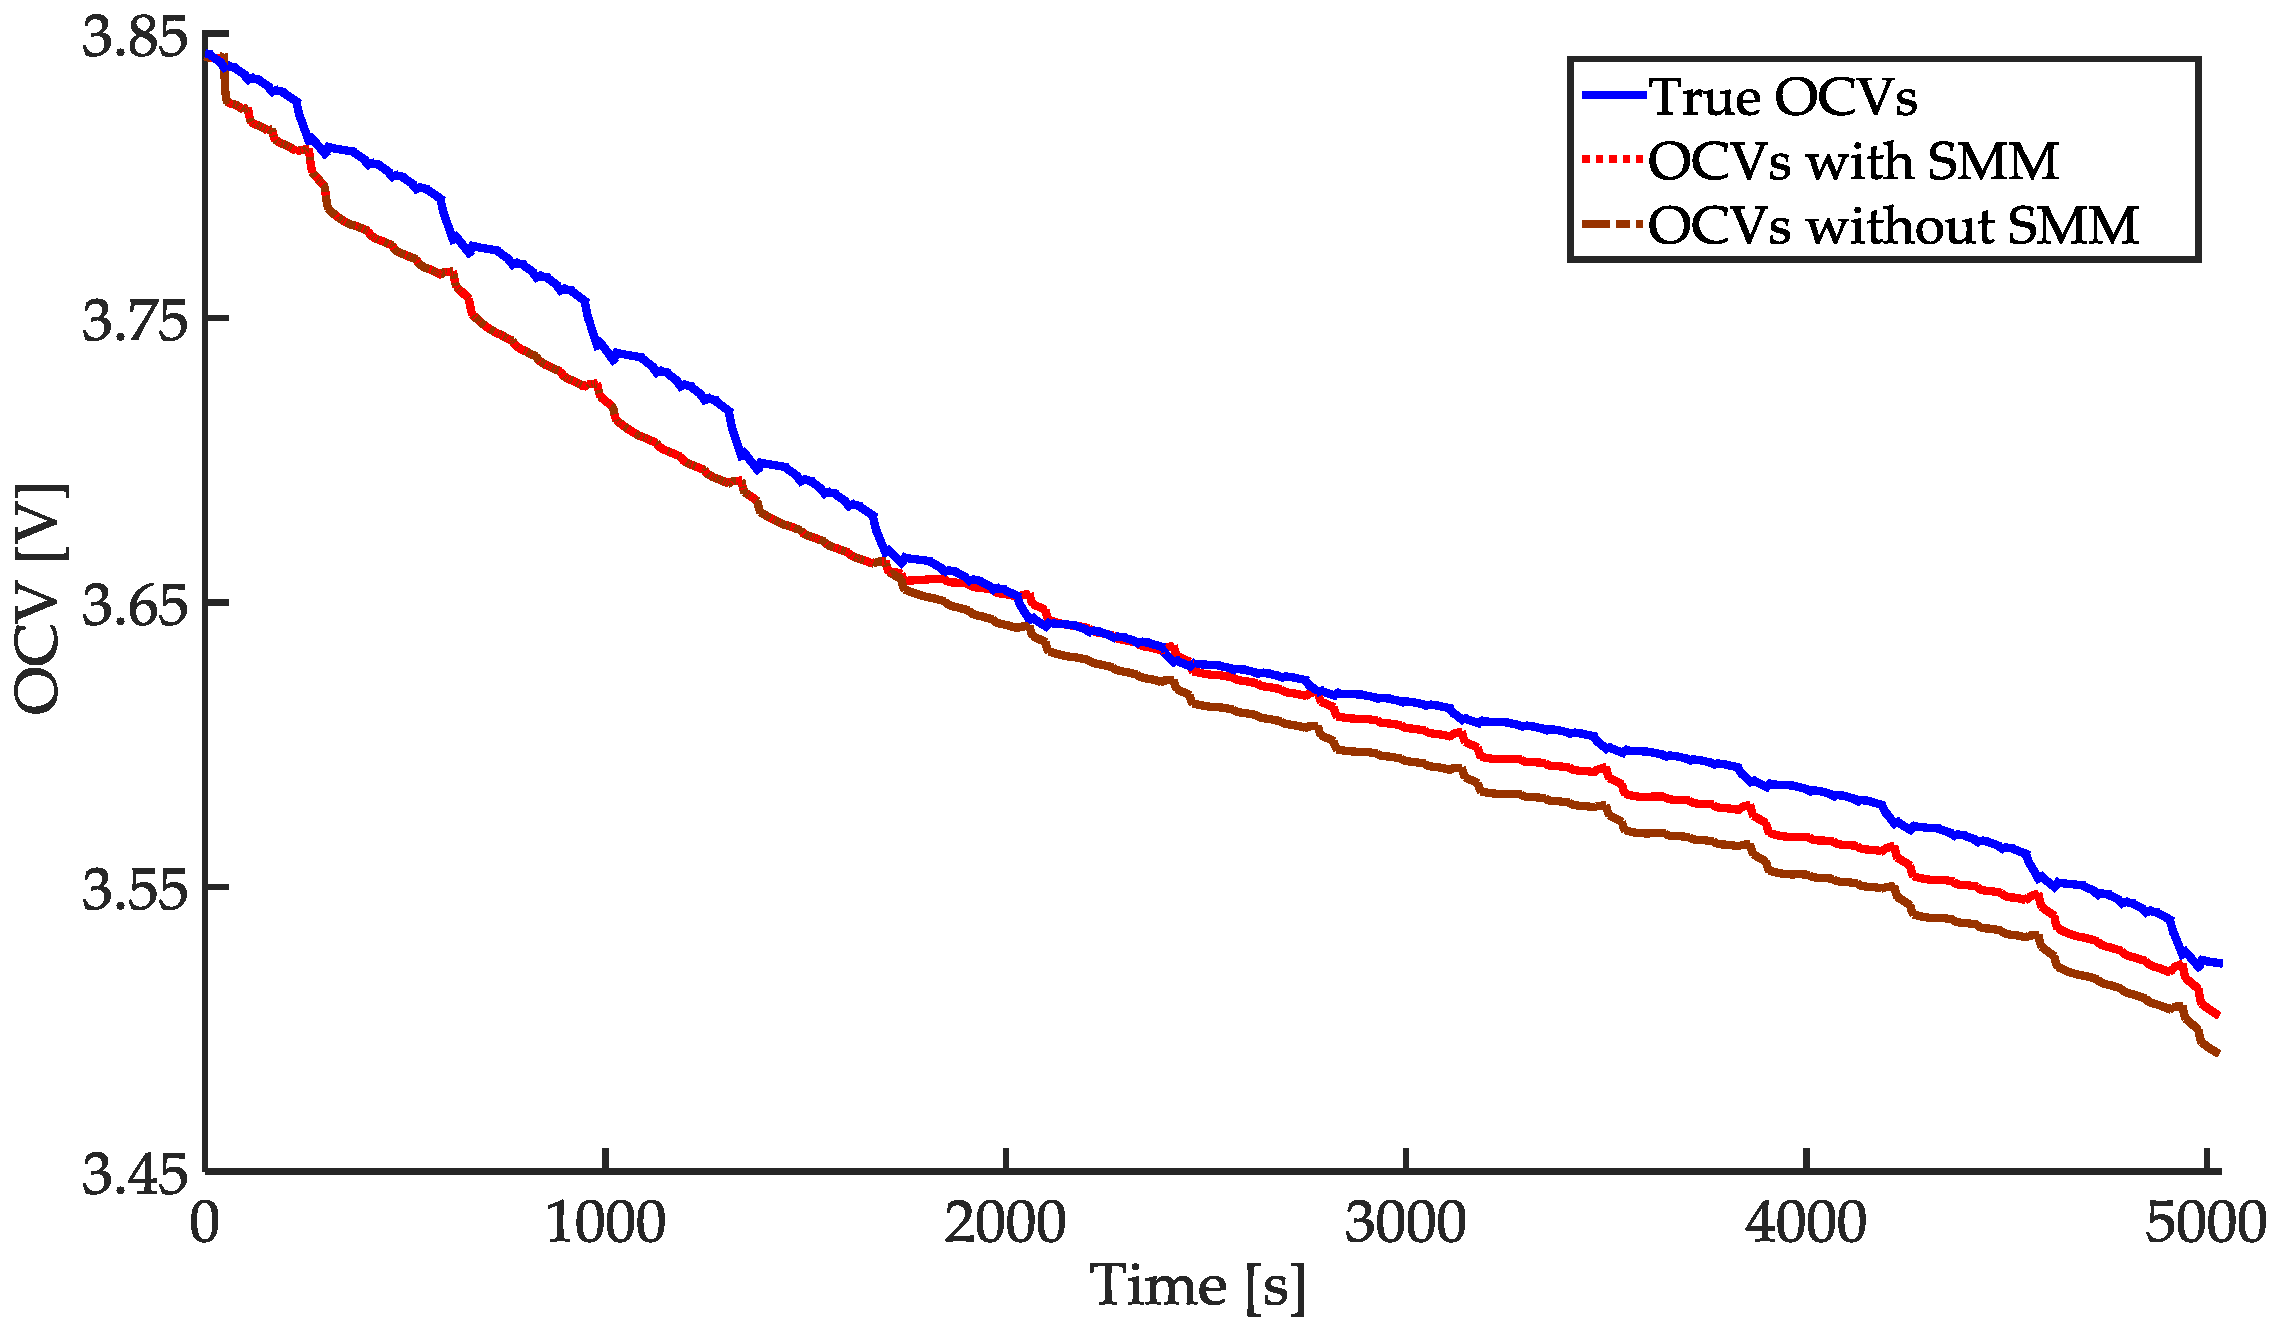
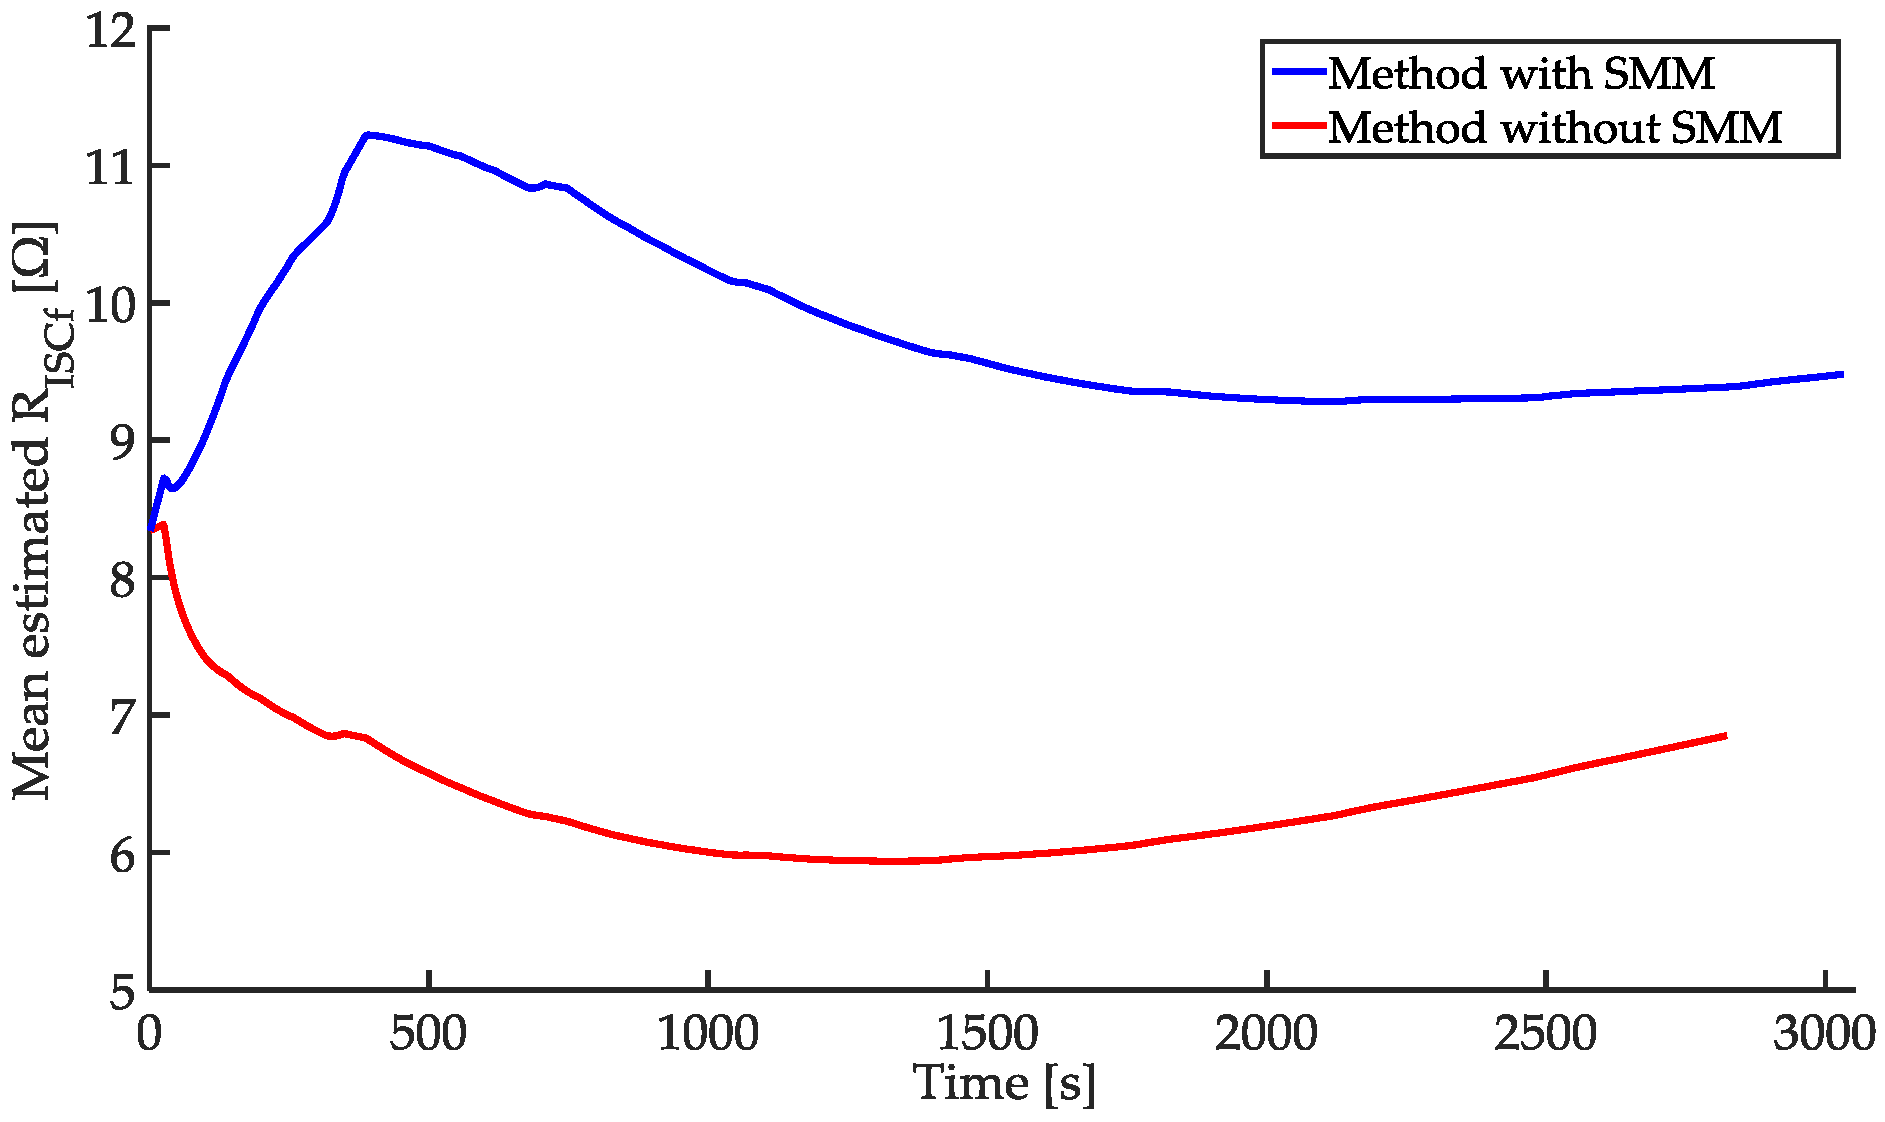
4.1. Comparison between Results with SMM and without SMM
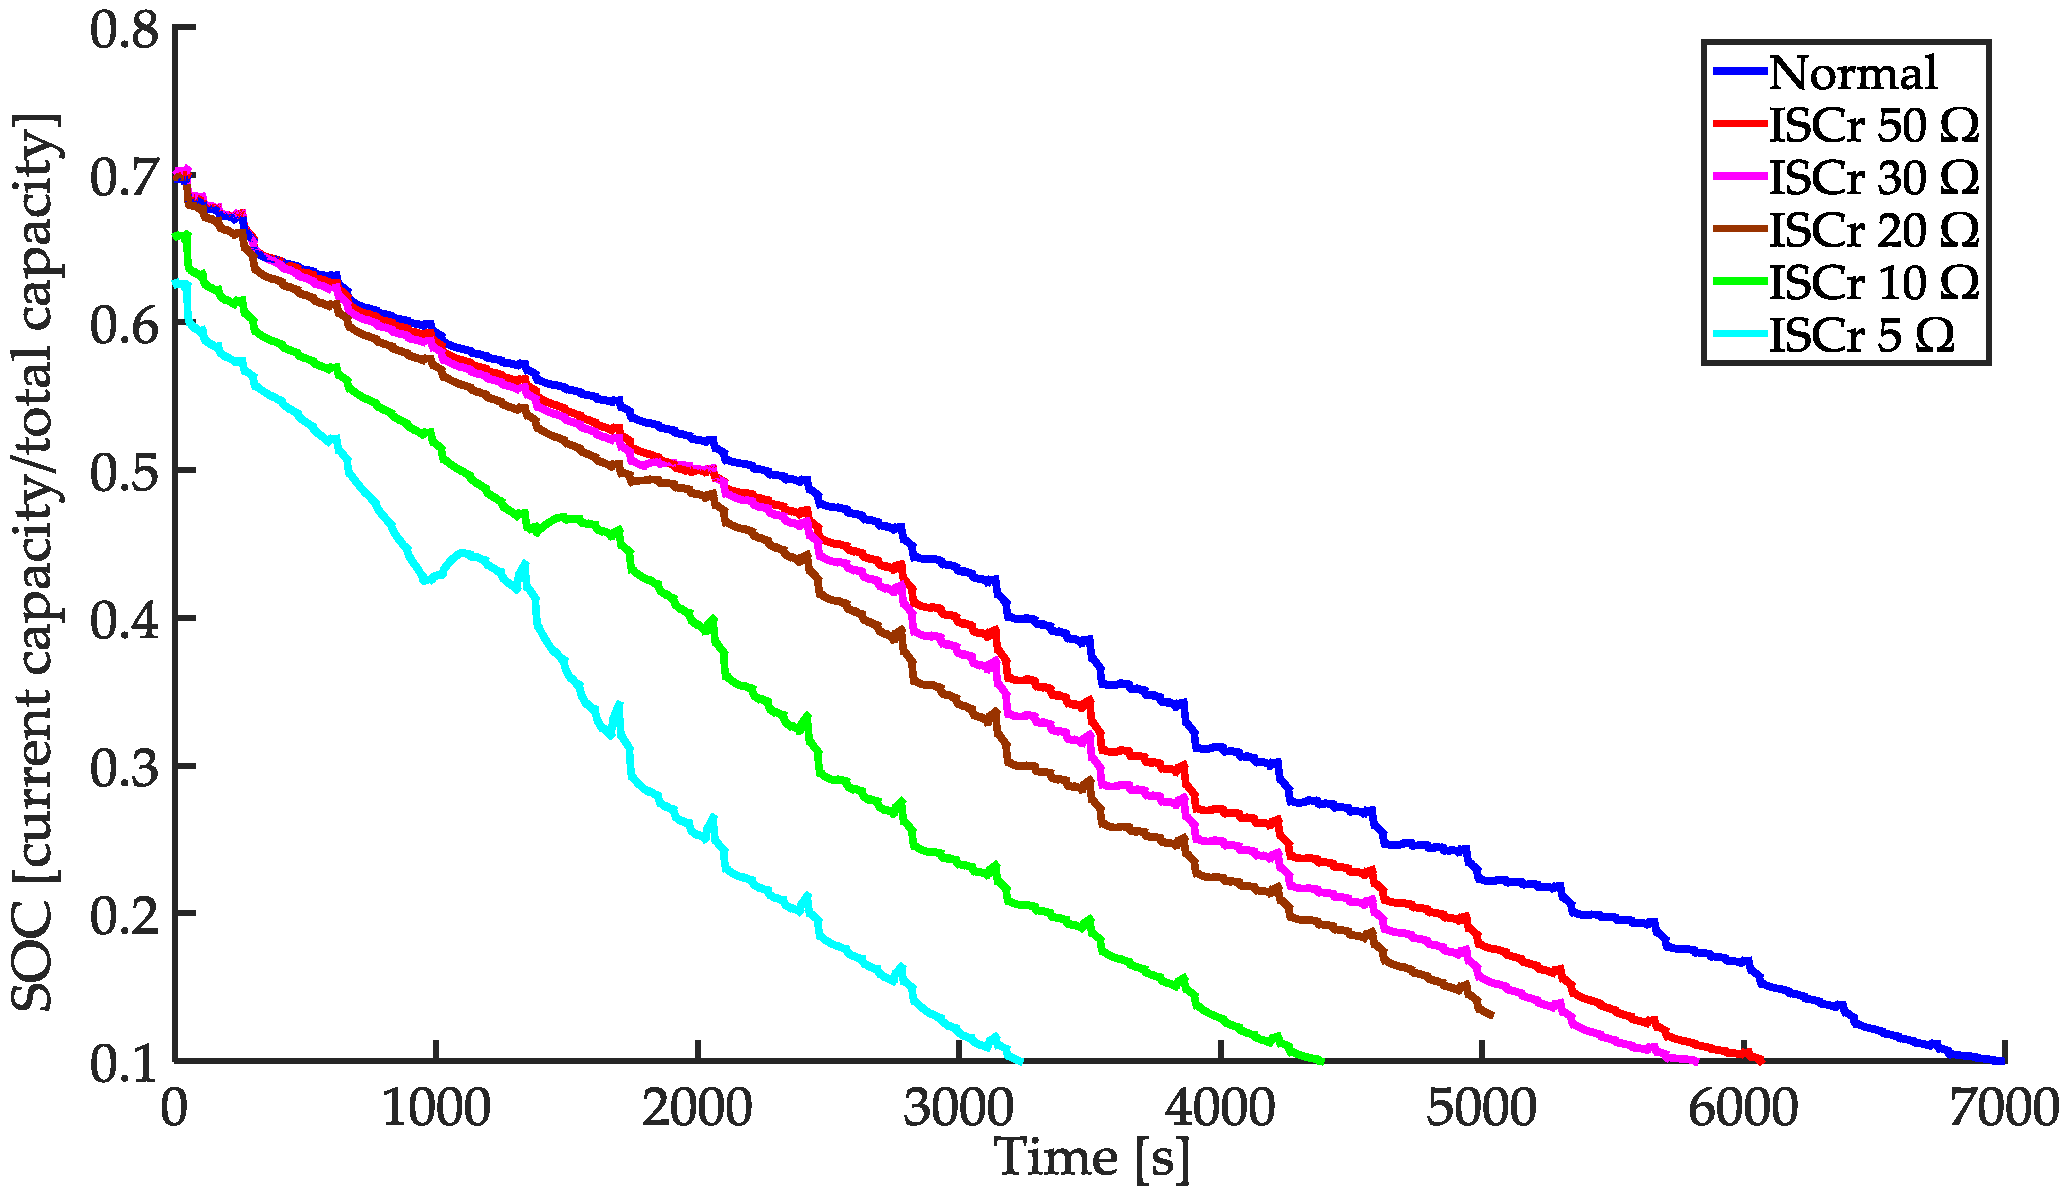
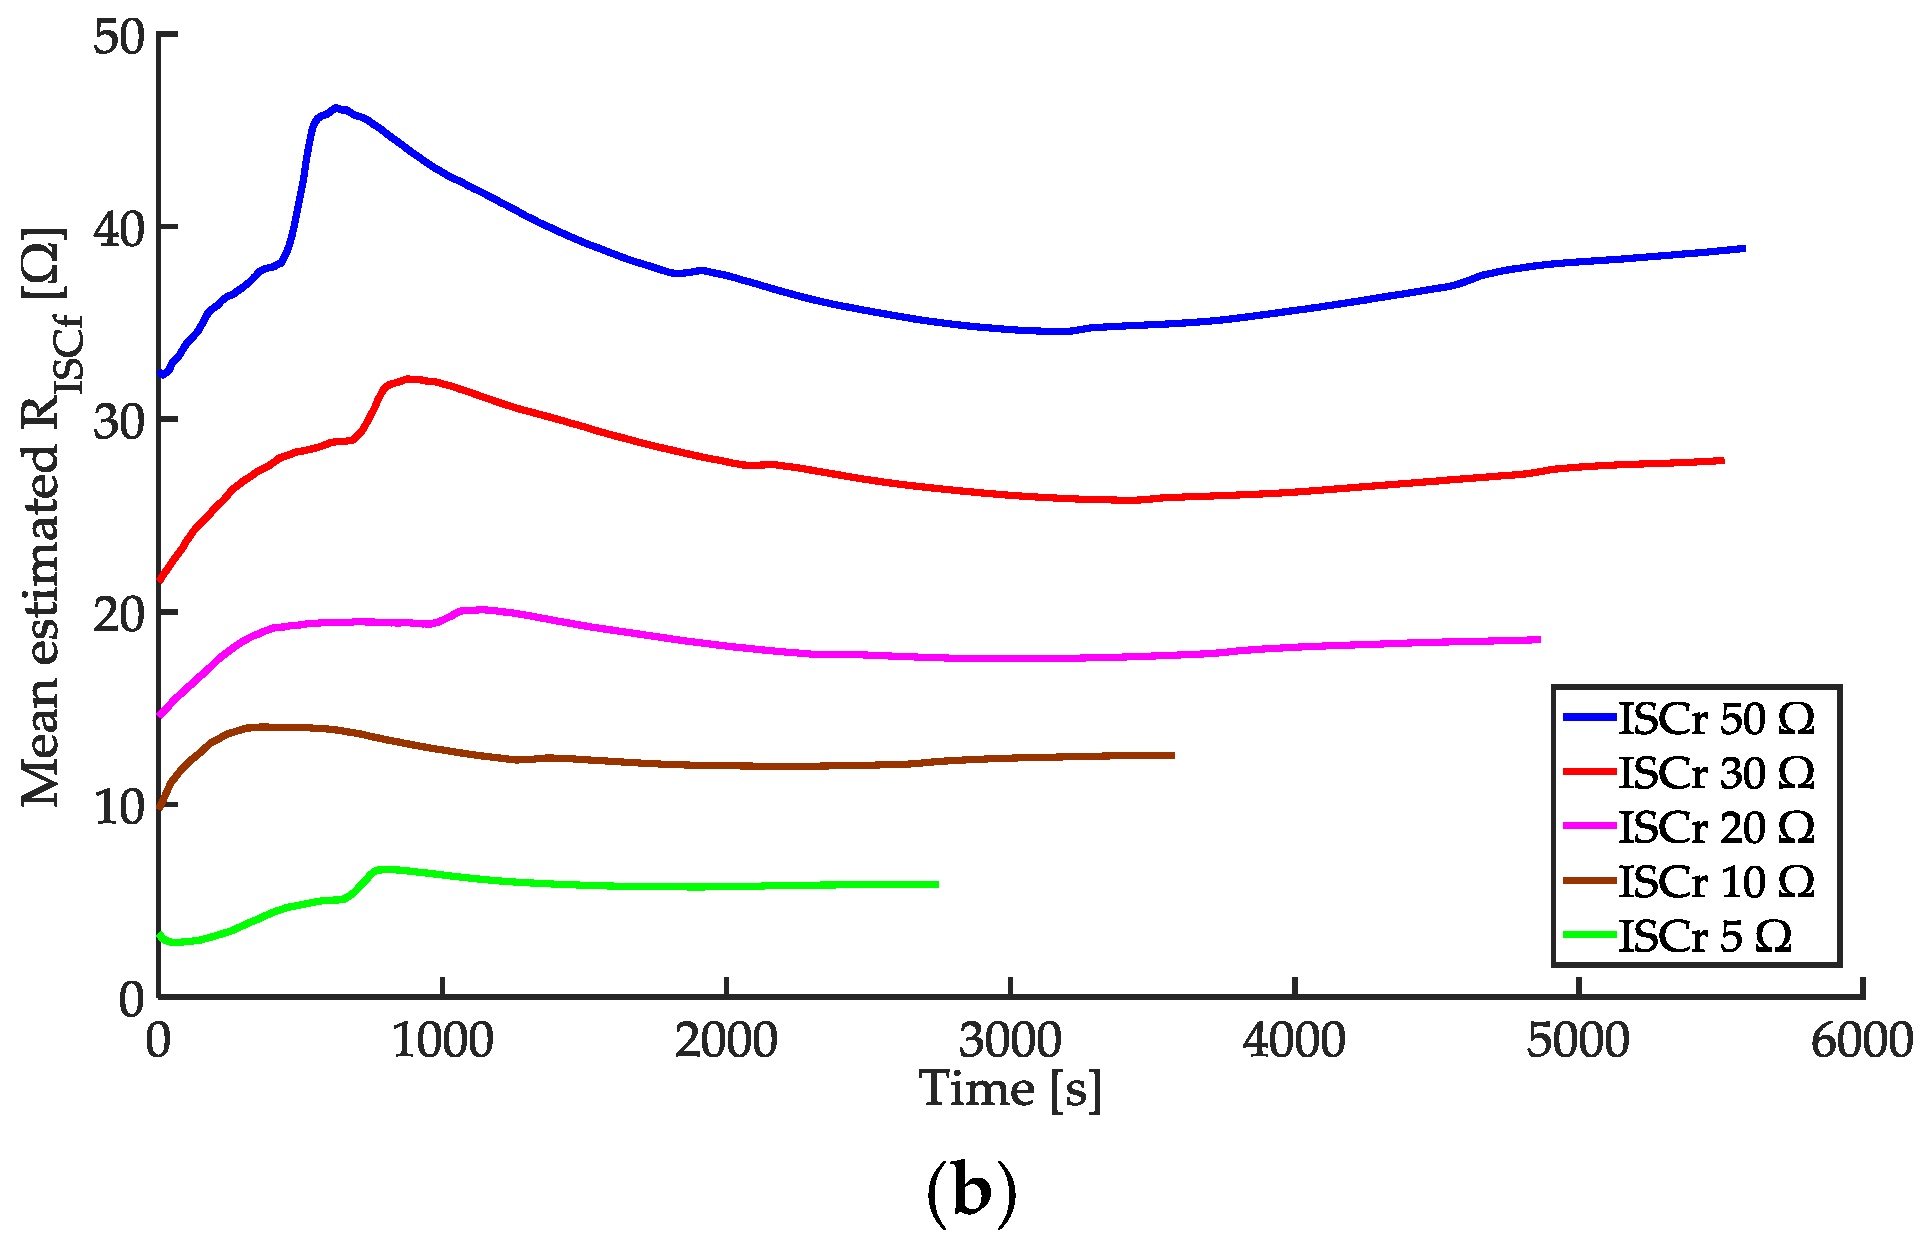
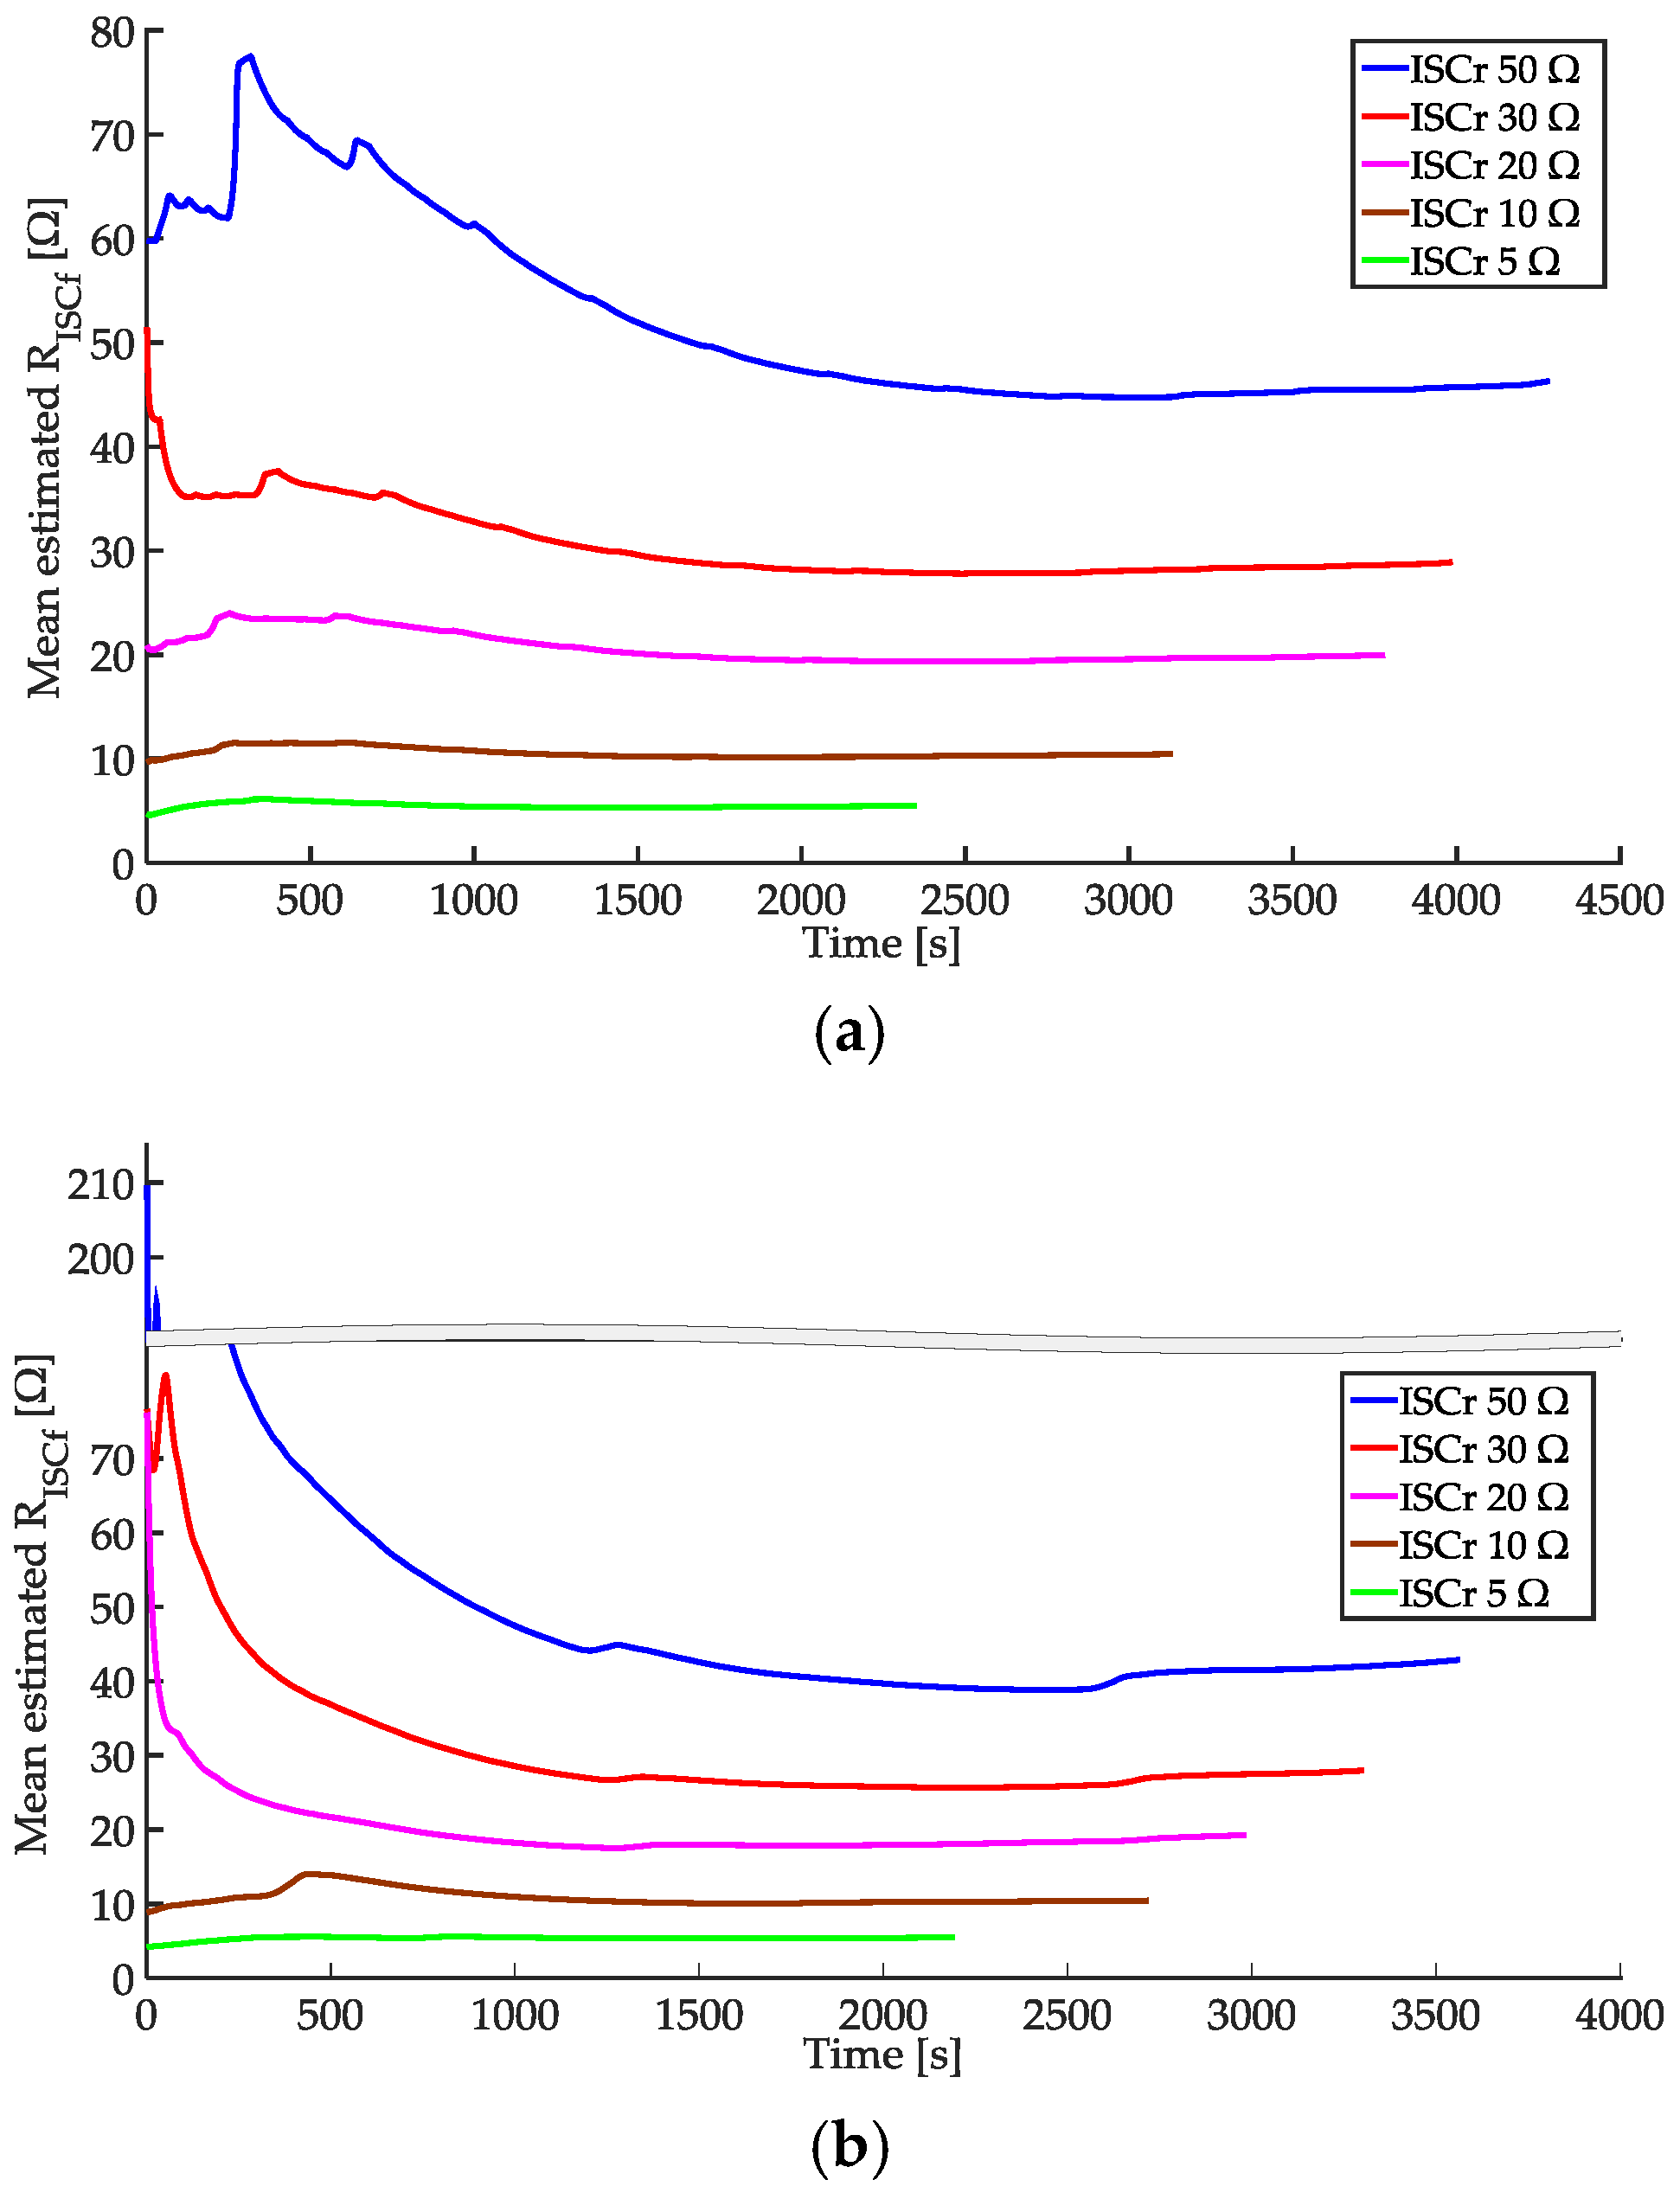
4.2. Effect of Magnitude of True in the Simulation
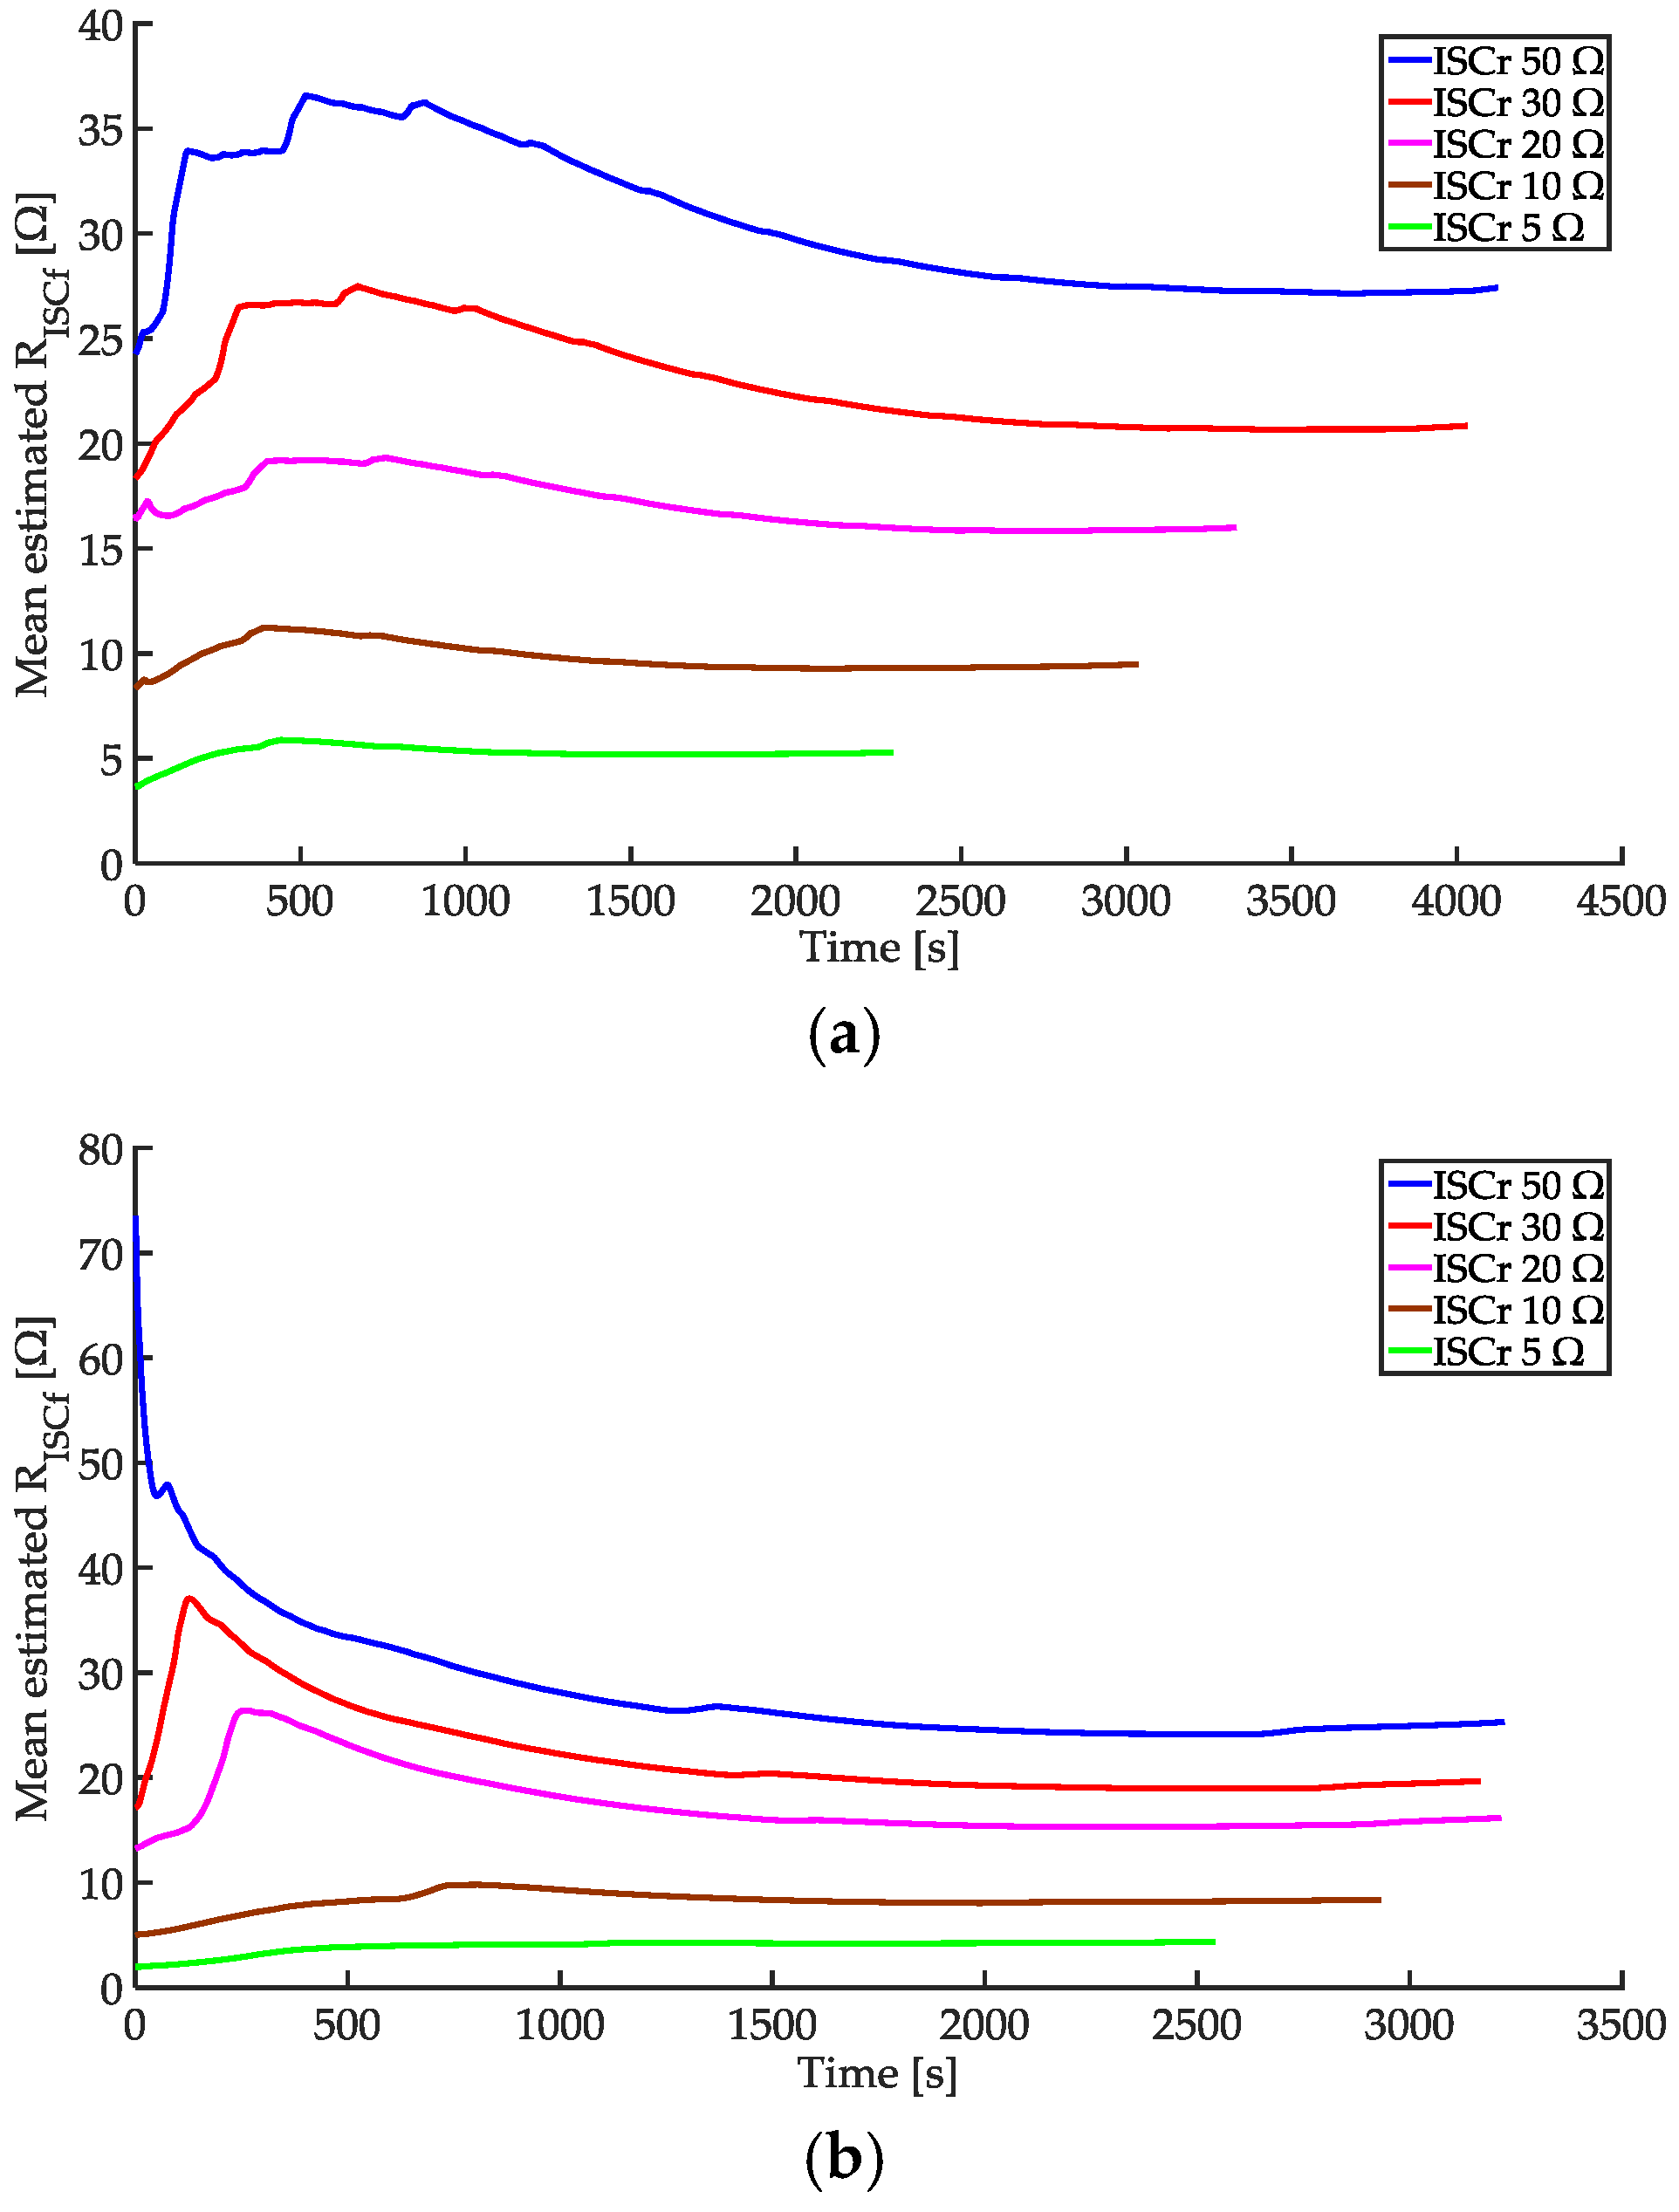
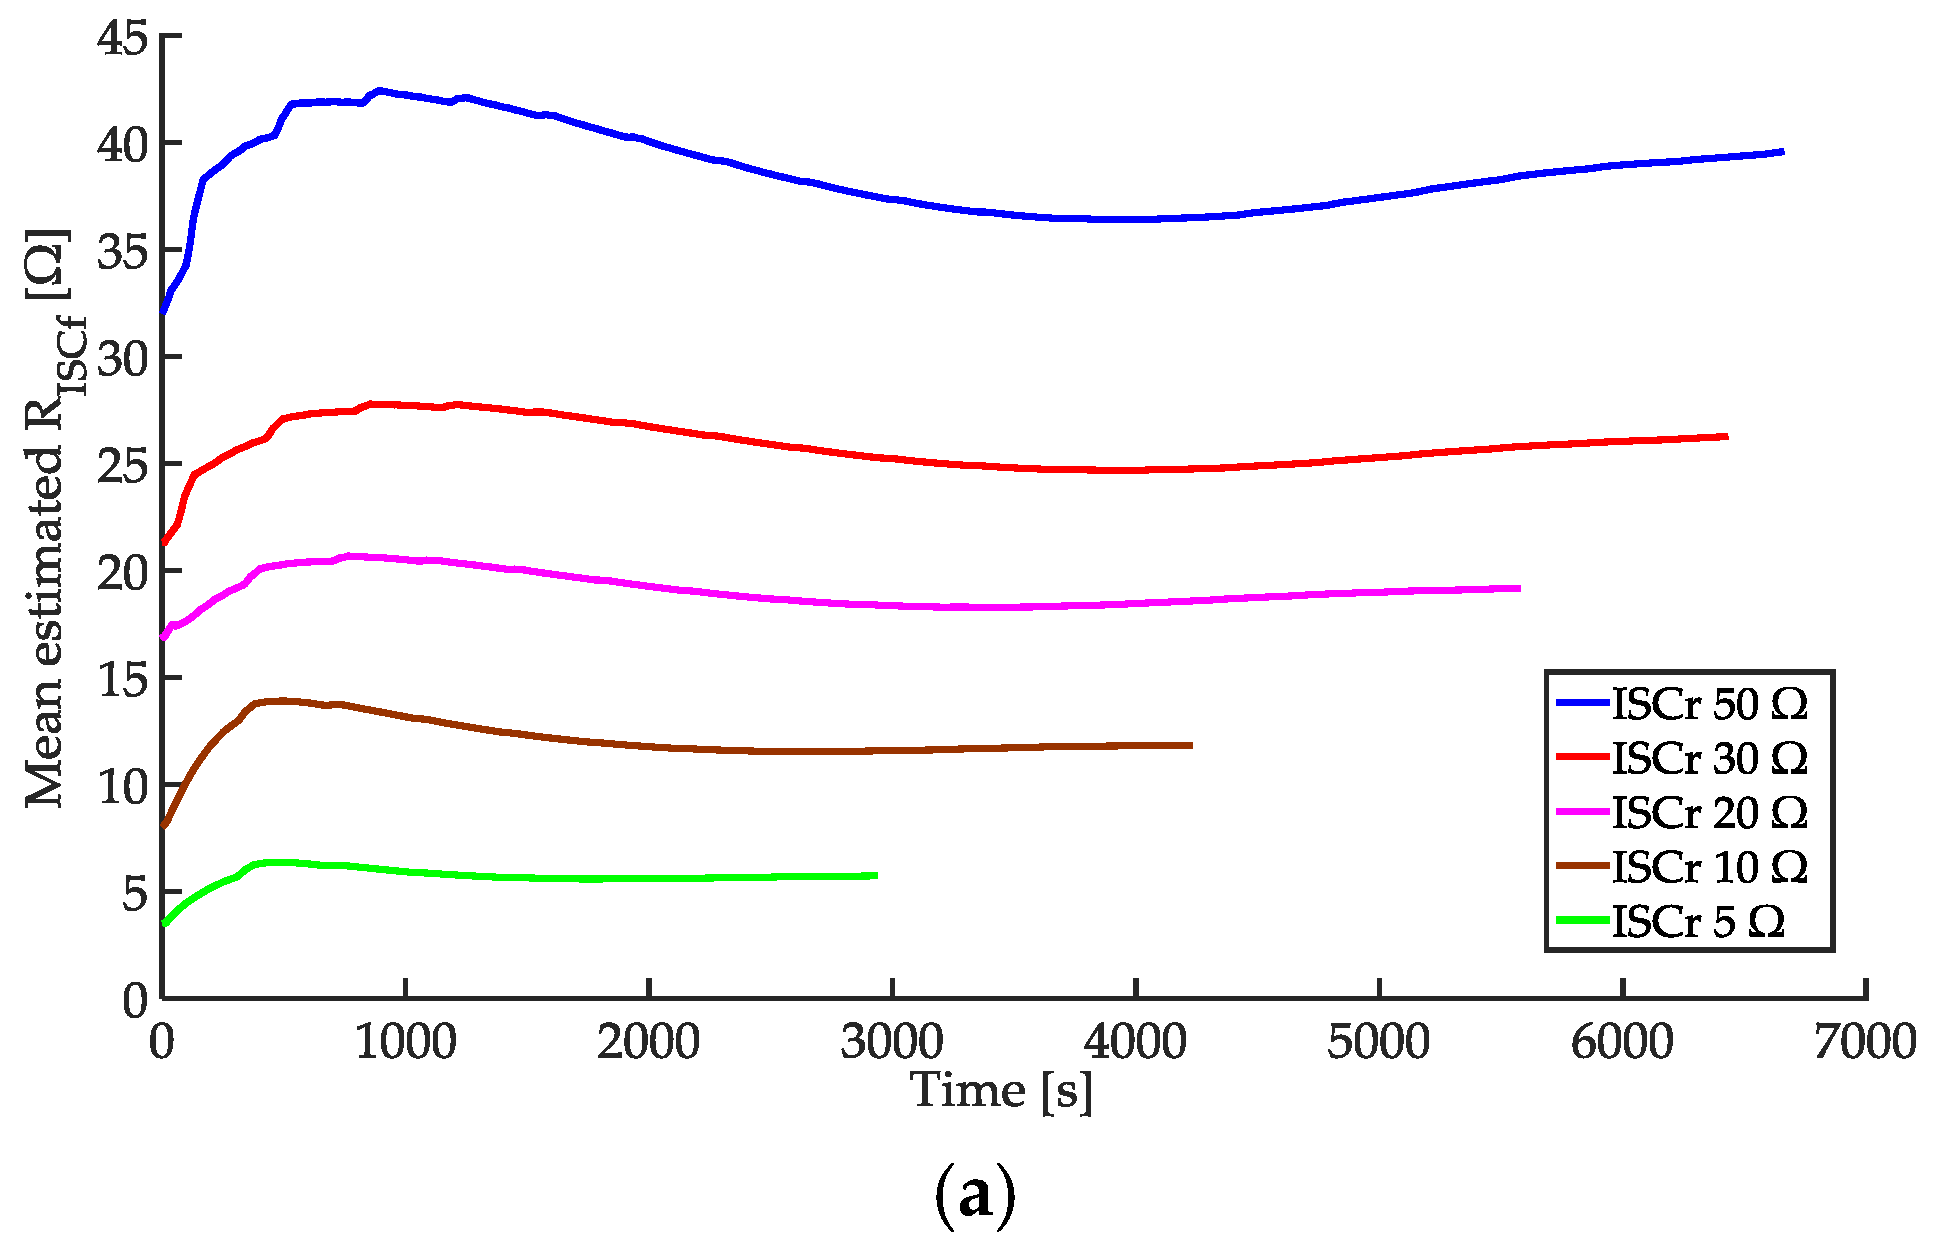
4.3. Effect of Magnitude of True in the Experiment with Cell A
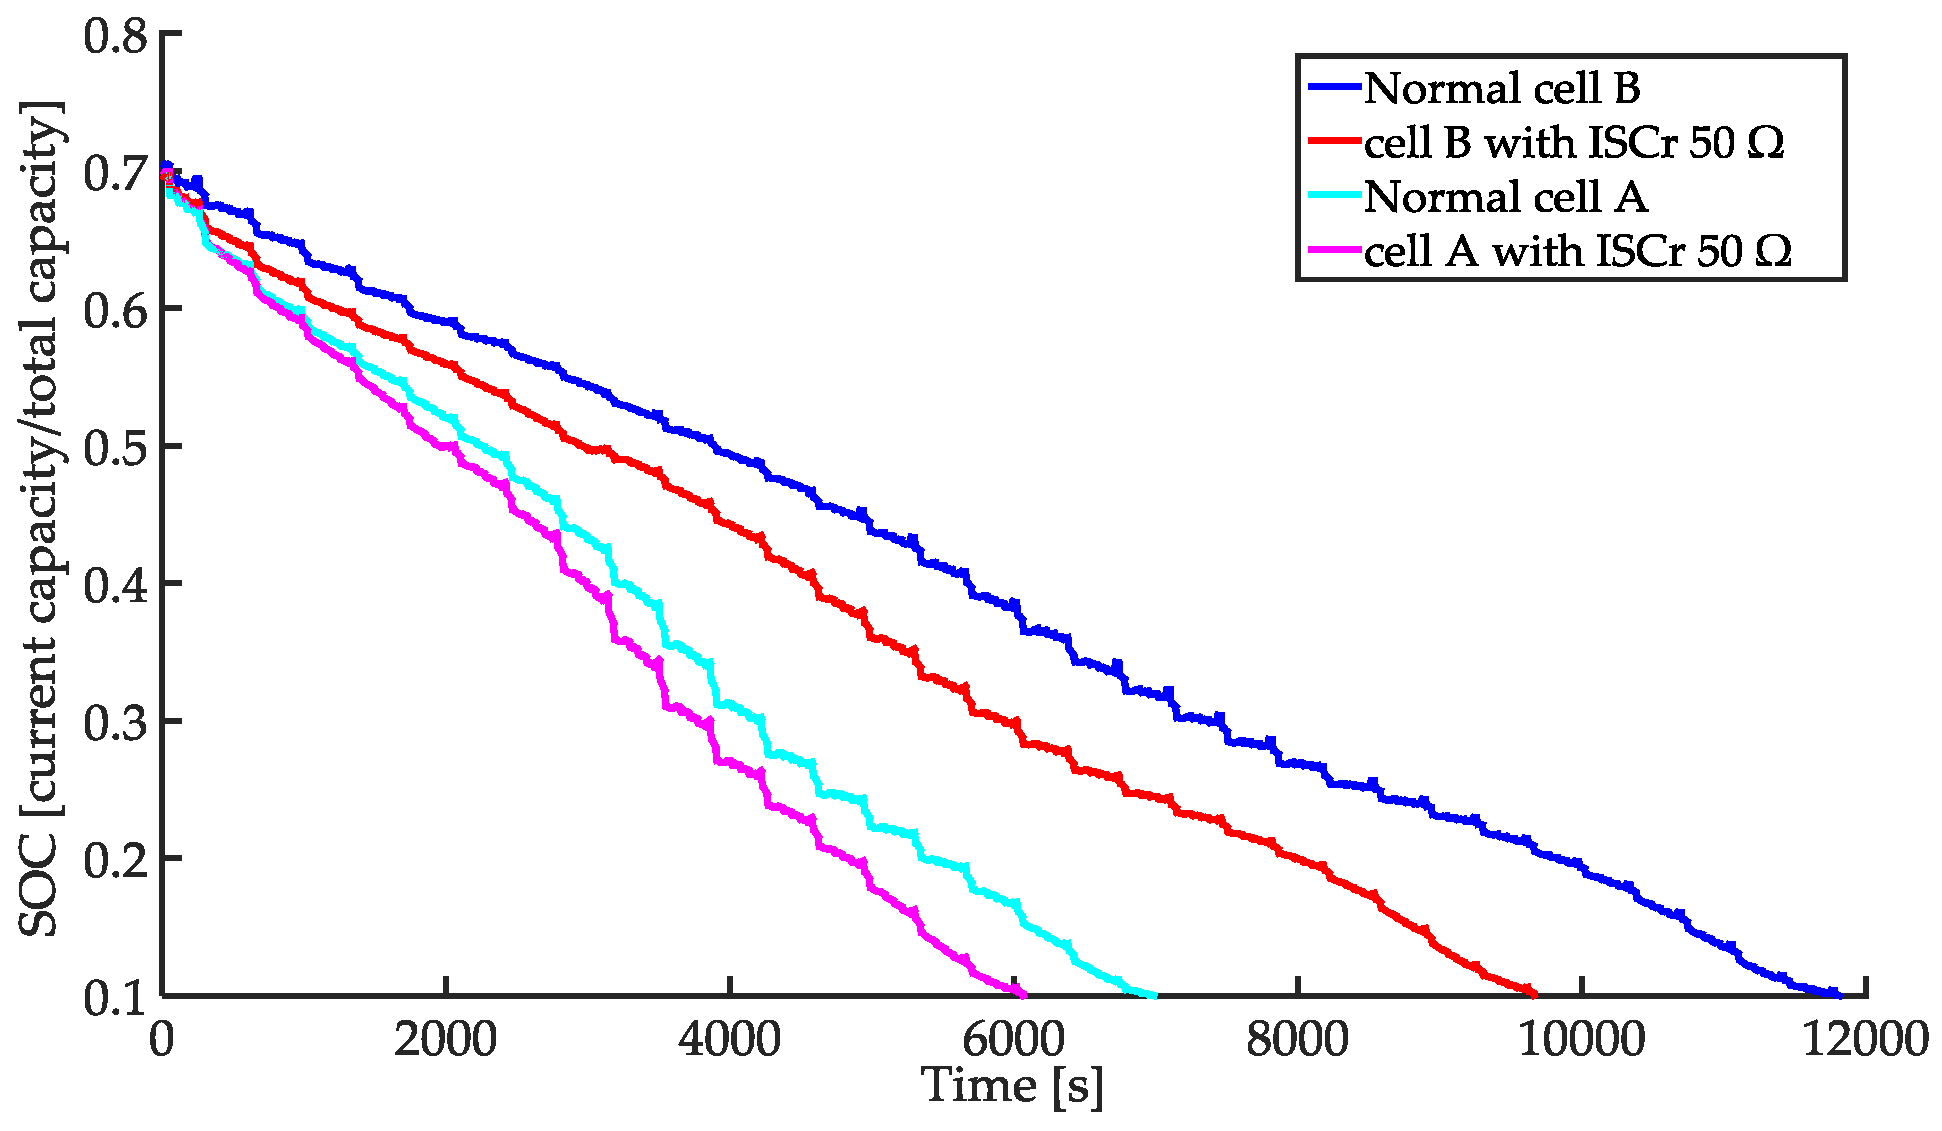
4.4. Effect of C-Rate of Load Current in the Experiment with Cell B
4.5. Effect of Variation in OCV-SOC Curve
5. Conclusions
Acknowledgments
Author Contributions
Conflicts of Interest
References
- Tarascon, J.M.; Michel, A. Issues and challenges facing rechargeable lithium batteries. Nature 2001, 414, 359–367. [Google Scholar] [CrossRef] [PubMed]
- Balakrishnan, P.G.; Ramesh, R. Safety mechanisms in lithium-ion batteries. J. Power Sources 2006, 155, 401–414. [Google Scholar] [CrossRef]
- Lu, L.; Han, X. A review on the key issues for lithium-ion battery management in electric vehicles. J. Power Sources 2013, 226, 272–288. [Google Scholar] [CrossRef]
- Santhanagopalan, S.; Ramadass, P. Analysis of internal short-circuit in a lithium ion cell. J. Power Sources 2009, 194, 550–557. [Google Scholar] [CrossRef]
- Zhao, R.; Liu, J. Simulation and experimental study on lithium ion battery short circuit. Appl. Energy 2016, 173, 29–39. [Google Scholar] [CrossRef]
- Liu, Y.; Liu, Q. Failure study of commercial LiFePO4 cells in over-discharge conditions using electrochemical impedance spectroscopy. J. Electrochem. Soc. 2014, 161, A620–A632. [Google Scholar] [CrossRef]
- Leising, R.A.; Palazzo, M.J. A study of the overcharge reaction of lithium-ion batteries. J. Power Sources 2001, 97, 681–683. [Google Scholar] [CrossRef]
- Maleki, H.; Howard, J.N. Effects of overdischarge on performance and thermal stability of a Li-ion cell. J. Power Sources 2006, 160, 1395–1402. [Google Scholar] [CrossRef]
- Lithium-Ion Battery Safety: Detection of Developing Internal Shorts and Suppression of Thermal Runaway. Available online: http://www.camxpower.com/wp-content/uploads/4-6.pdf (accessed on 30 October 2016).
- Feng, X.; Fang, M. Thermal runaway features of large format prismatic lithium ion battery using extended volume accelerating rate calorimetry. J. Power Sources 2014, 255, 294–301. [Google Scholar] [CrossRef]
- Jhu, C.Y.; Wang, Y.W. Thermal runaway potential of LiCoO2 and Li(Ni1/3Co1/3Mn1/3)O2 batteries determined with adiabatic calorimetry methodology. Appl. Energy 2012, 100, 127–131. [Google Scholar] [CrossRef]
- Zavalis, T.G.; Behm, M. Investigation of short-circuit scenarios in a lithium-ion battery cell. J. Electrochem. Soc. 2012, 159, A848–A859. [Google Scholar] [CrossRef]
- Auxiliary Power Unit Battery Fire, Japan Airlines Boeing 787-8, JA829J, Boston, Massachusetts. January 7, 2013. Available online: http://www.ntsb.gov/investigations/AccidentReports/Reports/AIR1401.pdf (accessed on 21 October 2016).
- Xia, B.; Mi, C.; Chen, Z. Multiple cell lithium-ion battery system electric fault online diagnostics. In Proceedings of the 2015 IEEE Transportation Electrification Conference and Expo (ITEC), Dearborn, MI, USA, 14–17 June 2015; pp. 1–7.
- Ouyang, M.; Zhang, M. Internal short circuit detection for battery pack using equivalent parameter and consistency method. J. Power Sources 2015, 294, 272–283. [Google Scholar] [CrossRef]
- Feng, X.; Weng, C. Online internal short circuit detection for a large format lithium ion battery. Appl. Energy 2016, 161, 168–180. [Google Scholar] [CrossRef]
- Seo, M.; Goh, T.; Koo, G. Detection of internal short circuit in Li-ion battery by estimating its resistance. In Proceedings of the 4th IIAE International Conference on Intelligent System and Image Processing 2016 (ICISIP 2016), Kyoto, Japan, 8–12 September 2016; pp. 212–217.
- Guo, R.; Lu, L. Mechanism of the entire overdischarge process and overdischarge-induced internal short circuit in lithium-ion batteries. Sci. Rep. 2016, 6, 1–9. [Google Scholar] [CrossRef] [PubMed]
- He, H.; Zhang, X. Online model-based estimation of state-of-charge and open-circuit voltage of lithium-ion batteries in electric vehicles. Energy 2012, 39, 310–318. [Google Scholar] [CrossRef]
- Kim, G.H.; Smith, K. Fail-safe design for large capacity lithium-ion battery systems. J. Power Sources 2012, 210, 243–253. [Google Scholar] [CrossRef]
- Plett, G.L. Extended Kalman filtering for battery management systems of LiPB-based HEV battery packs: Part 2. Modeling and identification. J. Power Sources 2004, 134, 262–276. [Google Scholar] [CrossRef]
- Liaw, B.Y.; Nagasubramanian, G. Modeling of lithium ion cells—A simple equivalent-circuit model approach. Solid State Ion. 2004, 175, 835–839. [Google Scholar]
- Yao, L.W.; Aziz, J.A.; Kong, P.Y. Modeling of lithium-ion battery using MATLAB/simulink. In Proceedings of the IECON 2013—39th Annual Conference of the IEEE Industrial Electronics Society, Vienna, Austria, 10–13 November 2013; pp. 1729–1734.
- Simulink Model of a Lithium-Ion Battery for the Hybrid Power System Test-Bed. Available online: http://www.learningace.com/doc/1488524/01a7c2704f7024d2b5c288c9e03efd0a/simulink-model-of-a-lithium-ion-battery-for-the-hybrid-power-system-testbed (accessed on 21 November 16).
- Xing, Y.; He, W. State of charge estimation of lithium-ion batteries using the open-circuit voltage at various ambient temperatures. Appl. Energy 2014, 113, 106–115. [Google Scholar] [CrossRef]


| Model | Type | Nominal Voltage | Nominal Capacity | Upper/Lower Cut-Off Voltage |
|---|---|---|---|---|
| INR 18650-20R | LiNiCoMnO2 | 3.6 V | 2000 mAh | 4.2 V/2.0 V |
| Method | True ISCr Resistance | ||||
|---|---|---|---|---|---|
| 5 Ω | 10 Ω | 20 Ω | 30 Ω | 50 Ω | |
| With SMM | 6.2 | 4.8 | 19.7 | 30.4 | 45.1 |
| Without SMM | 28.0 | 31.2 | 38.5 | 47.1 | 57.3 |
| Method | True ISCr Resistance | ||||
|---|---|---|---|---|---|
| 5 Ω | 10 Ω | 20 Ω | 30 Ω | 50 Ω | |
| With SMM | 12.3 | 16.0 | 18.9 | 34.3 | 49.3 |
| Without SMM | 48.8 | 44.4 | 38.0 | 49.5 | 61.8 |
| Discharge Condition | True ISCr Resistance | ||||
|---|---|---|---|---|---|
| 5 Ω | 10 Ω | 20 Ω | 30 Ω | 50 Ω | |
| DST 5 A | 9.7 | 4.6 | 0.2 | 3.7 | 7.5 |
| UDDS 5 A | 10.4 | 4.5 | 3.7 | 6.8 | 14.2 |
| Discharge Condition | True ISCr Resistance | ||||
|---|---|---|---|---|---|
| 5 Ω | 10 Ω | 20 Ω | 30 Ω | 50 Ω | |
| DST 5 A | 6.2 | 4.8 | 19.7 | 30.4 | 45.1 |
| UDDS 5 A | 12.3 | 16.0 | 18.9 | 34.3 | 49.3 |
| Discharge Condition | True ISCr Resistance | ||||
|---|---|---|---|---|---|
| 5 Ω | 10 Ω | 20 Ω | 30 Ω | 50 Ω | |
| DST 3 A | 14.9 | 18.9 | 3.8 | 12.3 | 20.7 |
| UDDS 3 A | 17.3 | 26.1 | 6.9 | 6.9 | 22.1 |
© 2017 by the authors; licensee MDPI, Basel, Switzerland. This article is an open access article distributed under the terms and conditions of the Creative Commons Attribution (CC-BY) license (http://creativecommons.org/licenses/by/4.0/).
Share and Cite
Seo, M.; Goh, T.; Park, M.; Koo, G.; Kim, S.W. Detection of Internal Short Circuit in Lithium Ion Battery Using Model-Based Switching Model Method. Energies 2017, 10, 76. https://doi.org/10.3390/en10010076
Seo M, Goh T, Park M, Koo G, Kim SW. Detection of Internal Short Circuit in Lithium Ion Battery Using Model-Based Switching Model Method. Energies. 2017; 10(1):76. https://doi.org/10.3390/en10010076
Chicago/Turabian StyleSeo, Minhwan, Taedong Goh, Minjun Park, Gyogwon Koo, and Sang Woo Kim. 2017. "Detection of Internal Short Circuit in Lithium Ion Battery Using Model-Based Switching Model Method" Energies 10, no. 1: 76. https://doi.org/10.3390/en10010076