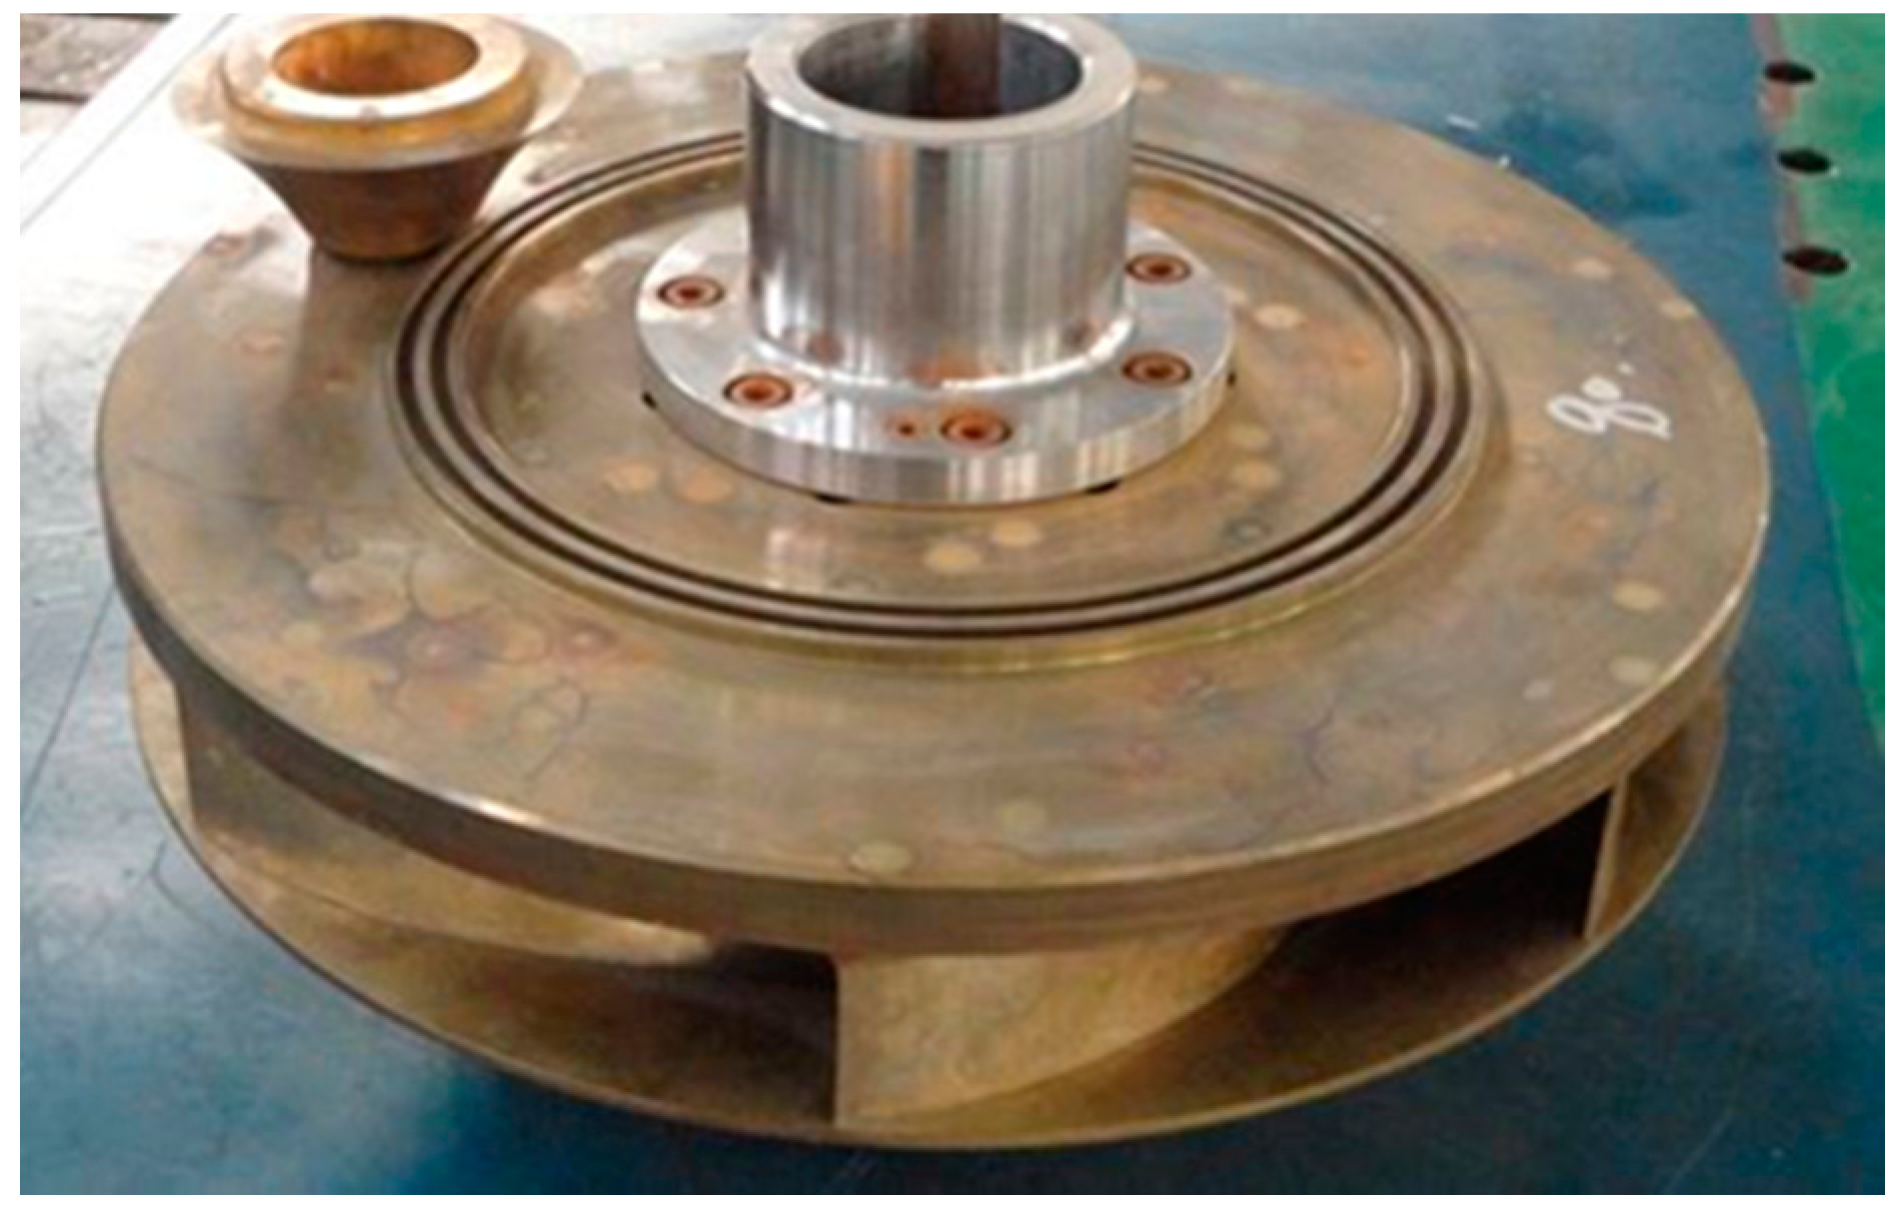
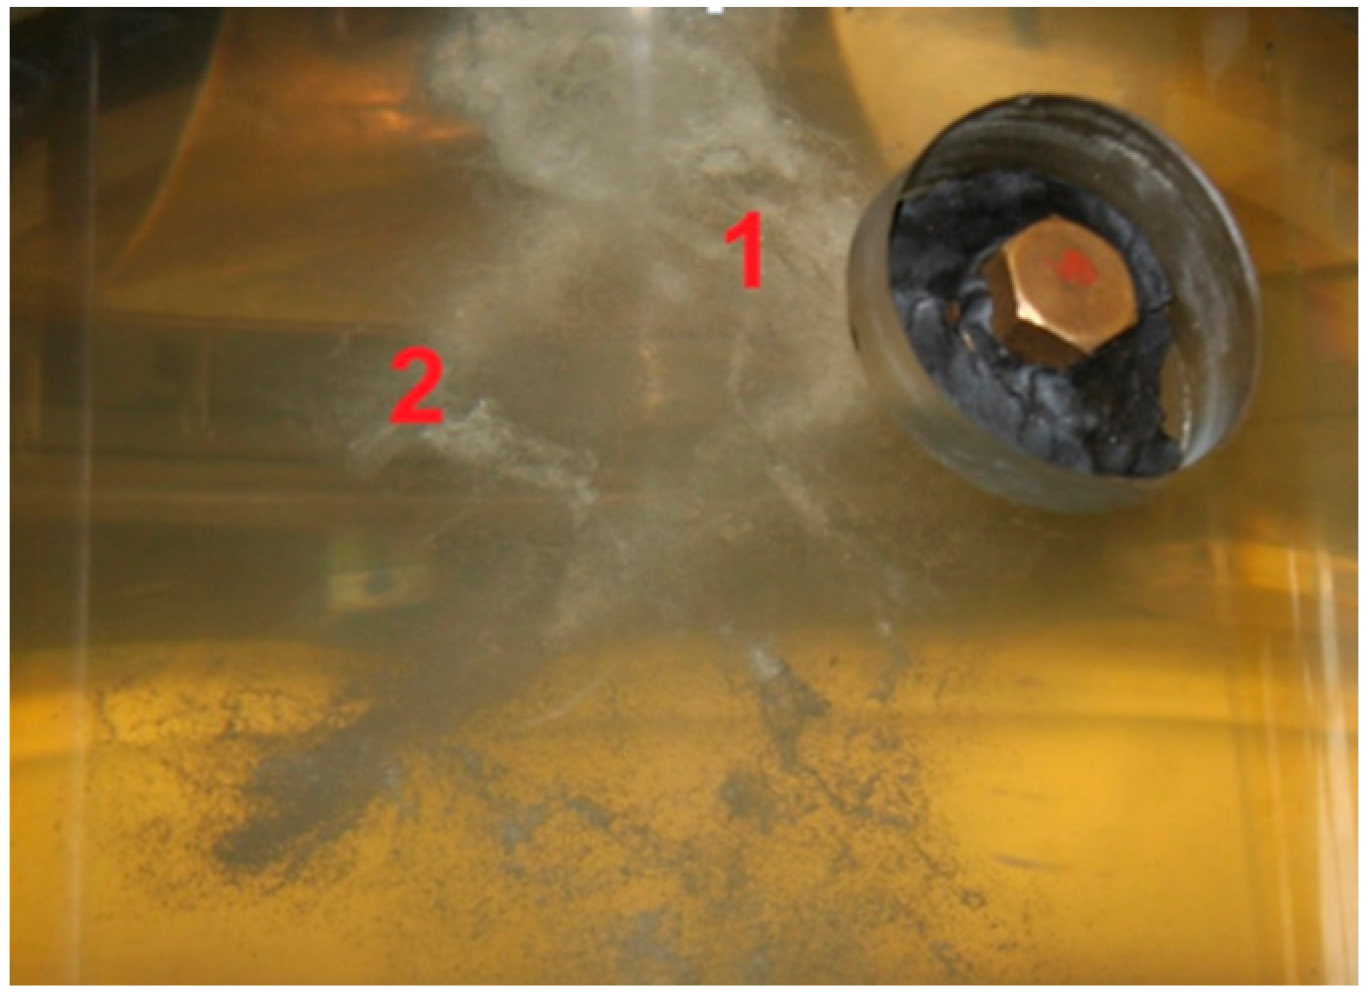
2.1. Scaled Pump-Turbine Model
The scaled model pump-turbine runner used in this study is shown in
Figure 1. The model was designed in order to conduct measurements on a standard test rig. The main parameters of the model runner are listed in
Table 1. The scale of the model was one-tenth of the prototype turbines installed in aforementioned Liyang Pumped Storage Power Station. The rated specific speed of both model and prototype is
. The specific parameters of the prototype pump-turbine are as follows. In turbine mode, the rated head is
Hr = 259 m and the rated output power is
Pr = 255 MW. The rotational speed is
for both turbine and pump modes. In pump mode, the maximum and minimum heads are
and
, respectively.
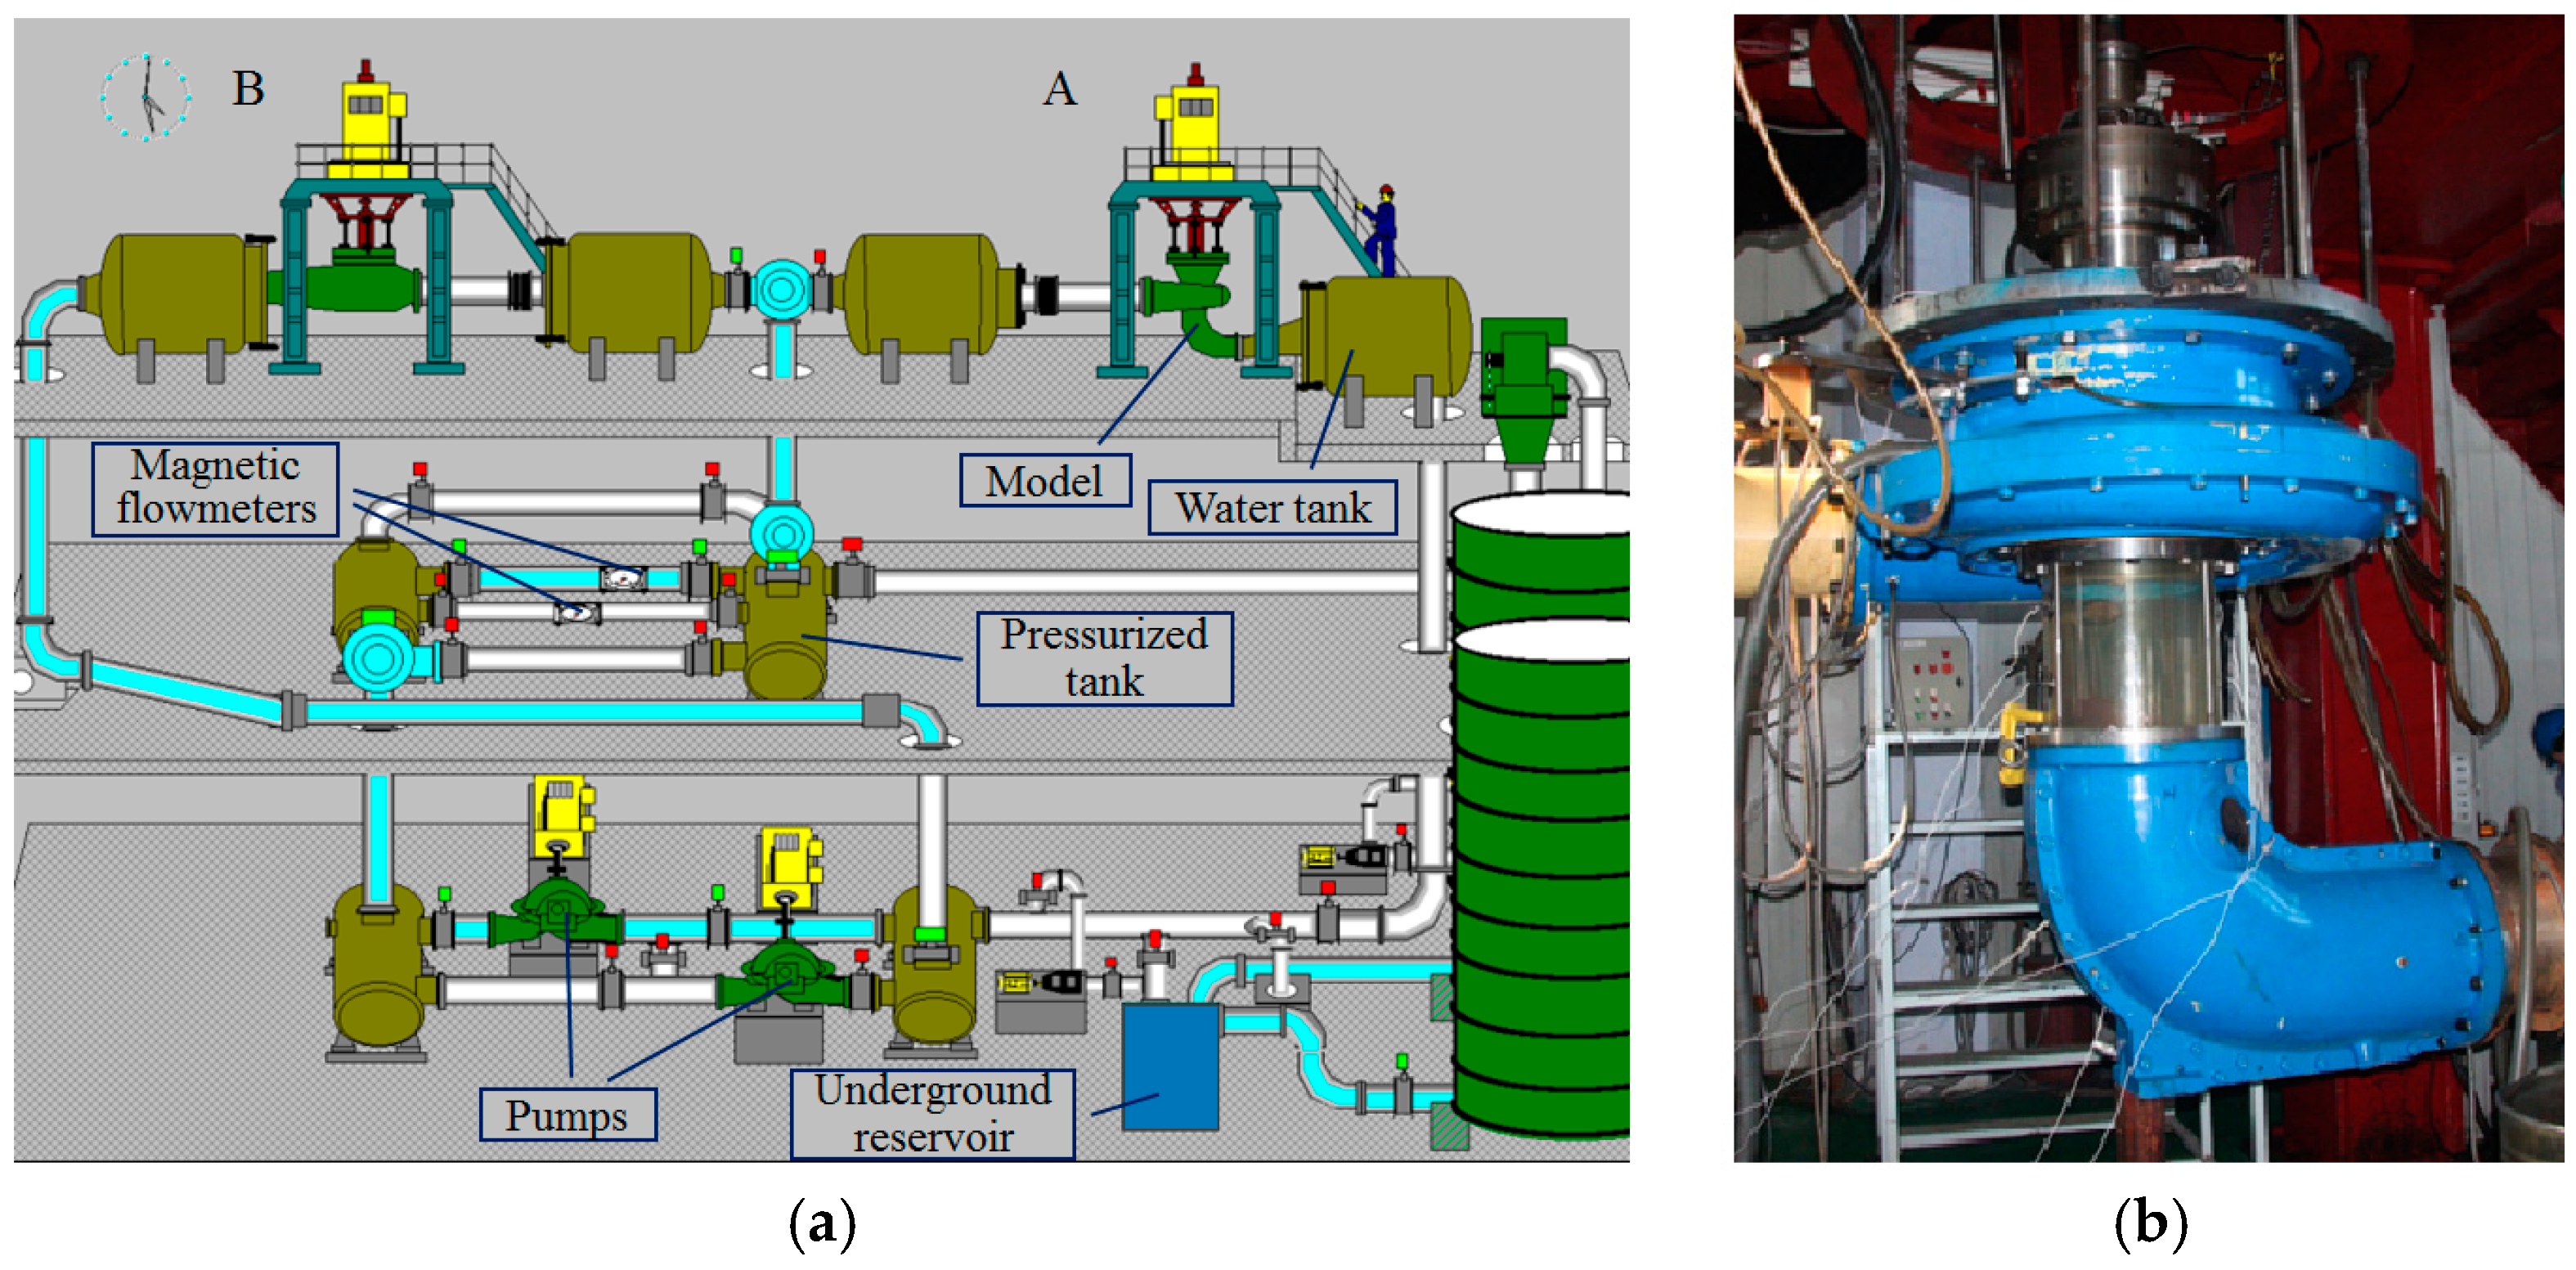
Model tests were conducted on a standard hydraulic machinery test rig at the Harbin Institute of Large Electric Machinery, China.
Figure 2 gives a schematic diagram of the model test rig. The test rig had two test stations, A and B, of which Station A could be used to conduct the model tests for Francis turbines and reversible pump-turbines. The main specifications of the test rig and the pressure sensor (PCB112A22) used for the pressure fluctuation measurement are listed in
Table 2. All measurements were conducted in accordance with International Electrotechnical Commission (IEC) Standard 60193 [
18].
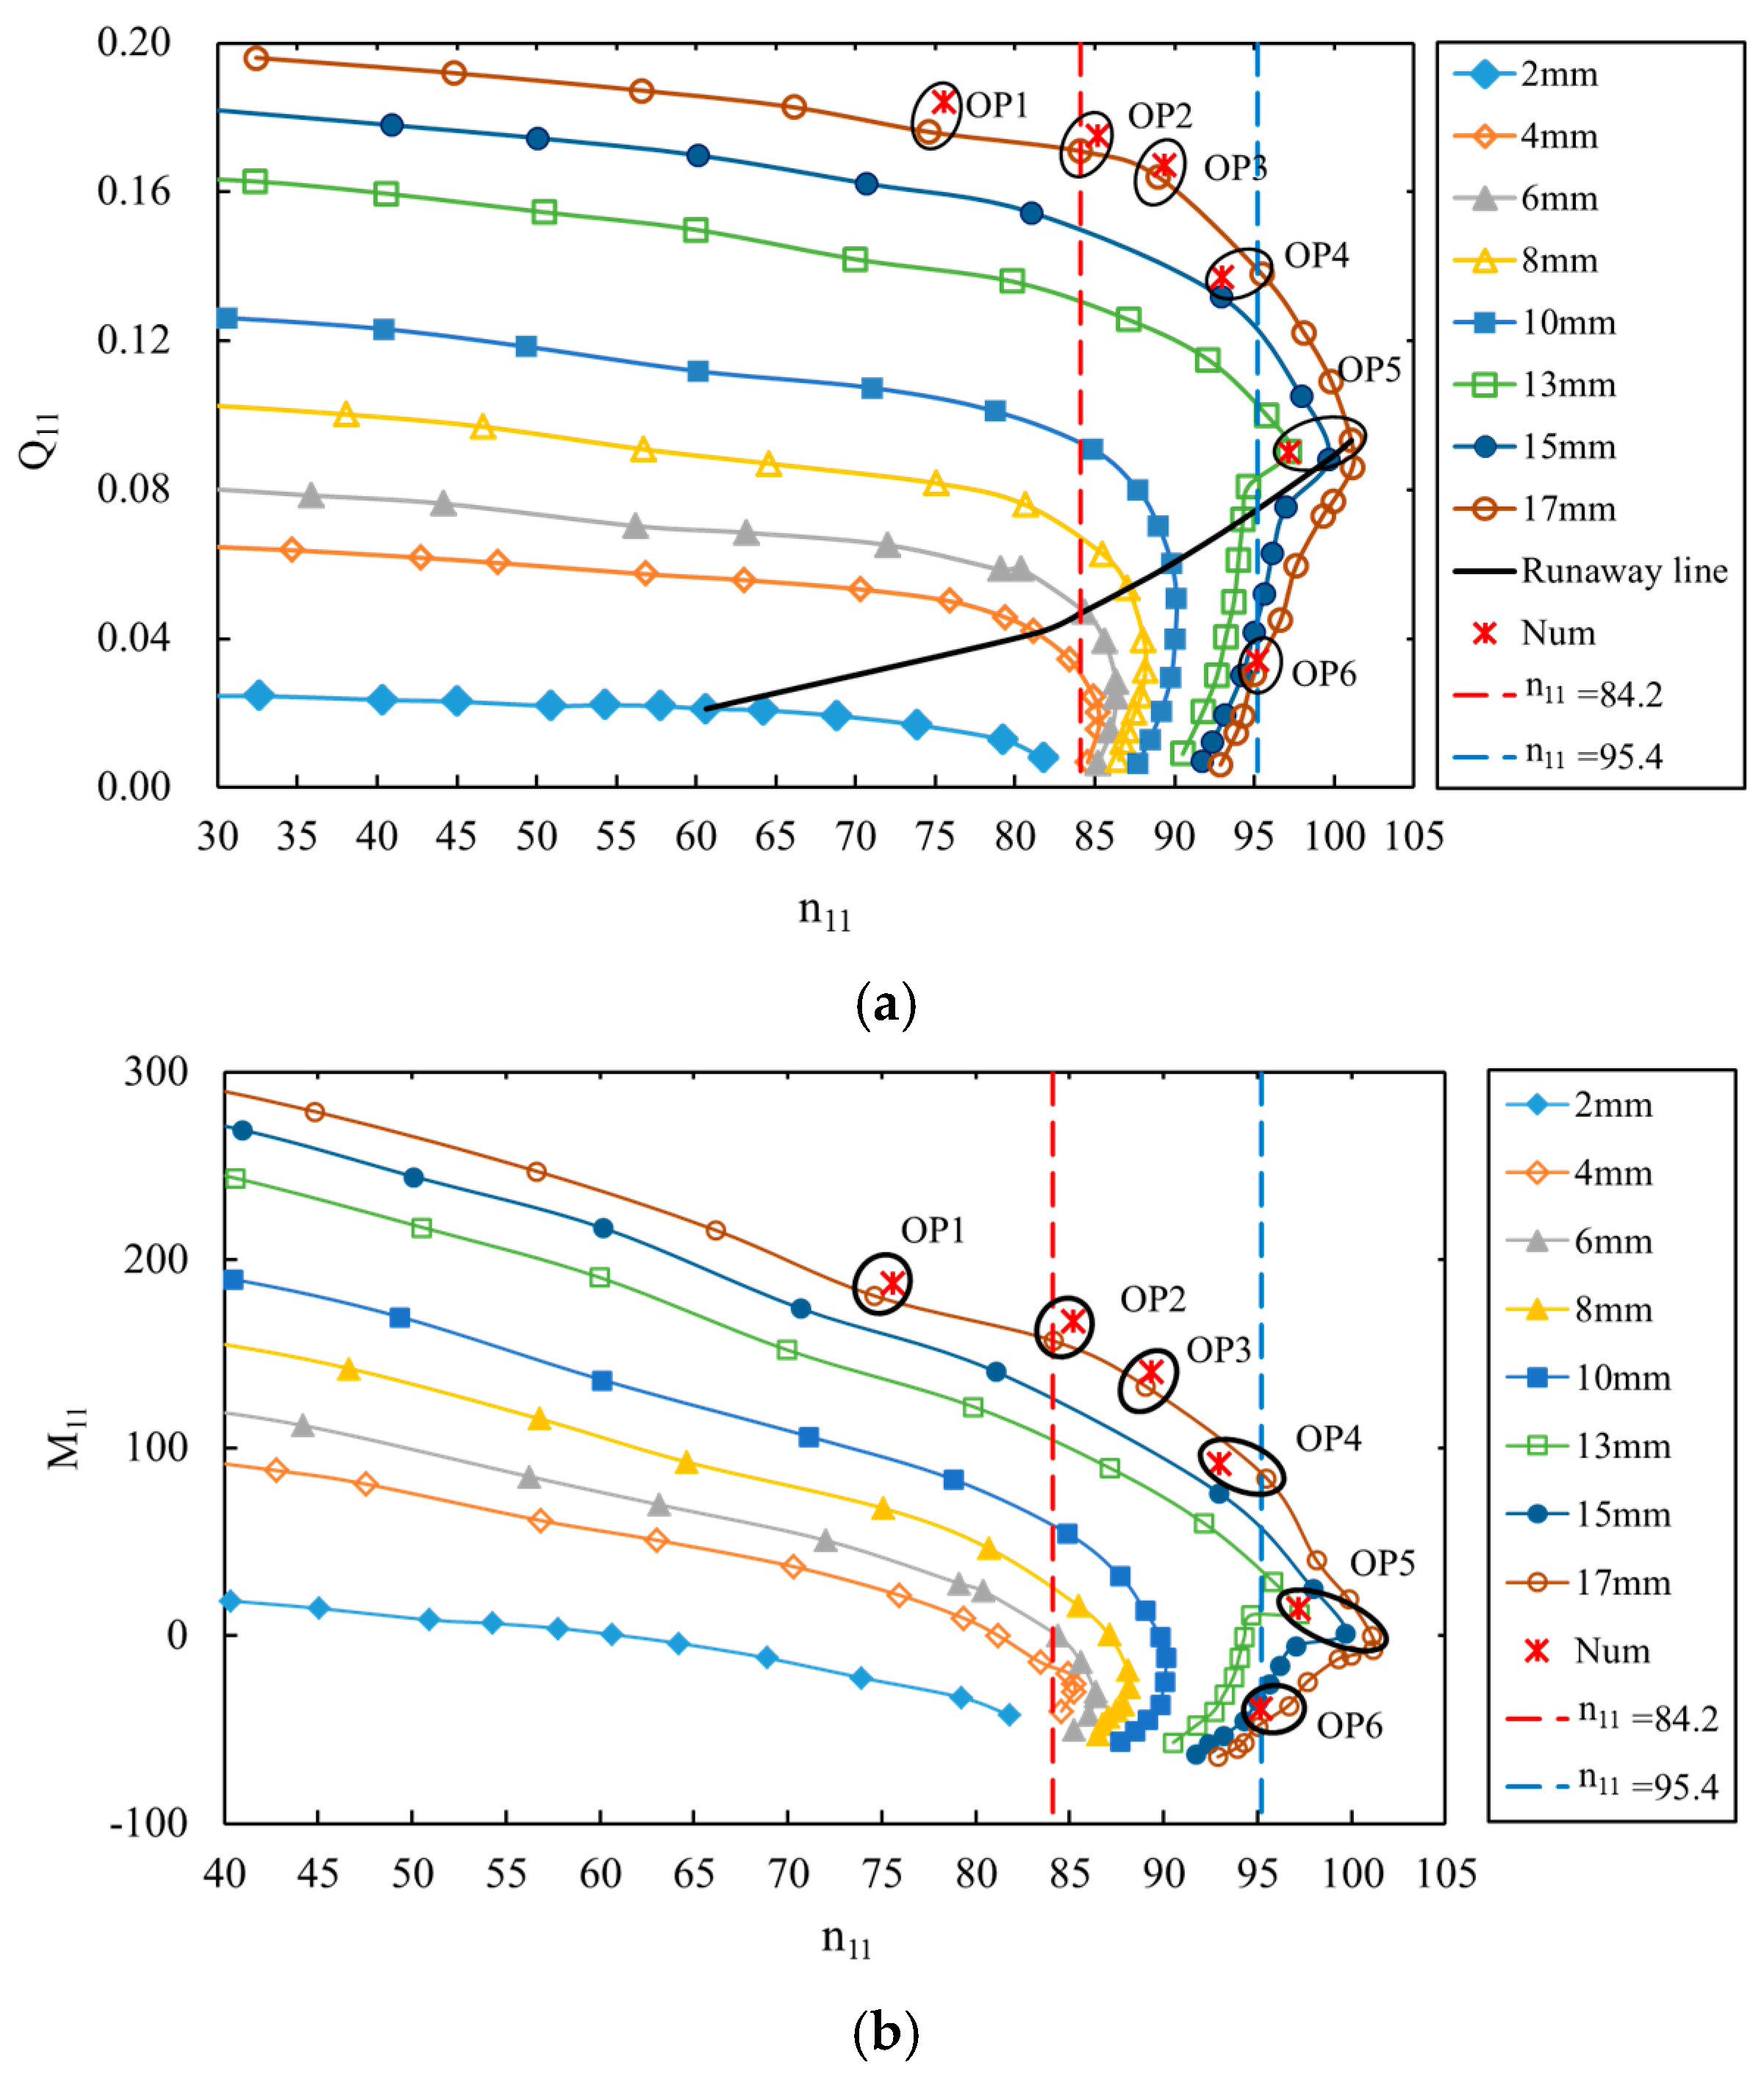
In
Figure 3, the measured S-shaped characteristics in some smaller guide vane openings are given. Of these, the unit speed
, unit discharge
, and unit moment
are defined as follows:
where
n stands for the runner rotating speed,
D2 for the runner inlet diameter in turbine mode,
H for the head in the model tests,
Q for the discharge, and
M for the moment. The four-quadrant test was conducted under a constant speed of
. In
Figure 3, only the first quadrant is illustrated, in order to clearly show the S-shaped characteristics. The normal operating range of the turbine mode is indicated by the two vertical lines.
2.2. Numerical Solutions
Three-dimensional turbulent flow simulations were conducted for the full-passage pump-turbine. The extensively-used commercial code ANSYS CFX 15.0 (ANSYS Inc., Canonsburg, PA, USA) was used to conduct the numerical simulations.
Turbulence models are important factors in computational fluid dynamics (CFD). An advanced turbulence model, the detached eddy simulation (DES), was adopted to provide highly detailed simulations of flow patterns and unsteady phenomena. The shear stress transport
model was used in the boundary layer, while the Smagorinsky-Lilly model was applied in detached regions [
8].
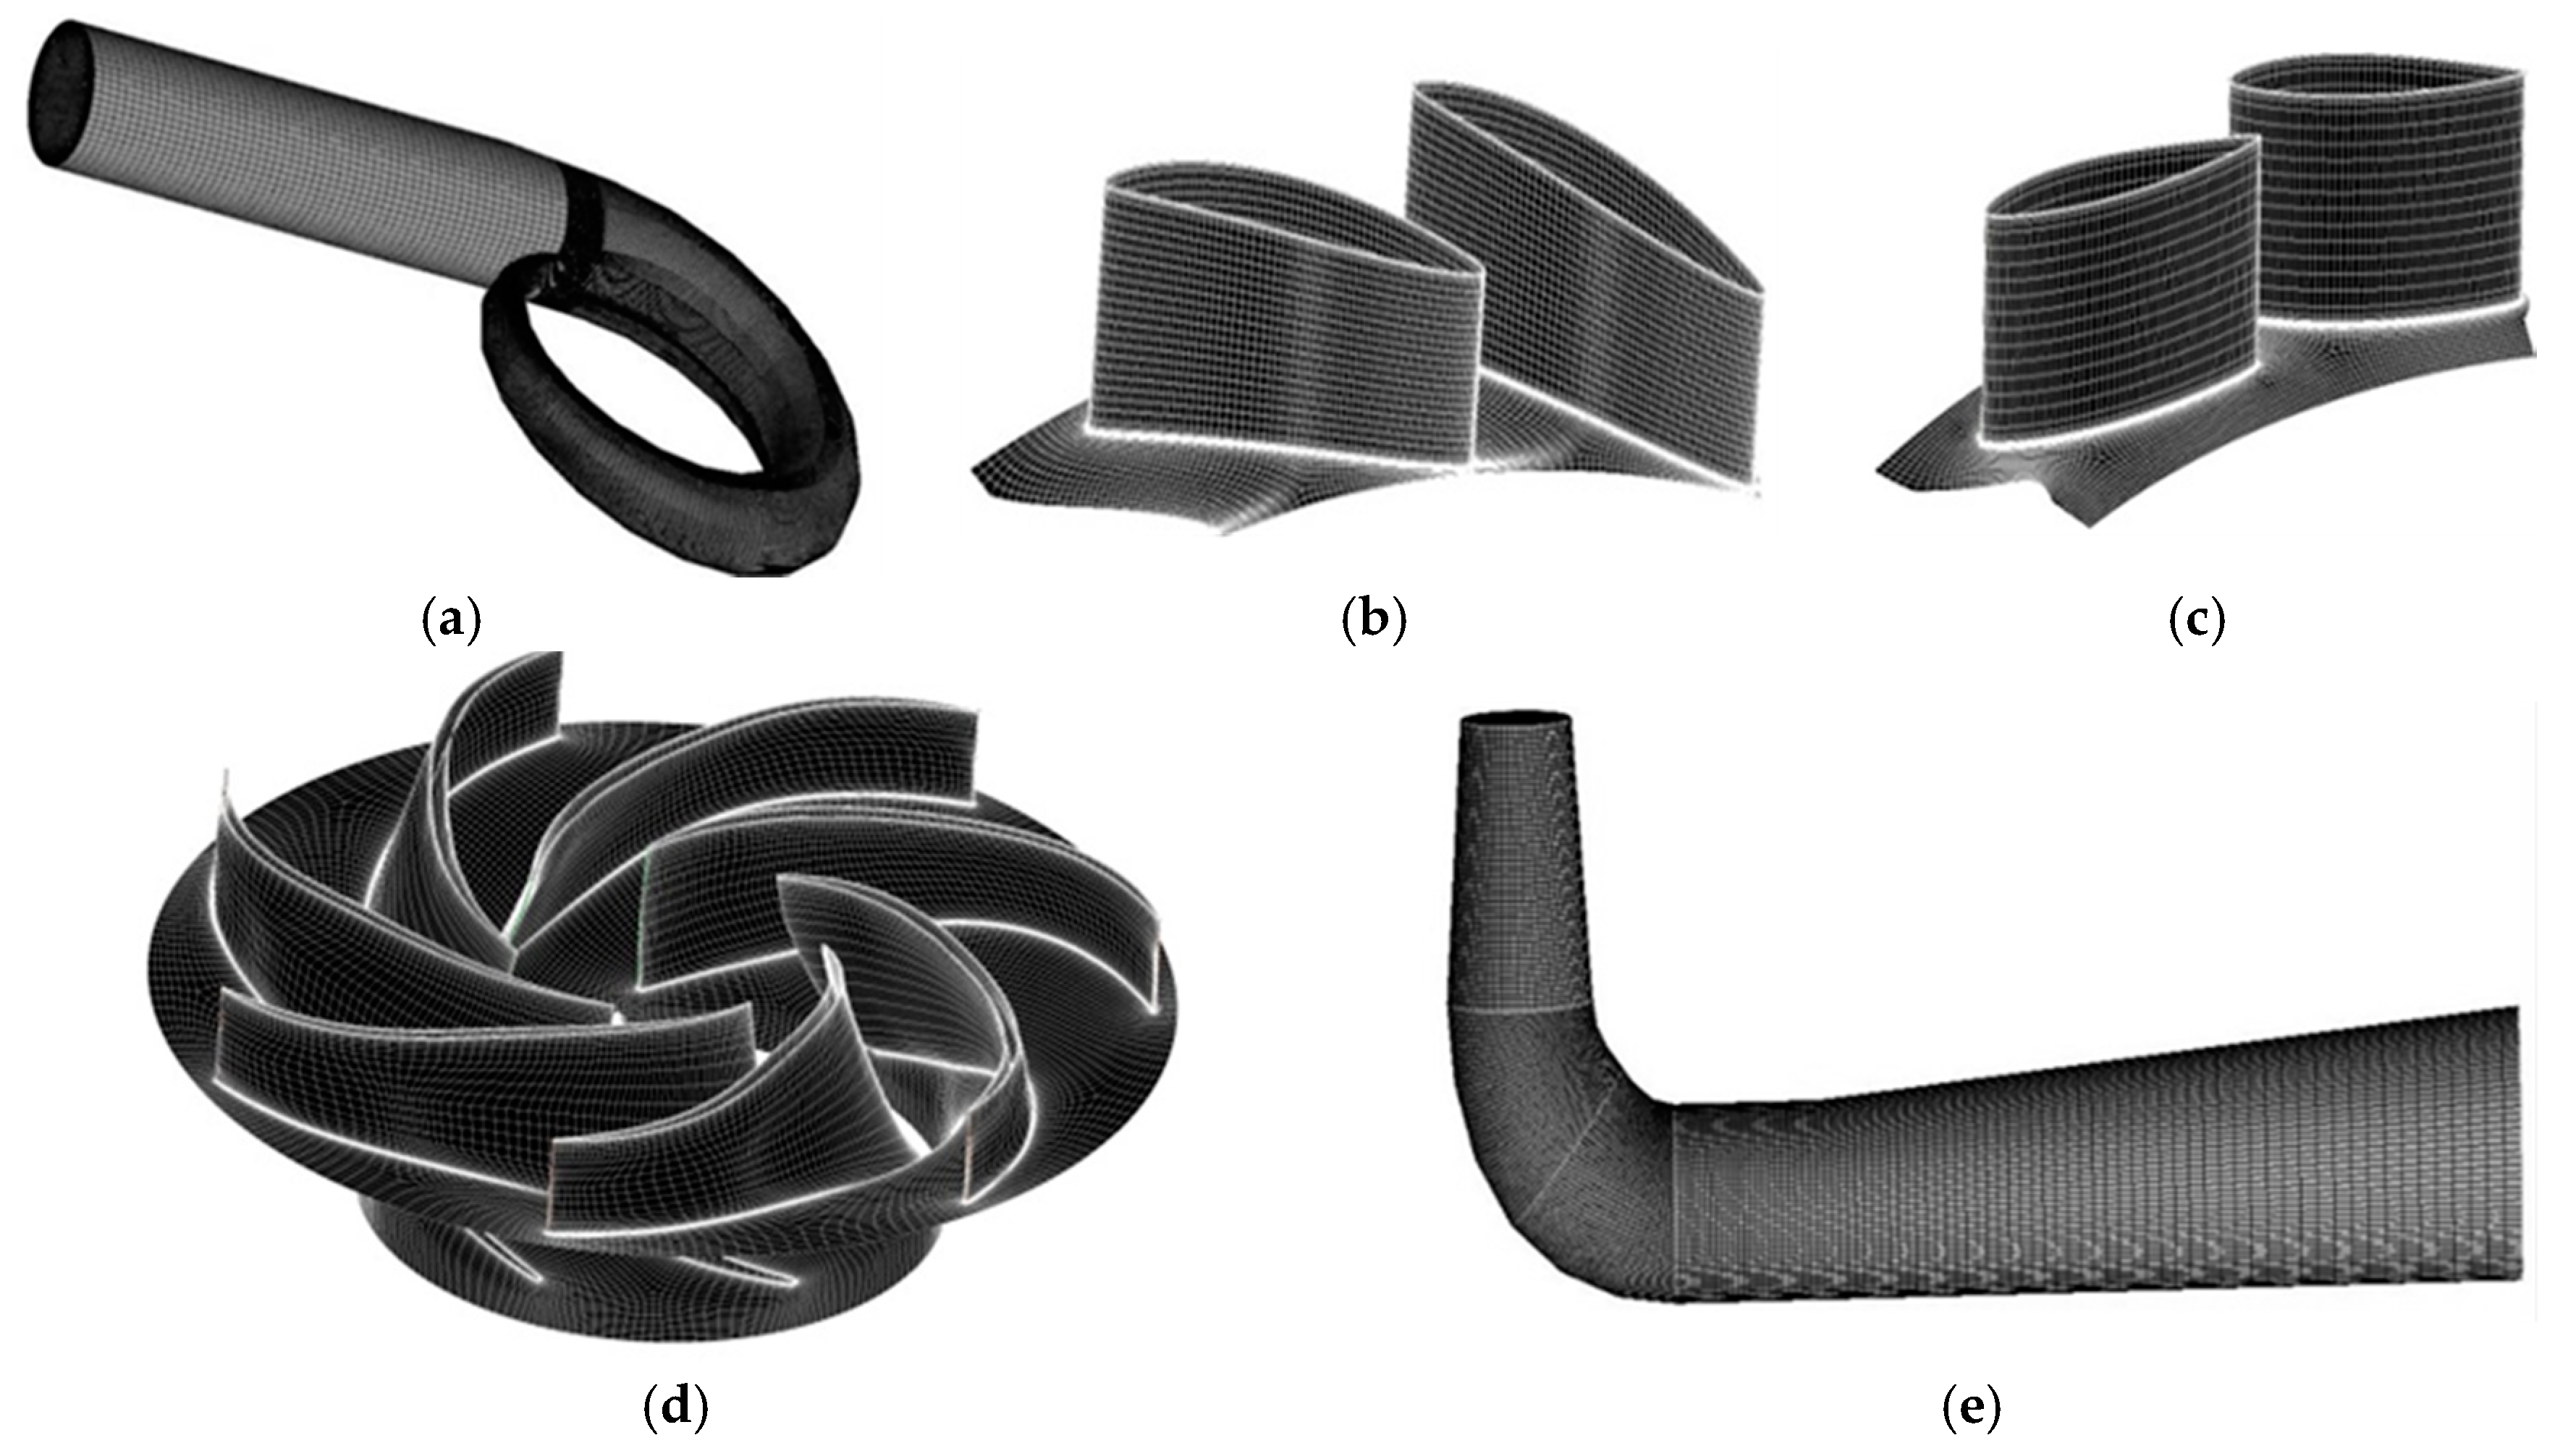
The ANSYS ICEM (a powerful meshing software) and Turbo Grid were used for grid generation. The computational domain was divided into five parts for meshing (
Figure 4), namely the spiral casing, stay vanes, guide vanes, runner and draft tube. Structured mesh was created for all these parts except for the spiral casing tongue, where unstructured mesh was employed due to the irregular structure.
At the inlet of the spiral casing, the mass flow rate was specified according to stochastic fluctuations of the velocities with a 5% free stream turbulent intensity. Static pressure was set at the outlet of the draft tube. The interfaces between stator-rotor blocks were set as the standard transient sliding interfaces. Walls were defined with no-slip wall boundary conditions. Runner blades, runner hub and shroud were fixed as rotating walls. The time-step size was set as 0.000139 s, such that one runner revolution was divided into 360 time steps. Second-order implicit time-stepping was adopted for time discretization. The convergence residuals for continuity and momentum equations were below 1.0 × 10⁻⁵. All calculations were conducted in a cluster computer with eight Intel 5645 2.4 GHz processors, 96 GB RAM, and 2 TB hard drives (Dell Inc., Round Rock, TX, USA).
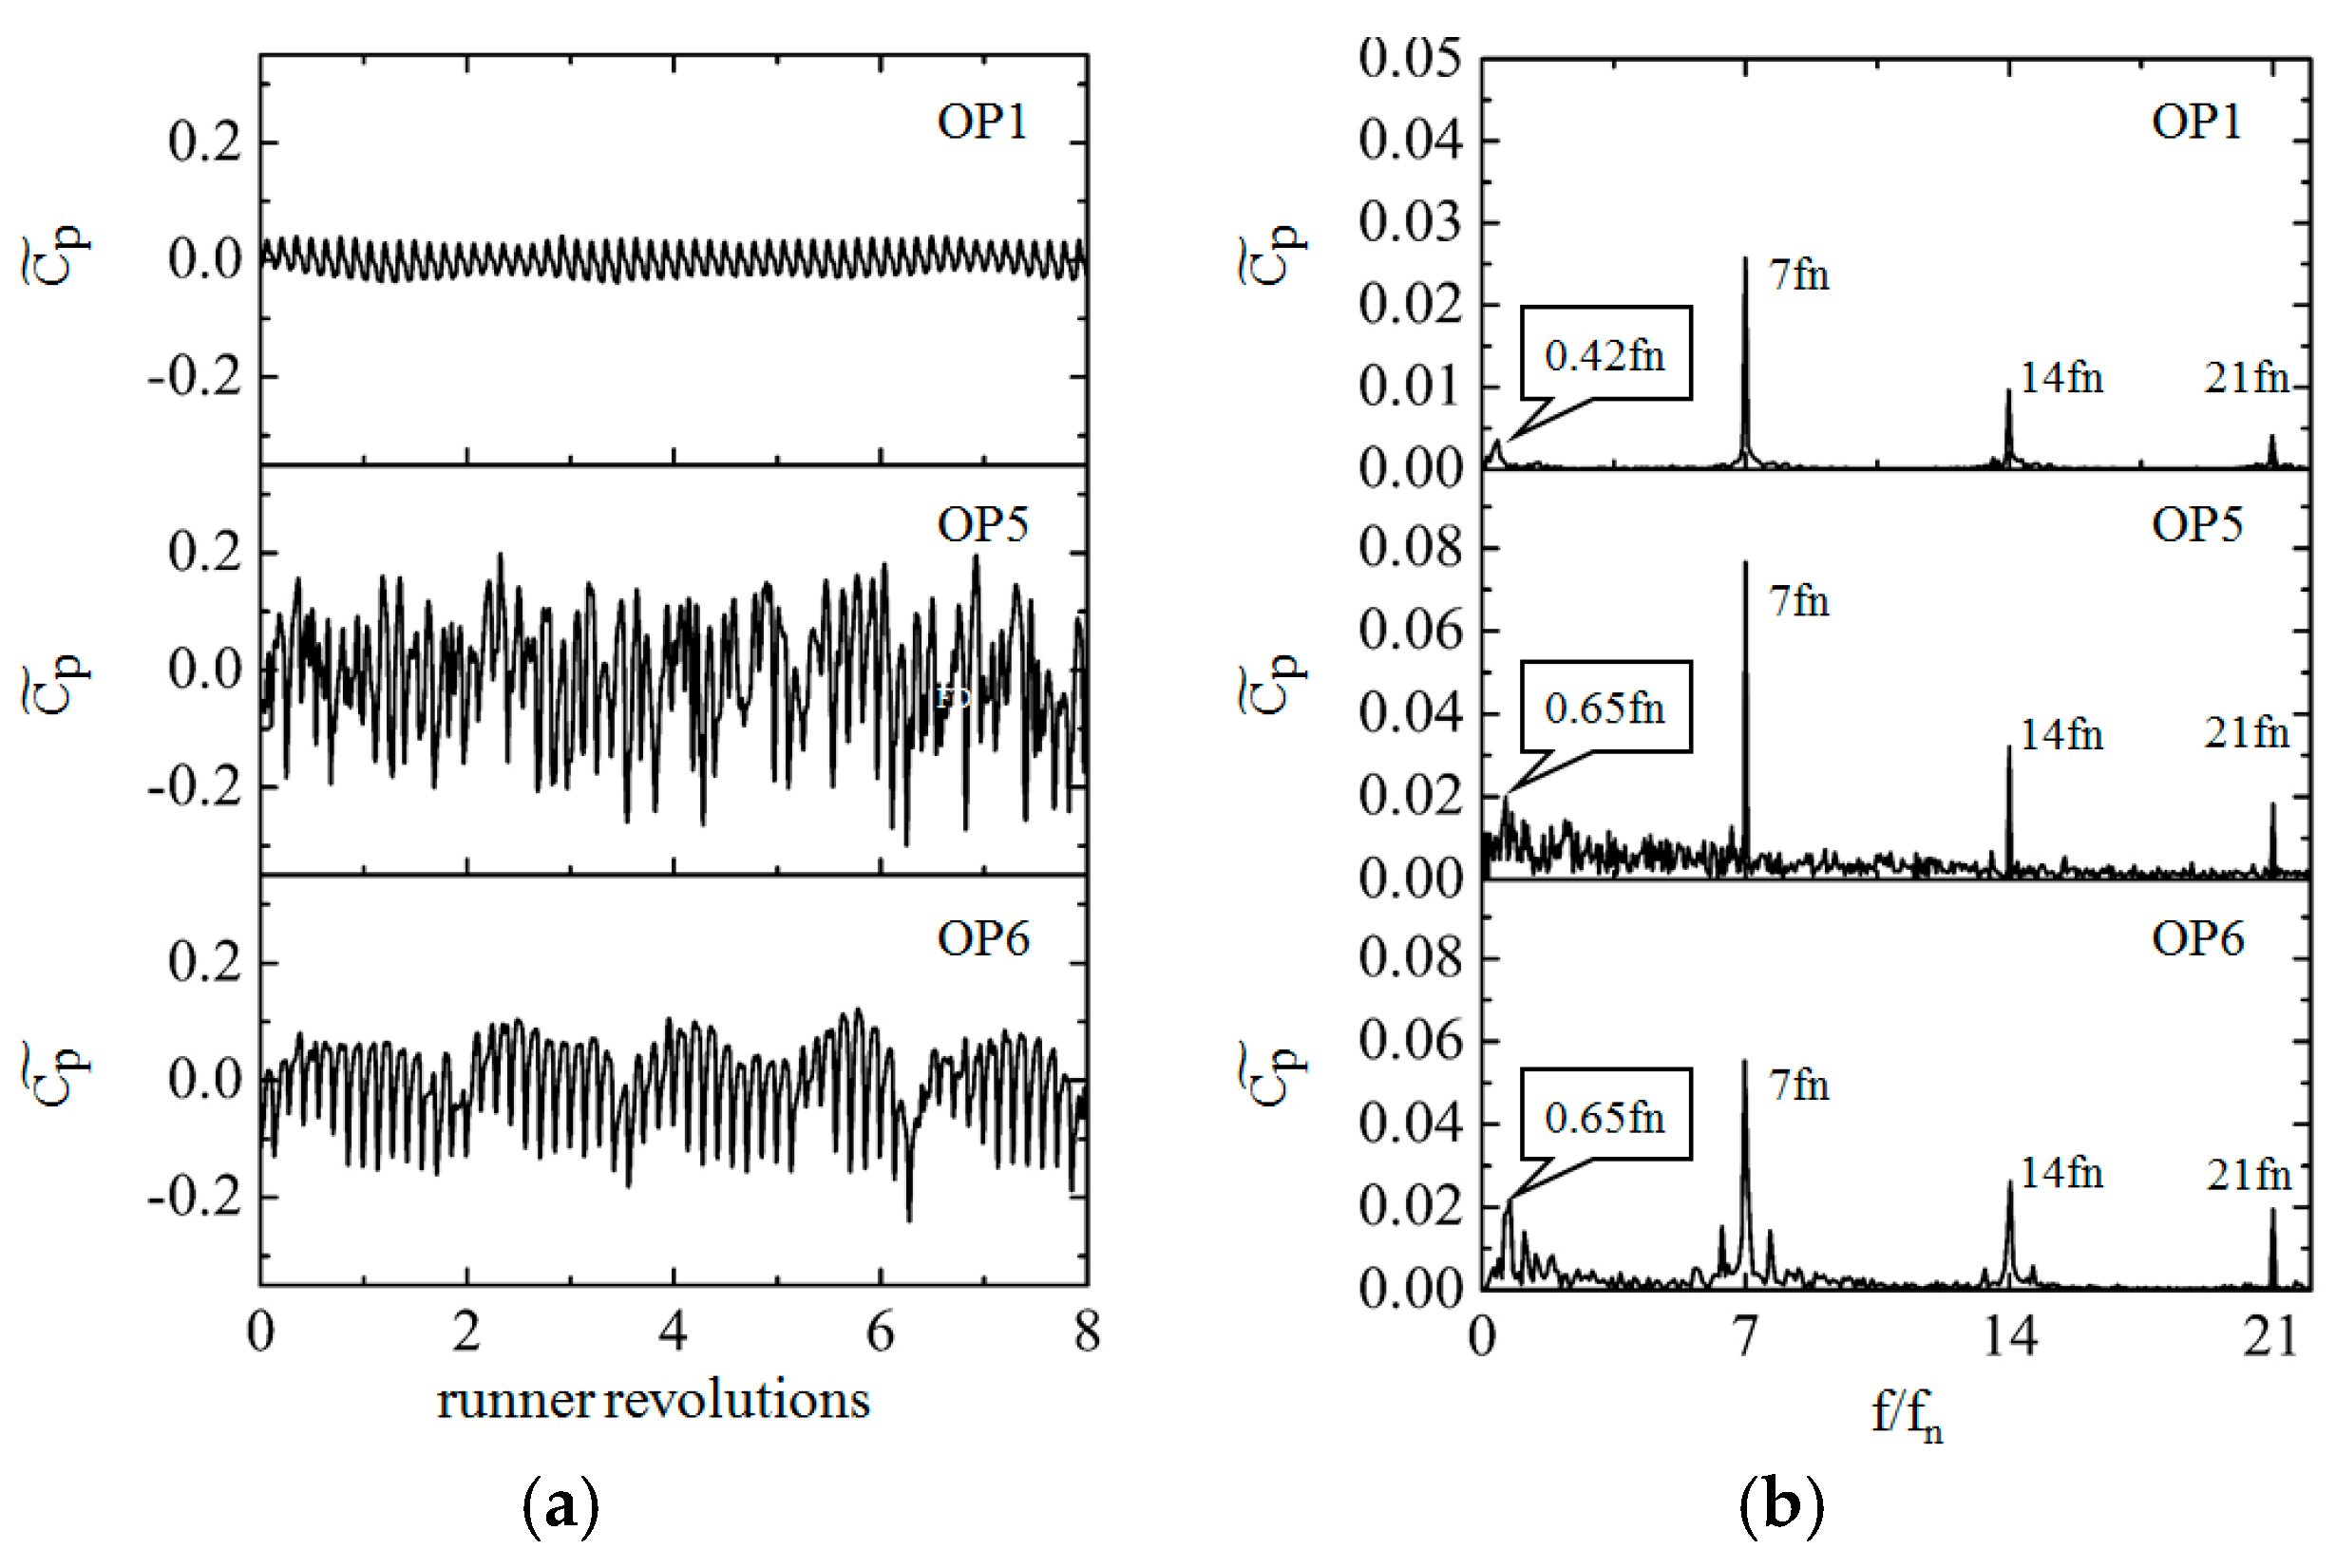
As shown in
Figure 3, at a guide vane opening of
, OP1 is the best efficient point (BEP), OP2–OP4 are the operating points in the normal operating range, while OP5 is the runaway point and OP6 is the low-discharge point in the turbine brake. Usually, the guide vane opening is given as an angle; however, its width was used in this study. The opening angle was
at
A = 17.0 mm.
Four meshes (
Table 3) were used to test mesh independence. The calculated points were OP2–OP4 (
Figure 4). The calculated efficiency errors for OP2–OP4 are given in
Table 4. Here, the error was calculated as
. In the simulations, the head cover and stay ring were not included; therefore, some leakage losses and the mechanical losses were not incorporated. The calculated efficiency
is mainly the hydraulic efficiency, and is calculated by means of a time average after the calculated unsteady condition becomes stable. Simulated results show that mesh density has a weak influence on efficiency as the grid density is high (3.62 million). After considering the complex unsteadiness, Mesh III was chosen for the simulations. The validation of the numerical results in the next section also shows that the numerical solutions used can provide reliable results.
Table 5 gives more information on Mesh III. There were a total of 4.5 million elements in the whole domain.
Figure 3 shows the boundary mesh for different components. Ten element layers with normal stretching ratios were created from the walls for improving the velocity profile from the no-slip boundaries. Near the wall, the value of no-dimensional distances was
. The mesh in the domain of the guide vanes, runner and diffuser section of the draft tube was finer than that in the other flow domain, in order to capture the complex flow characteristics in these components at higher resolution.
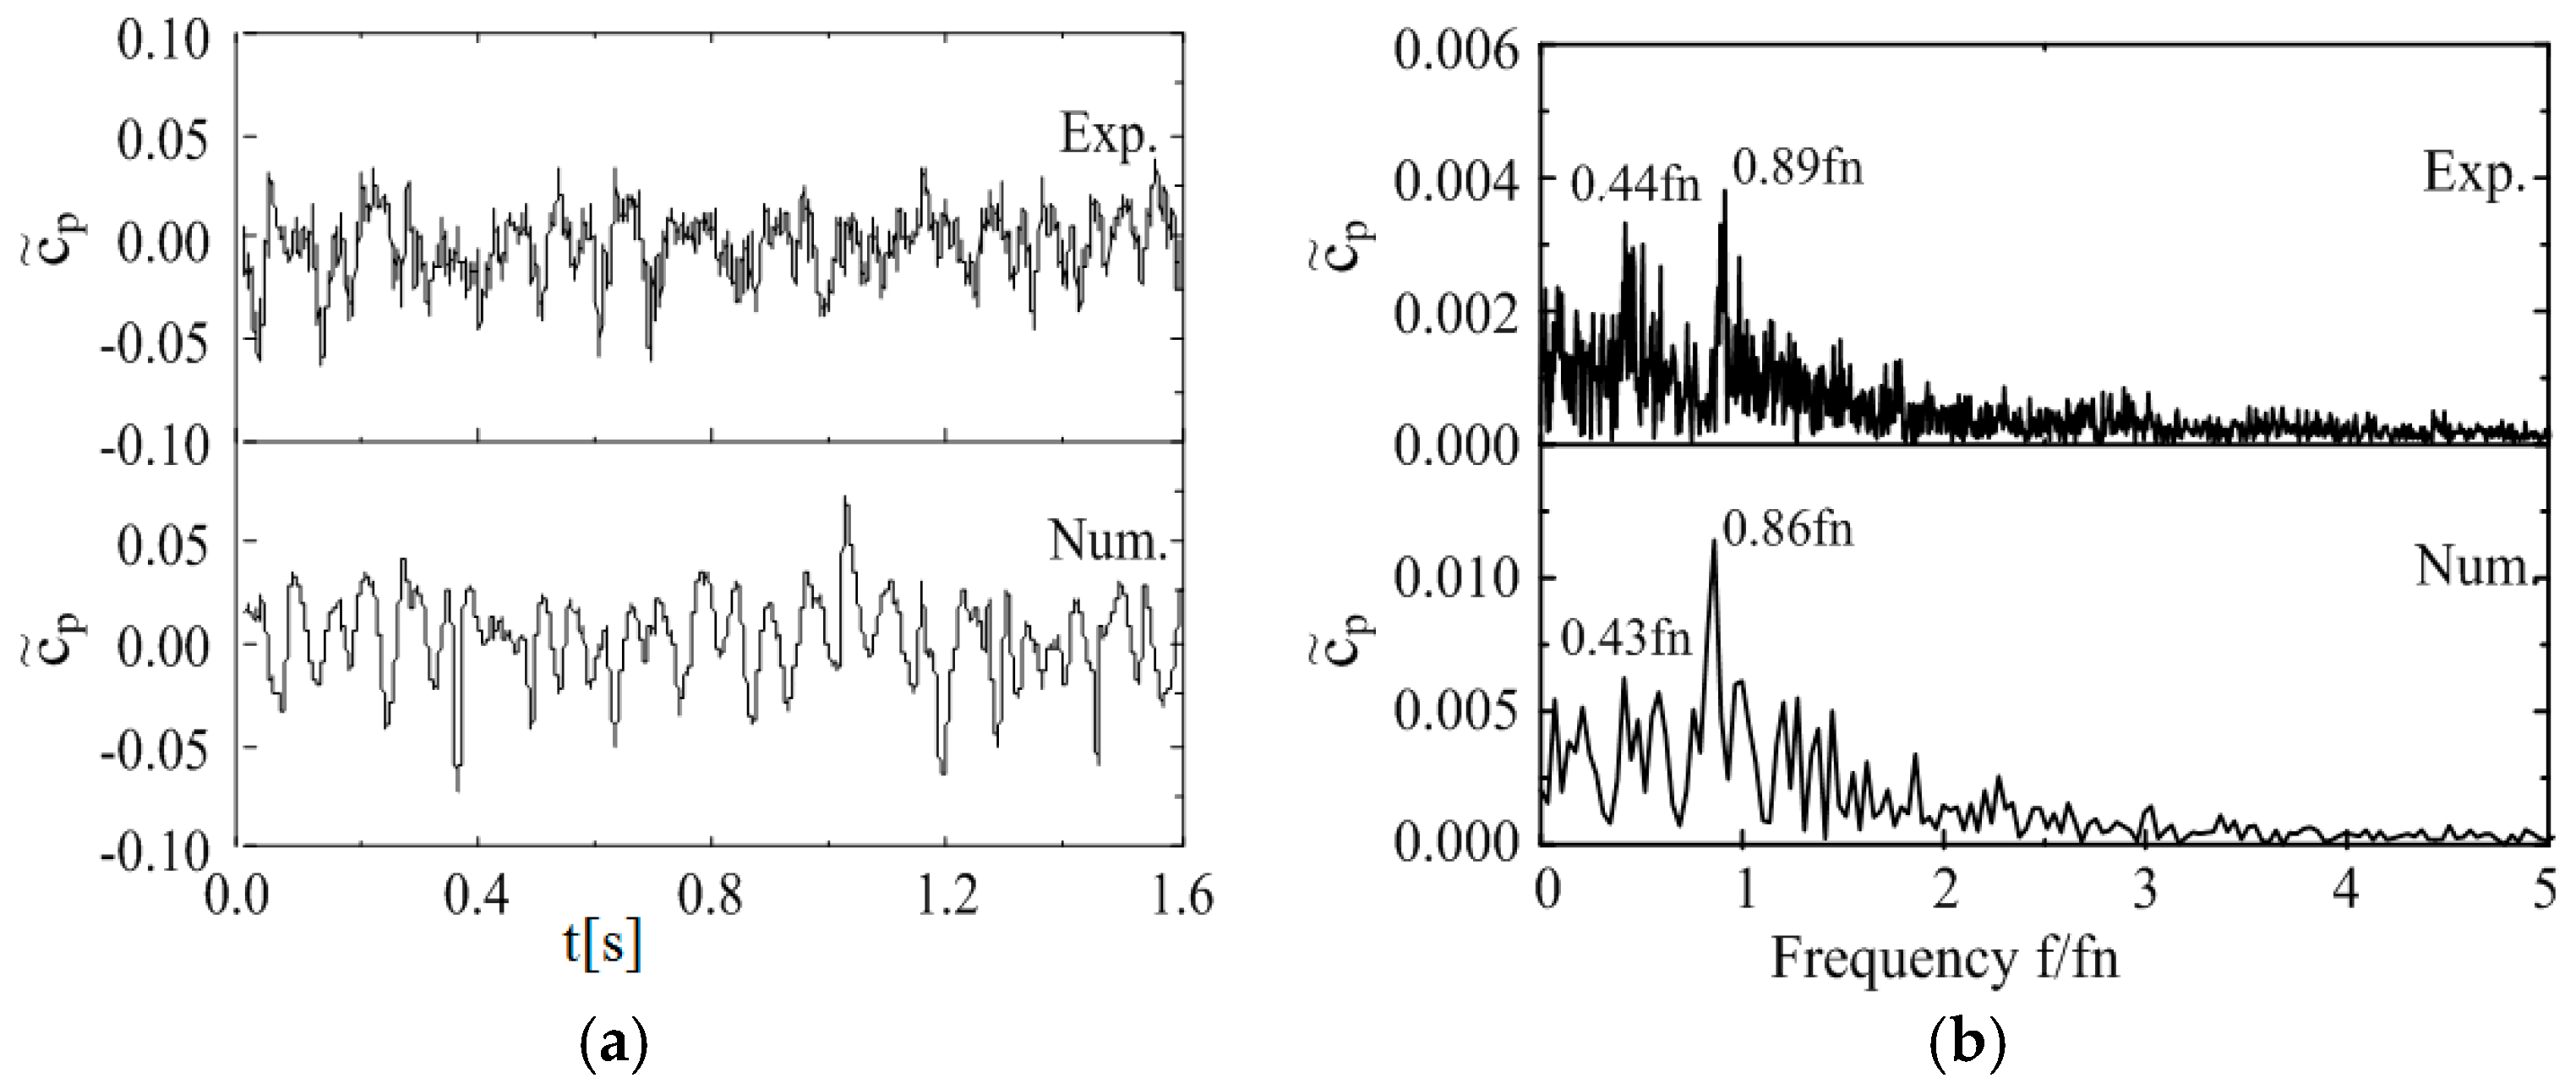
2.3. Validation of the Numerical Results
Numerical results were compared with experimental measurements (
Table 6). In the numerical simulations, the discharge
, and the runner rotating speed
, were specified with the same values as those in the measurements, while the head
, and the moment
, were time-averaged values within the simulations. The Reynolds number was
, where
is the runner rotation angular velocity,
is the runner inlet diameter in turbine mode, and
is the kinematic viscosity.
The agreement between numerical and experimental results was quite good in terms of
n11,
Q11, and
M11, with an error less than 5.0% at OP1 and OP2–OP4. At OP5 and OP6, there was a significant increase in error (
Table 5). As regards moment
M, at OP5, its values should be zero, and at OP6, its value should be a small negative value. Minor numerical overestimation in the moment will induce a significant increase in errors. Moreover, mechanical friction losses were not considered in the numerical simulations. These losses are closely related to the runner rotation rate and they remain almost unchanged with the operating condition. Therefore, the corresponding reduction of hydraulic power at these two points will induce significant increases in percentage errors, as shown in
Table 6. Even at these two points, the errors in
and
Q11 are still smaller than 5.0%. This means that the hydraulic heads are still well predicted in spite of the simplification of mechanical friction losses. The comparisons demonstrate the capability of the numerical simulations to predict the hydraulic characteristics of the pump-turbine with sufficient accuracy.


