
Low-Load Limit in a Diesel-Ignited Gas Engine

Institute for Dynamic Systems and Control, ETH Zurich, 8092 Zurich, Switzerland
*
Author to whom correspondence should be addressed.
†
Current address: Sonneggstrasse 3, 8092 Zurich, Switzerland.
Energies 2017, 10(10), 1450; https://doi.org/10.3390/en10101450
Submission received: 15 August 2017
/
Revised: 1 September 2017
/
Accepted: 14 September 2017
/
Published: 21 September 2017
(This article belongs to the Section I: Energy Fundamentals and Conversion)
Abstract
:The lean-burn capability of the Diesel-ignited gas engine combined with its potential for high efficiency and low CO emissions makes this engine concept one of the most promising alternative fuel converters for passenger cars. Instead of using a spark plug, the ignition relies on the compression-ignited Diesel fuel providing ignition centers for the homogeneous air-gas mixture. In this study the amount of Diesel is reduced to the minimum amount required for the desired ignition. The low-load operation of such an engine is known to be challenging, as hydrocarbon (HC) emissions rise. The objective of this study is to develop optimal low-load operation strategies for the input variables equivalence ratio and exhaust gas recirculation (EGR) rate. A physical engine model helps to investigate three important limitations, namely maximum acceptable HC emissions, minimal CO reduction, and minimal exhaust gas temperature. An important finding is the fact that the high HC emissions under low-load and lean conditions are a consequence of the inability to raise the gas equivalence ratio resulting in a poor flame propagation. The simulations on the various low-load strategies reveal the conflicting demand of lean combustion with low CO emissions and stoichiometric operation with low HC emissions, as well as the minimal feasible dual-fuel load of bar brake mean effective pressure.
1. Introduction
1.1. Motivation
The importance of natural gas as a hydrocarbon-based fuel for engines in industrial, naval and automotive applications is increasing continually. The potential low CO emission of methane, favored on the one hand by the high hydrogen-to-carbon ratio and on the other hand by the high knock resistance, makes natural gas one of the most promising alternative energy carriers for passenger cars. Methane, obtained from fossil sources as well as from synthetic production, will likely be available in substantial quantities in the future. The production of methane by excess electric energy based on electrolysis may help to mitigate the problem of balancing demand and supply in the power network with renewable energy sources. Engines fueled with this synthetic methane operate CO-neutrally. Therefore, gas engines represent a promising alternative to the emerging market for electric drive units.
Among all gas engines, the Diesel-ignited gas engine is a unique concept due to its high variability in ignition energy. While methane gas is injected cylinder-individually into the intake ports, Diesel is injected directly into the cylinders (see Figure 1). The Diesel fuel provides ignition centers for the premixed methane gas. Diesel-ignited gas engines feature substantially enhanced ignition boundaries compared to spark-ignited engines and allow for a lean-burn operation which enables a high engine efficiency. However, apart from the ignition limit, there are further limitations which restrict the operation of such an engine. For example, the large amount of unburnt hydrocarbon (HC) emissions in low-load conditions poses a challenge for complying with the legal emission limits for passenger cars. The problem of unburnt hydrocarbon emissions is aggravated by the fact that methane needs a much higher temperature for catalytic oxidation than gasoline or Diesel. Guaranteeing the effective oxidation of unburnt methane in the exhaust aftertreatment catalyst therefore is a challenging task.
Various investigations of Diesel-ignited gas engines in automotive applications are known from literature. Fundamental research on Diesel substitution by methane or gasoline has been reported for several decades [1,2,3,4,5,6,7]. Other publications focus on the capability to operate compressed natural gas (CNG) engines in lean-burn mode [8]. Recent research focusing on low temperature combustion draws more attention to the Diesel-ignited gas engine since the engine is well suited for reactivity controlled compression ignition (RCCI) combustion. This concept is characterized by a more homogeneous mixture of Diesel in the combustion chamber before ignition. In contrast to the conventional Diesel pilot ignition, the Diesel is injected early in the compression phase with either multiple injections or one single injection. RCCI has proven to be effective in achieving high fuel efficiency and low pollutant emissions [9,10,11,12].
Studies on possible control strategies of Diesel-ignited gas engines have demonstrated the substantial CO reduction potential of Diesel-ignited gas engines. By using such an engine in a hybrid electric vehicle driving the New European Driving Cycle (NEDC) , the CO emissions were reduced by up to compared to a state-of-the-art Diesel engine [14,15]. The need for a lean HC exhaust gas aftertreatment system was circumvented by applying the shifting of the operating point in such a way that the low-load regime of the engine is avoided.
If the engine is used in a conventional layout, i.e., without any electric hybridization, the operation at low- and part-load was found to be a major challenge. Serrano et al. investigated how to determine the optimal amount of Diesel injected in terms of engine efficiency [16]. At low-load operation, various researchers apply techniques such as exhaust gas recirculation (EGR) and lean combustion [16,17,18,19]. A different approach was chosen in the study of Taniguchi et al.: In order to meet EURO4 emission standards the researchers propose either to limit dual-fuel operation to the high-load regime or switching to stoichiometric operation in low-load conditions [20]. The engine’s capability to meet pollutant emission limits at low-load conditions is found to be of utmost importance. Most studies mention the necessity to switch between dual-fuel and Diesel-only modes at very low loads.
The large amount of unburnt HC emissions mentioned above is believed to be caused by the conflicting demands of the two fuels as well as fuel trapped in the crevices being unable to burn and released into the exhaust. The compression-ignited Diesel fuel favors conditions with excess oxygen and high levels of pressure at ignition, similar to the conditions in conventional Diesel engines. These preferences conflict with the favored conditions of the homogenous gas-air mixture, where flame propagation demands a fuel-to-air ratio close to stoichiometry. In the case where intake manifold throttling is used to increase the equivalence ratio, the ignition delay time of the Diesel fuel is deteriorating disproportionally with the decreasing intake manifold pressure [21,22]. In addition, the combustion volume geometry of the Diesel engine is not optimal for homogeneous combustion. Crevices and squish volumes are sources of unburnt hydrocarbons as the flame extinguishes before it can reach those small volumes.
In summary, the known literature agrees that in the interest of minimal emissions operating the engine with Diesel only is the only reasonable option in low-load conditions. Lean-burn concepts with homogenous gas-air mixtures lead to unacceptable emissions of unburnt hydrocarbons.
The dual-fuel operation of a Diesel-ignited gas engine is limited by further properties such as CO emissions or exhaust gas temperature. The CO emissions become a limiting factor if in dual-fuel mode the engine produces more CO emissions than in the Diesel-only configuration. Under such conditions the operation should be switched to Diesel-only combustion in order to avoid any unnecessary CO emissions. As mentioned above, the exhaust gas temperature is a property of special interest in gas engines generally. The abatement of the HC emissions requires an oxidation catalyst or a three-way catalyst (TWC). The conversion efficiency is thereby strongly dependent on the catalyst temperature. Literature reports that methane, the smallest hydrocarbon, is very stable and needs a high catalyst temperature for complete oxidation. Typical values for the methane light-off temperature are reported to be C higher than for hydrocarbons [23]. Thus, an exhaust temperature of approximately C is needed. In addition, the catalyst is working in the kinetically influenced regime, which makes it very prone to aging [24].
Despite all that research, the literature lacks studies exploring to what extent the Diesel-ignited gas engine can be operated at low load under the three criteria mentioned, namely HC emissions, CO emissions, and exhaust gas temperature.
1.2. Objective
The goal of this work is to understand the physical relations behind the most important steady-state limitations in the low-load operation of a Diesel-ignited gas engine and to present a model-based approach to find optimal operation strategies for the engine in terms of EGR ratio and fuel-to-air equivalence ratio.
1.3. Contributions
This work presents two major contributions to the general understanding of the low-load limitations in Diesel-ignited gas engines:
- A semi-physical mathematical model capable of reproducing the engine’s steady-state low-load performance and emissions in dual-fuel mode.
- The identification of low-load strategies that are optimal in terms of engine efficiency, HC emissions, or CO emissions.
1.4. Limitation of This Study
Reducing nitrogen oxide emissions (NOx) is a major challenge that engine research in general is facing today. Also, in the case of the Diesel-ignited gas engine, NOx emissions that exceed limits set by legislation were reported [19,25,26]. Nevertheless, the limitation imposed by NOx emissions is beyond the scope of this study mainly for two reasons. First, the avoidance of NOx emissions is not a specific problem of this type of engine. Much research effort has already been addressed to similar challenges arising for Diesel engines [27,28,29,30]. Second, efficient lean NOx abatement systems are known from series production, as for example the selective catalytic reduction (SCR) or lean NOx trap. Based on these considerations, this study focuses explicitly on the low-load limitations implied by HC emissions, CO emissions, and exhaust gas temperature while attention was paid to the extensibility of the model presented such that a NOx submodel can be integrated seamlessly at a later time.
1.5. Structure
A short outline of this study’s structure is presented here. First, the three essential low-load criteria as well as the experimental setup are introduced in Section 2 and Section 3, respectively. Section 4 presents the detailed mathematical engine model that is used in the subsequent two chapters. In Section 5 the physical reasons of the low-load limitations are discussed. The major results are finally presented in Section 6, i.e., the analysis of the low-load limitation considering three criteria as well as the model-based optimal strategies for equivalence ratio and EGR ratio. The key conclusions are summarized in Section 7.
2. Low-Load Criteria
The low-load limit of a Diesel-ignited gas engine is defined as the minimal load at which the engine still fulfills certain quality criteria. The three low-load criteria considered in the scope of this study are introduced in the following.
A major driving force in the development of the Diesel-ignited gas engine is its potential to reduce CO emissions. The first criterion is therefore given by the CO reduction over the base Diesel engine . This quantity describes the relative difference in CO emission between a base (Diesel-only) operation and a dual-fuel operation .
Throughout this paper, hypothetical tailpipe CO emissions are considered, i.e., the CO emission that result in the case of the complete oxidation of all unburnt hydrocarbons (HC) and carbon monoxide (CO) in the exhaust. Increased CO and HC emissions thus have no diminishing effect on the CO values considered.
The other two criteria are related to the complete oxidation of unburnt methane in the engine’s exhaust gas. In general, lean-burn gas engines feature significant emissions of unburnt methane fuel. It is a crucial challenge to limit the engine-out hydrocarbon emissions to a level such that a well working catalyst with efficiency is able to oxidize the hydrocarbons according to current (Euro VI) limits set by legislation for tailpipe emissions (see Appendix C). The catalyst is only capable to comply with this requirement if the exhaust gas temperature is high enough, which constitutes the third criterion. As reported in literature, the exhaust gas temperature required to oxidize methane is significantly higher than for typical unburnt hydrocarbons produced in a gasoline or Diesel engine. Reasonable numerical values for all three criteria are given in Table 1.
3. Experimental Setup
The setup used for all experimental investigations is introduced in the following. The focus of this study lies on the low-load regime since the operation with moderate torque output plays an important role for legal vehicle test cycles as a significant distance has to be covered at relatively low load conditions [31]. The term “low-load operation” stands for non-boosted operating points at moderate speed that are relevant in test cycles such as the NEDC or the Worldwide harmonized Light vehicles Test Cycle (WLTC). Information on the operating points used is given in Appendix D.
3.1. Engine Hardware
The Diesel-ignited gas engine is based on a conventional Diesel engine. A port fuel injection system for gas has been added. The engine is equipped with cylinder pressure sensors in all four cylinders. The information on the cylinder pressure traces is used to calculate the center of combustion (COC) online which is then used for feedback control of the combustion phasing. Table 2 lists the basic properties of the engine.
3.2. Engine Control
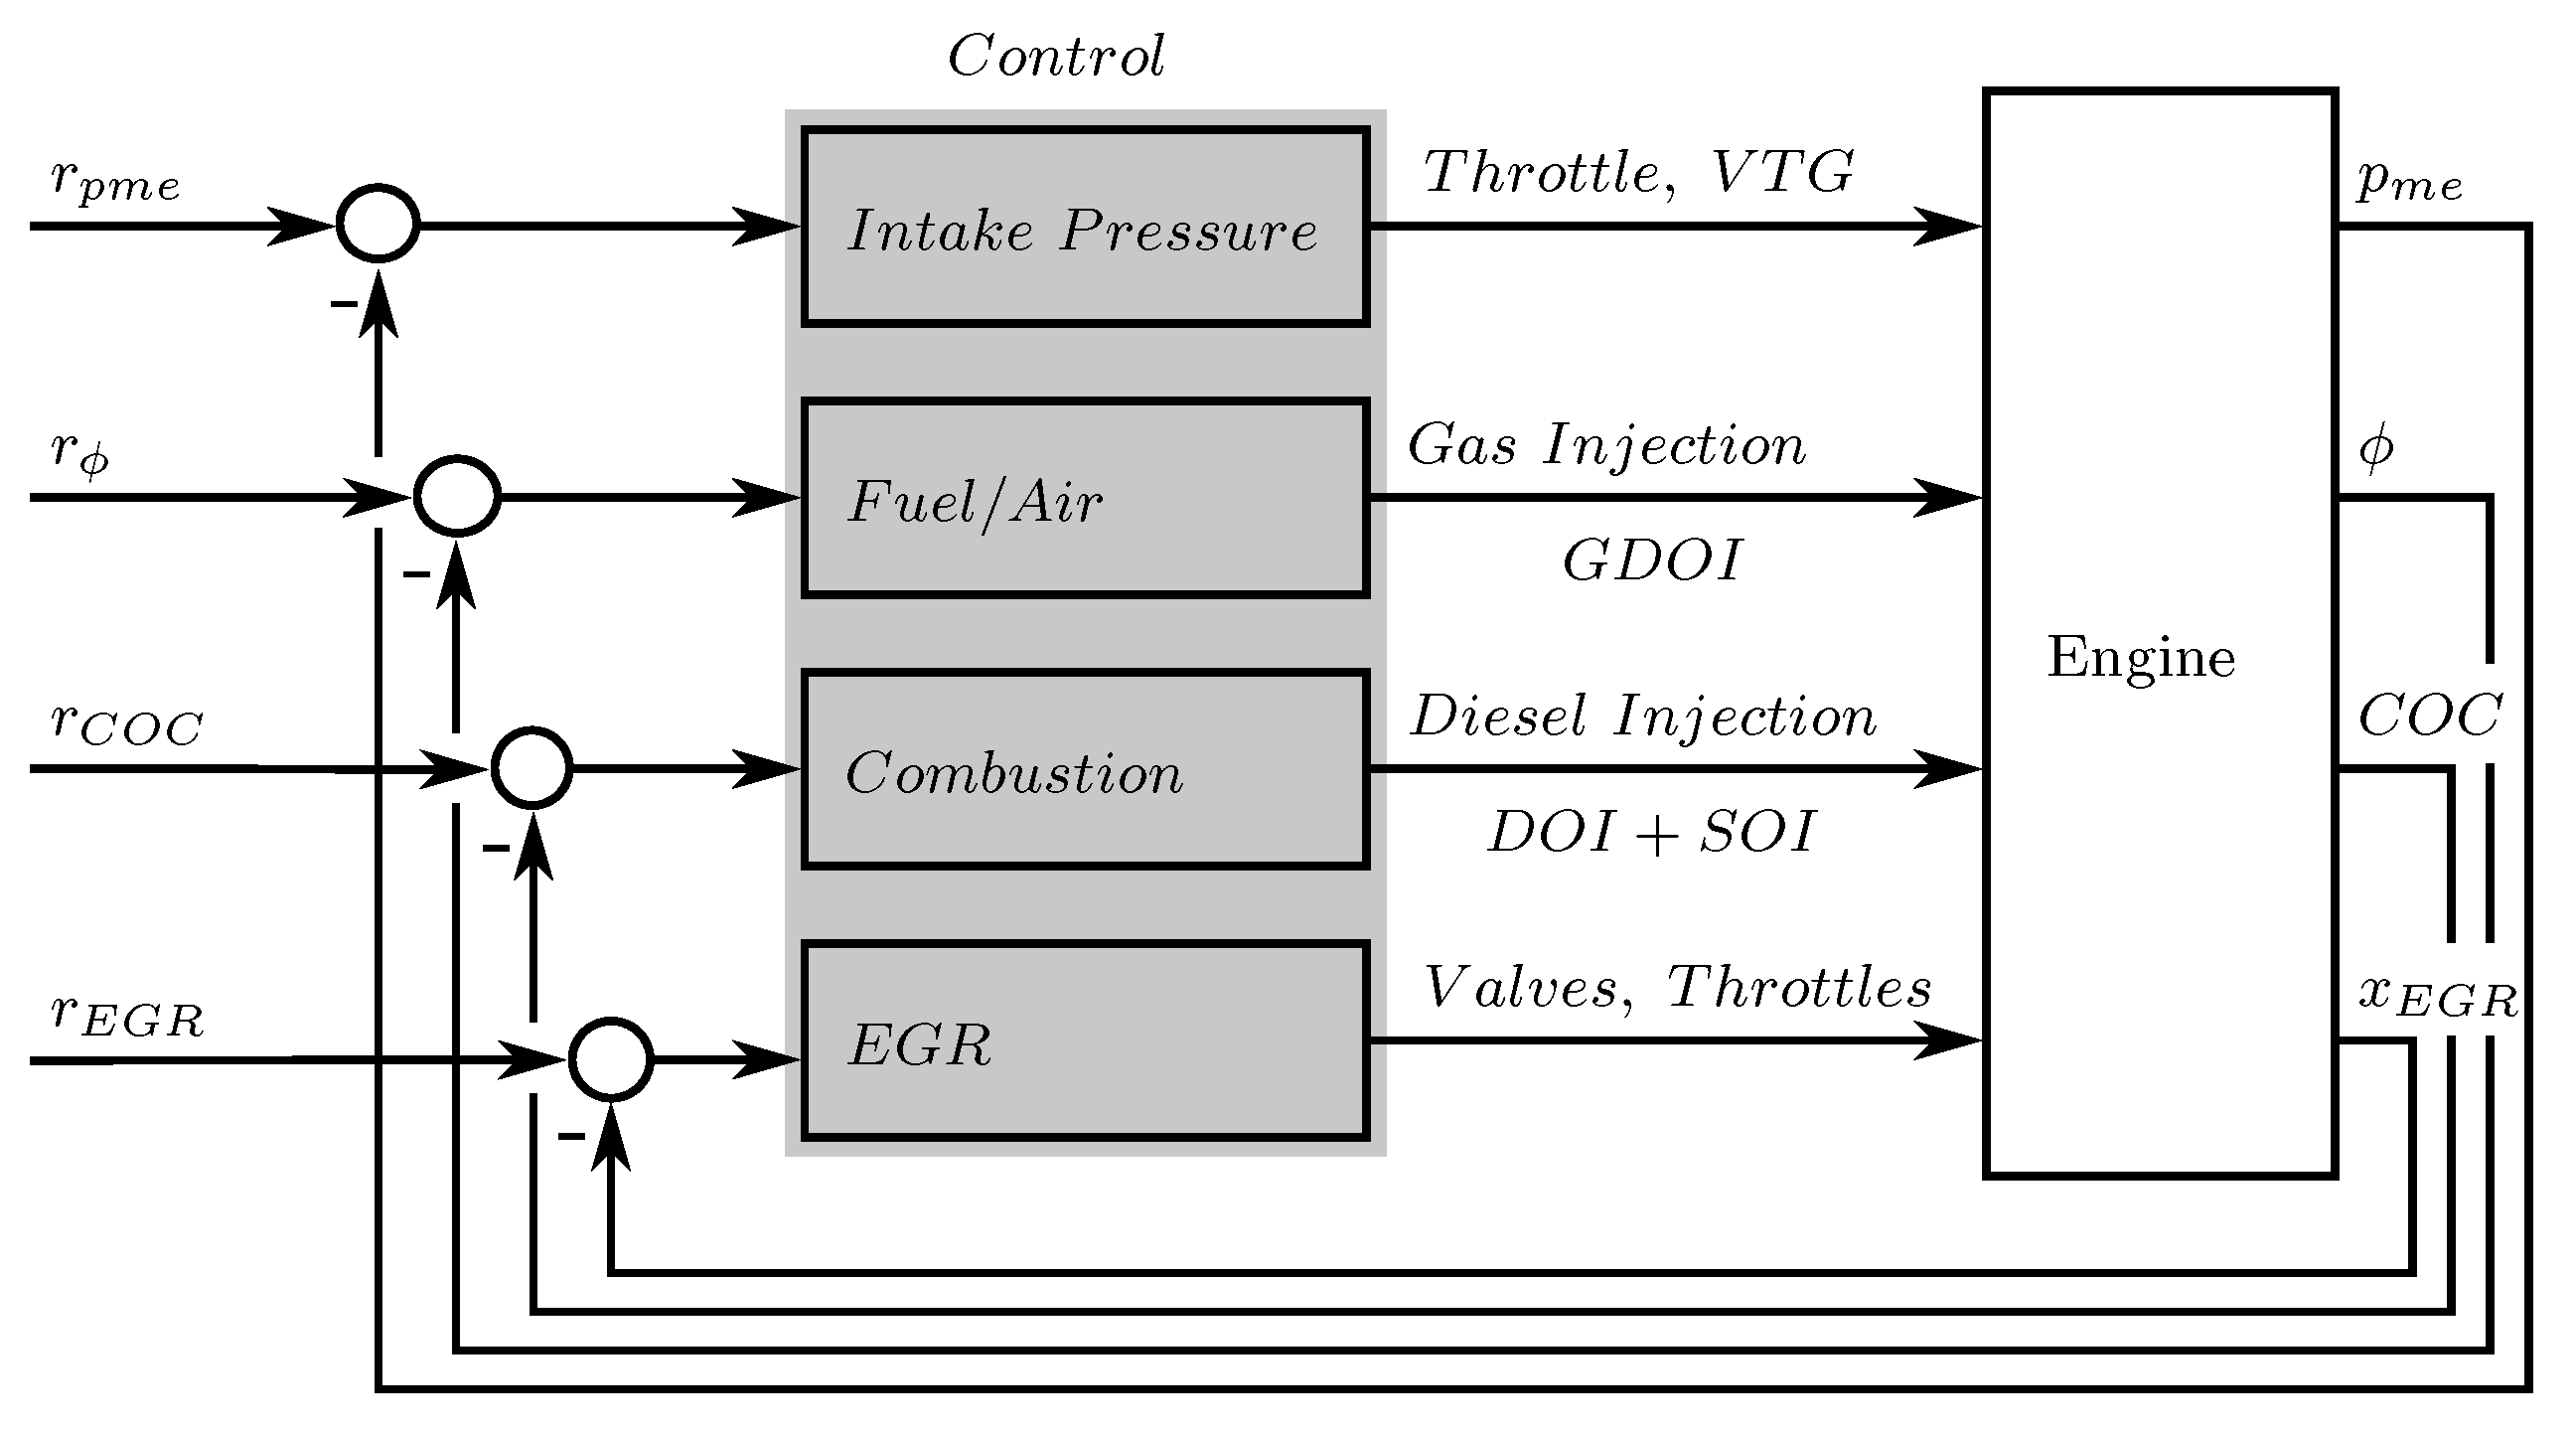
Since only stationary measurements on the testbench are conducted for this article, the simple approach of using multiple feedback control loops that are time-scale-separated is sufficient. Figure 2 shows an overview of the control system. In order to control the torque output of the Diesel-ignited gas engine a “quantity control” approach was chosen. The brake mean effective pressure is thus controlled by adapting the intake manifold pressure using a throttle or the position of the guide vanes of the variable turbine, respectively. The fuel-to-air controller adjusts the amount of gas injected into the intake ports, i.e., the gas duration of injection (GDOI), in order to reach the desired fuel-to-air equivalence ratio. Since the start of gas injection has little influence on the performance of the engine it is not considered here. In contrast to conventional Diesel engines, the amount of Diesel injected does not directly define the mechanical power output of the engine. The duration of injection (DOI) is used to set the combustion phasing, or more precisely, the center of combustion COC. The second injection parameter, namely the start of injection (SOI), is the additional degree of freedom in the fuel injection that can be used for optimization purposes. Finally, the fourth control loop acts on dedicated valves in order to control the amount of exhaust gas recirculated to the intake manifold.
3.3. Independent Variables
Table 3 shows all five relevant independent variables of the system. In this study, only three of them are considered as degrees of freedom (DOF). The effect of these three variables on the low-load capability of the Diesel-ignited gas engine is part of the main investigation of this study. The engine speed is not considered as an independent variable in this study. The results are found not to be sensitive on engine speed for the moderate speeds of between 1200 and . The center of combustion is held constant throughout all measurements while the start of injection is adapted such that the Diesel usage is minimized. This so-called Diesel-minimal operation was introduced earlier [32]. It leads to a CO-to-HC optimal operation as outlined in Appendix B.
The COC is very sensitive to any changes in SOI. Nevertheless, the COC can be considered an independent variable as the duration of injection DOI is used for its control. The requirement imposed is that changes in the SOI have to be much slower than the COC control loop changes the DOI.
4. Modeling
This section presents a model describing the low-load operation regime of a Diesel-ignited gas engine under the following restrictions:
- The Diesel injection is chosen according to the Diesel-minimal approach [32].
- The exhaust-gas recirculation is of the type “high pressure” and “non-cooled”.
- The rotational speed of the engine is moderate, i.e., it does not exceed .
The engine model facilitates the multidimensional optimization as the required number of measurements is reduced in comparison to the pure empirical approach. In addition, the model is expandable with additional input variables and simplifies the application to alternative engines.
The model combines empirically determined relations with physically modeled subsystems. It reproduces the engine’s dual-fuel performance under steady-state conditions. The structure of the model is special in that it incorporates knowledge about the engine performance in the base Diesel configuration, i.e., the operation using only Diesel, the way the engine was operated before the dual-fuel capability was added. The model input and output variables are given in Table 4 and Table 5.
In addition, Table 6 shows some of the engine variables modeled.
The model is solved numerically with the initial conditions derived directly from the base Diesel operation.
The initial conditions for the gas mass and Diesel mass are derived based on the assumption that the same energy is introduced through the gas in the dual-fuel mode as through the Diesel in the base Diesel engine. Starting from these initial conditions, the values calculated converge to the values measured in dual-fuel operation.
4.1. Model Structure
The structure of the model with all the main components is shown in Figure 3.
4.2. Model Components
All model components depicted in Figure 3 are described in detail in the following subsections.
4.2.1. Base Diesel
This part of the model describes the performance of the base Diesel engine, i.e., the engine configuration with the same displacement volume operated with Diesel only. Using the Willans approach [33], the Diesel fuel mass injected per cycle , with lower heating value , is related to the brake mean effective pressure using an affine function:
The parameter incorporates the friction and gas exchange losses, while e is a measure for thermal efficiency.
4.2.2. Diesel Injection
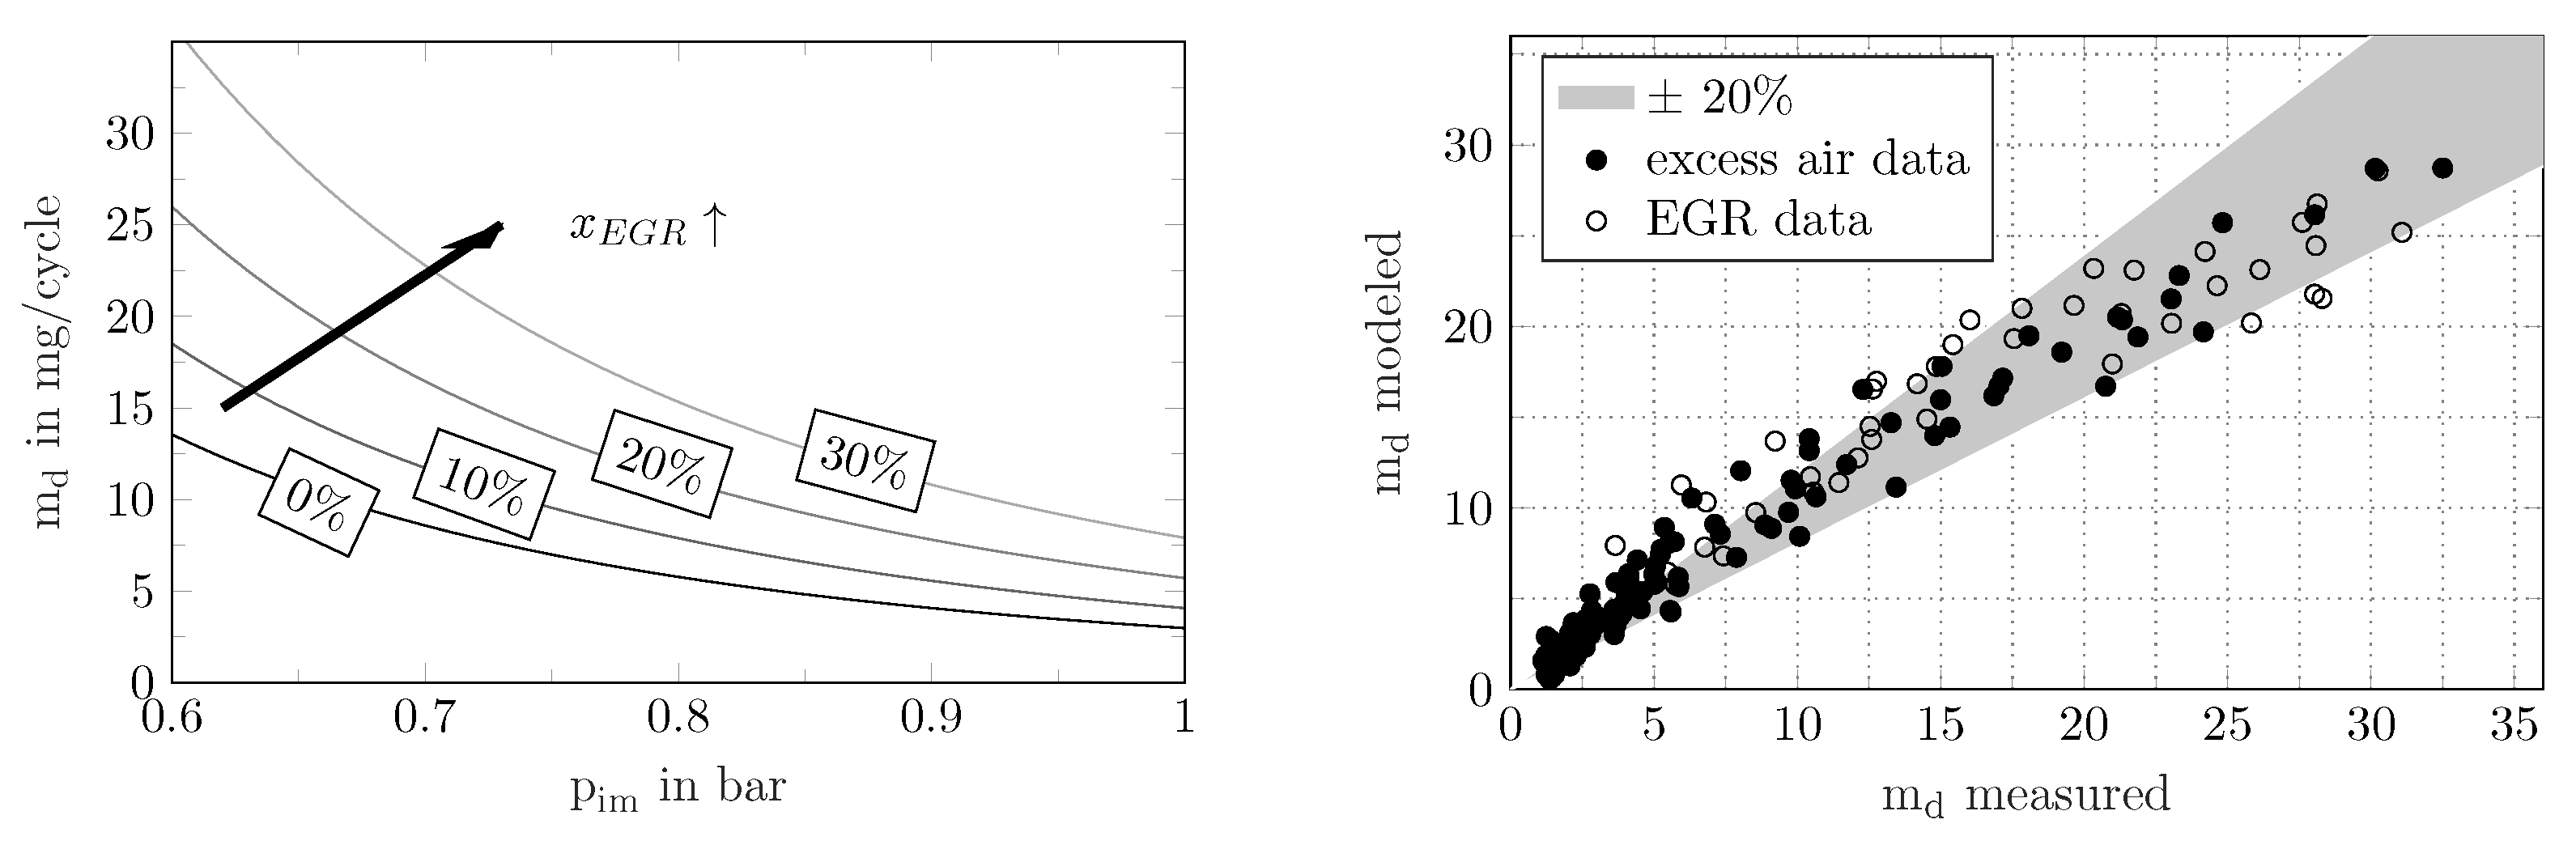
In contrast to the “base Diesel”, the model part denoted with “Diesel injection” defines the Diesel pilot mass injected during an engine cycle in dual-fuel operation. In general, the Diesel mass used in dual-fuel operation is much smaller than the Diesel mass injected in the base Diesel configuration. Of course, the amount of Diesel that is injected for ignition depends on the Diesel injection strategy chosen. As mentioned above, the Diesel injection is set according the Diesel-minimal control approach. The Diesel mass injected therefore corresponds to the minimal Diesel mass required for the desired ignition. It was found that can be modeled in dependency of the intake pressure , the gas equivalence ratio , and the EGR rate . The term approximates the pressure inside the cylinder after the mixture is compressed.
4.2.3. Gas Injection
A key assumption of this model is that the chemical energy introduced to the system in dual-fuel operation equals the chemical energy required in the base Diesel configuration plus the energy required to overcome the additional pumping losses due to intake throttling. In other words, the mean effective fuel pressure of the gas is calculated with the mean effective fuel pressure of the base Diesel and the Diesel injection , the mean effective pump pressure , and the overall engine efficiency as follows:
Finally, Equation (6) is converted into an explicit expression for the gas mass :
4.2.4. Air Path
Fuel-to-Air Equivalence Ratio
Calculating the accurate value of the fuel-to-air equivalence ratio is not trivial when EGR is applied to an engine running under lean conditions [34]. Oxygen is introduced to the intake of the engine from both the fresh air path and the EGR path. Since the nitrogen-to-oxygen ratio is not the same in the exhaust and in fresh air, it helps to define the equivalence ratio in terms of oxygen instead of air. The equivalence ratio is defined as the ratio of the oxygen mass required for stoichiometric combustion in respect to the available oxygen mass .
Since there are two fuels used in a dual-fuel engine with different stoichiometric fuel-to-air ratios and , the equivalence ratio is dependent on both fuel massflows. The equivalence ratio thus can be expressed as a function of the molar exhaust oxygen concentration , the EGR rate , the Diesel massflow , and the gas massflow , i.e.,
The derivation of is shown in Appendix A. The molar exhaust oxygen concentration is defined as the amount of oxygen constituent divided by the total amount of all constituents in the exhaust gas :
In the following, in order to improve readability, all properties are derived in dependency of rather than of the equivalence ratio .
Massflows
The calculations of the fresh air mass inducted through the air filter, the recirculated exhaust gas mass , as well as the exhaust gas mass flowing from the cylinders to the exhaust manifold, i.e., before turbine, are shown in the following:
Gas Equivalence Ratio
A-dual-fuel specific quantity is the gas equivalence ratio . This property describes the equivalence ratio of the charge mixture in the cylinder after the intake stroke and before Diesel is added. The value of thus is defined analogously to the total equivalence ratio (see Equation (8)), but it considers only the gas fuel:
Finally, the gas equivalence ratio can be expressed in dependency of the fresh air mass , the gas mass , the EGR rate , and the oxygen concentration in the exhaust gas :
Exhaust Temperature
The dilution has proven to be helpful when it comes to modeling the exhaust gas conditions. The dilution is a measure for the amount of excess air and recirculated exhaust gas that is present in the cylinder without participating in the combustion:
The exhaust temperature is approximated by considering the undiluted case (subscript ), i.e., the conditions where neither EGR nor excess air is present, and by then accounting for the effect of the dilution in terms of reduced heat losses in the wall of the cylinder. This correction of the undiluted exhaust gas temperature is a second-order polynomial function of with the parameters (see Figure 5 Left):
The undiluted exhaust gas temperature is given by
with the undiluted exhaust enthalpy , the heat capacity , and the massflow . Since the exhaust gas composition of methane combustion differs from the one resulting from diesel combustion, the heat capacity of the exhaust gas in a dual-fuel engine depends on the methane-to-diesel ratio used. In general, the exhaust gas that originates from the methane combustion contains more HO and shows a higher heat capacity. In addition, the heat capacity increases with the exhaust gas temperature. The precise heat capacities are calculated using the known constituent properties, as provided for example by Moran and Shapiro [35] for both Diesel and gas. For the temperature range of interest, the exhaust gas heat capacities of methane and Diesel each are well approximated by the affine functions given in Equations (19) and (20):
The parameters and are given in Table 7. The final heat capacity for the undiluted exhaust gas is approximated by weighting these “raw” exhaust heat capacities by the fuel ratio (see Figure 5 Right):
Applying the definitions in (19)–(21) on Equation (18) leads to a closed-form expression for the undiluted exhaust gas temperature (see Appendix A.2).
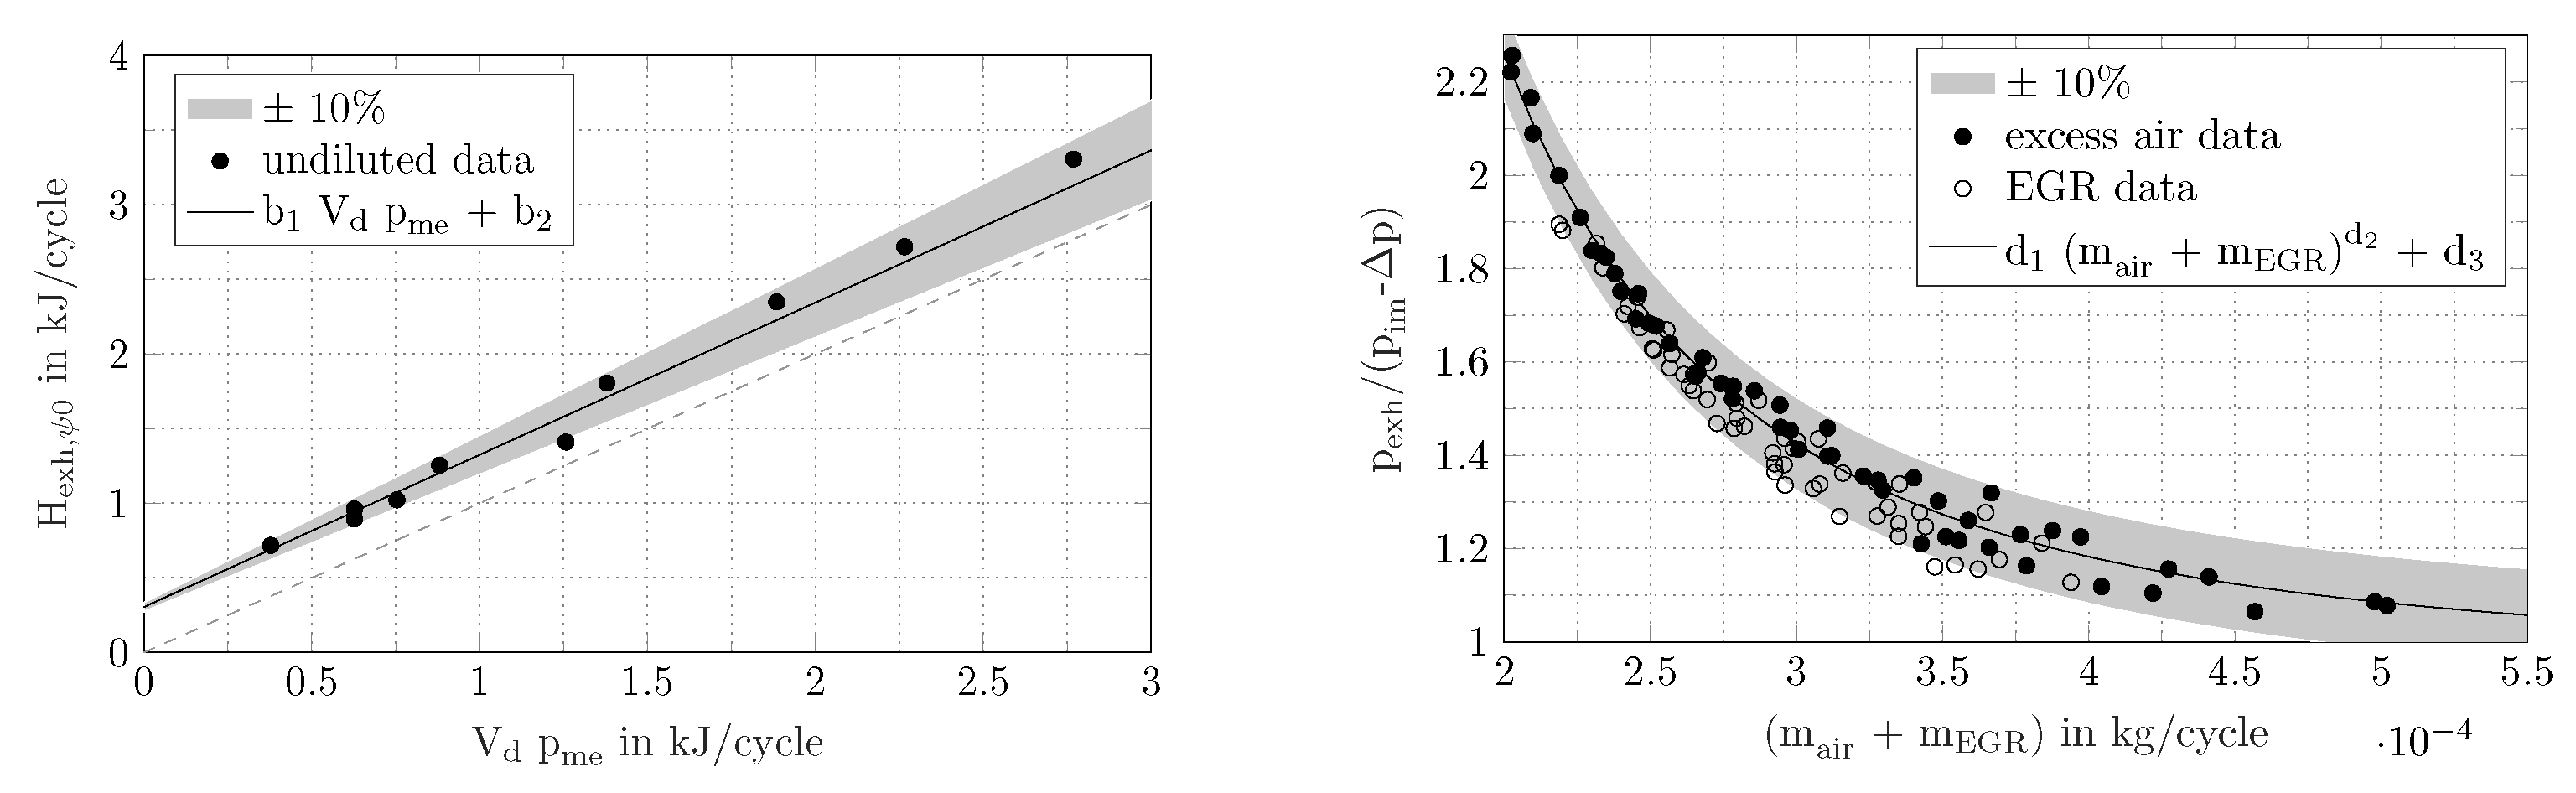
The undiluted exhaust enthalpy is approximated by an affine function of with the empirical parameters and (see Equation (22)). The measured enthalpy shown in Figure 6 Left appears to have a similar slope () as the mechanical energy output per cycle, i.e., . In other words, with an undiluted mixture, the exhaust enthalpy equals the mechanical energy output plus a constant . The undiluted massflow is calculated with the fuel-specific stoichiometric air-to-fuel ratios and :
The actual value of the exhaust gas heat capacity differs from the undiluted capacity (Equation (21)) once the exhaust gas is diluted by excess air. For the diluted case, is calculated by weighting the capacities and with the ratio of the exhaust mass under stoichiometric condition (Equation (23)) and the excess air mass :
Analogously to Equations (19) and (20), the value of is approximated by the affine function .
Exhaust Pressure
The exhaust pressure is correlated with Equation (25) to the intake pressure via the massflow over the intake valves, which is . Figure 6 Right shows this relation, with both measurements using excess air and EGR:
Besides the empirical parameters , there is a physical pressure compensation term that accounts for the rise in intake pressure resulting from the rise in temperature due to the use of non-cooled EGR (see Equation (26)). In order to model this relation with a purely physical model, knowledge about the turbocharger characteristic would be needed.
Intake Conditions
The EGR temperature is calculated by assuming a simple heat transfer from the hot EGR pipes to the ambient air with temperature . The empirical heat transfer coefficient identified is denoted as . Reforming the enthalpy balance over the EGR piping yields
The flow into the intake manifold consists of hot recirculated exhaust gas with the temperature and fresh air with the temperature . The intake temperature is calculated as a combination of these two temperatures weighted by the corresponding massflows and heat capacities:
The intake manifold pressure is related to the air massflow through the volumetric efficiency . In addition to the definition known from [33], compensation terms account for any additional flows of gas and recirculated exhaust gas into the cylinders:
The pumping losses are characterized by the pump mean effective pressure , that is the pressure difference between intake and exhaust pressures:
4.2.5. Emission Levels of CO
The reduction of the amounts of CO emitted by the Diesel-ignited gas engine in comparison to the Diesel base engine is denoted by . This property is calculated using the fuel masses and the fuel constants and . Complete combustion of Diesel and gas is assumed, hence the emissions correspond to tailpipe CO emissions:
4.2.6. HC Emissions
The in-cylinder gas conversion efficiency shown in Equation (32) describes how well the gas fuel injected is converted to CO and water during combustion. The gas conversion efficiency features a significant dependency on the gas equivalence ratio . This property leads to the model approach shown in Equation (33). A more in-depth analysis of the gas conversion efficiency is presented in the next section.
4.3. Model Parameters
5. Discussion
The purpose of this section is to present the key findings from the modeling process that help to understand the physical reasons for low-load limitations. The model presented previously has three input variables, namely , , and . In the vehicle application, the first input cannot be chosen freely, but is given by the car’s driver. Its sensitivity thus is not of interest. The following discussion consists of two parts. The first part focuses on the effect of the equivalence ratio on the low-load limit. The investigation thus is based on an operation using only throttling and no EGR. The sensitivity of EGR is then investigated in the second part.
5.1. Low-Load Limits with Intake Throttling
The comparison of the modeled and the measured throttled operation shown in Figure 7 demonstrates that the model derived in Section 4 is capable of reproducing the main trends of all three properties defined as criteria. Information on measurement uncertainties are provided in Table A4.
In general, the CO emissions of a Diesel-ignited gas engine can be significantly lower than those of the base Diesel engine due to the lower carbon content of methane. However, at low loads this advantage is less pronounced since the engine efficiency in the dual-fuel mode is decreased. Below a certain load any advantage of the dual-fuel mode disappears, i.e., (Figure 7 Left). The more excess air the mixture contains (i.e., the lower the equivalence ratio), the better the CO reduction potential for a certain load becomes. However, under lean, low-load operation the engine suffers from high unburnt hydrocarbon emissions (Figure 7 Center). In general, the HC emission deteriorates as the fuel-to-air mixture becomes leaner or the load becomes smaller. Similar trends are observed for the exhaust gas temperature shown in Figure 7 Right. For a small equivalence ratio and a low load the exhaust gas temperature is significantly reduced. This in turn leads to a reduced catalyst conversion efficiency and therefore further increases the tailpipe HC emission. In summary, there exists an HC-to-CO emission tradeoff. Improving HC emission by increasing the fuel-to-air equivalence ratio using throttling generally leads to a reduced CO reduction. The low-load limitations introduced by the two criteria and are discussed in further detail in the following two subsections.
5.1.1. Unburnt Hydrocarbon (HC) Limit
A measure for the quality of the in-cylinder gas conversion is given by the in-cylinder gas conversion efficiency . This quantity sets measured engine-out HC emission in relation to the injected gas mass . The full amount of HC emission is assumed to originate from the incomplete combustion of methane, while the Diesel combustion is assumed to be complete.
The in-cylinder conversion efficiency of the methane fuel is closely linked to the gas equivalence ratio as described by [5,20]. The in-cylinder methane conversion efficiency is strictly increasing with the gas equivalence ratio. The leaner the gas-air mixture in the cylinder, the less methane is converted in the cylinder. This effect can be related to the decreasing laminar flame speed when the amount of excess air in the methane-air mixture is raised [36]. Figure 8 Left shows the results of various measurements conducted at various values of load, speed, and equivalence ratio, as outlined in Appendix D. The conversion efficiency is dependent on the geometry of the piston bowl and the combustion chamber in general. The presented absolute values of thus are specific for the used hardware setup and are likely to differ for other engine designs.
Increasing the gas equivalence ratio clearly leads to an improvement of the methane conversion. One way to increase the gas equivalence ratio is to raise the total equivalence ratio by throttling the airflow into the intake manifold, i.e., by lowering the intake manifold pressure. As the ignition characteristic is changed significantly when the intake manifold pressure is lowered, the Diesel injection timing and duration has to be adapted in order to maintain the desired combustion phasing while minimizing the consumption of Diesel. As a consequence of the change in the amount of Diesel injected, the gas injected has to be adapted as well in order to maintain the same load.
The technique of throttling, however, is only effective if the increase in the total equivalence ratio leads to an increase in the gas equivalence ratio . Under high-load operation (approximately ) this is the case, while for throttled low-load operation this condition is not fulfilled. As a consequence of the impaired Diesel ignition at lower intake pressure, significantly more Diesel fuel has to be injected in order to assure a proper ignition. In other words, the ignition delay rises disproportionally to the decrease in intake manifold pressure. Since the higher amount of Diesel requires more air for combustion, the resulting gas equivalence ratio is not increased. Figure 8 Right shows that below approximately 4 bar brake mean effective pressure , the gas equivalence ratio is independent of the total equivalence ratio . In conclusion, below a certain load, the technique of throttling cannot raise the gas equivalence ratio .
In summary, the circumstance of the gas conversion efficiency being impaired at low load regardless of the fuel-to-air ratio applied can be explained by two properties: First, the gas conversion efficiency is a monotonic rising function of the gas equivalence ratio and second, the gas equivalence ratio cannot be raised by throttling once the load has fallen below a certain value.
5.1.2. Limit of CO Reduction
The second important low-load criterion beside the HC emissions is the CO reduction . The criterion imposes the load limit below which the CO advantage originating from the substitution of Diesel by gas is compensated by the lower engine efficiency. This fact thus introduces a boundary on the engine torque below which a dual-fuel operation does not lead to lower CO emissions than those of the Diesel-only operation. The fact that the CO emissions are reproduced well by the model leads to the conclusion that the key model assumption of Equation (7) is justified. This assumption relates the energy introduced in the gas fuel to the fuel energy in the base Diesel configuration while accounting for additional pumping losses.
5.2. Low-Load Limits with EGR
The capability of EGR to lower the amount of NOx emitted by decreasing the peak temperature of the combustion is well known. EGR is a widely used technique to comply with NOx emission limits in lean-operated engines such as conventional Diesel engines. The application of EGR in a Diesel-ignited gas engine is also described in literature [18,19,37]. According to Ogawa et al., EGR reduces NOx without increasing HC and CO emissions [5]. However, the effect of EGR on the HC-to-CO tradeoff at low load has been investigated only in part.
For the investigation with EGR this study uses non-cooled high-pressure EGR only. The increased intake temperature is expected to have a positive effect on the Diesel ignition process as the pressure and temperature after compression are higher than in the case of cooled EGR. In addition, the laminar flame speed is presumably improved with higher intake temperatures [36]. Figure 9 shows the HC-to-CO tradeoff that is encountered during a sweep of the equivalence ratio.
The sweeps with EGR result in trade-off curves that are very similar to the one achieved without EGR. Thus, EGR does not improve the low-load limit in terms of HC or CO. The additional inert mass introduced by the EGR leads to a lower combustion temperature and thus also to a lower exhaust gas temperature . Nevertheless, there are still good reasons for applying EGR. On the one hand, EGR effectively lowers the amount of NOx emitted, while on the other hand, EGR can improve the efficiency of an engine. The measurement data shown in Figure 10 support this statement. The abating effect of EGR on NOx is based on the lowered local peak temperature of the combustion. The increase in engine efficiency is a result of the dethrottling effect of EGR, as the same amount of oxygen is introduced into the cylinder at a higher intake pressure, which results in lower pumping losses. Two operating points with different levels of mechanical efficiency can therefore cause the same amounts of CO emitted.
In summary, the application of EGR at low-load conditions lowers the exhaust gas temperature and improves the engine efficiency and the NOx emissions while it does not significantly affect the HC-to-CO tradeoff.
6. Results
The presentation of the results of the simulations in this section is arranged in two subsections. First, the feasible region given by the three low-load criteria considered is investigated and the global low-load limit is presented. The subsequent subsection introduces three optimal low-load strategies.
6.1. Feasible Operation
The operation of the engine using a specific set of inputs is considered feasible if all given criteria are met. The three criteria investigated in the context of this study (, , ) have been introduced in Section 2. They are modeled as a function of the three input variables , , and with the model introduced in Section 4.
In a first step the criterion-specific feasible sets , and are introduced. These sets are defined for loads below brake mean effective pressure, i.e., , lean and stoichiometric operation, i.e., , and EGR rates of up to , i.e., .
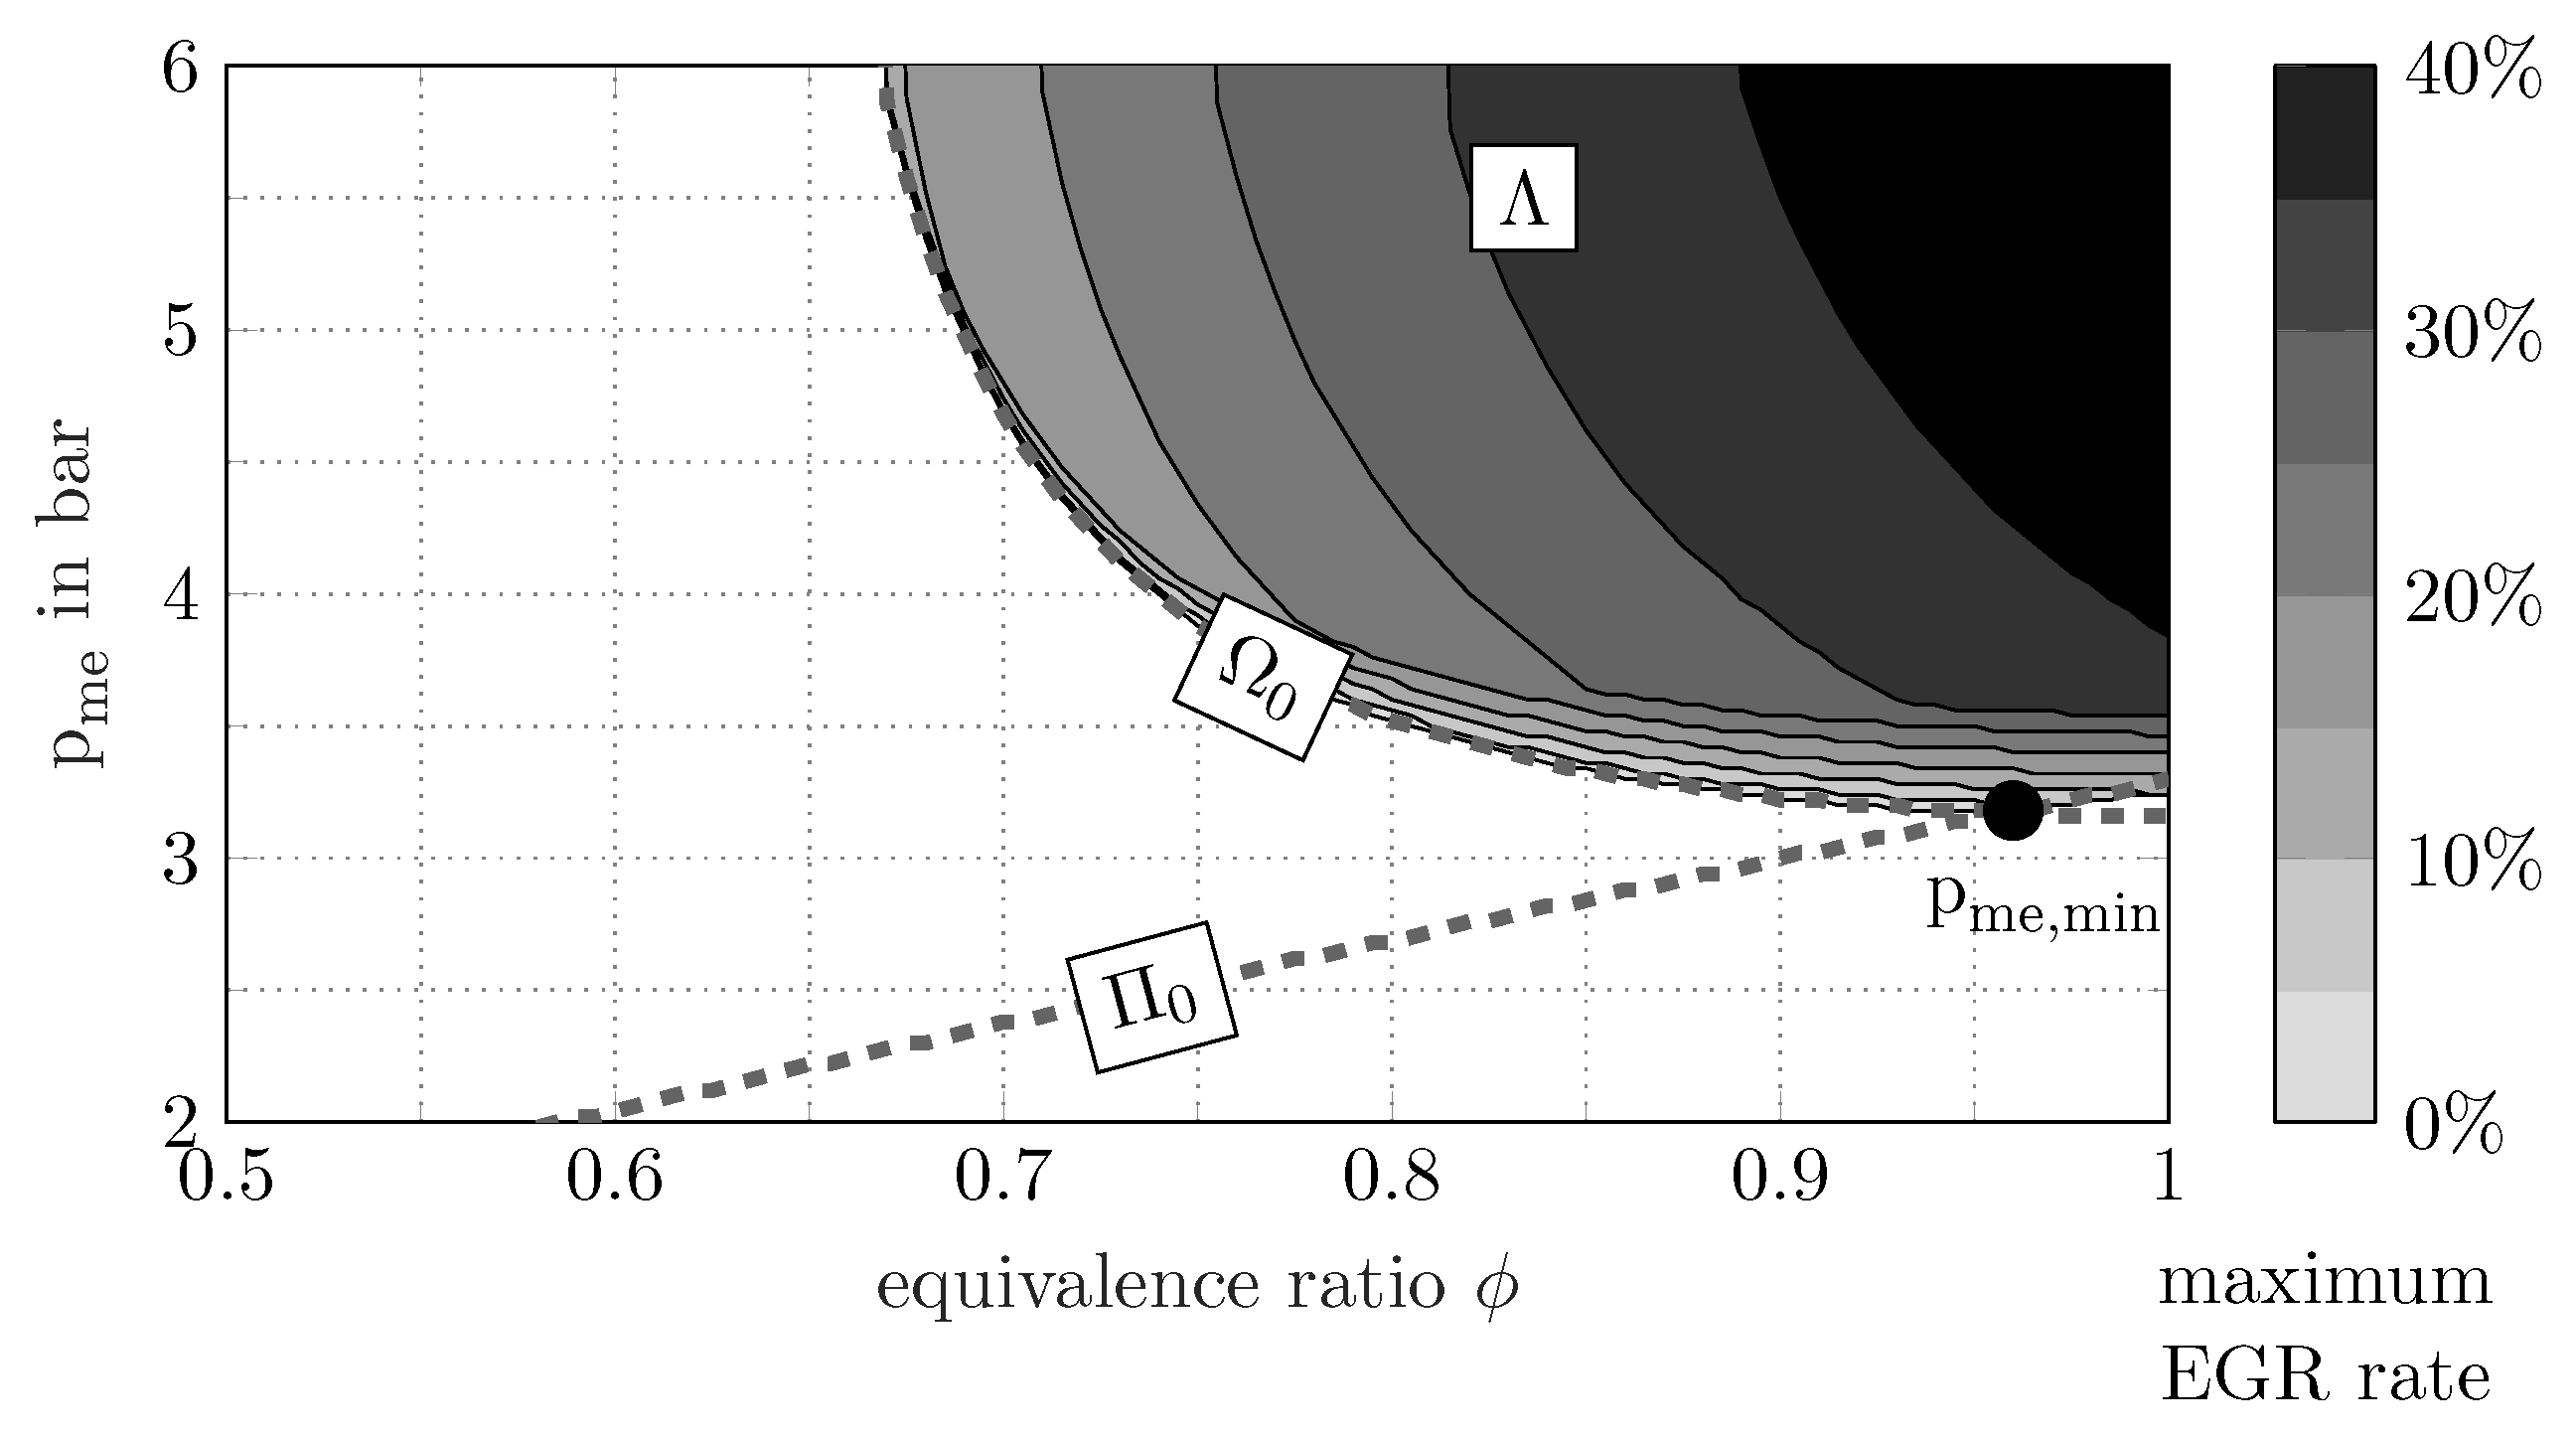
Figure 11 shows the sets , , and defined by Equations (38)–(40) which limit the operating range of the engine. The results were obtained using simulations of the model presented in Section 4. Ranges of infeasible operation are represented by the white areas. Both the minimal (top row) and the maximum EGR rate (bottom row) are shown in dependency of and . For any combination of and only EGR rates lying between the minimal and the maximum EGR rate lead to a feasible operation. The sets and are spanned by (almost) the entire EGR range, i.e., the minimum EGR rate is and the maximum EGR rate is for most combinations of and inside the sets. The sets and thus are almost independent of the EGR rate. In contrast, the third set is highly sensitive to changes in the EGR rate. In order to guarantee a feasible operation, i.e., exhaust gas temperatures above C, the (maximum) EGR rate has to be limited. For example, at the boundary of at and there exists only a feasible solution when , the minimal and the maximum EGR rates thus are both . For leaner conditions at the same load no input combination is feasible, i.e., there is neither a minimal nor a maximum EGR rate defined for this operation regime. By increasing the equivalence ratio the maximum EGR rate rises in a monotonic manner. At the set is spanned by the minimum EGR rate of and the maximum EGR rate of . Any EGR rate between and leads to a feasible solution. At the maximum EGR rate is .
Finally, the globally feasible set describes the set of all input variables that satisfies all three criteria simultaneously. The set is defined as the intersection of the sets shown previously.
Figure 12 shows a visualization of the globally feasible set . The maximum EGR rate is depicted, while the white area represents the globally infeasible range of operation. Furthermore, the boundaries of the sets and at are also shown (denoted by , ).
The first thing to notice is that the globally feasible set is mainly limited by two of the three sets presented in Figure 11 ( and ). With the numeric values chosen for the criteria, the hydrocarbon set is almost entirely included in the CO reduction set . Only very close to stoichiometric conditions () does the requirement of a positive CO reduction () turn into the limiting factor. Figure 12 illustrates the conditions that lead to the minimum feasible load in dual-fuel mode, i.e., the global low-load limit. The low load limit results under the slightly lean conditions and without EGR . As a consequence, the operation has to be switched to Diesel-only whenever a load is required that is lower than .
Within the feasible space the engine can be operated with excess air, i.e., under lean conditions, down to an equivalence ratio of approximately at . The maximum applicable EGR rate is mainly limited by the minimum exhaust gas temperature. The higher the equivalence ratio is, the higher the maximum EGR rate becomes.
6.2. Optimal Strategies
Finally, three strategies minimizing different cost functions are derived. The resulting optimal input variables and are functions of the third input variable . The optimization problem is given in Expression (42) and is evaluated at each individual load .
The three strategies minimize the engine-out HC emissions, minimize the CO emissions, and maximize the total engine efficiency, respectively. The particular cost functions are listed in Table 10.
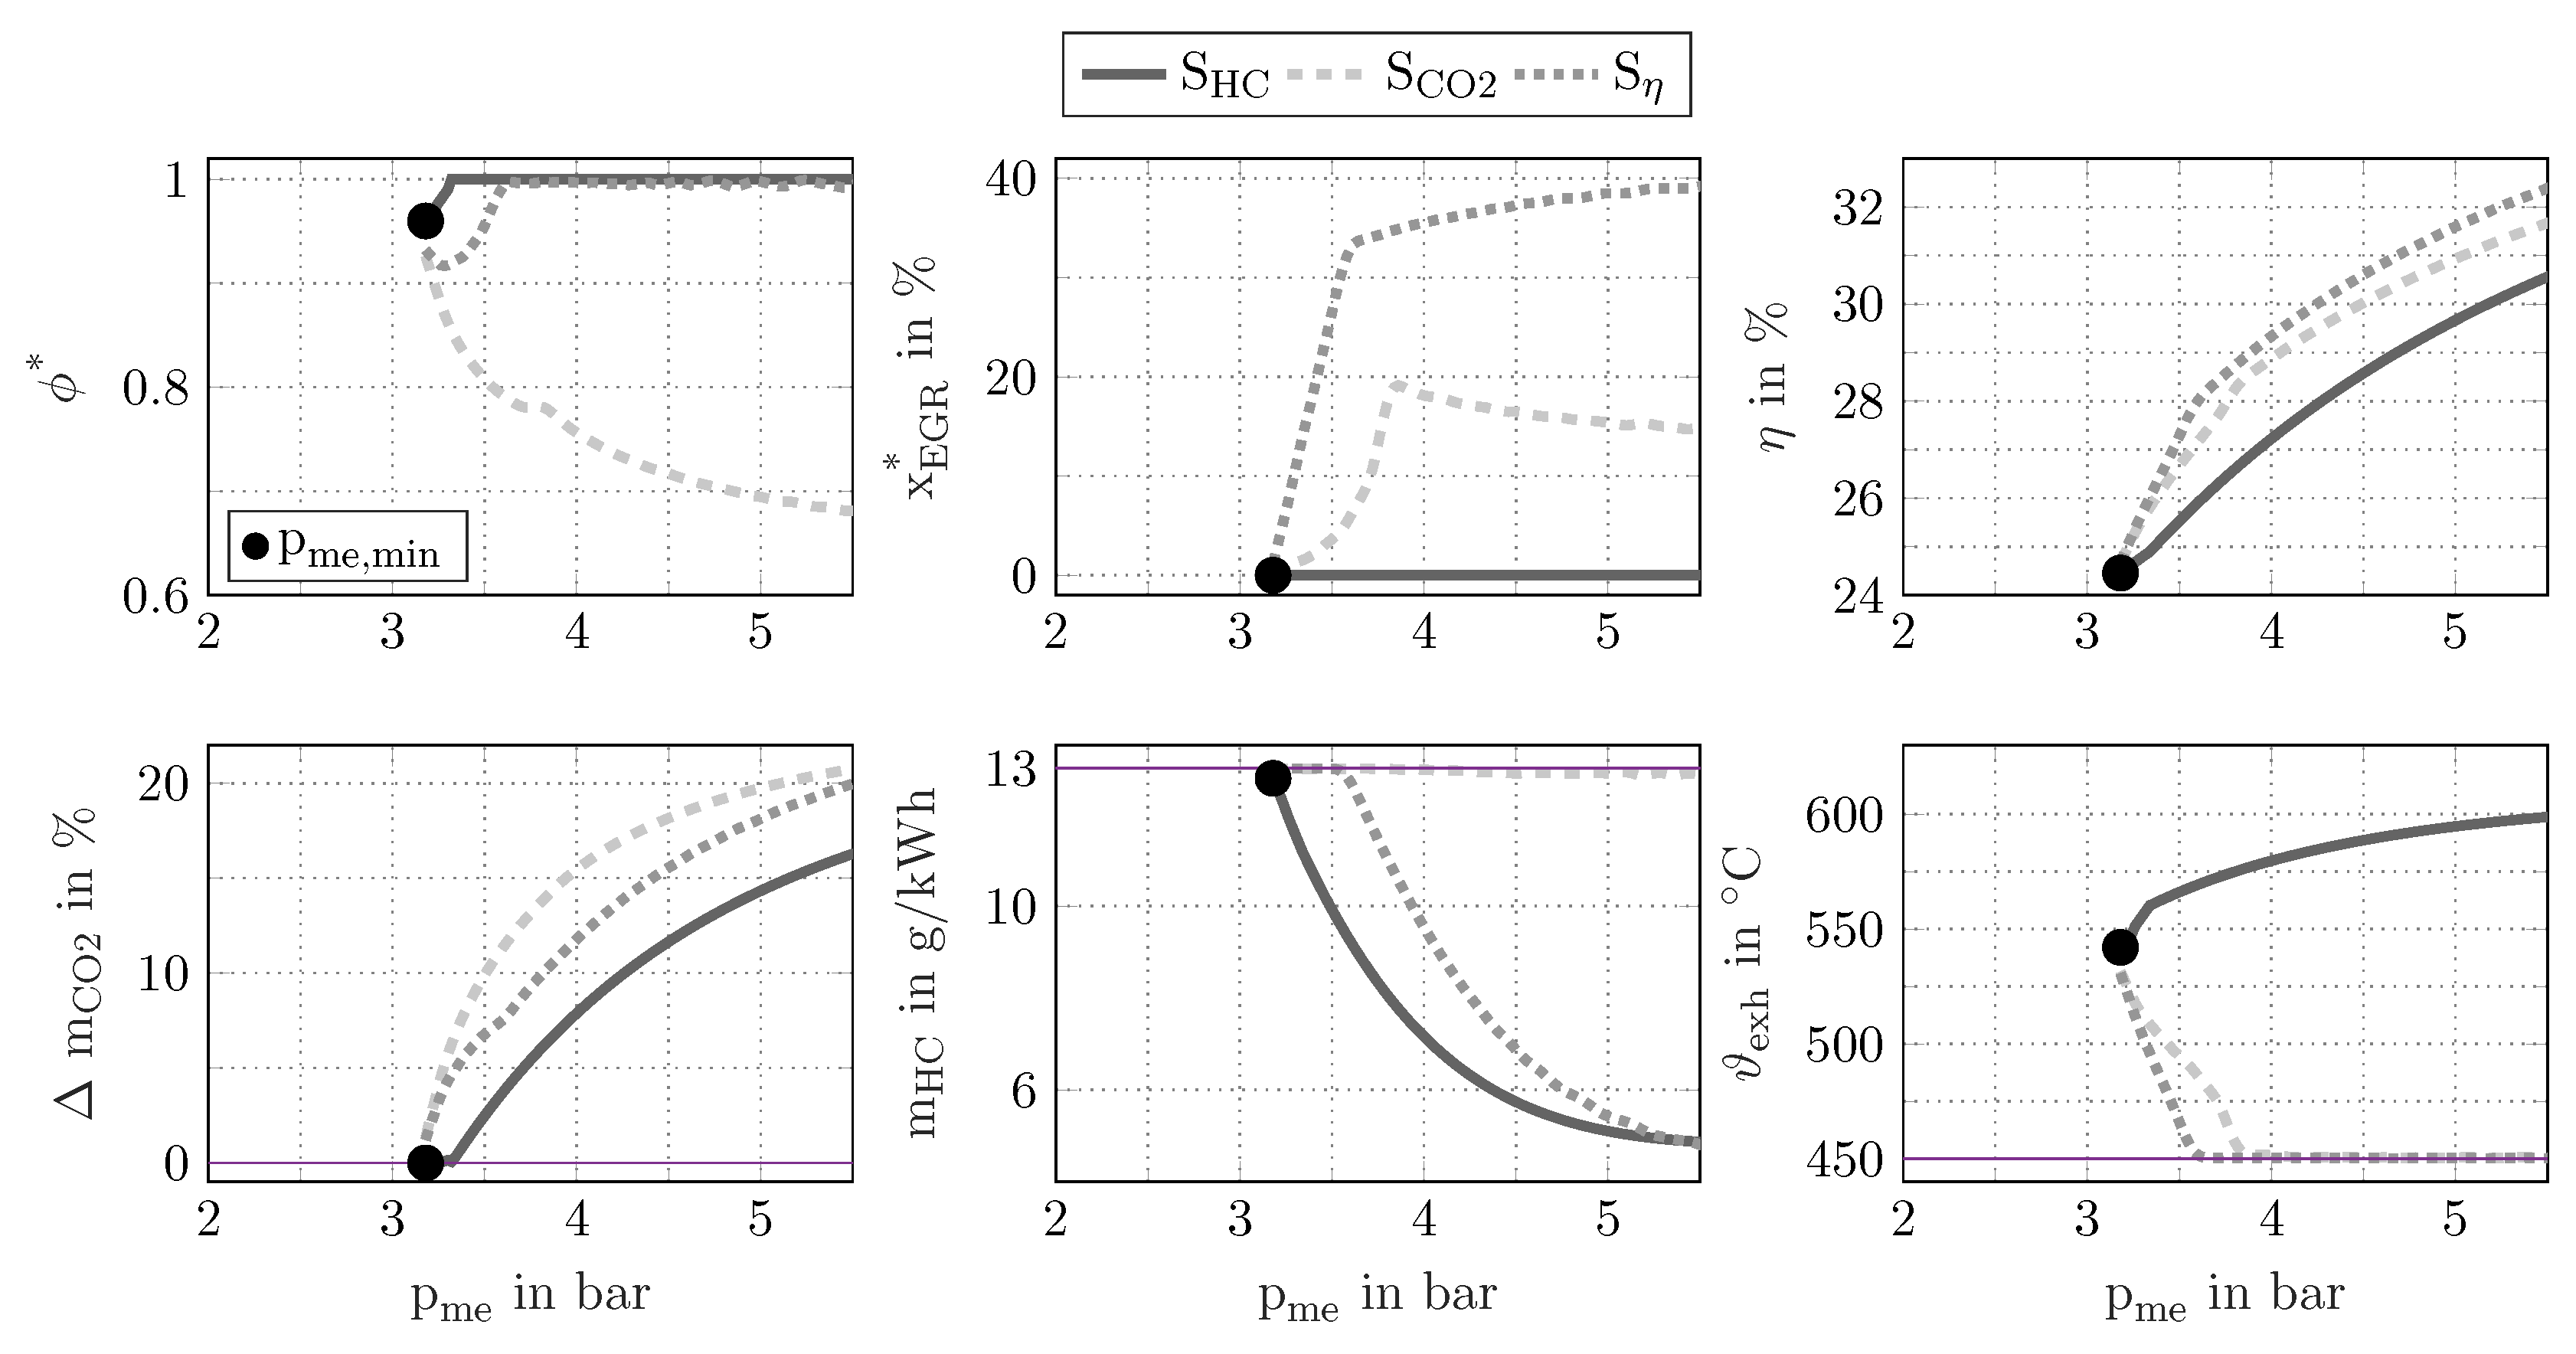
The strategy-specific input variables and as a function of the demanded value of as well as some illustrative properties are outlined in Figure 13.
For loads lower than the minimal load no optimal inputs can be found as at least one of the constraints is active. At only one feasible solution exists. Therefore, all strategies merge at . The CO-optimal strategy is the only strategy operating with a lean equivalence ratio, , exclusively. The excess air enables the highest substitution rates while the pumping losses are minimized. The efficiency-optimal strategy on the other hand minimizes pumping losses by stoichiometric combustion with a high EGR ratio . Stoichiometric combustion without EGR () minimizes the HC emissions while the exhaust gas temperature is maximized at the same time. In agreement with the HC-to-CO tradeoff presented previously this strategy leads to the highest CO emissions. Table 11 shows a very simplified view of the optimal input properties.
7. Conclusions
The Diesel-ignited gas engine is characterized by a tradeoff between HC and CO emissions. High HC emissions occur when the in-cylinder gas conversion efficiency is low due to a low gas equivalence ratio. High CO emissions, on the other hand, result when the energetic gas-to-Diesel ratio is shifted towards Diesel and when the engine efficiency drops due to additional pumping losses in throttled operation. At low engine loads the feasible operating region fulfilling both the HC- and the CO-limit becomes ever smaller until, at a low-load limit , the two conditions can no longer be fulfilled simultaneously and the engine operation mode needs to be switched to Diesel-only. For the engine used in this work, the low-load limit is .
Above the low-load limit the feasible operating region of the dual fuel mode is further limited by the minimum required exhaust temperature to guarantee sufficient HC oxidation by the exhaust aftertreatment system. As a result, the dilution of the charge mixture is limited. The leaner the equivalence ratio is chosen the lower the maximum applicable EGR rate is.
The derived engine model facilitates the derivation of optimal strategies for the dual-fuel regime. Three exemplary strategies were presented. The CO optimal strategy is characterized by lean mixtures and moderate EGR rates, the efficiency optimal strategy is characterized by stoichiometric mixtures and high EGR rates and the HC optimal strategy is characterized by stoichiometric mixtures without EGR. The CO optimal strategy and the efficiency optimal strategy do generally not coincide as they apply different energetic gas-Diesel ratios. There exists no single strategy that simultaneously minimizes CO and HC, while maximizing efficiency.
Outlook
In order to improve the informational value of the model further properties such as NOx emissions have to be introduced. This work has shown that the minimal load that is feasible in dual-fuel combustion mode is rather high, necessitating frequent switchings between Diesel-only and dual-fuel mode. To facilitate these switches precise and fast EGR and intake pressure loops need to be developed. In order to find strategies optimizing not only one single property, a new cost function should be introduced of the form of a weighted combination of the three cost functions shown.
Acknowledgments
The project has been funded by the Swiss Federal Office of Energy (BFE).
Author Contributions
All authors have contributed significantly to this work.
Conflicts of Interest
The authors declare no conflict of interest.
Abbreviations
The following abbreviations are used in this manuscript:
| SOI | Start of Injection (Diesel) |
| DOI | Duration of Injection (Diesel) |
| HC | Unburnt Hydrocarbons (Emissions) |
| NOx | Nitrogen Oxides (Emissions) |
| EGR | Exhaust Gas Recirculation |
Appendix A. Derivations
Appendix A.1. Air Mass and Equivalence Ratio
The derivations presented in this appendix are based on the relations (A1)–(A6). Equation (A1) shows the oxygen-based definition of the fuel-to-air equivalence ratio . It is the ratio between the demanded oxygen mass required for stoichiometric combustion and the available oxygen mass .
The oxygen mass terms , and are further related to the total masses via the corresponding oxygen concentrations as follows:
The oxygen concentration in the exhaust gas and the general EGR ratio are defined as:
By substituting Equations (A2)–(A4) into Equation (A5) and eliminating the dependency on EGR by applying Equation (A6), an explicit expression for the fresh air mass results. This relation is shown above in Equation (11). The fresh air mass is a function of the fuel masses , , and the oxygen concentration in the exhaust :
Solving the system of Equations (A1)–(A6) for the fuel-to-air equivalence ratio leads to the following explicit solution:
Equation (A8) implies a dependency of the equivalence ratio on the exhaust gas oxygen concentration , the EGR ratio , and the fuel masses and . In the case of a single-fuel engine the relation is simplified as the dependency on the fuel masses vanishes.
Appendix A.2. Temperature of Undiluted Exhaust Gas
Appendix B. Independent Variables
Appendix B.1. Center of Combustion (COC)
Figure A1 exemplarily shows the measured net heat release rates of an equivalence ratio sweep at a constant load. Even though the heat release curves differ in terms of peak heat-release and duration of combustion, the combustion phasing is the same for all measurements.
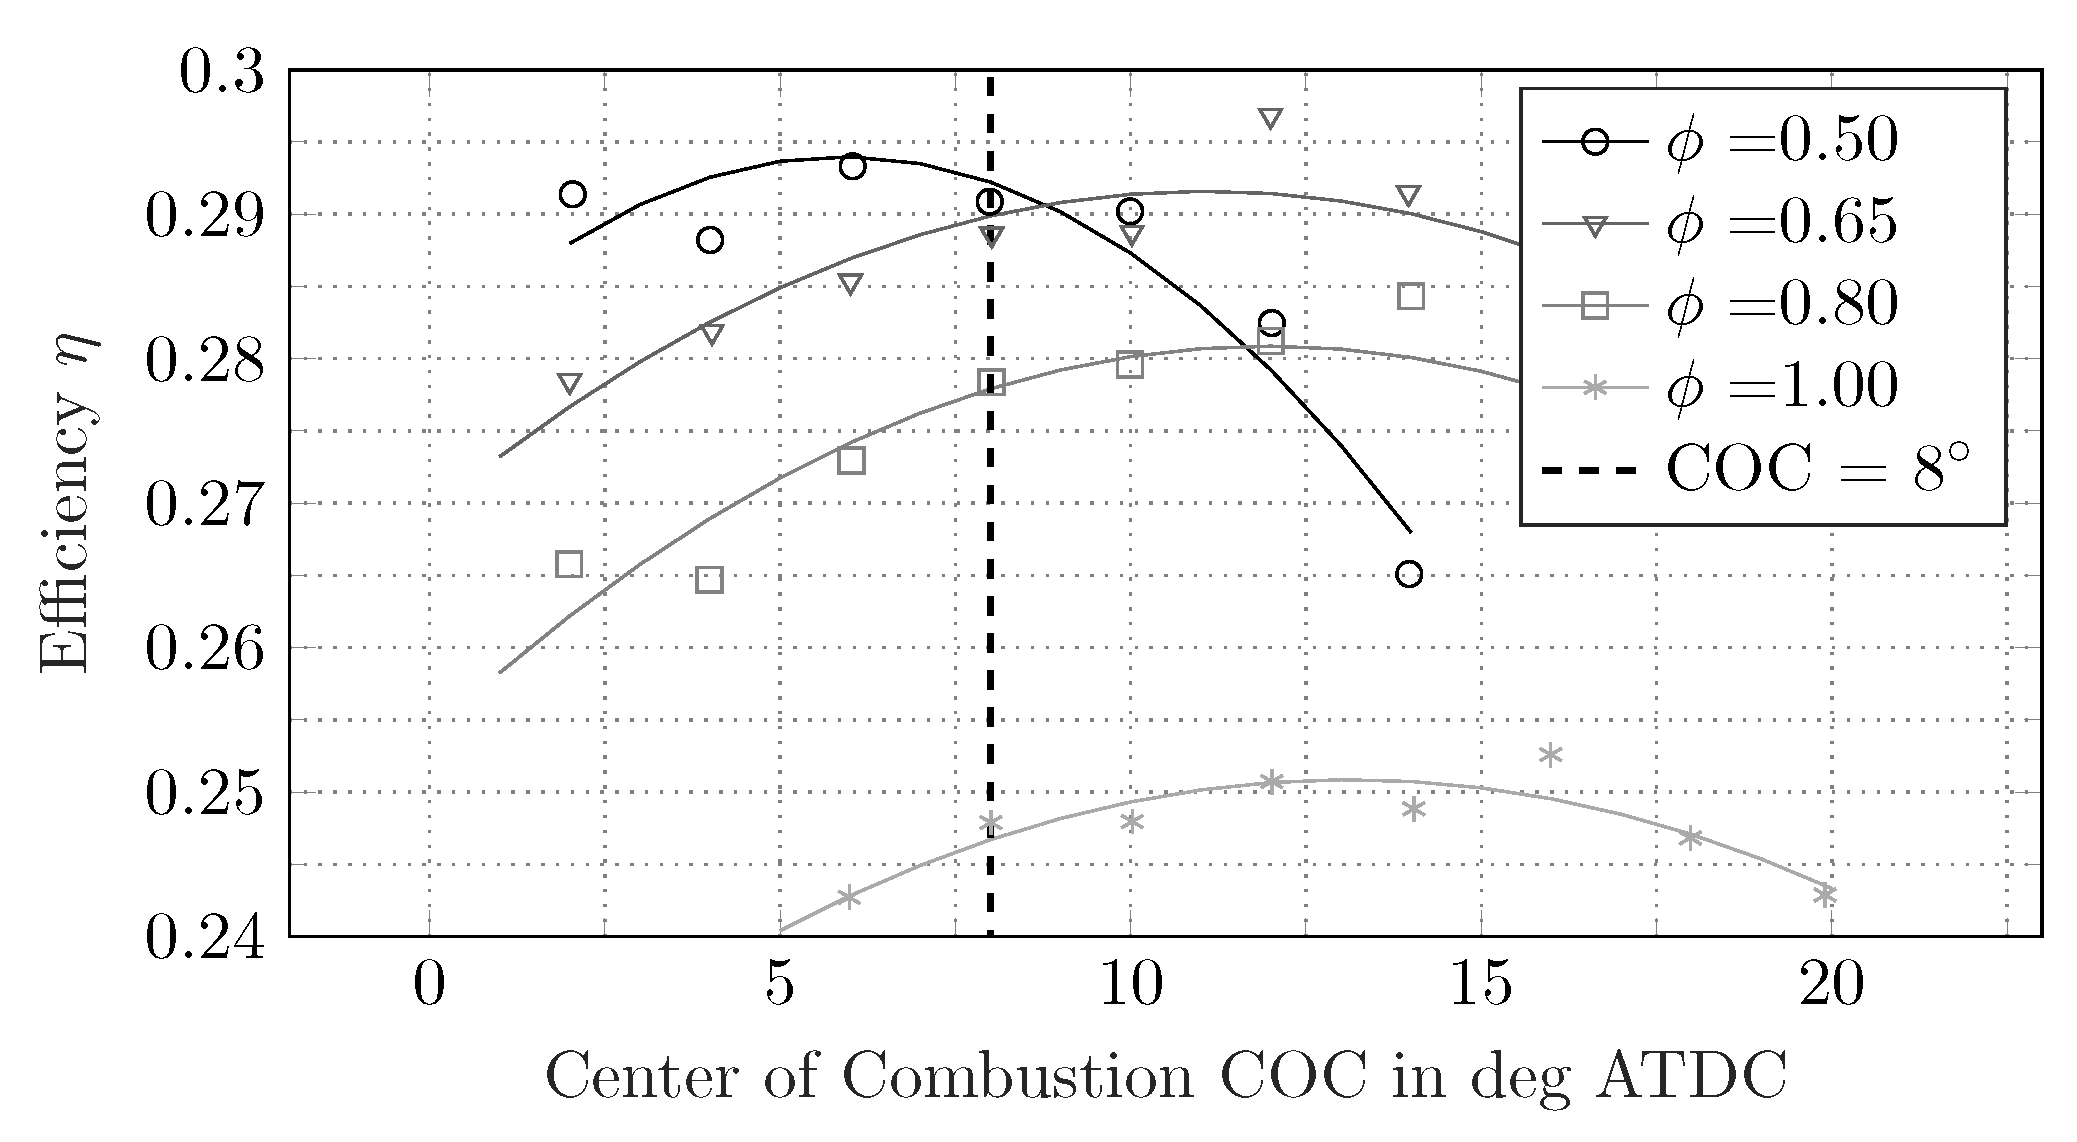
The question of the crank angle at which the center of combustion (COC) should be set is a tradeoff mainly driven by efficiency, maximum pressure gradient, NOx, exhaust gas temperature, and HC. The measurement data in Figure A2 show the engine efficiency for varying COCs at different fuel-to-air equivalence ratios .
There is no single COC value that optimizes the engine efficiency over all equivalence ratios. In order to exploit the full potential of the combustion phasing the COC should be addapted in dependency of the current load, equivalence ratio, and EGR ratio. For this study the COC is held at a “neutral” position of after top dead center (ATDC) throughout all measurements. The measurement data shown in Figure A2 allow the conclusion that the operation with a fixed COC leads to a maximal deviation from the optimal efficiency of approximately . In contrast, the change in efficiency due to the reduction of the fuel-to-air equivalence ratio from 1 to is approximately 5 percentage points, i.e., it is about 10 times higher. The influence of the COC thus is not considered in the model presented in Section 4.
Figure A1.
Measured net heat release rate of one sweep of the fuel-to-air equivalence ratio . The shown traces are obtained by calculating the mean value of 60 engine cycles.
Figure A1.
Measured net heat release rate of one sweep of the fuel-to-air equivalence ratio . The shown traces are obtained by calculating the mean value of 60 engine cycles.
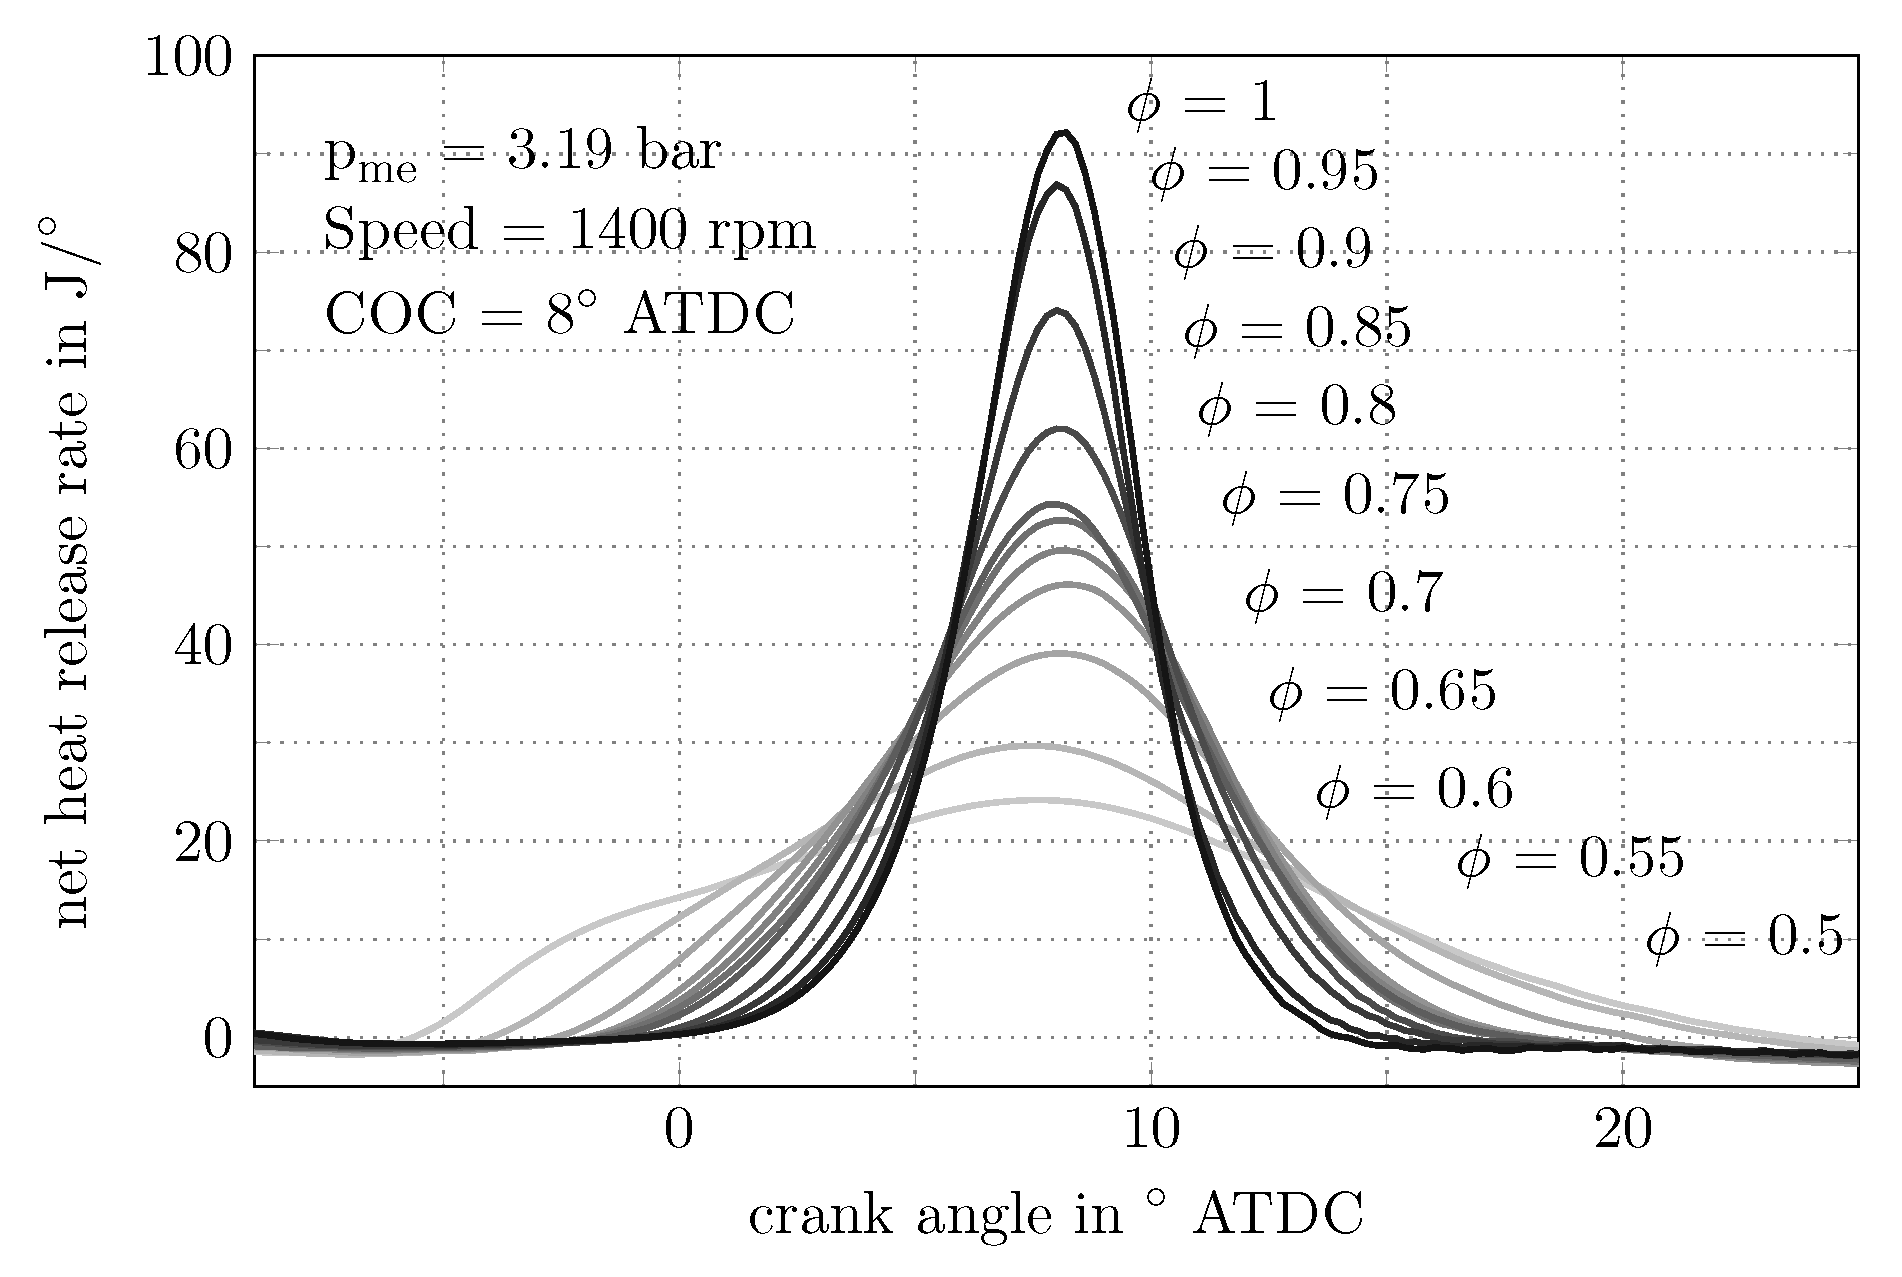
Figure A2.
Measured engine efficiency as a function of the center of combustion COC for various fuel-to-air equivalence ratios at load and speed .
Figure A2.
Measured engine efficiency as a function of the center of combustion COC for various fuel-to-air equivalence ratios at load and speed .
Appendix B.2. Start of Injection (SOI)
Beside the center of combustion COC, the start of the Diesel injection SOI is the second independent variable that is not considered as a degree of freedom. The start of injection is controlled by the Diesel-minimal control (DMC) presented in [32]. The start of injection and the duration of injection are thereby controlled in order to achieve two goals: First, hold the combustion phasing at a desired position using feedback control, and second, minimize the amount of Diesel used via an extremum-seeking algorithm. As a consequence, the Diesel-to-gas ratio is not constant, but is set to the lowest value possible with which the desired combustion phasing can be achieved.
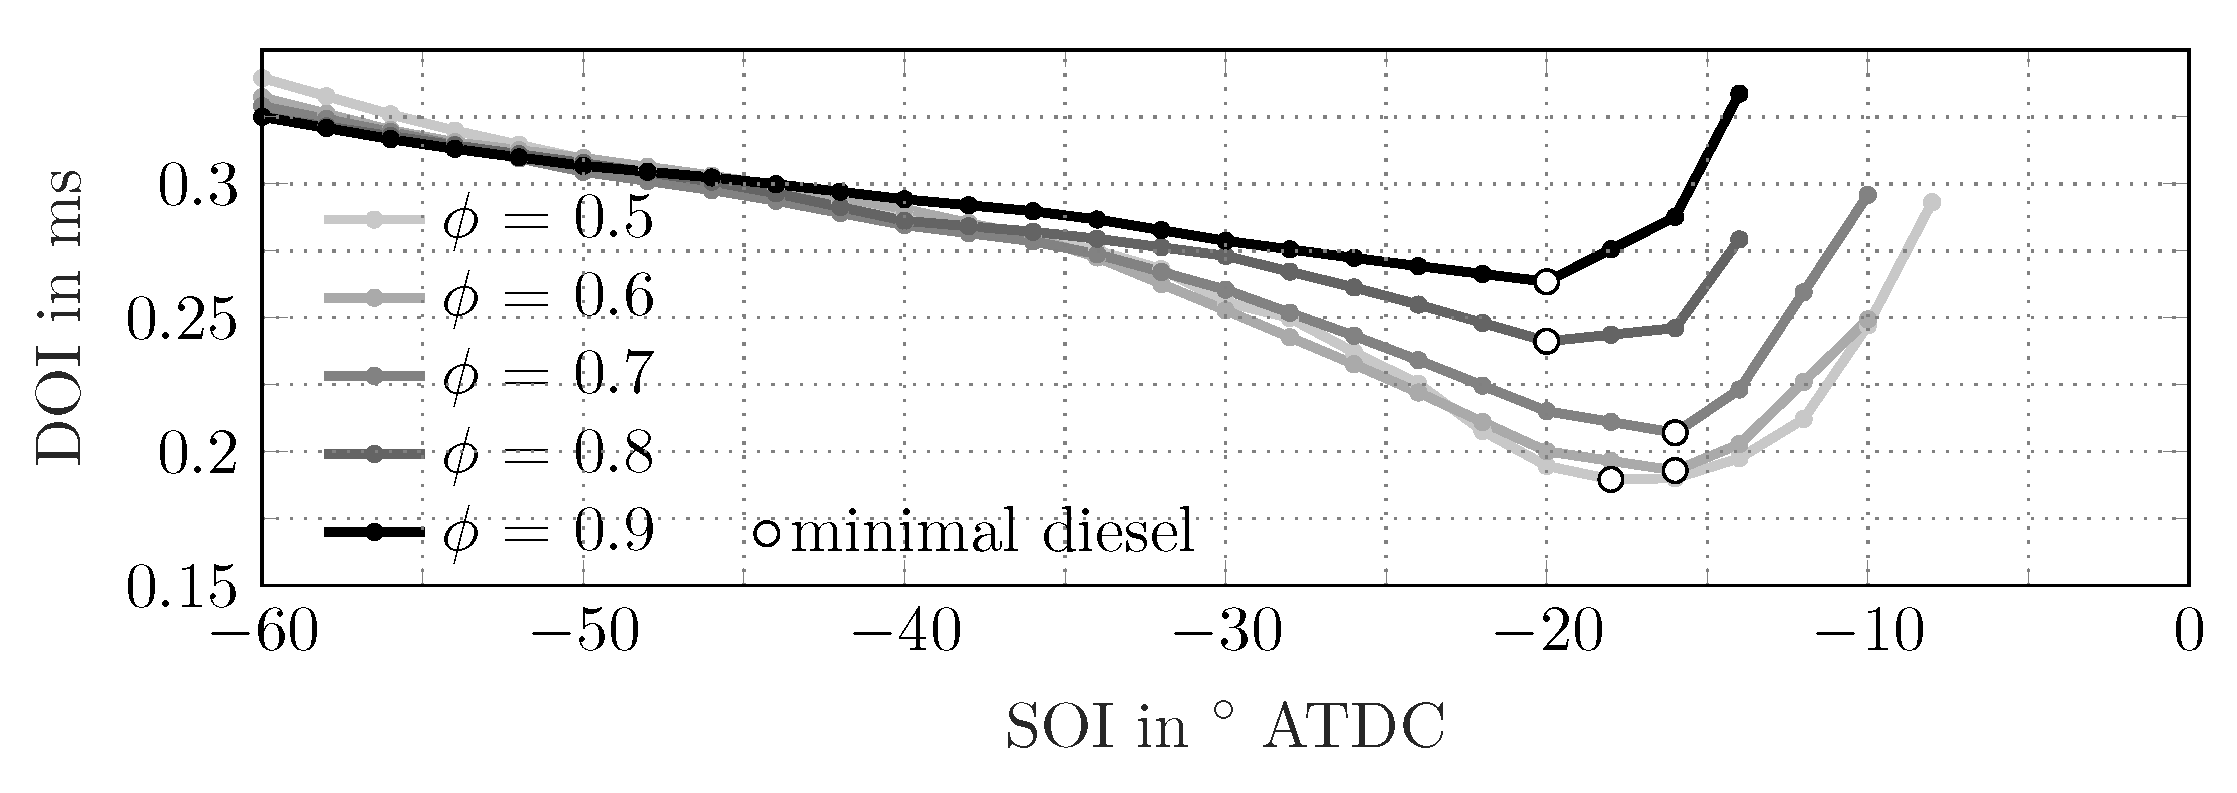
Figure A3 shows the various injection parameter values leading to the same center of combustion. All measurements are performed at the same brake mean effective pressure without any EGR. The amount of Diesel is changed along a single SOI sweep since the duration of injection is used to achieve the desired combustion phasing. For injections with start angles around ATDC the necessary duration of injection is minimal. In general, for every operating point there is a specific start of injection that leads to the desired combustion phasing using the smallest duration of injection possible.
Minimizing the amount of Diesel generally means maximizing the substitution rate. In other words, the DMC maximizes the share of fuel energy originating from the gas fuel in place of the Diesel fuel. Due to the advantageous carbon-to-hydrogen ratio of methane, this lowers the CO emissions. Consequently, minimal CO emissions can be anticipated when DMC is used.
Figure A3.
Measured duration of injection (DOI) of Diesel in dependency of the start of injection (SOI) and the equivalence ratio . All measurements are conducted at the same center of combustion ( ATDC) and the same brake mean effective pressure ( bar) at .
Figure A3.
Measured duration of injection (DOI) of Diesel in dependency of the start of injection (SOI) and the equivalence ratio . All measurements are conducted at the same center of combustion ( ATDC) and the same brake mean effective pressure ( bar) at .

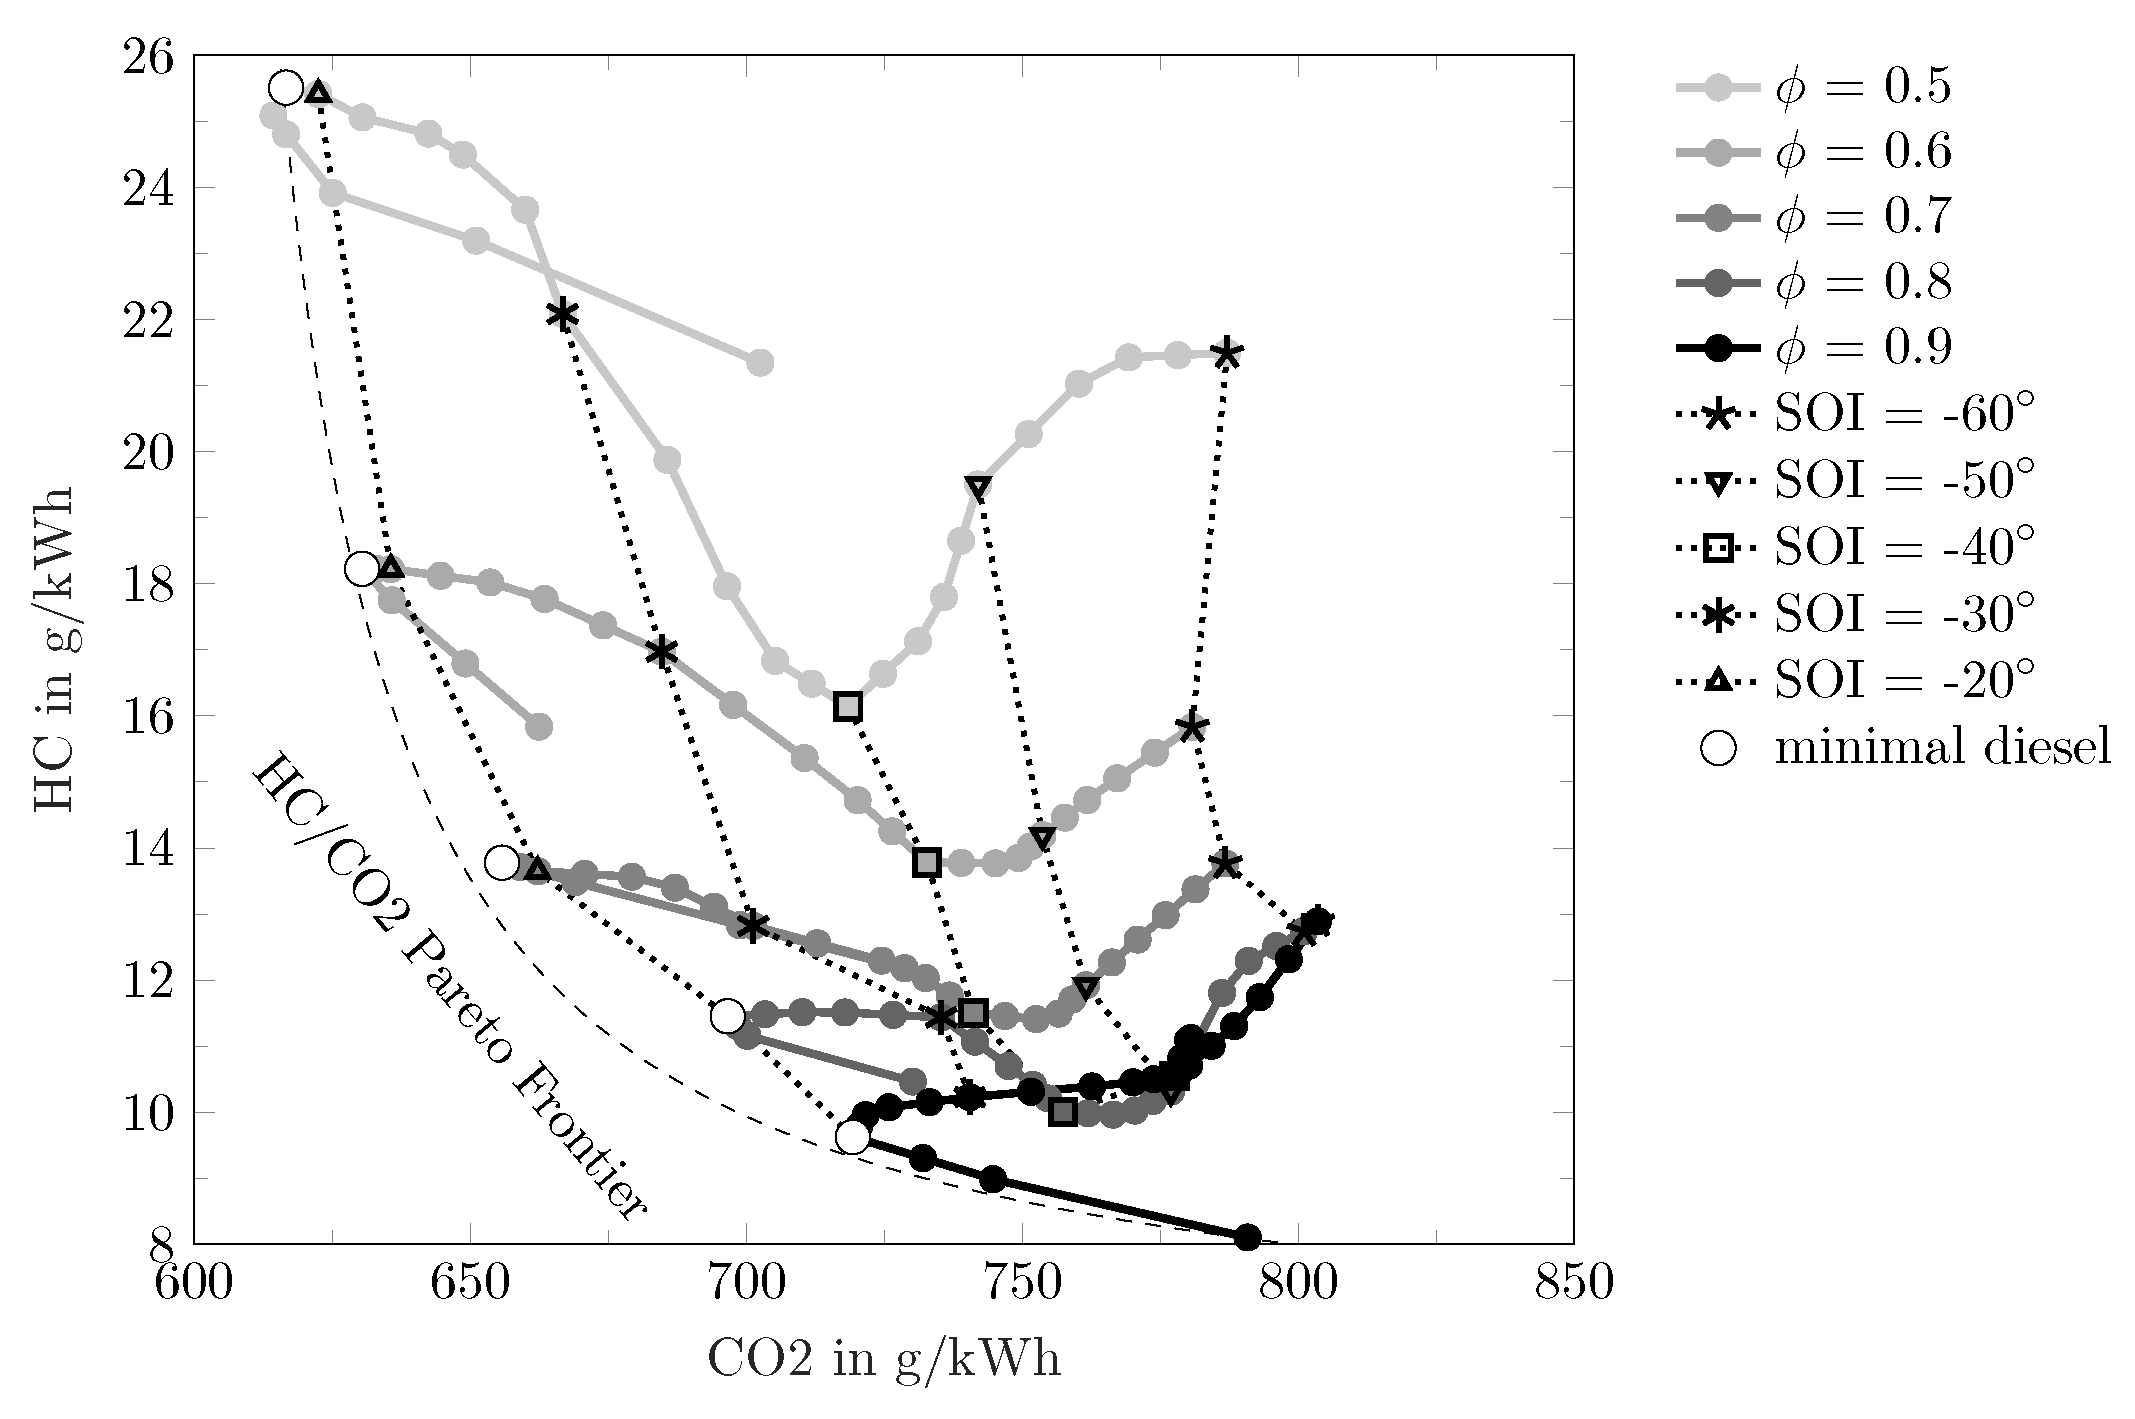
Figure A4 shows the HC and CO emissions resulting from varying SOI and . The SOIs corresponding to the Diesel-minimal injections (denoted by circles) yield the lowest CO emissions for every particular equivalence ratio. Furthermore, Figure A4 shows that these SOIs align well with the global HC/CO Pareto frontier. Neither HC nor CO can be improved simultaneously beyond this Pareto frontier. In general, a Pareto frontier is defined by a series of operating points at which it is impossible to improve either one of the two quantities without making the other quantity worse. By changing (e.g., by throttling) while using DMC, one can move along this pareto front. Using the DMC approach leads to a CO-HC optimal operation. Using this Diesel injection strategy for the independent variable start of injection SOI is therefore regarded to be reasonable in the context of this study since the strategy represents the “best case” scenario regarding HC and CO emissions. These emissions, in turn, are crucial for the characterization of the low-load limit.
Figure A4.
Measured CO and HC emissions for various configurations of Diesel injection and equivalence ratio at the same center of combustion and brake mean effective pressure.
Figure A4.
Measured CO and HC emissions for various configurations of Diesel injection and equivalence ratio at the same center of combustion and brake mean effective pressure.

Appendix C. Estimating the Acceptable Engine-out Emissions of HC
Passenger car emission legislation specifies the limits in grams per kilometer for a specific test cycle. Emissions measured during stationary experiments have to be converted in order to be comparable to emission limits set by legislation. The energy required to drive the test cycle strongly depends on the vehicle used. The parameters of the vehicle considered in the course of this work correspond to a full-size conventional vehicle and are summarized in Table A1. The test cycle considered is the NEDC. Using an averaged energy demand , the averaged pollutant emission limit in can be calculated as follows:
The limit of the HC tailpipe emissions for the Euro VI legislation in and the calculated limit in are shown in Table A2. Furthermore, the engine-out limits are shown when an exhaust gas aftertreatment system with a effective pollutant reduction is considered.

Table A1.
Vehicle parameters.
| Parameter | Unit | Value |
|---|---|---|
| Vehicle mass | kg | 1929 |
| Aerodynamic drag coefficient | - | |
| Frontal area | ||
| Rolling friction coefficient | - | |
| Auxiliary power demand | W | 400 |
Table A2.
HC Emission legislation.
| Species | Euro VI | Euro VI | Reduction |
|---|---|---|---|
| HC | 90 mg/km | 0.67 g/kWh | 13.3 g/kWh |
Appendix D. Experimental Operating Points
The operating points for the steady-state measurements (Table A3) are chosen according to their relevance on the test cycles NEDC and WLTC, both with respect to time and consumption-vise. The measurements primarily used in this study are the points 1 to 6, which are low-load operation points with loads below or close to and engine speeds below . There are three additional points (7–9) at higher loads that are mainly used for validation purposes.
Table A3.
Overview operating points.
| Engine Speed | Brake Mean | Equivalence | |
|---|---|---|---|
| Effective Pressure | Ratio (Steps ) | ||
| 1 | |||
| 2 | |||
| 3 | |||
| 4 | |||
| 5 | |||
| 6 | |||
only used for validation purposes.
Appendix E. Measurement Uncertainty
Table A4.
Measurement uncertainty.
| Measured Variable | Uncertainty Estimate (Absolute Value) | Sensor Type | Manufacturer |
|---|---|---|---|
| CO | Nondispersive infrared sensor | Cambustion Ltd, Cambridge, UK | |
| HC | Flame ionization detector | Cambustion Ltd, Cambridge, UK | |
| Thermocouple | SAB Bröckskes GmbH & Co. KG, Viersen, DE | ||
| Nondispersive infrared sensors | Cambustion Ltd, Cambridge, UK | ||
| @ @ | Lambda sensor (LSU 4.9) | Robert Bosch GmbH, Stuttgart, DE | |
| Torque transducer | Vibrometer SA, Fribourg, CH |
References
- Karim, G. The Dual Fuel Engine of the Compression Ignition Type–Prospects, Problems and Solutions—A Review; SAE Technical Paper, No. 831073; SAE International: Warrendale, PA, USA, 1983. [Google Scholar]
- Badr, O.; Karim, G.; Liu, B. An examination of the flame spread limits in a dual fuel engine. Appl. Therm. Eng. 1999, 19, 1071–1080. [Google Scholar] [CrossRef]
- Eichmeier, J.; Wagner, U.; Spicher, U. Controlling gasoline low temperature combustion by diesel micro pilot injection. J. Eng. Gas Turbines Power 2012, 134, 072802. [Google Scholar] [CrossRef]
- Ishiyama, T.; Kang, J.; Ozawa, Y.; Sako, T. Improvement of Performance and Reduction of Exhaust Emissions By Pilot-Fuel-Injection Control in a Lean-Burning Natural-Gas Dual-Fuel Engine; SAE Technical Paper, No. 2011-01-1963; SAE International: Warrendale, PA, USA, 2011. [Google Scholar]
- Ogawa, H.; Zhao, P.; Kato, T.; Shibata, G. Improvement of Combustion and Emissions in a Dual Fuel Compression Ignition Engine with Natural Gas as the Main Fuel; SAE Technical Paper, No. 2015-01-0863; SAE International: Warrendale, PA, USA, 2015. [Google Scholar]
- Königsson, F.; Stalhammar, P.; Angstrom, H.E. Characterization and Potential of Dual Fuel Combustion in a Modern Diesel Engine; SAE Technical Paper, No. 2011-01-2223; SAE International: Warrendale, PA, USA, 2011. [Google Scholar]
- Dronniou, N.; Kashdan, J.; Lecointe, B.; Sauve, K.; Soleri, D. Optical Investigation of Dual-fuel CNG/Diesel Combustion Strategies to Reduce CO2 Emissions. SAE Int. J. Engines 2014, 7, 873–887. [Google Scholar] [CrossRef]
- Li, M.; Zhang, Q.; Li, G. Emission Characteristics of a Natural Gas Engine Operating in Lean-Burn and Stoichiometric Modes. J. Energy Eng. 2015, 04015039. [Google Scholar] [CrossRef]
- Nieman, D.E.; Dempsey, A.B.; Reitz, R.D. Heavy-duty RCCI operation using natural gas and diesel. SAE Int. J. Engines 2012, 5, 270–285. [Google Scholar] [CrossRef]
- Splitter, D.; Hanson, R.; Kokjohn, S.; Reitz, R.D. Reactivity Controlled Compression Ignition (RCCI) Heavy-Duty Engine Operation at Mid-and High-Loads with Conventional and Alternative Fuels; SAE Technical Paper, No. 2011-01-0363; SAE International: Warrendale, PA, USA, 2011. [Google Scholar]
- Kokjohn, S.; Hanson, R.; Splitter, D.; Reitz, R. Fuel reactivity controlled compression ignition (RCCI): A pathway to controlled high-efficiency clean combustion. Int. J. Engine Res. 2011, 12, 209–226. [Google Scholar] [CrossRef]
- Walker, N.R.; Chuahy, F.D.; Reitz, R.D. Comparison of Diesel Pilot Ignition (DPI) and Reactivity Controlled Compression Ignition (RCCI) in a Heavy-Duty Engine. In ASME 2015 Internal Combustion Engine Division Fall Technical Conference; American Society of Mechanical Engineers: New York, NY, USA, 2015; pp. V001T03A016:1–V001T03A016:13. [Google Scholar]
- Zurbriggen, F.J. Combustion Control of a Natural Gas-Diesel Engine-Feedback Control and Adaptation. Ph.D. Thesis, Nr. 23022. ETH Zürich, Zürich, Schweiz, 2016. [Google Scholar]
- Ott, T.; Onder, C.; Guzzella, L. Hybrid-electric vehicle with natural gas-diesel engine. Energies 2013, 6, 3571–3592. [Google Scholar] [CrossRef]
- Ott, T. Hybrid-Electric Vehicle with Natural Gas-Diesel Engine. Ph.D. Thesis, Nr. 21678. ETH Zürich, Zürich, Schweiz, 2013. [Google Scholar]
- Serrano, D.; Bertrand, L. Exploring the Potential of Dual Fuel Diesel-CNG Combustion for Passenger Car Engine. In Proceedings of the FISITA 2012 World Automotive Congress, Beijing, China, 27–30 November 2012; Springer: Berlin, Germany, 2013; pp. 139–153. [Google Scholar]
- Serrano, D.; Obiols, J.; Lecointe, B. Optimization of Dual Fuel Diesel-Methane Operation on a Production Passenger Car Engine—Thermodynamic Analysis; SAE Technical Paper, No. 2013-01-2505; SAE International: Warrendale, PA, USA, 2013. [Google Scholar]
- Selim, M.Y. Effect of exhaust gas recirculation on some combustion characteristics of dual fuel engine. Energy Convers. Manag. 2003, 44, 707–721. [Google Scholar] [CrossRef]
- Dishy, A.; You, T.; Iwashiro, Y.; Nakayama, S.; Kihara, R.; Saito, T. Controlling Combustion and Exhaust Emissions in a Direct-Injection Diesel Engine Dual-Fueled With Natural Gas; SAE Technical Paper, No. 952436; SAE International: Warrendale, PA, USA, 1995. [Google Scholar]
- Taniguchi, S.; Masubuchi, M.; Kitano, K.; Mogi, K. Feasibility Study of Exhaust Emissions in a Natural Gas Diesel Dual Fuel (DDF) Engine; SAE Technical Paper, No. 2012-01-1649; SAE International: Warrendale, PA, USA, 2012. [Google Scholar]
- Sprenger, F.; Fasching, P.; Kammerstaetter, S. Experimental Investigation of CNG-Diesel Combustion Processes with External and Internal Mixture Formation for Passenger Car Application. In Proceedings of the Conference on the Working Process of the Internal Combustion Engine, Graz, Austria, 24–25 September 2015. [Google Scholar]
- Fasching, P.; Sprenger, F.; Eichlseder, H. Experimental Optimization of a Small Bore Natural Gas-Diesel Dual Fuel Engine with Direct Fuel Injection. SAE Int. J. Engines 2016, 9, 1072–1086. [Google Scholar] [CrossRef]
- Usmen, R.K.; Subramanian, S.; McCabe, R.W.; Kudla, R.J. Design Considerations for Natural Gas Vehicle Catalytic Converters; SAE Technical Paper, No. 933036; SAE International: Warrendale, PA, USA, 1993. [Google Scholar]
- Andersson, B.; Cruise, N.; Lunden, M.; Hansson, M. Methane and Nitric Oxide Conversion Over a Catalyst Dedicated for Natural Gas Vehicles; SAE Technical Paper, No. 2000-01-2928; SAE International: Warrendale, PA, USA, 2000. [Google Scholar]
- Abd-Alla, G.; Soliman, H.; Badr, O.; Abd-Rabbo, M. Effects of diluent admissions and intake air temperature in exhaust gas recirculation on the emissions of an indirect injection dual fuel engine. Energy Convers. Manag. 2001, 42, 1033–1045. [Google Scholar] [CrossRef]
- Besch, M.C.; Israel, J.; Thiruvengadam, A.; Kappanna, H.; Carder, D. Emissions Characterization from Different Technology Heavy-Duty Engines Retrofitted for CNG/Diesel Dual-Fuel Operation. SAE Int. J. Engines 2015, 8, 1342–1358. [Google Scholar] [CrossRef]
- Arrègle, J.; López, J.J.; Guardiola, C.; Monin, C. On-board NOx prediction in diesel engines: A physical approach. In Automotive Model Predictive Control; Springer: Berlin, Germany, 2010; pp. 25–36. [Google Scholar]
- Woschni, G.; Zeilinger, K. 2-Zonen Rechenmodell zur Vorausrechnung der NO-Emission von Dieselmotoren. MTZ Motortechnische Z. 1998, 59, 770–775. [Google Scholar]
- Schilling, A.; Amstutz, A.; Onder, C.H.; Guzzella, L. A real-time model for the prediction of the NOx emissions in DI diesel engines. In Proceedings of the 2006 IEEE Computer Aided Control System Design, IEEE International Conference on Control Applications, IEEE International Symposium on Intelligent Control (CACSD-CCA-ISIC), Munich, Germany, 4–6 October 2006; pp. 4–6. [Google Scholar]
- Krijnsen, H.C.; van Kooten, W.E.; Calis, H.P.A.; Verbeek, R.P.; Bleek, C.M. Prediction of NOx emissions from a transiently operating diesel engine using an artificial neural network. Chem. Eng. Technol. 1999, 22, 601–607. [Google Scholar] [CrossRef]
- Guzzella, L.; Sciarretta, A. Vehicle Propulsion Systems, 3rd ed.; Springer: Berlin, Germany, 2013. [Google Scholar]
- Zurbriggen, F.; Hutter, R.; Onder, C. Diesel-Minimal Combustion Control of a Natural Gas-Diesel Engine. Energies 2016, 9, 58. [Google Scholar] [CrossRef]
- Guzzella, L.; Onder, C. Introduction to Modeling and Control of Internal Combustion Engine Systems; Springer: Berlin, Germany, 2009. [Google Scholar]
- Müller, M. General Air Fuel Ratio and EGR Definitions and Their Calculation from Emissions; SAE Technical Paper, No. 2010-01-1285; SAE International: Warrendale, PA, USA, 2010. [Google Scholar]
- Moran, M.J.; Shapiro, H.N.; Boettner, D.D.; Bailey, M.B. Fundamentals of Engineering Thermodynamics; John Wiley & Sons: Hoboken, NJ, USA, 2010. [Google Scholar]
- Heywood, J.B. Internal Combustion Engine Fundamentals; McGraw-Hill: New York, NY, USA, 1988; Volume 930. [Google Scholar]
- Kusaka, J.; Okamoto, T.; Daisho, Y.; Kihara, R.; Saito, T. Combustion and exhaust gas emission characteristics of a diesel engine dual-fueled with natural gas. JSAE Rev. 2000, 21, 489–496. [Google Scholar] [CrossRef]
Figure 1.
Principle of operation for a Diesel-ignited gas engine. The port fuel injected methane gas is ignited by a small amount of direct-injected Diesel fuel [13].
Figure 1.
Principle of operation for a Diesel-ignited gas engine. The port fuel injected methane gas is ignited by a small amount of direct-injected Diesel fuel [13].
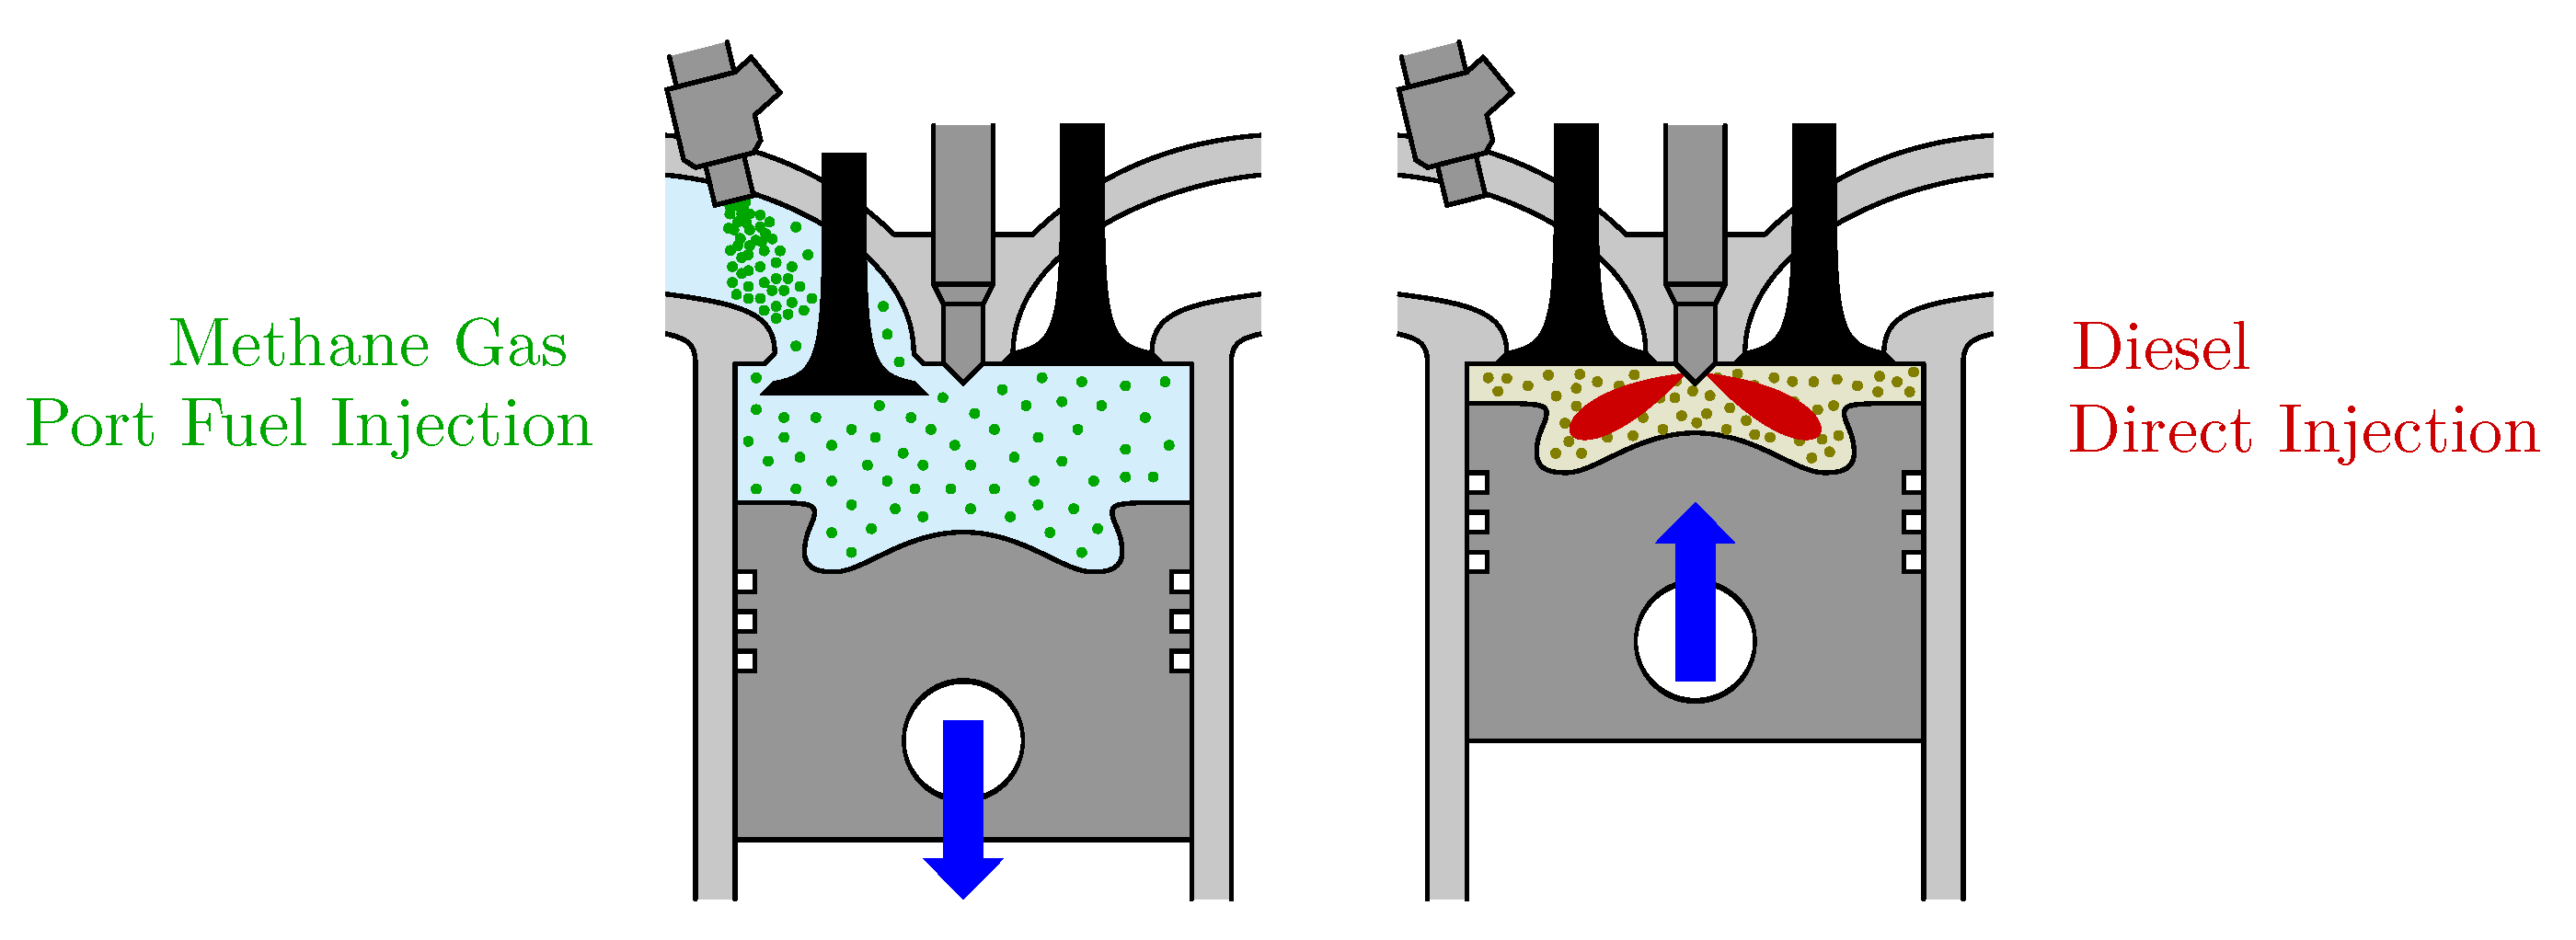
Figure 2.
The control structure consists of four feedback loops. The reference variables are brake mean effective pressure , fuel-to-air equivalence ratio , center-of-combustion COC, and the rate of the exhaust gas recirculation . The Diesel injection controller was presented in [32].
Figure 2.
The control structure consists of four feedback loops. The reference variables are brake mean effective pressure , fuel-to-air equivalence ratio , center-of-combustion COC, and the rate of the exhaust gas recirculation . The Diesel injection controller was presented in [32].

Figure 3.
Overview of the model structure.
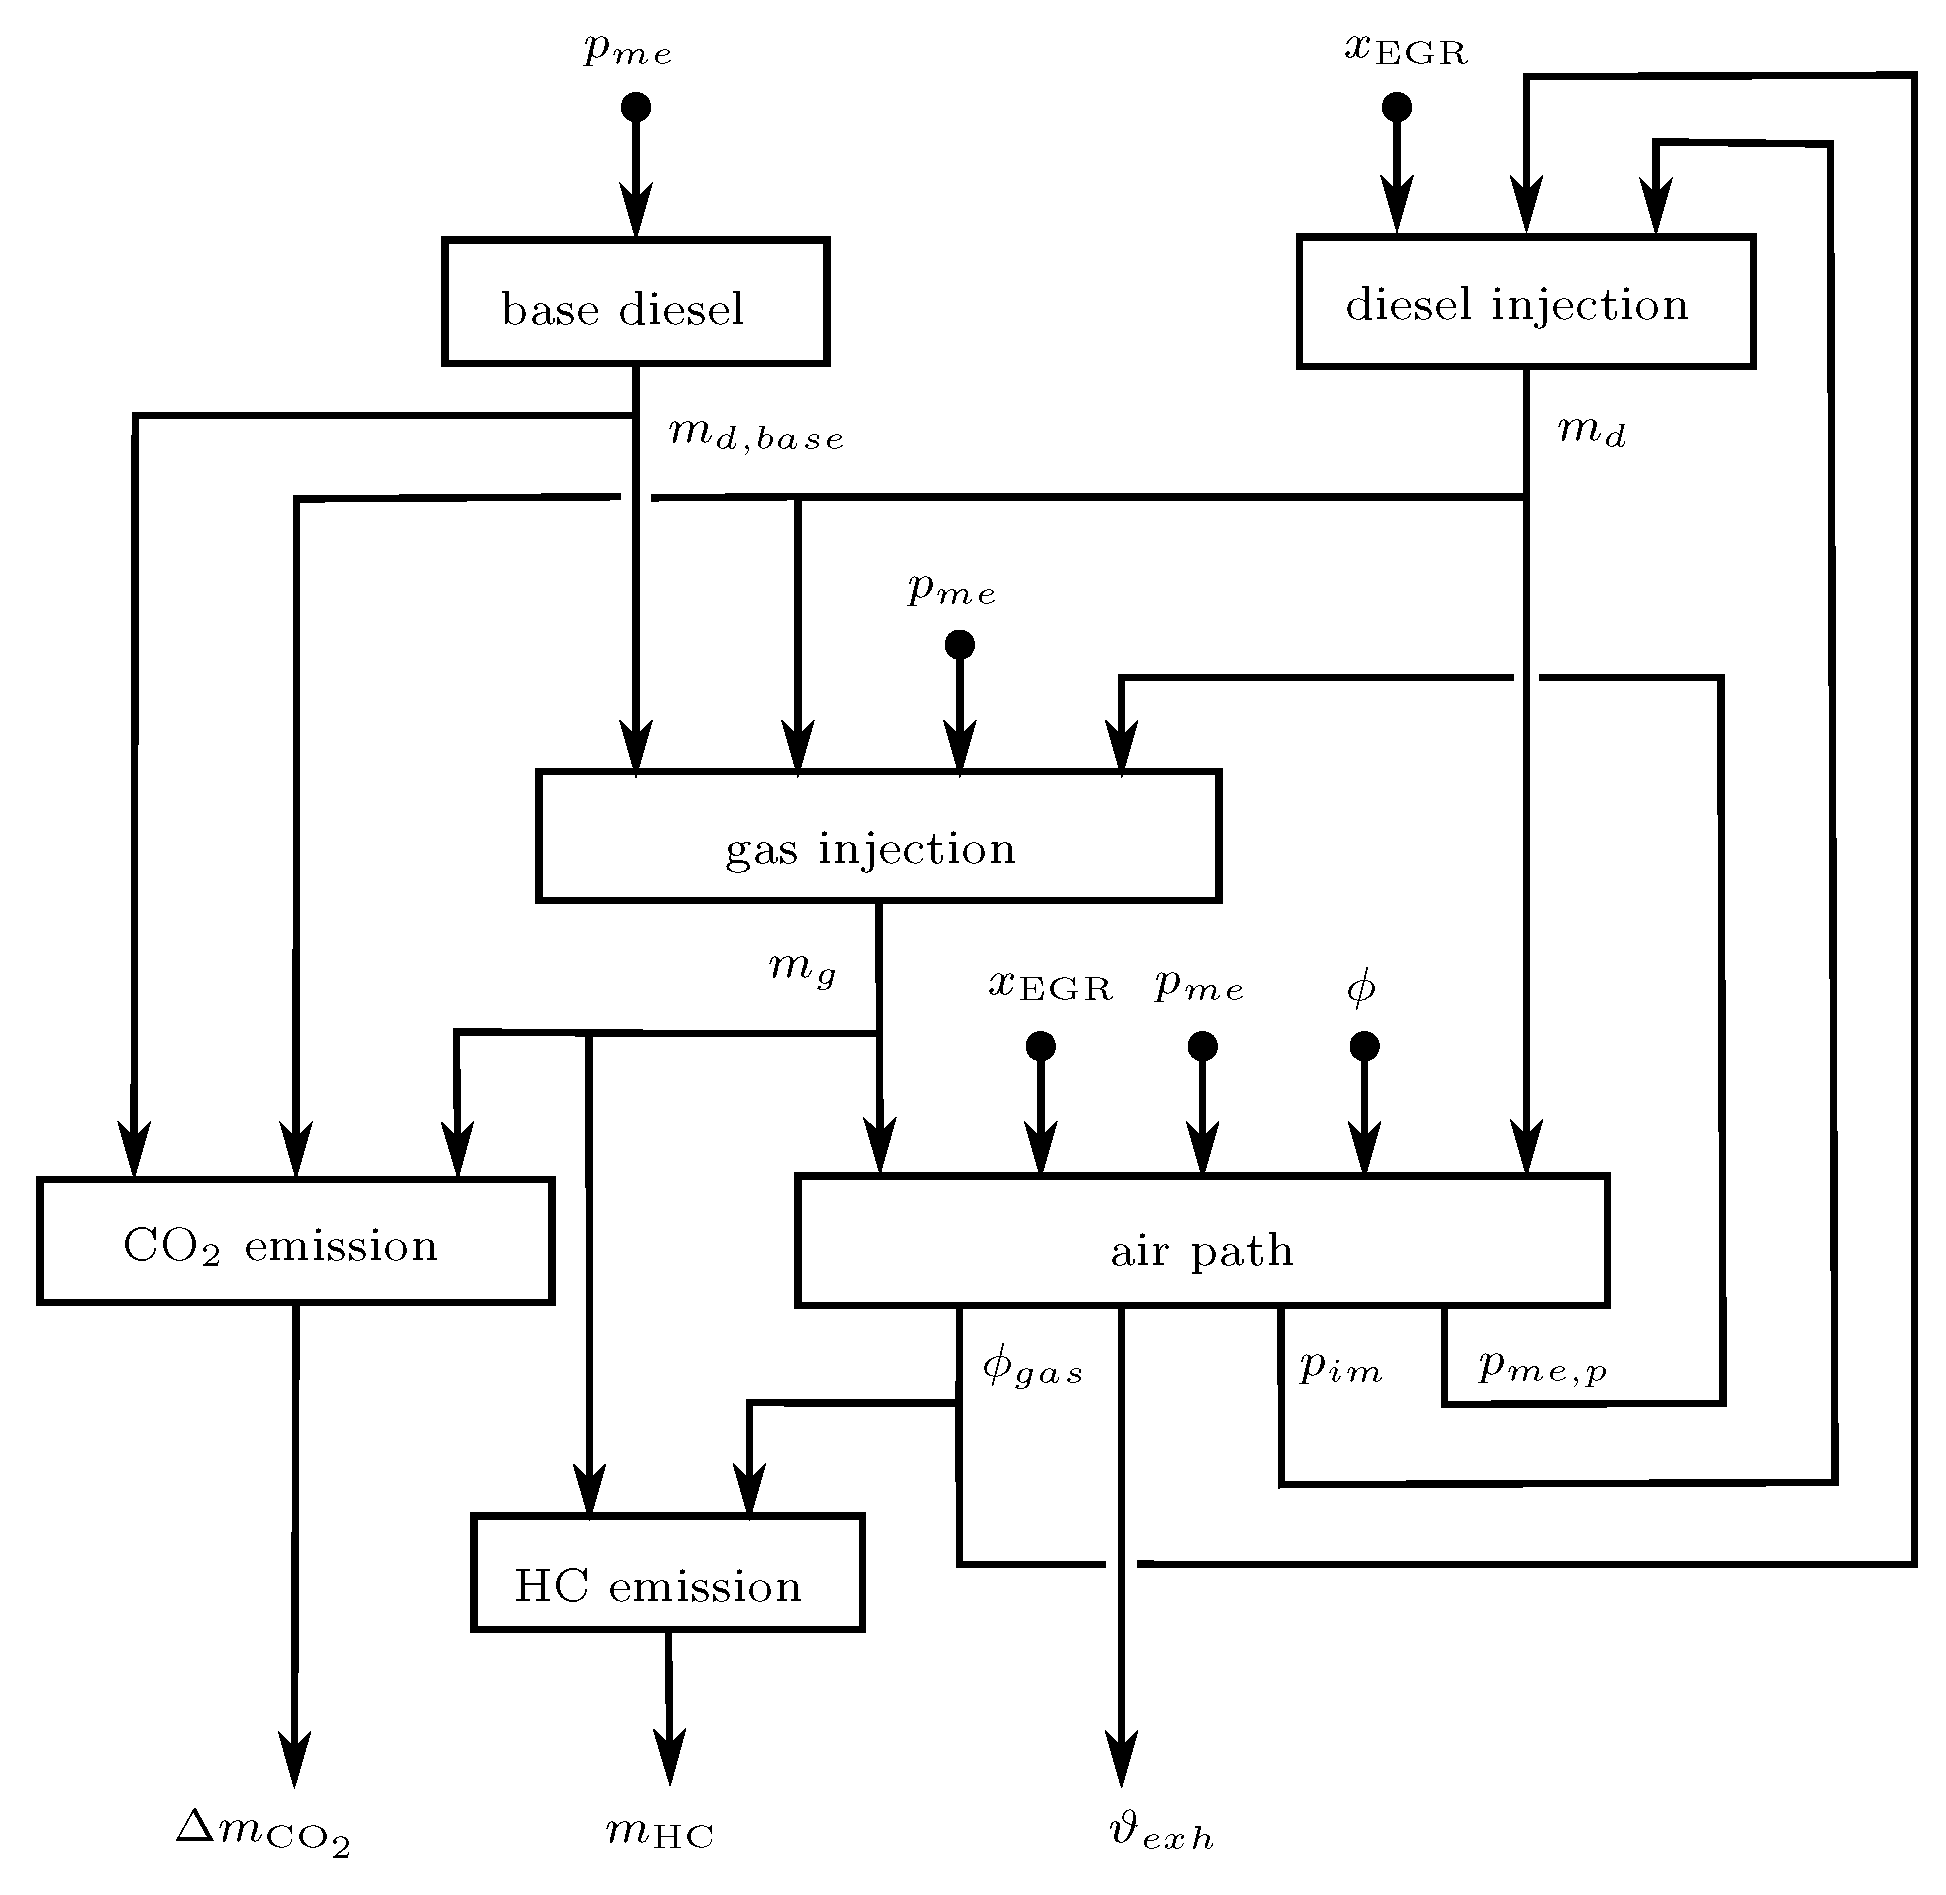
Figure 4.
(Left) Relation of Diesel mass , intake pressure , and EGR ratio according to Equation (5) with ; (Right) Comparison of model and measurement data with dilution with excess air and EGR.
Figure 4.
(Left) Relation of Diesel mass , intake pressure , and EGR ratio according to Equation (5) with ; (Right) Comparison of model and measurement data with dilution with excess air and EGR.

Figure 5.
(Left) Effect of dilution on the exhaust gas temperature normalized by the undiluted exhaust gas temperature ; (Right) The undiluted exhaust gas has a heat capacity that lies between the exhaust heat capacities of a diesel engine and that of a methane engine . The affine relations closely match the nonlinear, precise values given in [35].
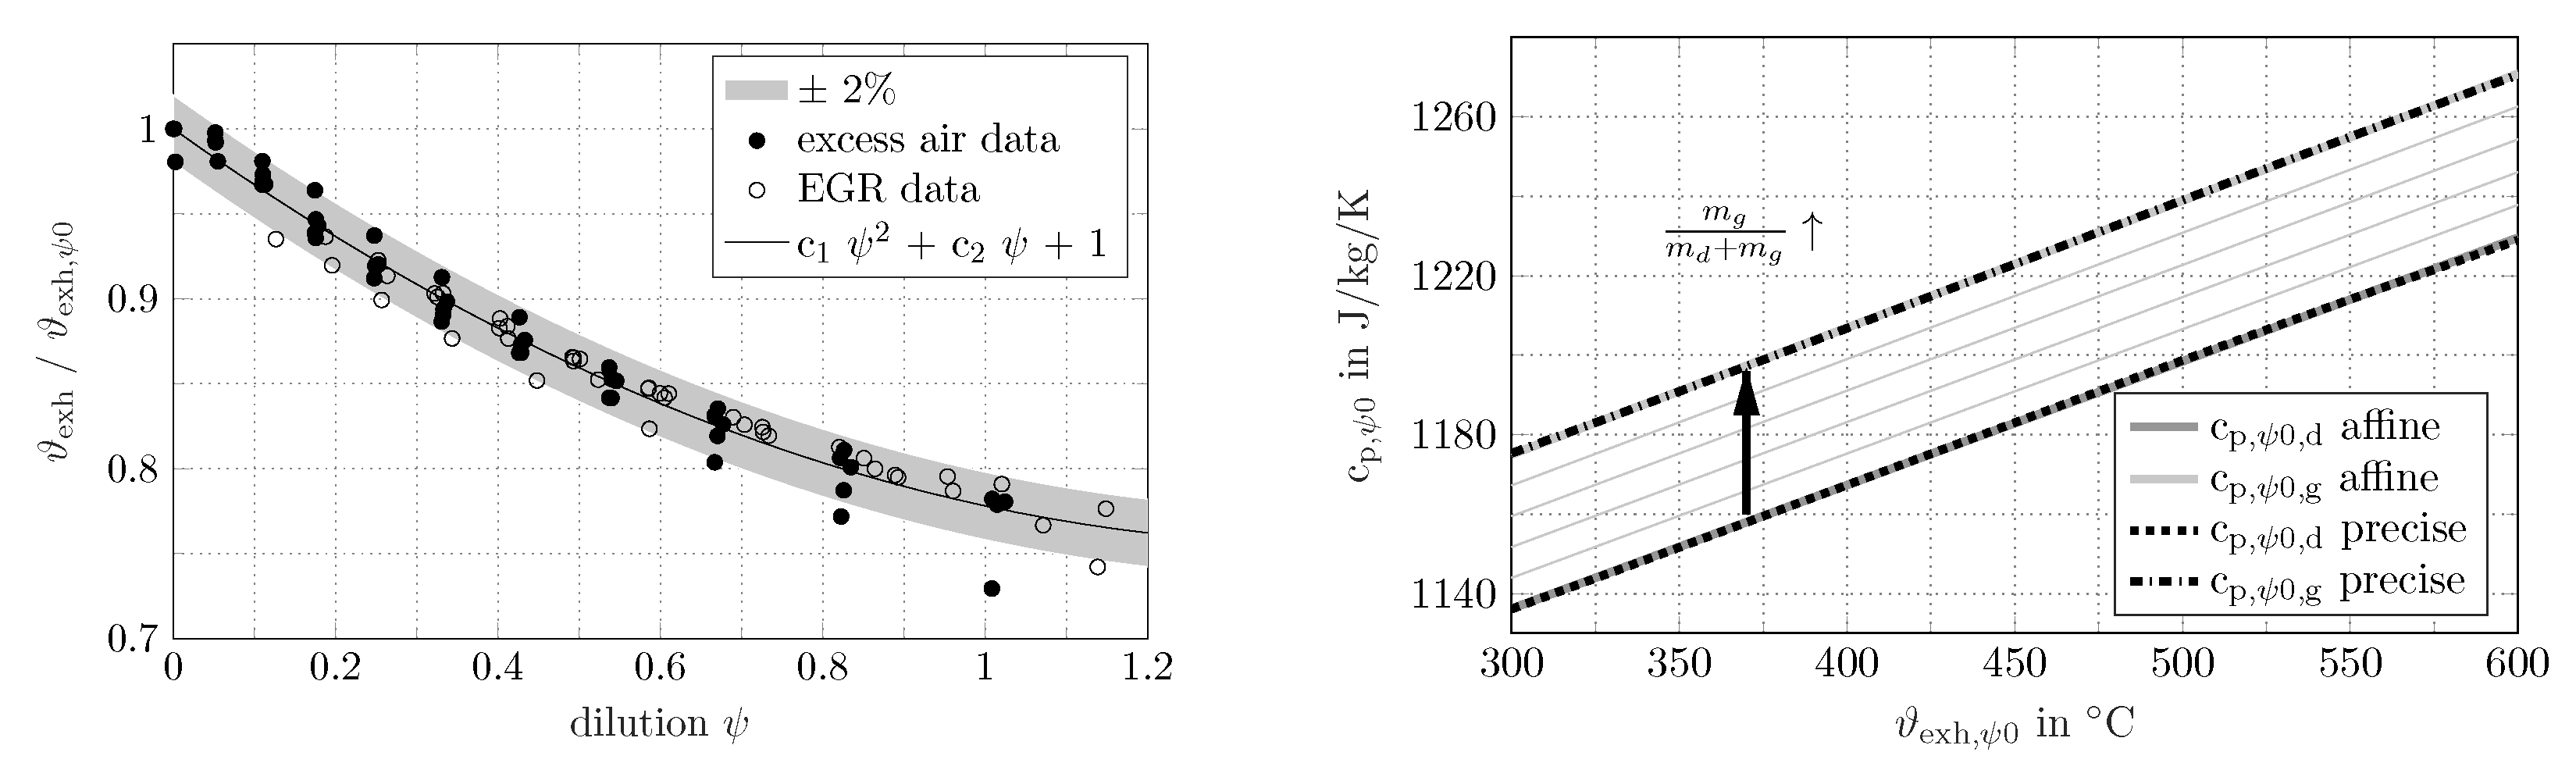
Figure 6.
(Left) The undiluted exhaust enthalpy as an affine function of the mechanical energy released per cycle ; (Right) The exhaust-to-intake pressure ratio as a function of the cylinder massflow. The data contains measurements with excess air as well as EGR.
Figure 6.
(Left) The undiluted exhaust enthalpy as an affine function of the mechanical energy released per cycle ; (Right) The exhaust-to-intake pressure ratio as a function of the cylinder massflow. The data contains measurements with excess air as well as EGR.

Figure 7.
Comparison of measured and modeled low-load criteria with EGR. The three figures show (Left) the CO reduction, (Center) the HC engine-out emission and (Right) the exhaust gas temperature. The limit values , , and are highlighted.
Figure 7.
Comparison of measured and modeled low-load criteria with EGR. The three figures show (Left) the CO reduction, (Center) the HC engine-out emission and (Right) the exhaust gas temperature. The limit values , , and are highlighted.
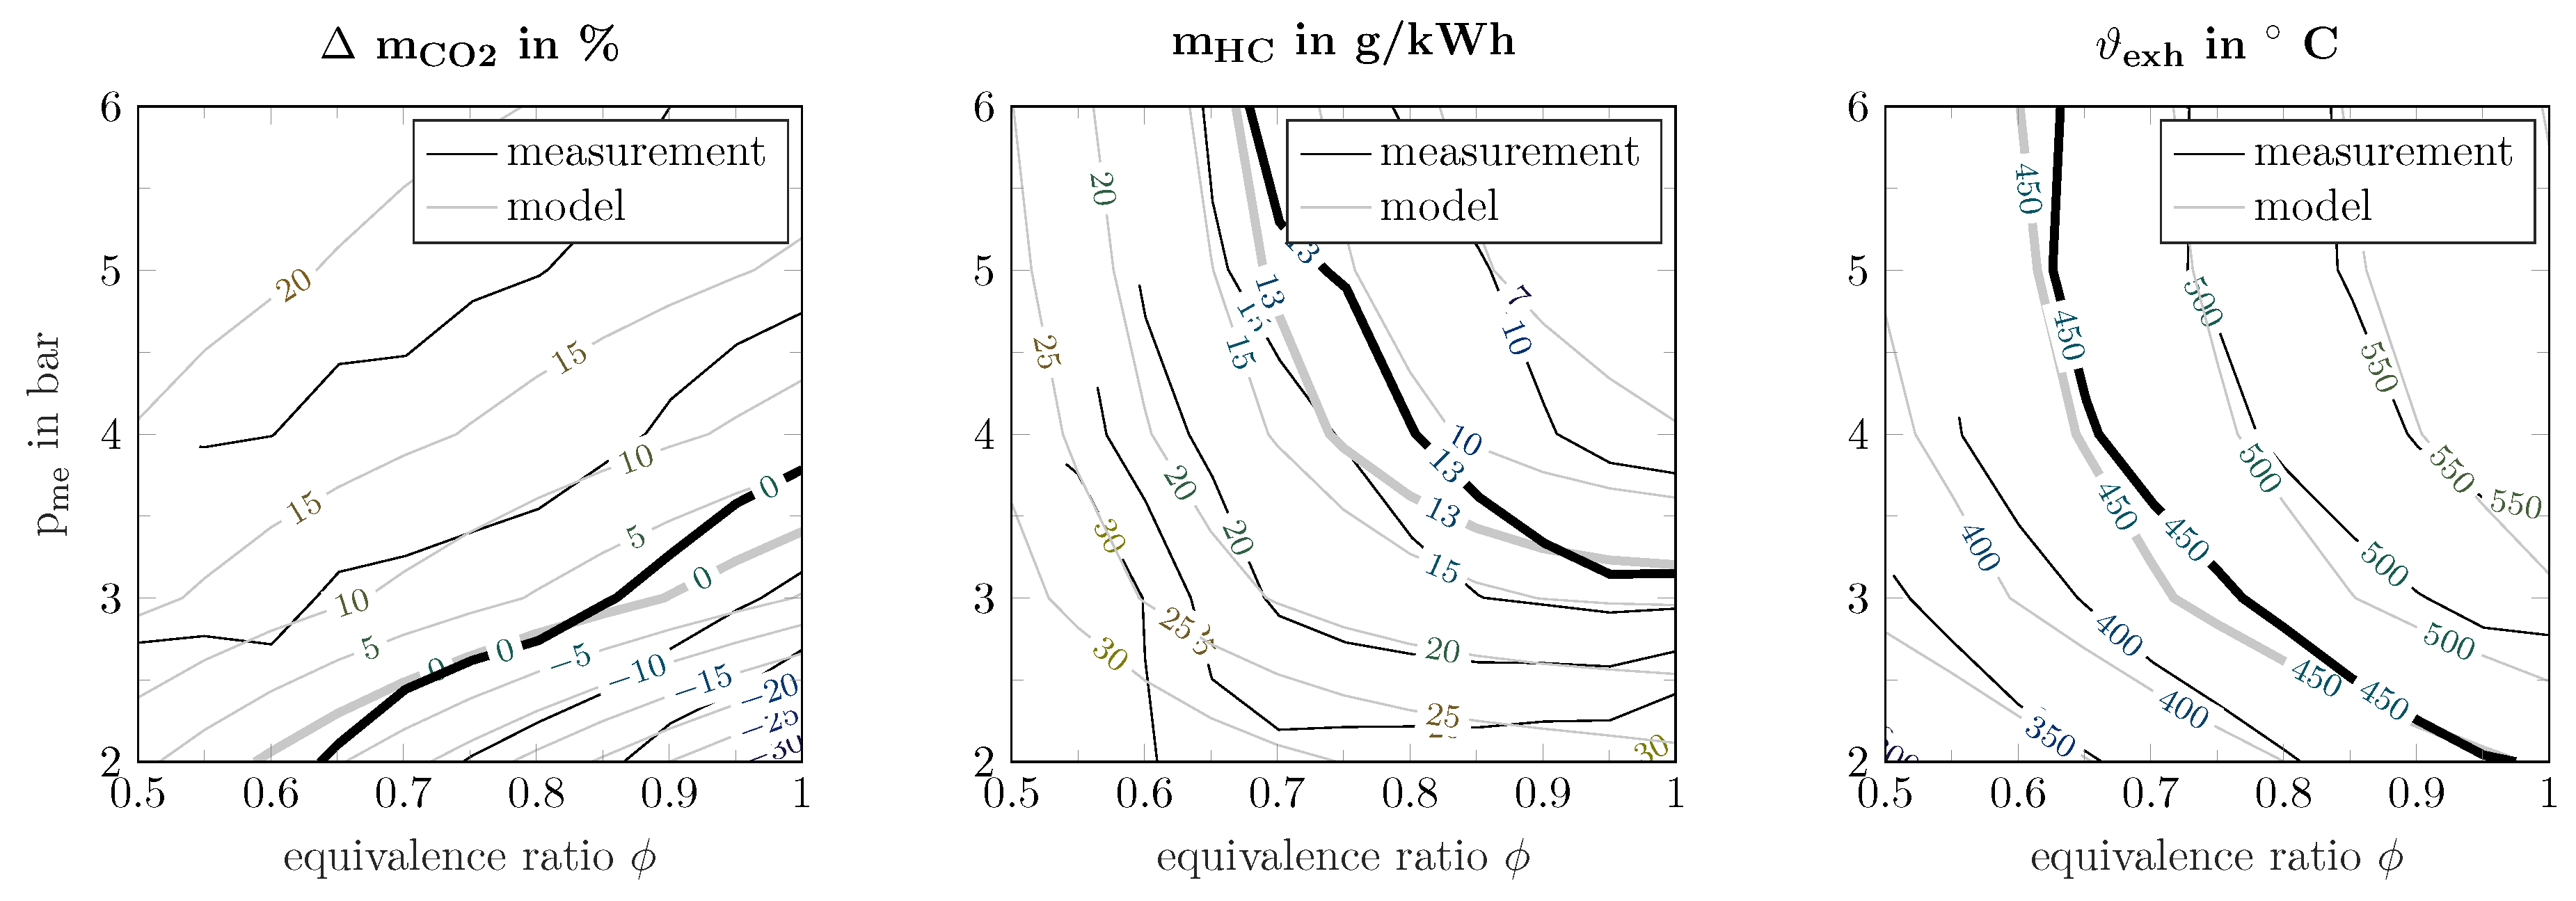
Figure 8.
(Left) The relation of the gas conversion efficiency to the gas equivalence ratio can be well approximated by a second order polynomial function; (Right) For a mean effective pressure below approximately the gas equivalence ratio is not dependent on the equivalence ratio .
Figure 8.
(Left) The relation of the gas conversion efficiency to the gas equivalence ratio can be well approximated by a second order polynomial function; (Right) For a mean effective pressure below approximately the gas equivalence ratio is not dependent on the equivalence ratio .
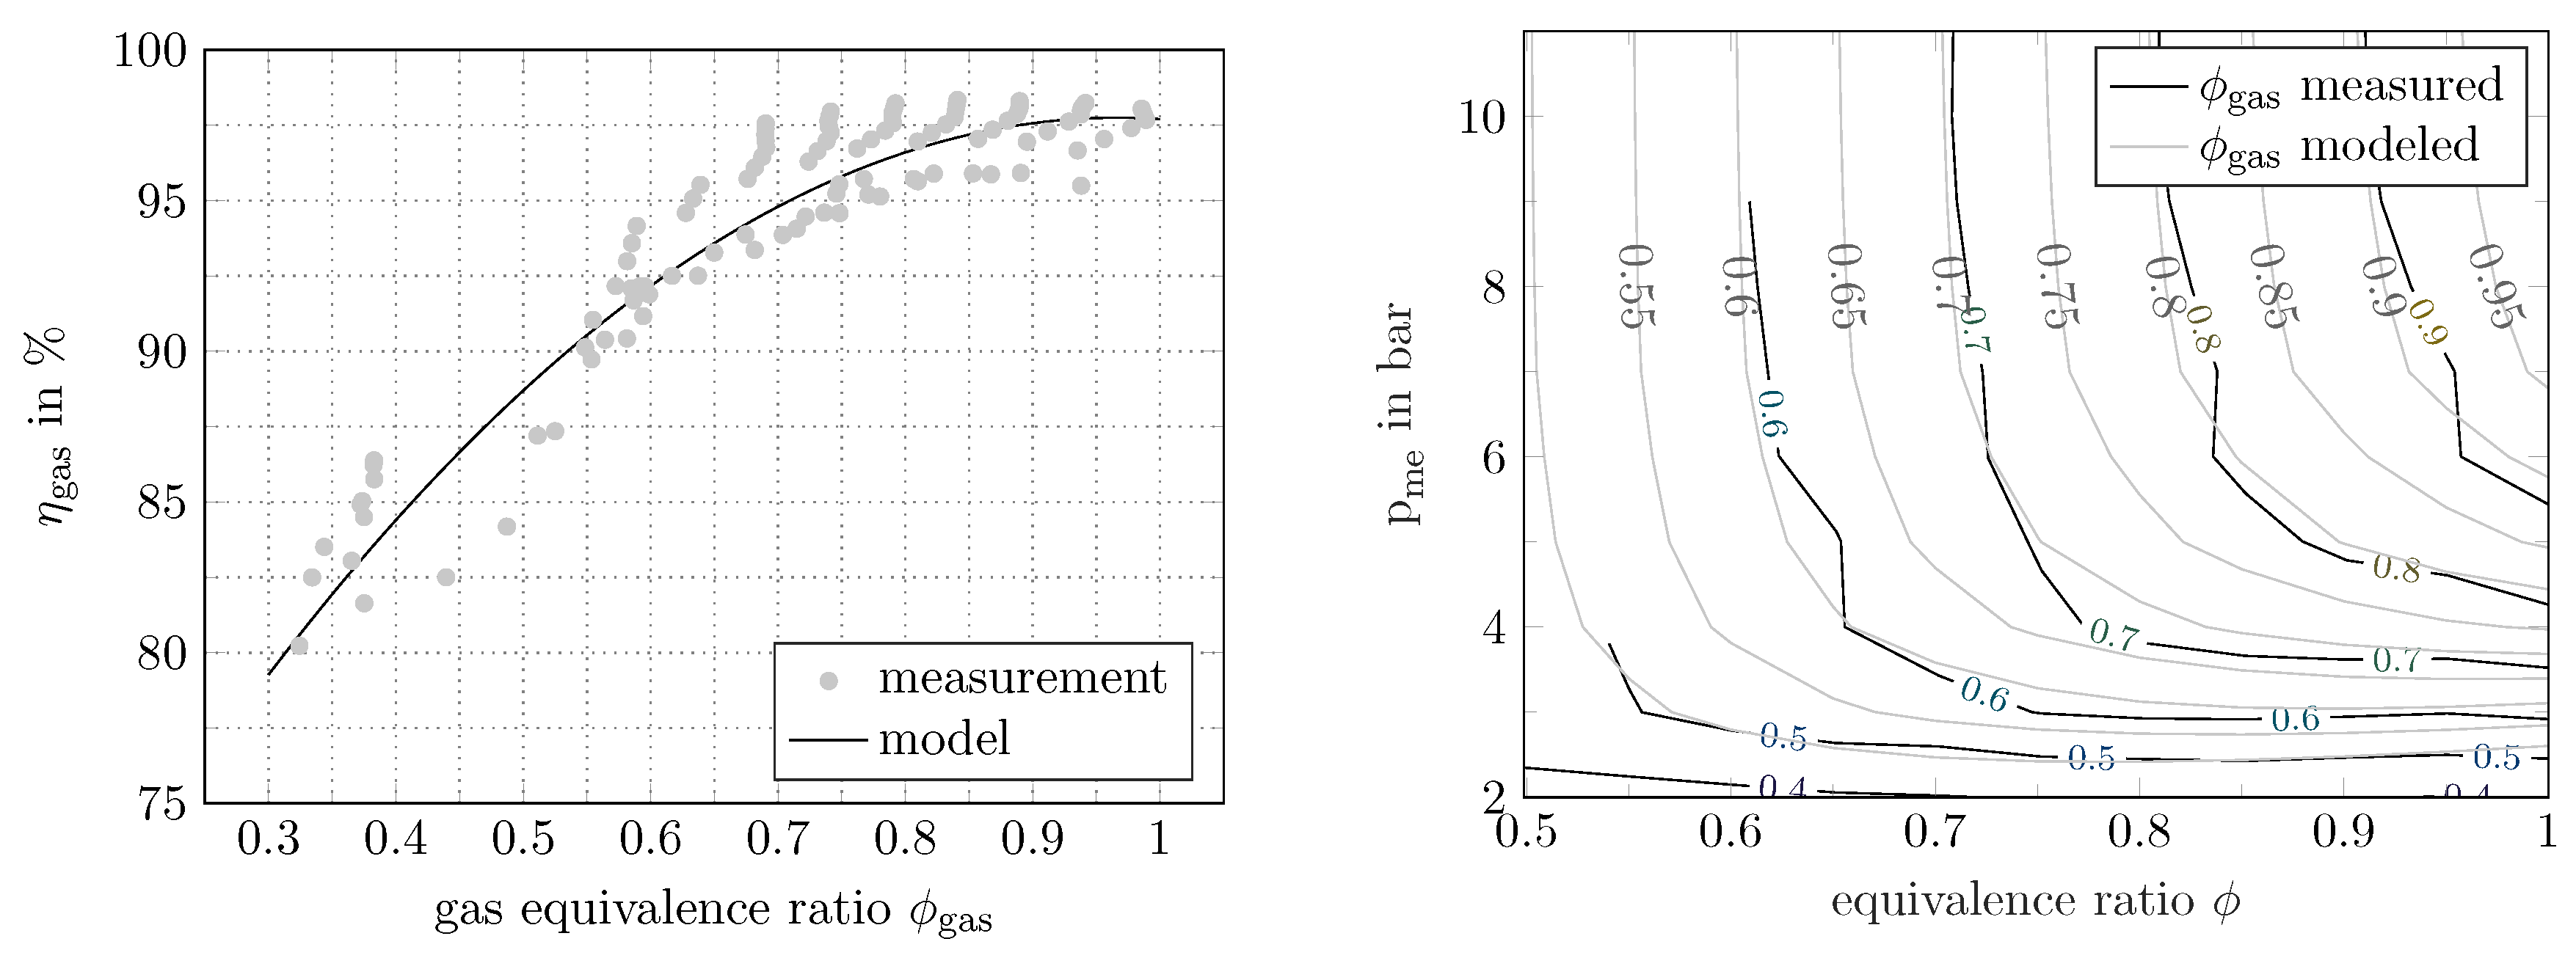
Figure 9.
Measured (black) HC and CO emissions for a sweep of the equivalence ratio performed for various EGR rates at a fixed brake mean effective pressure . The corresponding modeled values are outlined in grey.
Figure 9.
Measured (black) HC and CO emissions for a sweep of the equivalence ratio performed for various EGR rates at a fixed brake mean effective pressure . The corresponding modeled values are outlined in grey.
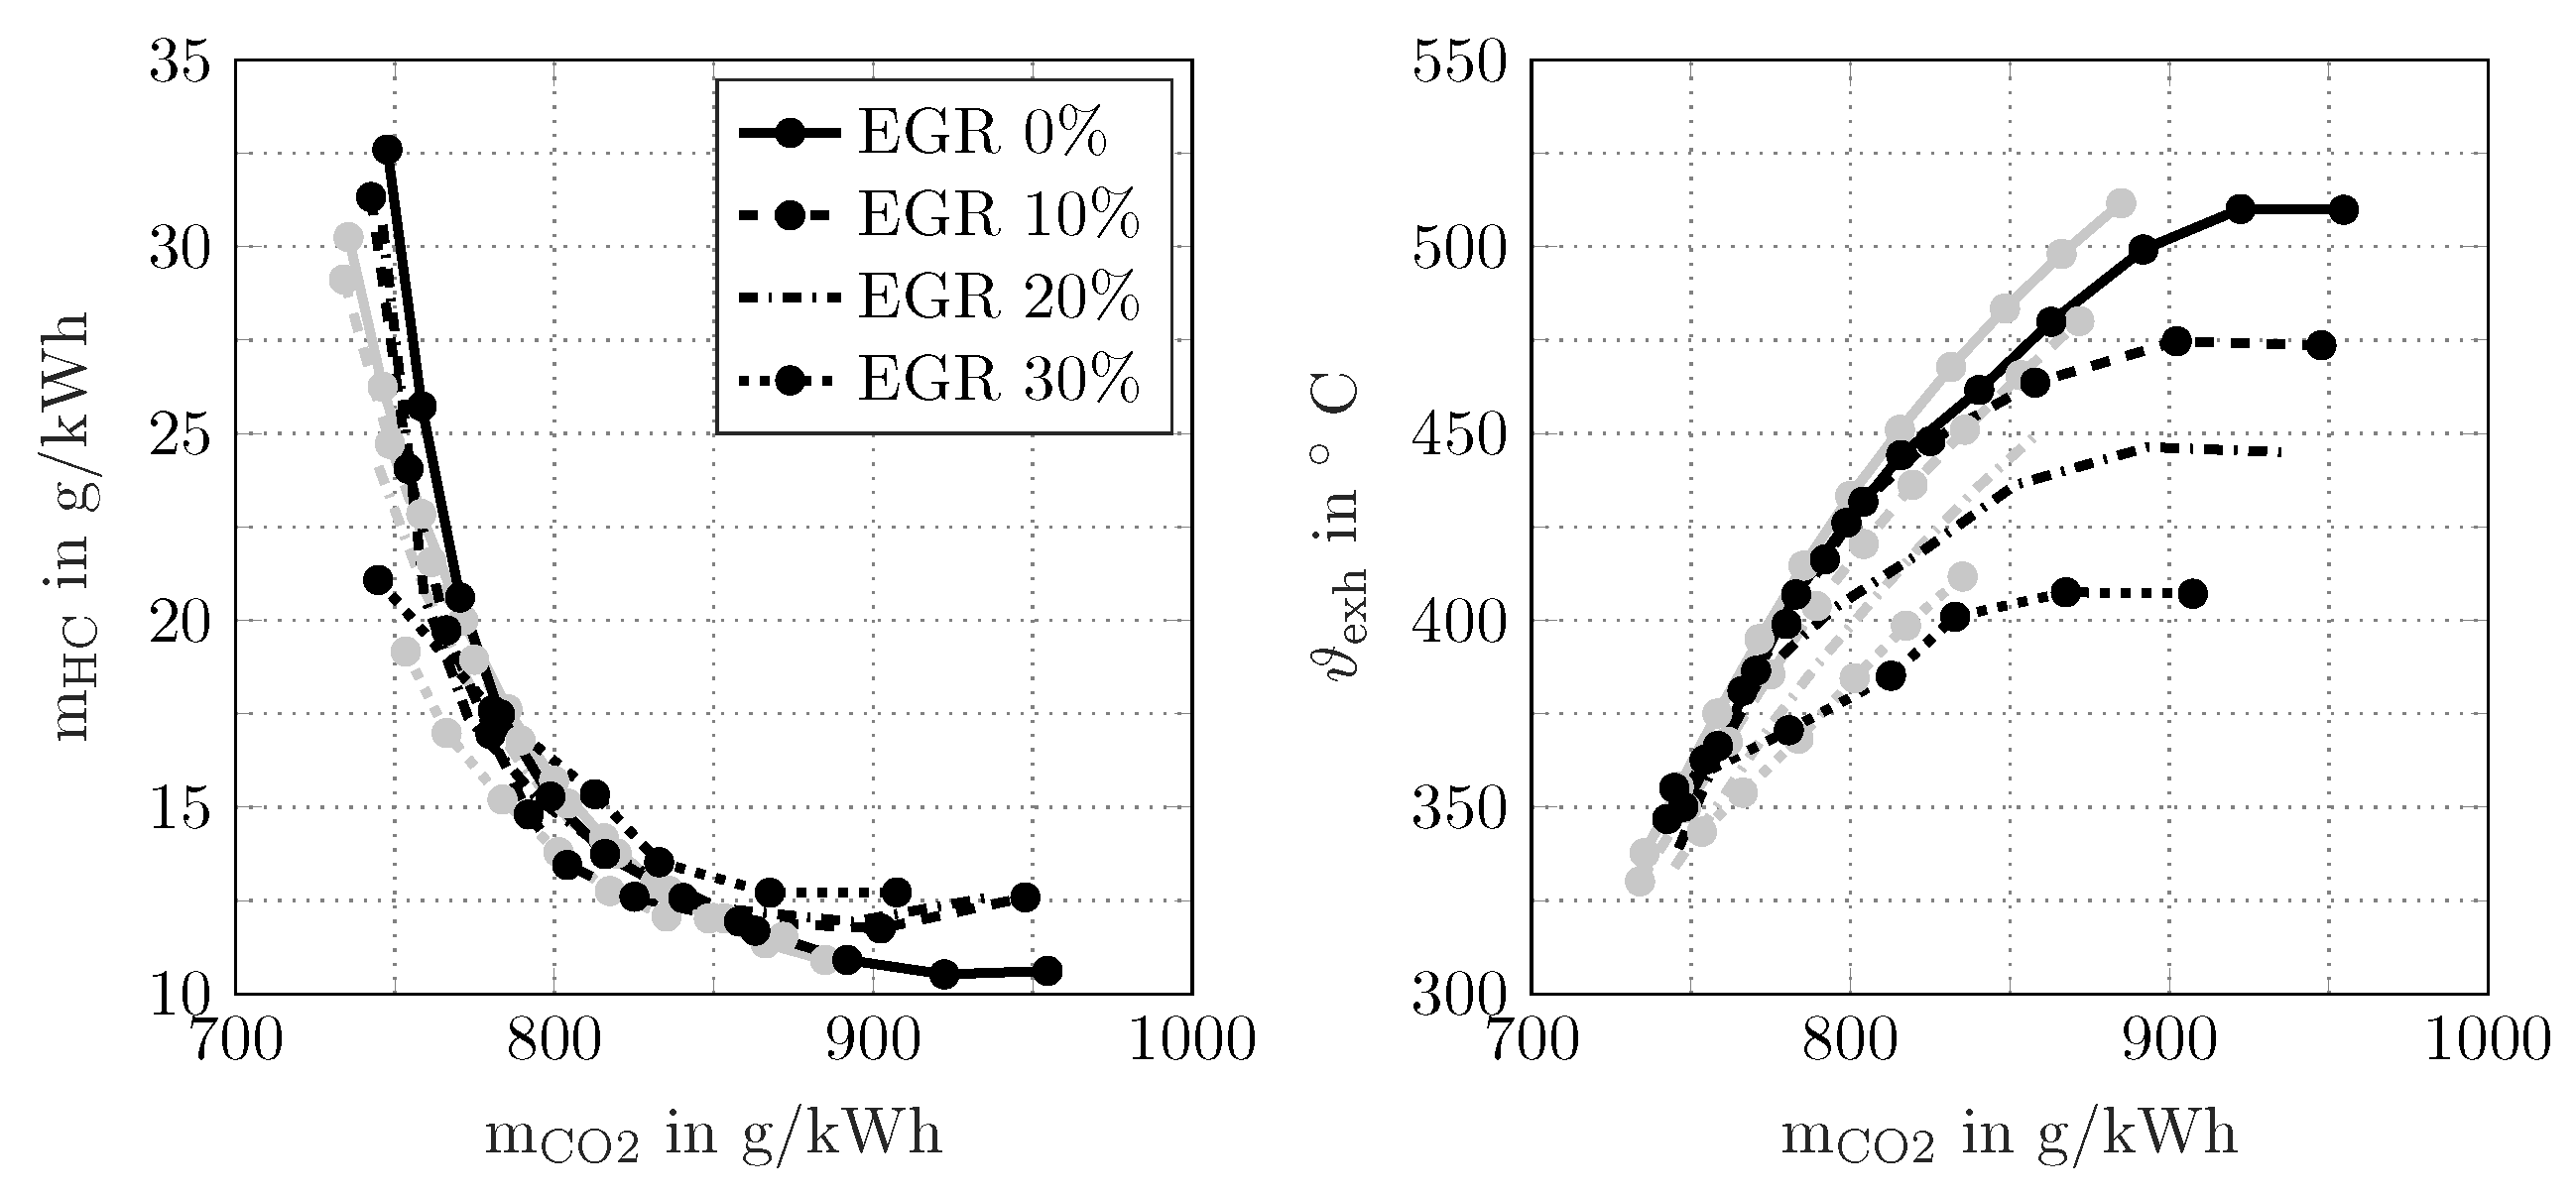
Figure 10.
Measured effects of EGR on nitrogen oxide emissions and engine efficiency (modeled values in grey) at for sweeps at various EGR rates.
Figure 10.
Measured effects of EGR on nitrogen oxide emissions and engine efficiency (modeled values in grey) at for sweeps at various EGR rates.
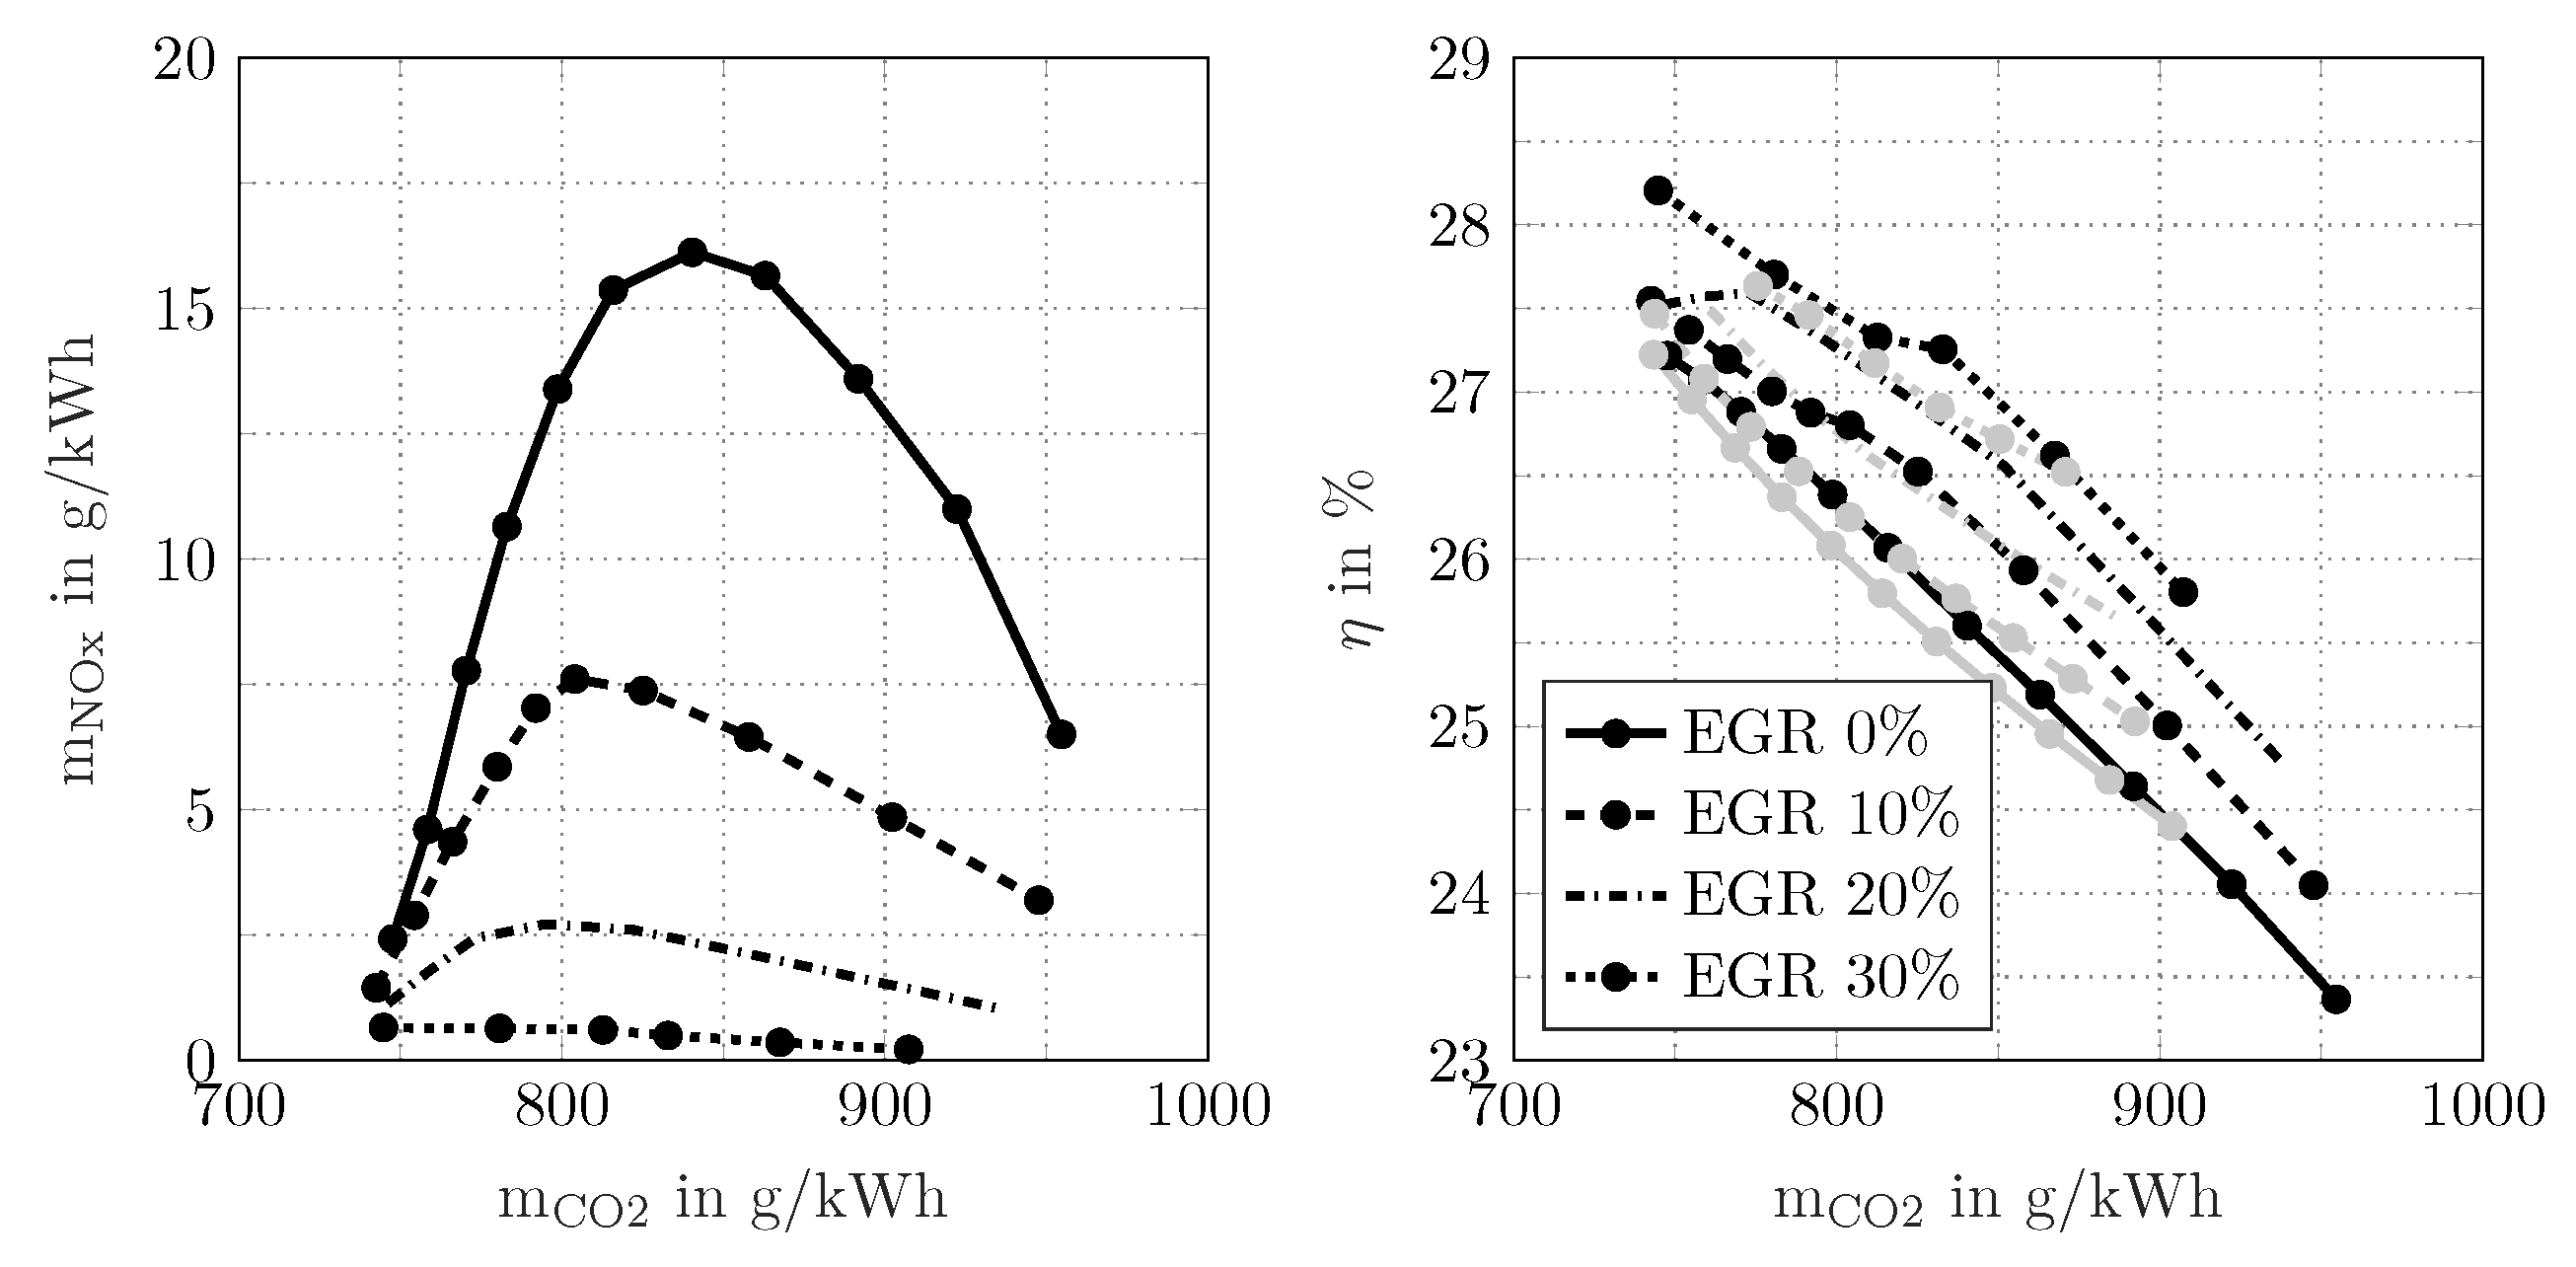
Figure 11.
Each of the three criteria introduces a feasible set spanned by the three input variables brake mean effective pressure , equivalence ratio , and EGR rate .
Figure 11.
Each of the three criteria introduces a feasible set spanned by the three input variables brake mean effective pressure , equivalence ratio , and EGR rate .
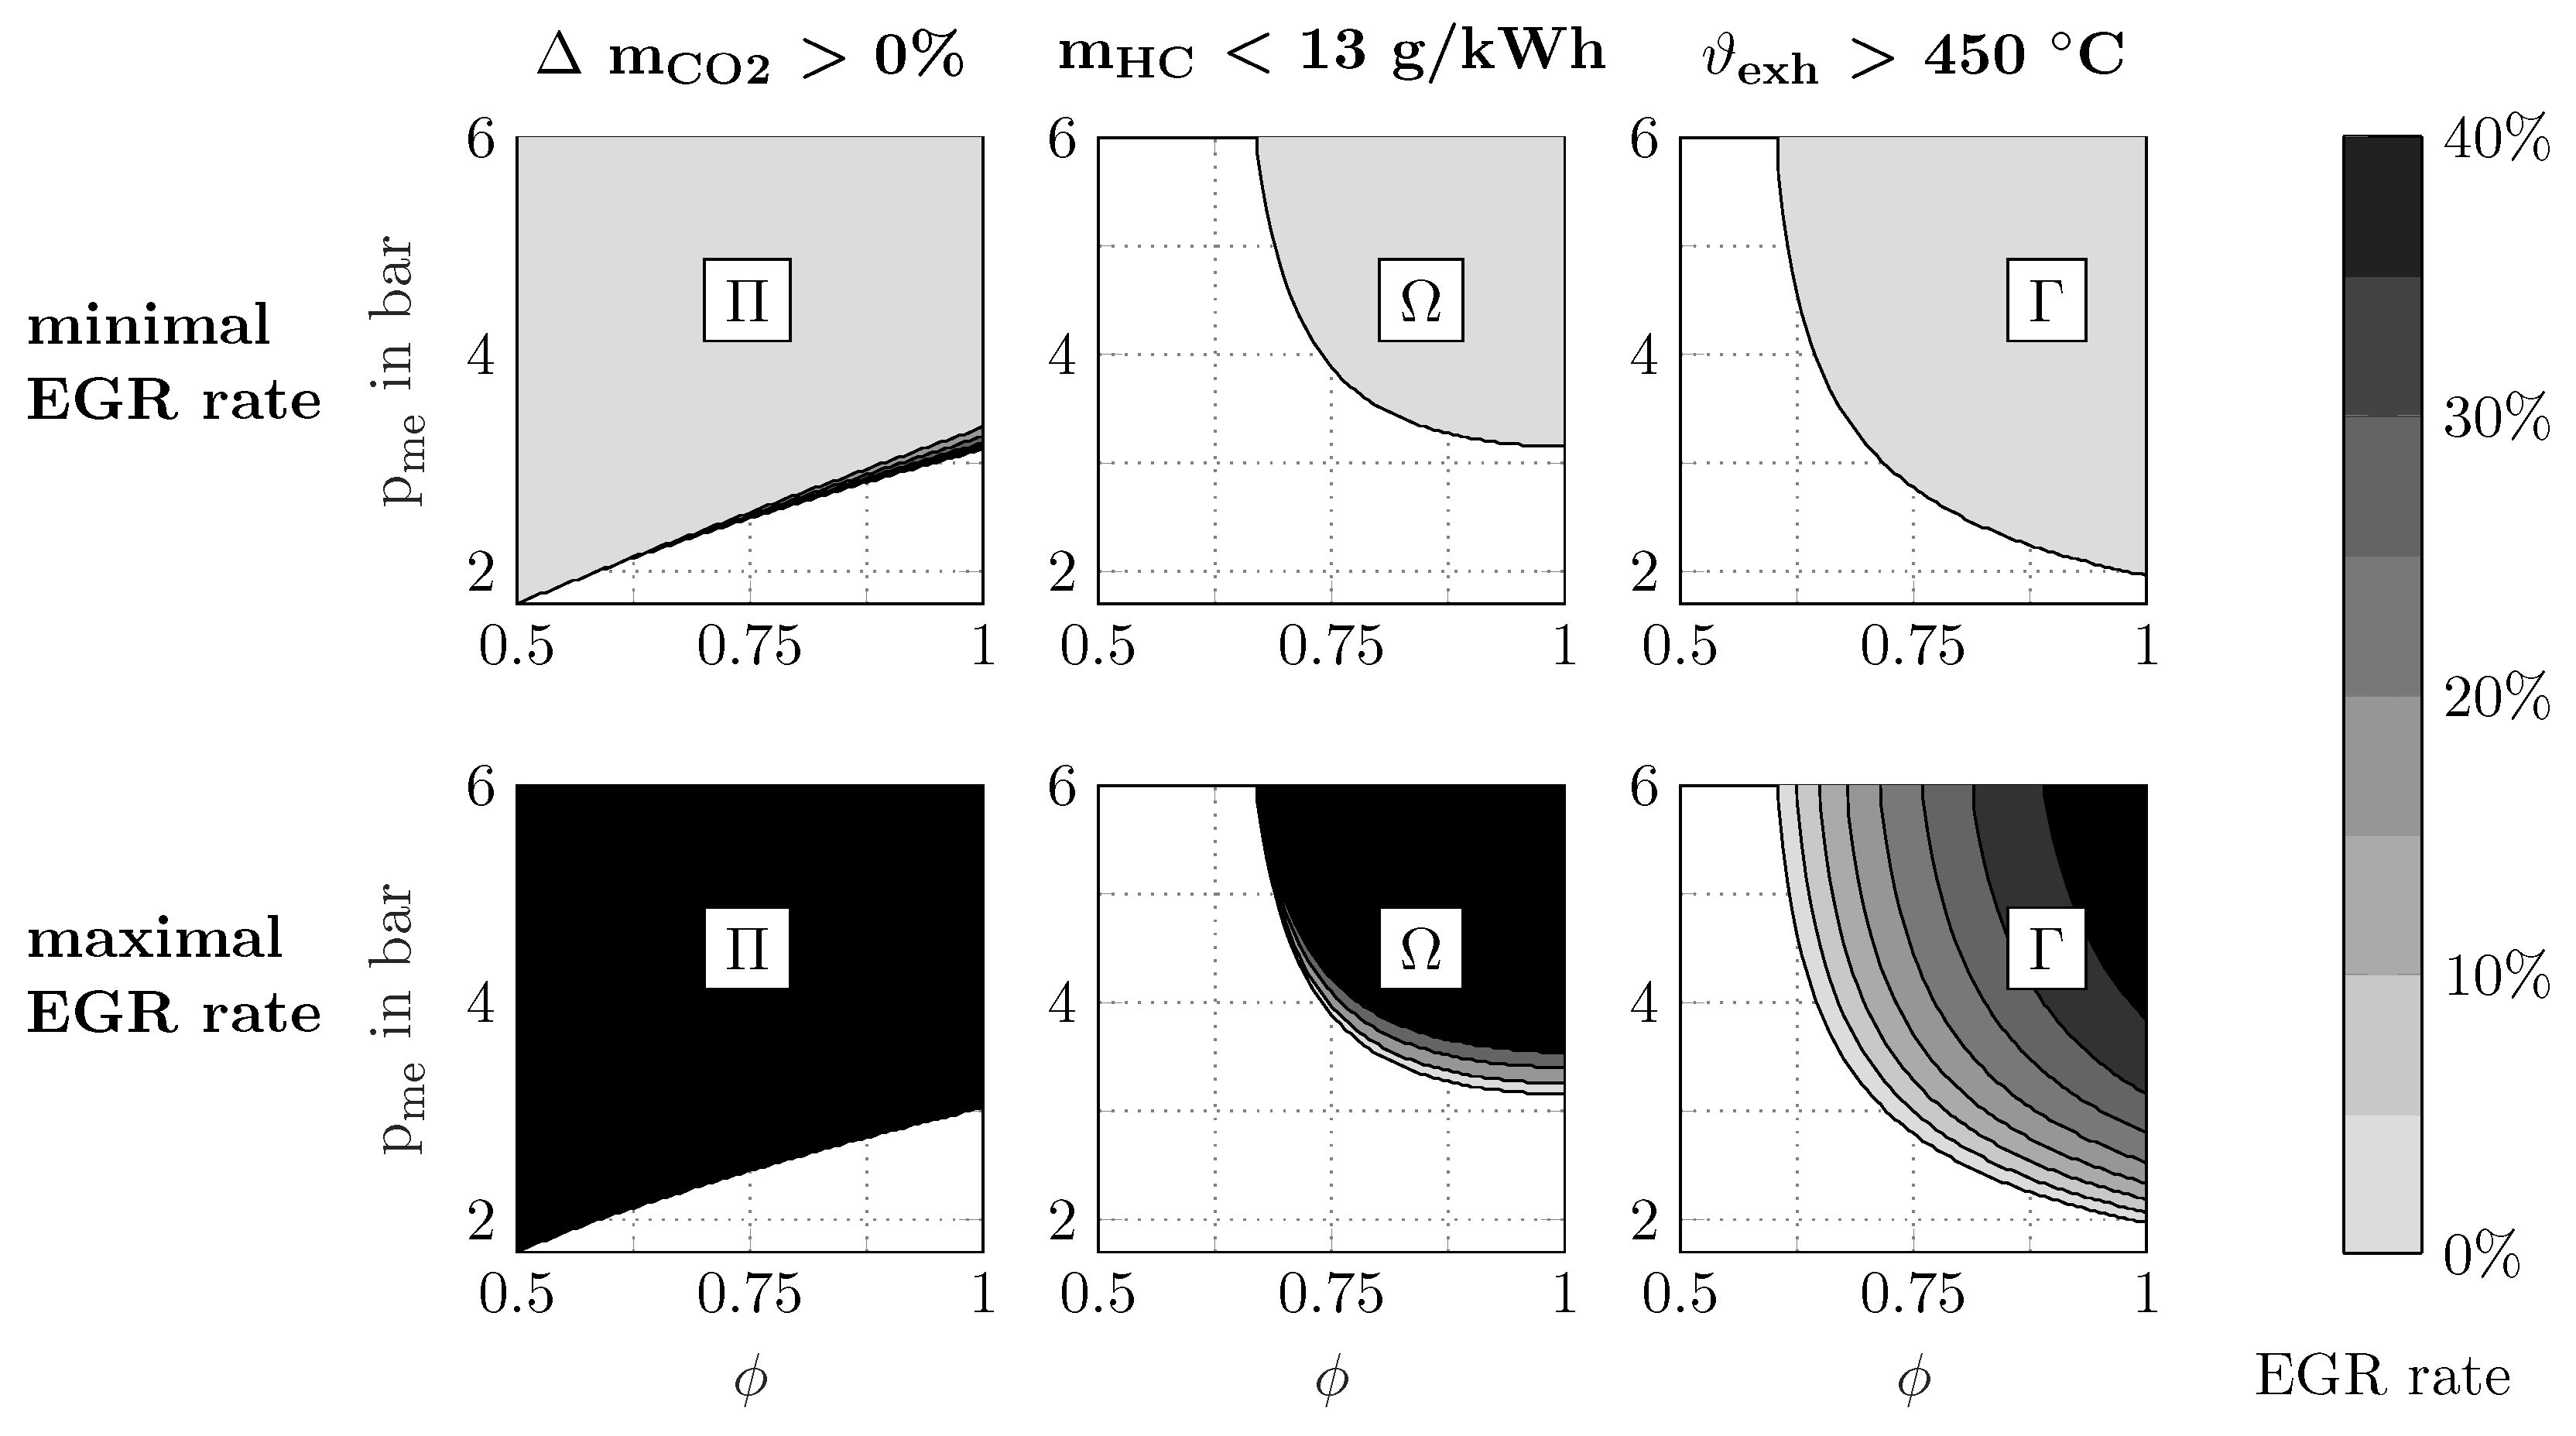
Figure 12.
The globally feasible set , obtained from simulation, is depicted as a function of load , equivalence ratio , and maximum EGR rate. The low-load limit is the lowest feasible load that satisfies the three criteria on , , and . The sets and indicate the boundaries of the sets and at .
Figure 12.
The globally feasible set , obtained from simulation, is depicted as a function of load , equivalence ratio , and maximum EGR rate. The low-load limit is the lowest feasible load that satisfies the three criteria on , , and . The sets and indicate the boundaries of the sets and at .

Figure 13.
Results of simulations of three optimal strategies in terms of minimal HC emission (), minimal CO emission (), and maximum efficiency ().
Figure 13.
Results of simulations of three optimal strategies in terms of minimal HC emission (), minimal CO emission (), and maximum efficiency ().

Table 1.
Low-Load Criteria.
| Description | Symbol | Value |
|---|---|---|
| CO reduction | > | |
| HC engine-out emission | < | |
| Exhaust gas temperature | > |
Table 2.
Geometrical data of the engine.
| Description | Unit | Value |
|---|---|---|
| Displacement | 1986 | |
| Number of cylinders | - | 4 |
| Bore/Stroke | ||
| Compression ratio | - |
Table 3.
Overview of the independent variables.
| Description | Symbol | Value |
|---|---|---|
| Brake mean effective pressure | DOF | |
| Equivalence ratio | DOF | |
| EGR ratio | DOF | |
| Center of combustion | constant | |
| Start of injection (Diesel) | Diesel-minimal |
Table 4.
Input variables.
| Symbol | Description |
|---|---|
| Brake mean effective pressure | |
| Fuel-to-air equivalence ratio | |
| Exhaust gas recirculation rate |
Table 5.
Output variables.
| Symbol | Description |
|---|---|
| CO reduction | |
| HC engine-out emission | |
| Exhaust gas temperature |
Table 6.
Variables modeled.
| Symbol | Description |
|---|---|
| Diesel mass | |
| Gas mass | |
| Diesel mass in the base engine | |
| Gas equivalence ratio | |
| Intake manifold pressure | |
| Pump mean effective pressure |
Table 7.
Affine function parameters of heat capacity.
| Affine Function with | |||
|---|---|---|---|
| Approximation of 5th Order Polynomial Data Provided by [35]. | |||
| Diesel exhaust gas | |||
| Methane exhaust gas | |||
| Air | |||
Table 8.
Physical model parameters.
| Description | Value | Unit | |
|---|---|---|---|
| Friction and gas exchange loss coefficient | |||
| e | Efficiency coefficient | % | |
| Displacement volume | 1968 | ||
| Compression ratio | - | ||
| Lower heating value Diesel | 43 | ||
| Lower heating value of gas | 50 | ||
| Stoichiometric air-to-fuel ratio of Diesel | 14 | ||
| Mean molar weight of exhaust gases | |||
| Mean molar weight of air | |||
| Oxygen concentration of air | 21 | % | |
| R | Universal gas constant | ||
| Heat transfer coefficient | |||
| Nominal intake temperature | 310 | K | |
| Stoichiometric air-to-fuel ratio of methane gas | |||
| CO coefficient of Diesel | |||
| CO coefficient of methane gas | |||
| Mean volumetric efficiency | 80 | % |
Table 9.
Empirical model parameter.
Table 10.
The cost functions of the three strategies considered.
| Name | Goal | |
|---|---|---|
| minimize engine-out HC emissions | ||
| minimize CO emissions | ||
| maximize engine efficiency |
Table 11.
Simplified optimal strategies.
| Strategy | ||
|---|---|---|
| 1 | 0 | |
| <1 | >0 | |
| 1 | >0 |
© 2017 by the authors. Licensee MDPI, Basel, Switzerland. This article is an open access article distributed under the terms and conditions of the Creative Commons Attribution (CC BY) license (http://creativecommons.org/licenses/by/4.0/).
Share and Cite
MDPI and ACS Style
Hutter, R.; Ritzmann, J.; Elbert, P.; Onder, C. Low-Load Limit in a Diesel-Ignited Gas Engine. Energies 2017, 10, 1450. https://doi.org/10.3390/en10101450
AMA Style
Hutter R, Ritzmann J, Elbert P, Onder C. Low-Load Limit in a Diesel-Ignited Gas Engine. Energies. 2017; 10(10):1450. https://doi.org/10.3390/en10101450
Chicago/Turabian StyleHutter, Richard, Johannes Ritzmann, Philipp Elbert, and Christopher Onder. 2017. "Low-Load Limit in a Diesel-Ignited Gas Engine" Energies 10, no. 10: 1450. https://doi.org/10.3390/en10101450
Note that from the first issue of 2016, this journal uses article numbers instead of page numbers. See further details here.