Article

Analysis of Porous Structure Parameters of Biomass Chars Versus Bituminous Coal and Lignite Carbonized at High Pressure and Temperature—A Chemometric Study

Department of Energy Saving and Air Protection, Central Mining Institute, Pl. Gwarków 1, 40-166 Katowice, Poland
*
Author to whom correspondence should be addressed.
Energies 2017, 10(10), 1457; https://doi.org/10.3390/en10101457
Submission received: 28 August 2017 / Revised: 13 September 2017 / Accepted: 18 September 2017 / Published: 21 September 2017
(This article belongs to the Section L: Energy Sources)

Abstract

:
The characteristics of the porous structure of carbonized materials affect their physical properties, such as density or strength, their sorption capacity, and their reactivity in thermochemical processing, determining both their applicability as fuels or sorbents and their efficiency in various processes. The porous structure of chars is shaped by the combined effects of physical and chemical properties of a carbonaceous material and the operating parameters applied in the carbonization process. In the study presented, the experimental dataset covering parameters of various fuels, ranging from biomass through lignite to bituminous coal, and chars produced at 1273 K and under the pressure of 1, 2, 3, and 4 MPa was analyzed with the application of the advanced method of data exploration. The principal component analysis showed that the sample of the highest coal rank was characterized by lower values of parameters reflecting the development of the porous structure of chars. A negative correlation was also observed between the carbon content in a fuel and the evolution of the porous structure of chars at high pressure. The highest total pore volume of chars produced under 1 and 3 MPa and the highest micropore surface area under 3 MPa were reported for a carbonized fuel sample of the highest moisture content.

1. Introduction

The operating parameters of the pyrolysis process, such as temperature, pressure, heating rate, and residence time, have been extensively studied in terms of their effects on the quality and yields of process products [1,2,3,4,5,6]. These parameters have also been reported to influence the swelling behavior and fluidity of a fuel [3,7,8,9,10] as well as reactivity of the resulting chars [4,9,11,12,13]. In some studies, the properties of the porous structure of chars, reflected in the total pore volume, pore area, and pore size distribution, were studied, since the shape and interconnections between pores significantly influence the physical properties of a material, such as its density, mechanical strength, and sorption capacity as well as thermal conductivity and mass flow in thermochemical processing [14,15]. The influence of pyrolysis temperature and heating rate [5,16,17,18,19,20,21,22], fuel particle size [17,22,23], as well as physical or chemical pre-treatment of carbonaceous materials [24,25,26,27] on the porous structure of chars has also been reported. In a limited number of studies, the effects of pressure on char development were considered [3,8,9,12,28,29,30]. These were reported to be complex, and also related to other parameters, i.e., coal rank, process temperature, heating rate, and residence time. The rise in pyrolysis pressure was reported to hinder [9,31] or enhance [5,12] the development of the surface area of chars. A trend of increase in the specific surface area of chars with pressure, followed by a decrease with further pressure rise was also observed [5,28,29]. Similarly, the influence of temperature on the development of porous structure of chars presented in the literature is not unambiguous. In general, higher pyrolysis temperature was observed to result in a higher value of the specific surface area and total pore volume [21,22]. Some studies, however, showed that the development of the micropore volume or area, the specific surface area, and the total pore volume may deteriorate when a certain pyrolysis temperature value is exceeded [13,21,26,30]. These relations may be even less certain when a joint effect of elevated temperature and pressure is to be considered. In the study presented, the combined effects of high pressure and temperature on the evolution of char porosity was analyzed on the basis of the experimental results, and with the application of a chemometric method of data exploration. Various carbonaceous materials, ranging from bituminous coal through lignite to biomass, were tested in order to take into account the influence of a parent material composition on the porous structure of carbonized materials. The study presented is considered to narrow the research gap defined above, and to contribute to the studies on properties of carbonized materials produced under pressure in slow pyrolysis conditions, applicable in thermochemical processing and sorption processes.

2. Materials and Methods

2.1. Materials

Fuel samples tested included lignite provided from Sieniawa and Turow deposits (objects 1 and 2), biomass samples of Salix Viminalis and Spartina Pectinata (objects 3 and 4), and bituminous coals acquired from coal mines of Katowice Coal Holding JSC and Polish Mining Group (objects 5 and 6). The samples were ground, sieved to the fraction below 200 μm, and their physical and chemical parameters in analytical state were determined with the application of the relevant standardized methods (see Table 1).
Chars were produced with the application of a high-pressure thermogravimetric analyzer with the magnetic suspension balance mechanism (Rubotherm GmbH, Bochum, Germany) (see Figure 1). The analyzer enables thermogravimetric measurements on samples that are approximately two orders of magnitude larger than conventional thermogravimetric analyzers under atmospheric or pressurized conditions. It is equipped with an automatic control and indicating system, including automated gas dosing, data acquisition, and recording. A fuel sample of 1 g was pressurized in the argon atmosphere to 1, 2, 3, or 4 MPa, heated with the heating rate of 20 K/min to 1273 K, and processed under the final pressure and temperature conditions for 5 h. Relatively low heating rate and long residence time were applied, representing in situ coal processing conditions, and slow pyrolysis conditions applicable in the production of carbonized materials for thermochemical conversion or sorption purposes.

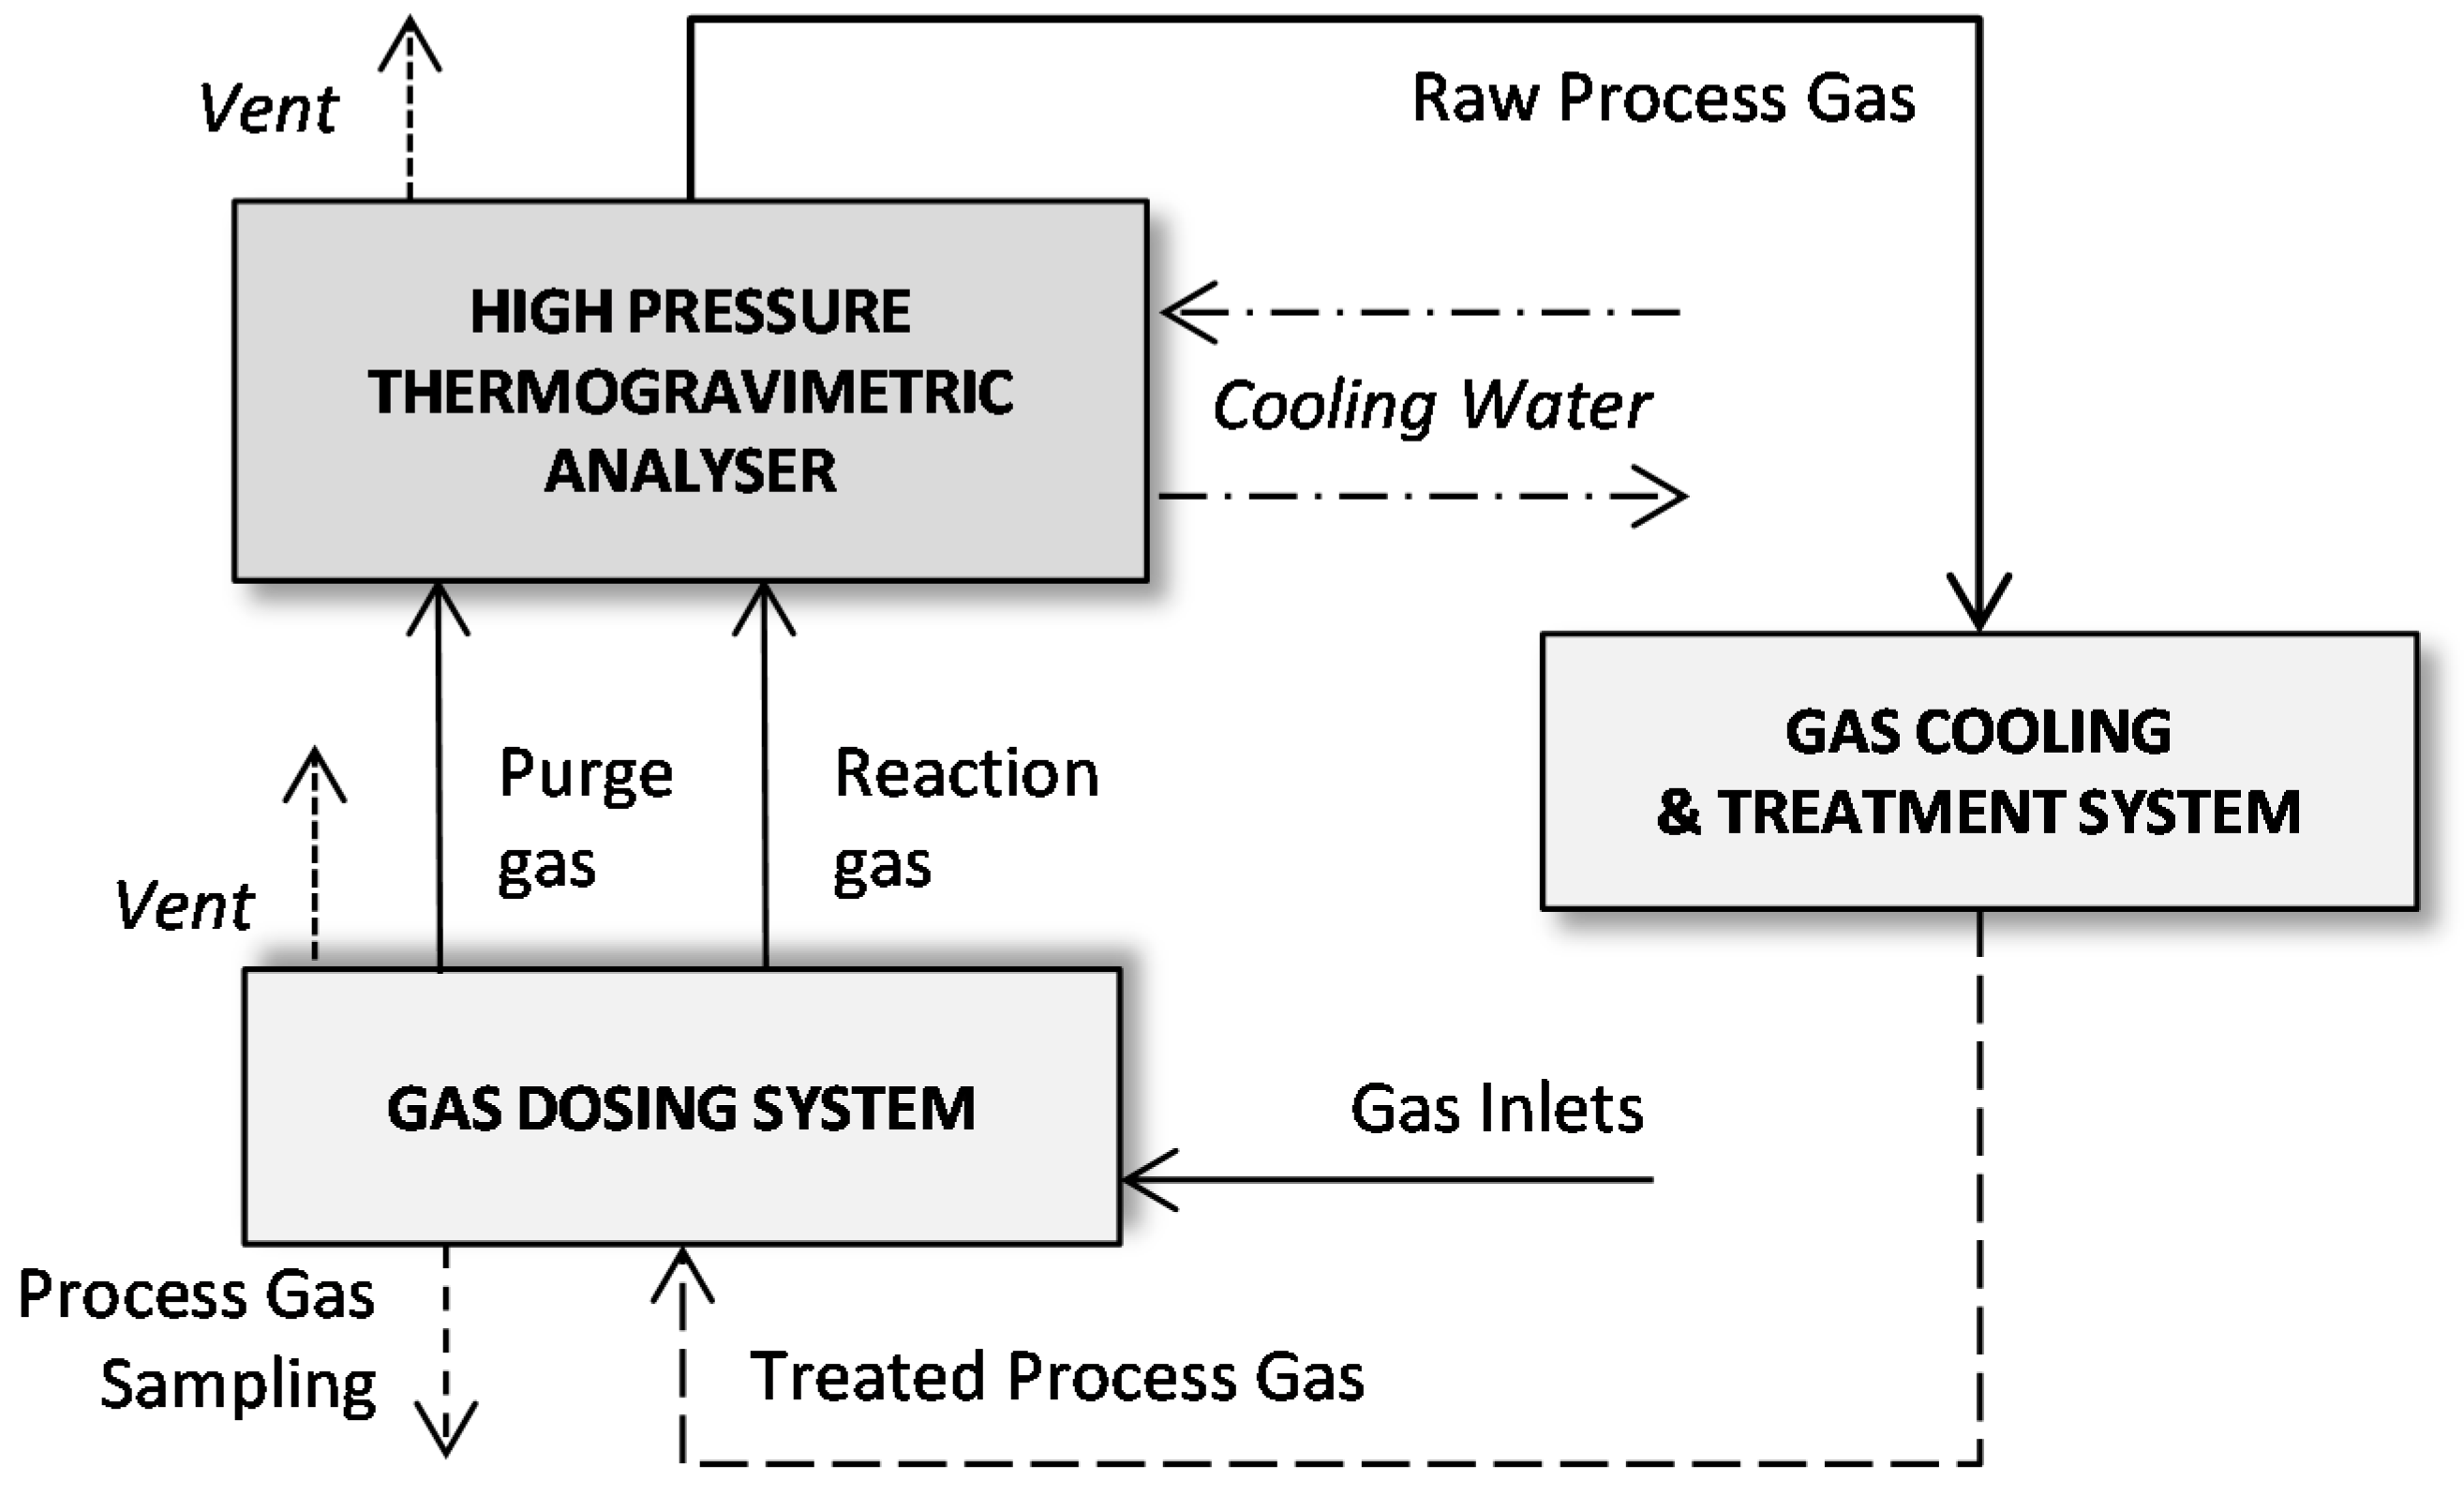
2.2. Porous Structure Characterization

Chars were crushed and sieved to the fraction below 200 μm and degassed under vacuum at 393 K overnight [15]. The porous structure characterization in a wide range of meso- and micropores was performed with the application of the Autosorb iQ analyzer (Quantachrome Instruments, Boynton Beach, FL, USA) equipped with a high vacuum system with a turbomolecular pump and a low-pressure transducer [32]. A wide range of meso- and micropores (diameter of 0.35–40 nm) was characterized qualitatively and quantitatively in a single measurement. The nitrogen sorption isotherm data at 77 K was applied in the determination of the specific surface area based on the multipoint Brunauer-Emmett-Teller (BET) method [33], pore size distribution based on the Density Functional Theory (DFT) method [34], and micropore volume and surface area based on the V-t-deBoer method [35]. The total pore volume was quantified as the volume adsorbed at the relative pressure of 0.99.

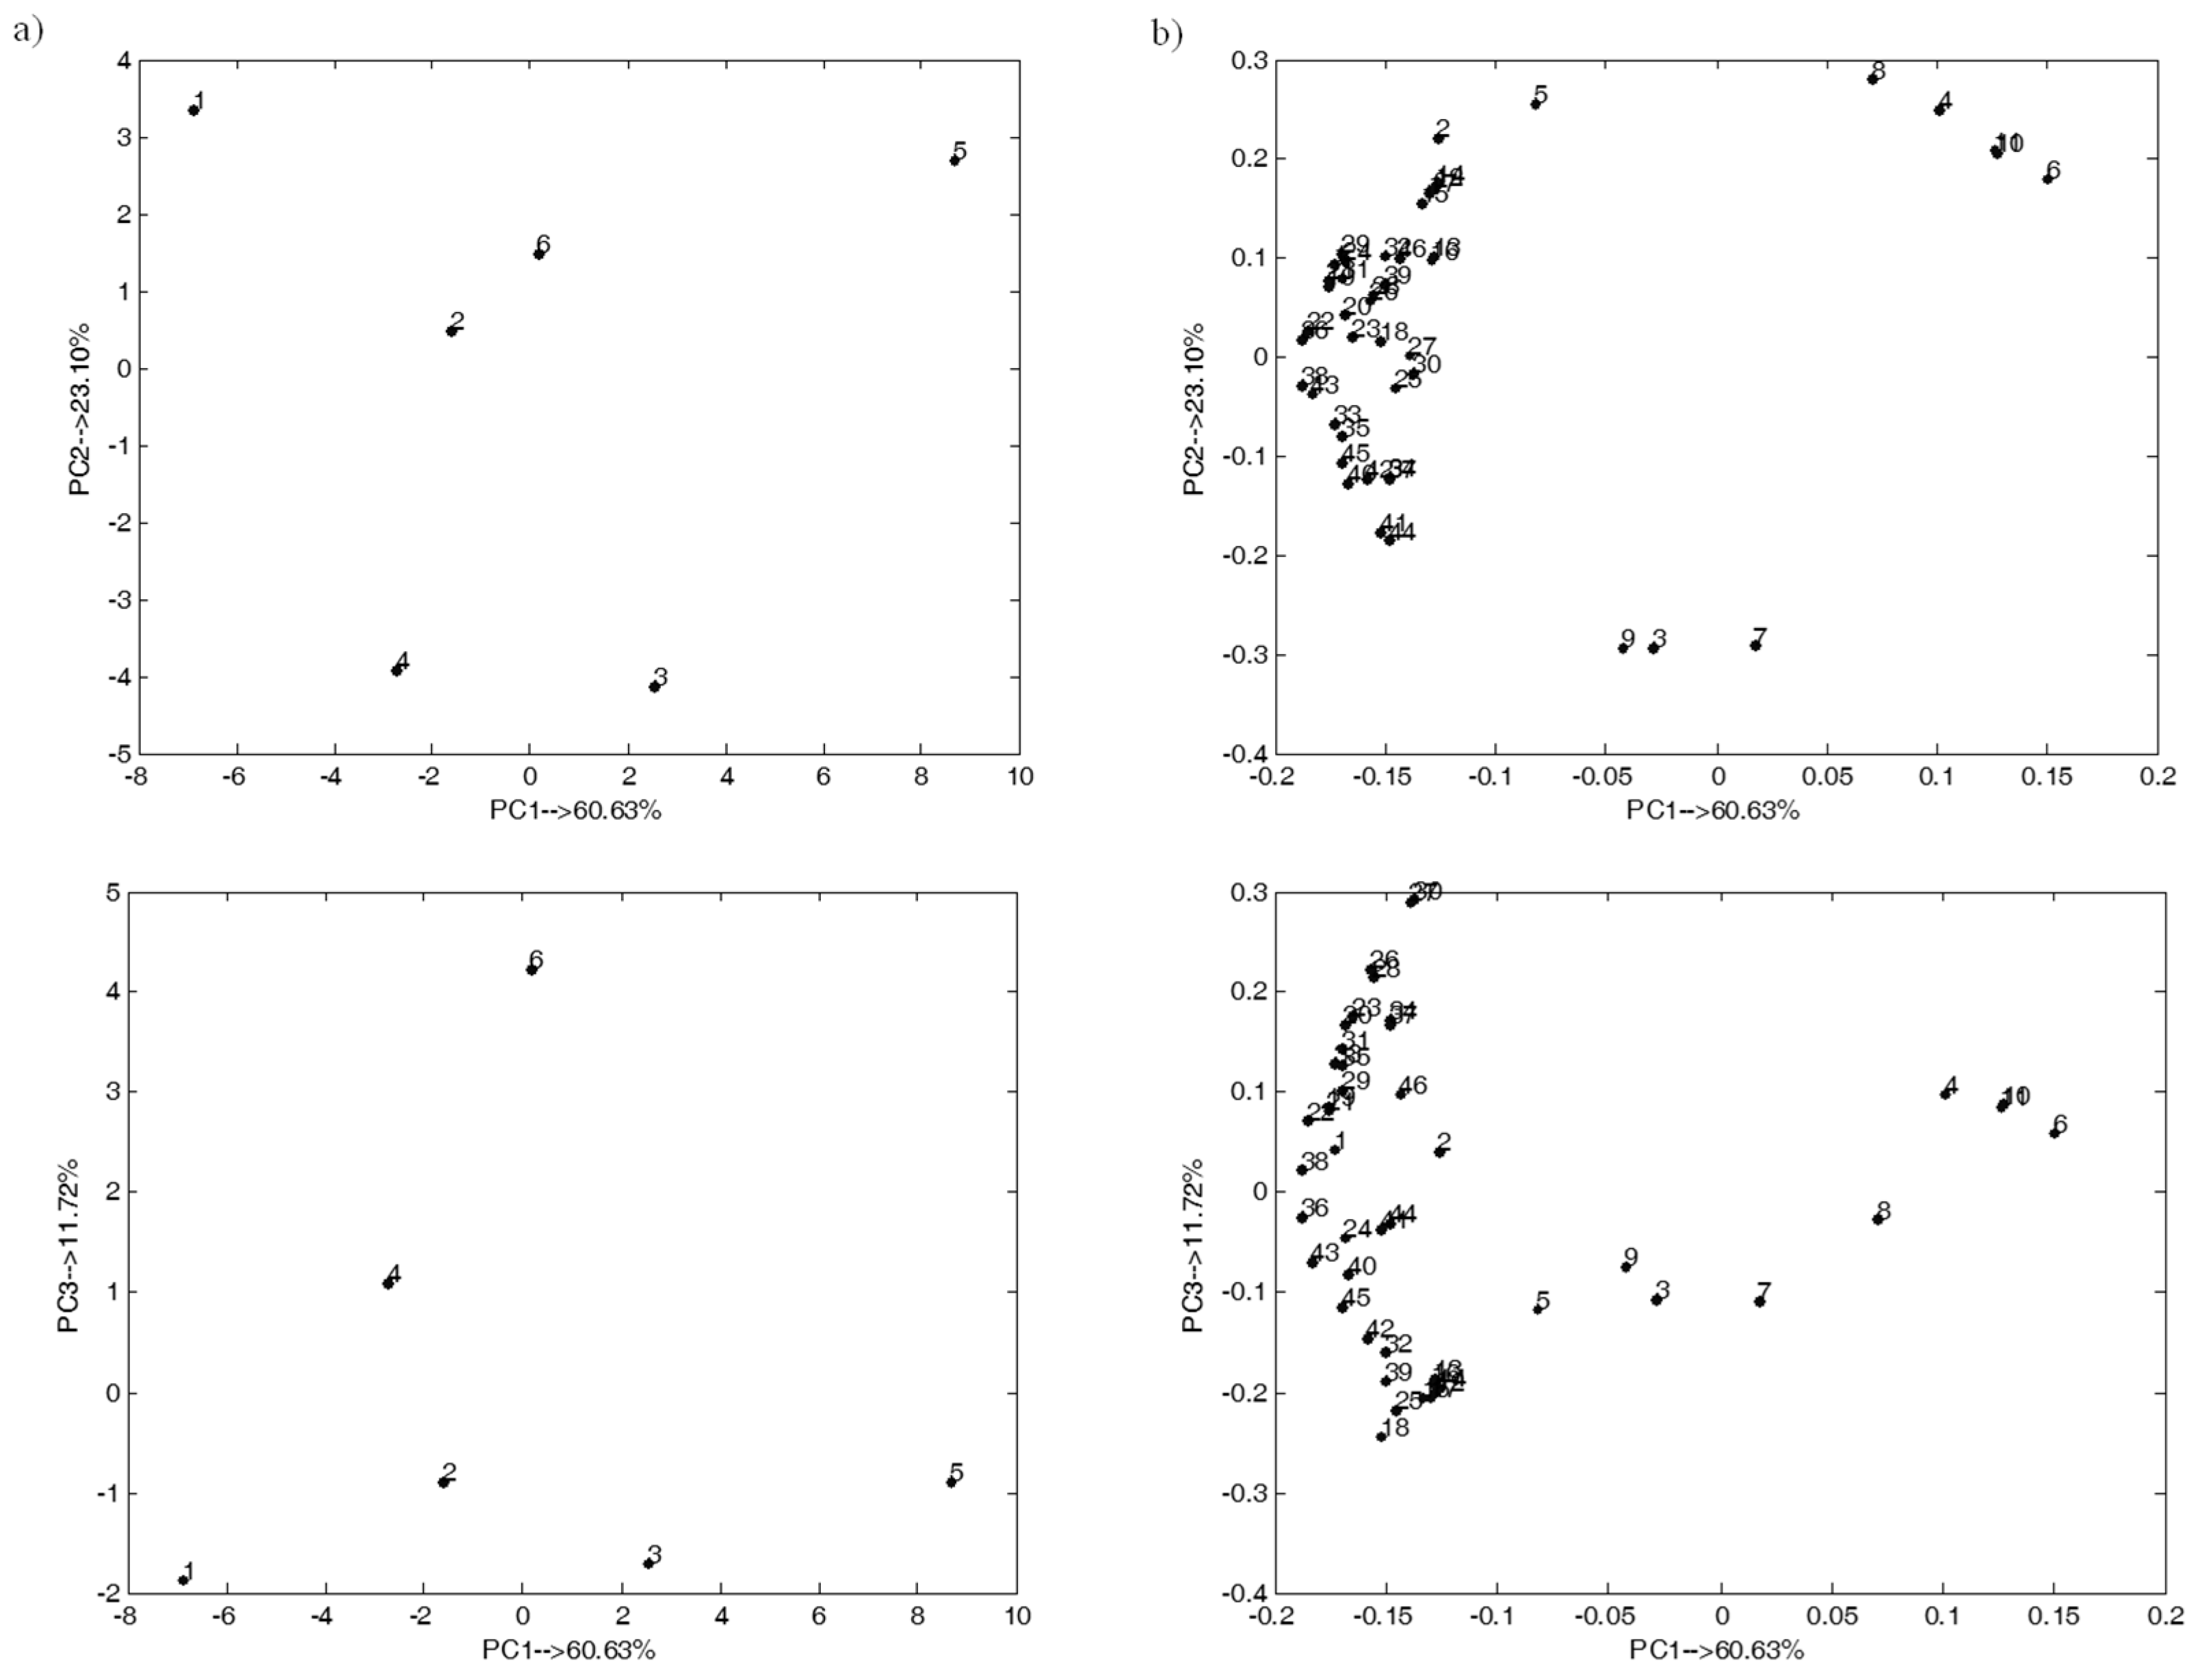
2.3. Exploratory Analysis of the Studied Multivariate Dataset

In the chemometric analysis of the experimental data, principal component analysis (PCA) was applied [36,37,38,39,40]. It is one of the exploration methods most commonly applied in multivariate data analysis. PCA allows reducing the data dimensionality, and enables its visualization and interpretation. It decomposes the initial data organized in a matrix X(m × n) into two matrices, S(m × fn) and D(n × fn), called the score and loading matrices, respectively:
X(m × n) = S(m × fn) ∙ D’(n × fn) + R(m × n)
where m and n denote the number of objects and parameters, respectively, fn denotes the number of significant factors called the principal components (PCs), and R is the residuals matrix. The score and loading matrices are orthogonal. The columns of the score matrix and rows of the loading matrix are called the principal components (PC), or eigenvectors. Each PC is constructed as a linear combination of original variables with weights maximizing the description of the variance of the data (i.e., S = XD’). Moreover, the sum of the squared elements of each PC is called an eigenvalue and represents the portion of the variance described by the corresponding PC. Because the first PC describes the largest amount of the data variance, the associated eigenvalue also has the highest value. The sum of the eigenvalues defines the total variance of the data. Providing that the reduction of data dimensionality is effective, it is possible to apply score vectors and loading vectors (i.e., the columns of a matrix S and rows of matrix D’, respectively) to visualize and interpret the relationships between the objects and the parameters in a matrix X.

2.4. Experimental Dataset

The studied experimental dataset was organized into a matrix X(6 × 46). The rows of the matrix X represent studied fuel samples—objects 1–6, whereas the columns correspond to the studied parameters listed in Table 2. These cover physical and chemical parameters of fuels tested as well as parameters describing the porous structure of chars produced at high temperature and under various pressure conditions. The dataset was centered and standardized before the PCA model was constructed, since it included measurements performed within different magnitude ranges [39].

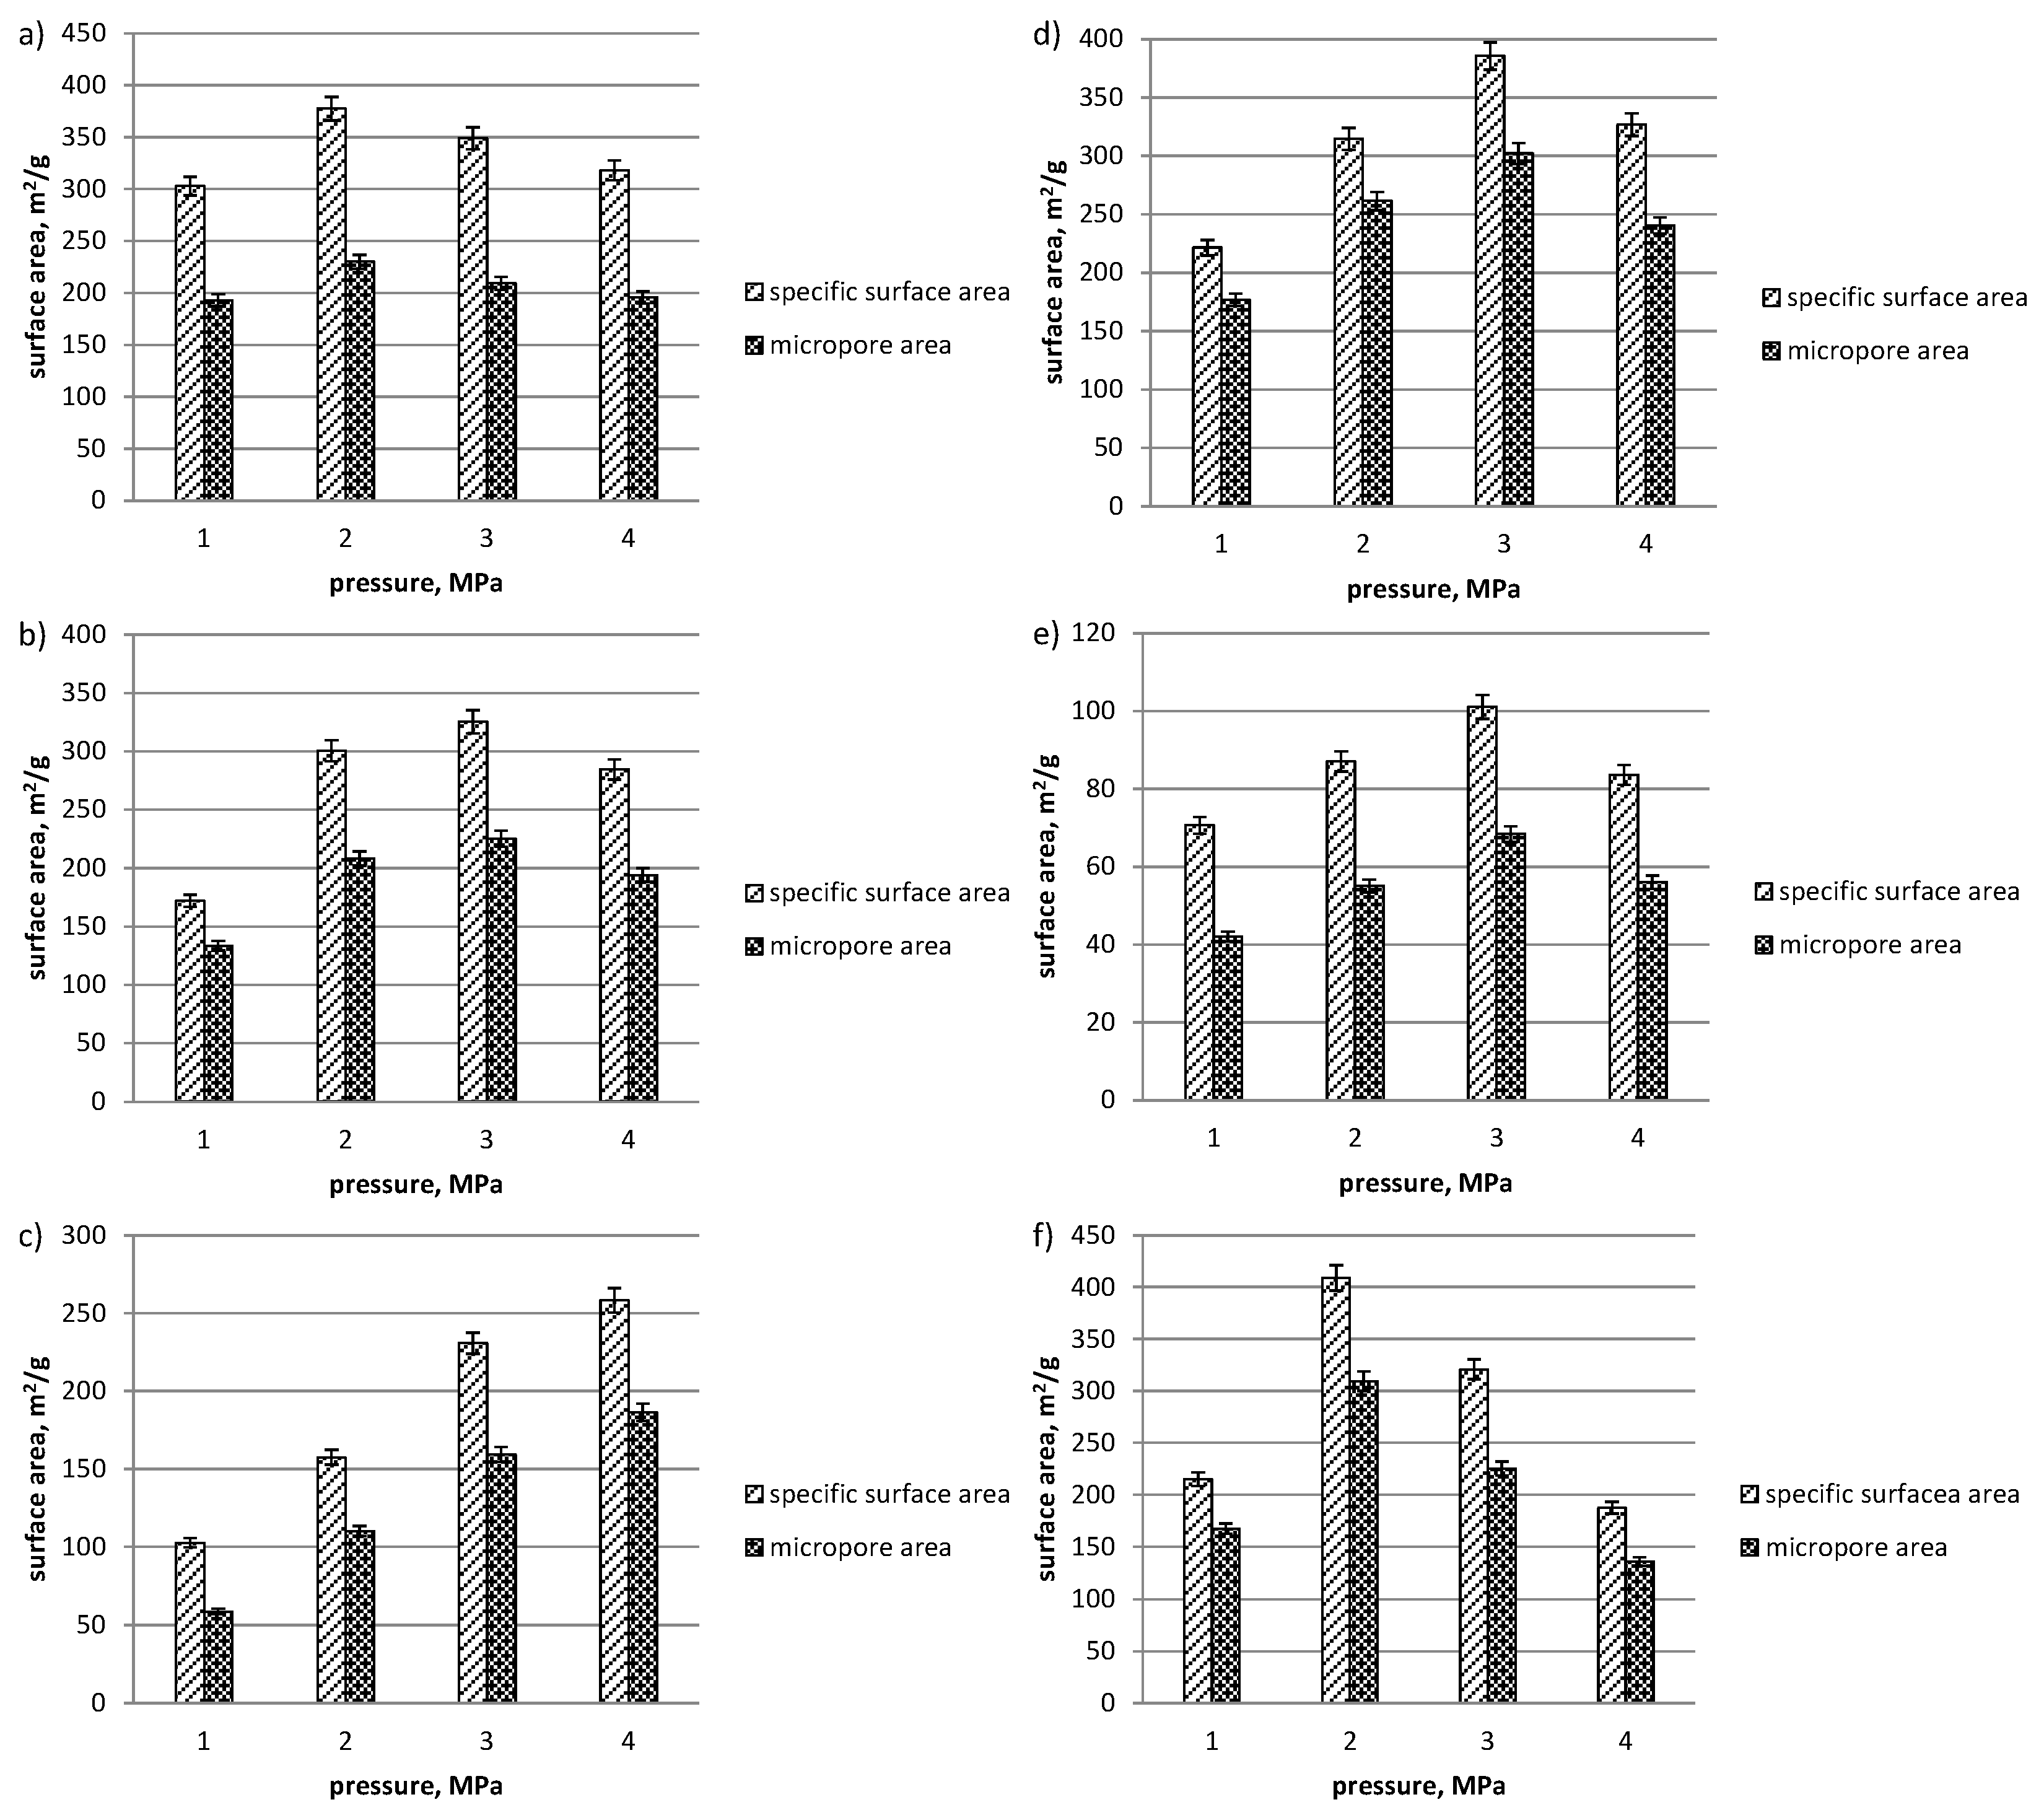
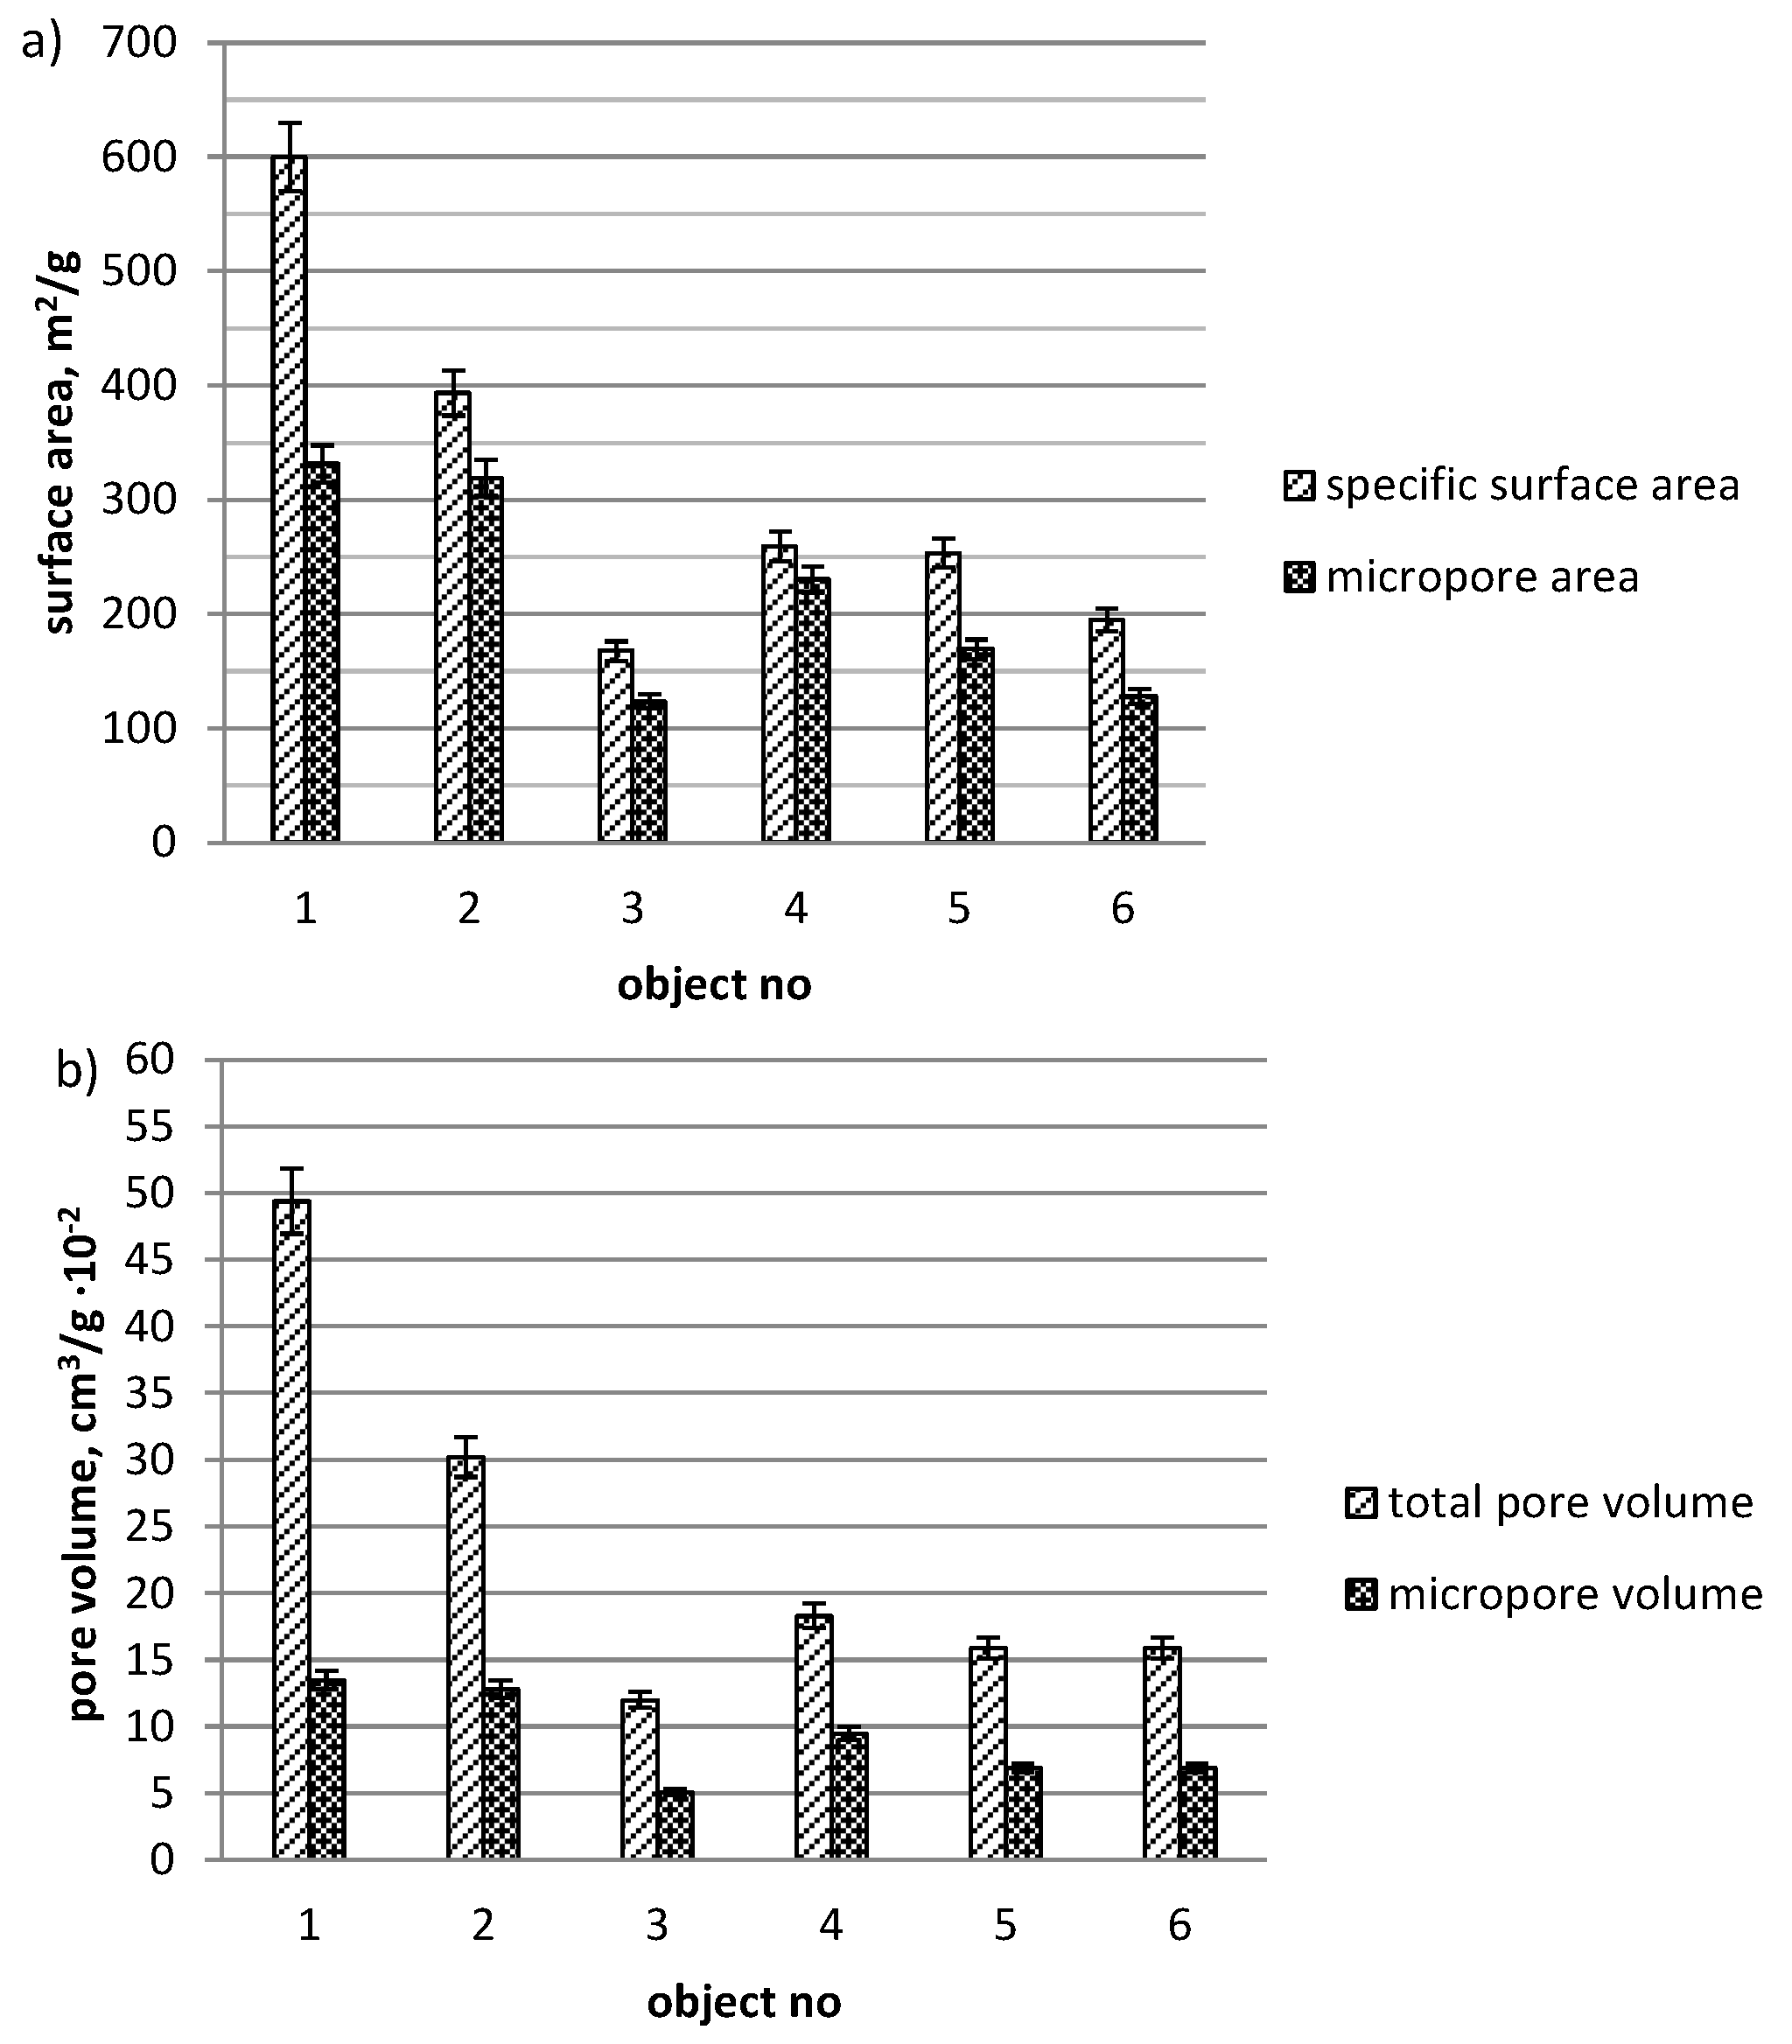
3. Results and Discussion

The effects of pressure applied in pyrolysis on the development of the porous structure of chars were observed for all samples. The values of the specific surface area, micropore volume and area, and the total pore volume are given in Figure 2 and Figure 3, respectively.
The previously observed general trend of enhanced development of porous structure with the increase in pressure to the value specific for a given char was also reported, followed by a decrease in the specific surface area and total pore volume with a further increase in pressure [5,28,29]. Under the atmospheric pressure conditions, the most developed porous structure was characteristic for lignite chars (see Figure 4). The value of the pyrolysis pressure corresponding to the most developed specific surface area and total pore volume of chars varied for various precursors and amounted to 2 or 3 MPa for lignites and bituminous coals, and 3 or 4 MPa for biomass. The highest values of the specific surface area and the total pore volume were reported for bituminous coal char (object 6) and lignite char (object 1) produced under 2 MPa, respectively, and amounted to 409 m2/g and 0.402 cm3/g. The highest increase in the specific surface area and the total pore as well as micropore area and volume of chars with pressure applied in pyrolysis were reported for bituminous coal (object 6) with a pyrolysis pressure of 2 MPa. The values of these parameters doubled when compared to the respective values under atmospheric pressure pyrolysis.
The principal component analysis was applied in identification of the relationships between physical and chemical characteristics of the fuel samples, and the parameters describing porous structure of their chars under various pyrolysis conditions. The PCA model was constructed for the standardized studied data Xc(6 × 46). The data compression was effective and three principal components described 95.45% of the total data variance. The respective score and loading plots are presented in Figure 5.
The first two principal components described 83.73% of the total data variance. Along the PC1, presenting 60.63% of the total data variance, significant variations between objects analyzed could be noticed. The most significant differences were observed between lignite (object 1) and bituminous coal (object 5) and all the remaining fuel samples. Object 1 was characterized by a high content of moisture and ash in a sample (parameters 1 and 2), as well as high values of parameters describing the porous structure of its chars: the specific and micropore surface area, DFT cumulative surface area, total pore volume and micropore volume, DFT method cumulative pore volume and the average pore diameter under 0.1, 1, 2, 3, and 4 MPa (parameters 12–46), as well as a low content of carbon and a low value of heat of combustion and calorific value (parameters 6, 10, and 11). The bituminous coal sample (object 5) was unique mainly because of the highest fixed carbon, carbon, and nitrogen content in a sample (parameters 4, 6, and 8), the highest heat of combustion and calorific value (parameters 10 and 11), and lower values of the remaining parameters. Furthermore, for object 1, the highest total pore volume under 1 and 3 MPa (parameters 22 and 36), micropore surface area under 3 MPa (parameter 34), and DFT method cumulative pore volume under 3 MPa (parameter 38) were observed.
The PC2, which described 23.10% of the total data variance, showed the differences between coal samples (objects 1, 2, 5, and 6) and biomass samples (objects 3 and 4). These differences were observed mainly in terms of the physical and chemical parameters of fuels tested. Lignite and bituminous coal samples (objects 1, 2, 5, and 6) were characterized by relatively higher values of ash, fixed carbon, sulfur, and nitrogen content in a sample (parameters 2, 4, 5, and 8) and lower values of volatiles, hydrogen, and oxygen content in a sample (parameters 3, 7, and 9) than the biomass samples.
The PC3, describing 11.72% of the total data variance, also showed the uniqueness of object 6, which could be attributed to the highest micropore area and volume under 2 MPa (parameters 27 and 30).
The loading plots revealed a positive correlation between: parameters 6, 10, 11 (carbon content in a sample, heat of combustion, and calorific value); parameters 3 and 9 (volatiles and oxygen content in a sample); parameters 41 and 44 (micropore surface area and volume of chars under 4 MPa); parameters 34, 37, 40, 42, and 45 (micropore surface area and volume of chars under 3 MPa, specific surface area of chars at 4 MPa, DFT cumulative surface area, and volume under 4 MPa); parameters 33 and 35 (specific surface area and DFT cumulative surface area under 3 MPa); parameters 38 and 43 (DFT method cumulative pore volume under 3 MPa and the total pore volume under 4 MPa); parameters 22 and 36 (the total pore volume of chars under 1 and 3 MPa); parameters 19, 21, 24, and 29 (specific surface area and cumulative surface area of chars under 1 MPa, DFT method cumulative pore volume and the total pore volume under 2 MPa); parameters 14, 15, and 17 (DFT cumulative surface area, the total pore volume, and DFT method cumulative pore volume under 0.1 MPa); parameters 27 and 30 (micropore surface area and volume under 2 MPa); and parameters 12–17 (specific surface area, micropore surface area, DFT cumulative surface area, the total pore volume, micropore volume, and DFT method cumulative pore volume under 0.1 MPa).
Furthermore, a negative correlation was observed between: parameters 6, 10, 11 (carbon content in a sample, heat of combustion, and calorific value) and parameters 41 and 44 (micropore surface area and volume under 4 MPa); parameters 6, 10, and 11 (carbon content in a sample, heat of combustion, and calorific value) and parameters 34, 37, 40, 42, and 45 (micropore surface area and volume under 3 MPa, specific surface area, and DFT cumulative surface area and volume under 4 MPa); parameters 6, 10, 11 (carbon content in a sample, heat of combustion, and calorific value) and parameters 33 and 35 (specific surface area and DFT cumulative surface area under 3 MPa); parameter 4 (fixed carbon content in a sample) and parameters 41 and 44 (micropore surface area and volume under 4 MPa); parameter 4 (fixed carbon content in a sample) and parameters 12–17 (specific, micropore, and DFT cumulative surface area, total pore volume, micropore volume, and DFT method cumulative pore volume under 0.1 MPa); parameter 4 (fixed carbon content in a sample) and parameters 18, 25, 32, 39, 42, and 45 (the average pore diameter under 0.1, 1, 2, and 3 MPa, DFT cumulative surface area, and volume under 4 MPa).

4. Conclusions

The analysis of the experimental dataset with the application of the advanced data exploration method enabled us to trace the relationships between the physical and chemical parameters of parent fuels, pyrolysis conditions, and properties of the porous structure of bituminous coal, lignite, and biomass carbonized at 1273 K and under the pressure of 1, 2, 3, and 4 MPa. The sample of the highest coal rank (bituminous coal—object 5) was characterized by relatively lower values of parameters reflecting the development of porous structure of chars than the remaining fuel samples. The negative correlation was observed between carbon content in a fuel and porous structure features, such as the micropore surface area and volume, as well as the specific surface area at 3 and 4 MPa. The samples of higher fixed carbon content were also characterized by lower values of the micropore surface area and volume at 4 MPa as well as lower values of the specific surface area, micropore area and volume, and the total pore volume at atmospheric pressure. Furthermore, the highest total pore volume of chars produced under 1 and 3 MPa and the highest micropore surface area under 3 MPa were reported for a carbonized fuel sample of the highest moisture content.

Acknowledgments

This work was supported by the Ministry of Science and Higher Education, Poland [10020217].

Author Contributions

A.S. and N.H. conceived and designed the experiments; N.H. performed the experiments; A.S. and N.H. analyzed the data; A.S. developed the models; A.S. and N.H. wrote the paper.

Conflicts of Interest

The authors declare no conflict of interest. The founding sponsors had no role in the design of the study; in the collection, analyses, or interpretation of data; in the writing of the manuscript, and in the decision to publish the results.

References

  1. Acevedo, B.; Barriocanal, C. The influence of the pyrolysis conditions in a rotary oven on the characteristics of the products. Fuel Process. Technol. 2015, 131, 109–116. [Google Scholar] [CrossRef]
  2. Fatemi, M. Effect of pressure on pyrolysis on a sub-bituminous coal in an entrained flow reactor. Prepr. Pap. Am. Chem. Soc. Div. Fuel Chem. 1987, 32, 117–124. [Google Scholar]
  3. Lee, C.W.; Scaroni, A.W.; Jenkins, R.G. Effect of pressure on the devolatilization and swelling behavior of a softening coal during rapid heating. Fuel 1991, 70, 957–965. [Google Scholar] [CrossRef]
  4. Solomon, P.R.; Fletcher, T.H. Impact of coal pyrolysis on combustion. Symp. Int. Combust. 1994, 25, 463–474. [Google Scholar] [CrossRef]
  5. Tremel, A.; Haselsteiner, T.; Nakonz, M.; Spliethoff, H. Coal and char properties in high temperature entrained flow gasifier. Energy 2012, 45, 176–182. [Google Scholar] [CrossRef]
  6. Wall, T.F.; Liu, G.; Wu, H.; Roberts, D.G.; Benfell, K.E.; Gupta, S.; Lucas, J.A.; Harris, D.J. The effects of pressure on coal reactions during pulverised coal combustion and gasification. Prog. Energy Combust. 2002, 28, 405–433. [Google Scholar] [CrossRef]
  7. Gale, T.K.; Bartholomew, C.H.; Fletcher, T.H. Decreases in the swelling and porosity of bituminous coals during devolatilization at high heating rates. Combust. Flame 1995, 100, 94–100. [Google Scholar] [CrossRef]
  8. Khan, M.R.; Jenkins, R.G. Swelling and plastic properties of coal devolatilized at elevated pressures: An examination of the influence of coal type. Fuel 1986, 65, 725–731. [Google Scholar] [CrossRef]
  9. Lee, C.W.; Jenkins, R.G.; Schobert, H.H. Structure and reactivity of char from elevated pressure pyrolysis of Illinois no. 6 bituminous coal. Energy Fuel 1992, 6, 40–47. [Google Scholar] [CrossRef]
  10. Xi, J.; Liang, J.; Sheng, X.; Shi, L.; Li, S. Characteristics of lump lignite pyrolysis and the influence of temperature on lignite swelling in underground coal gasification. Anal. Appl. Pyrolysis 2016, 117, 228–235. [Google Scholar] [CrossRef]
  11. Basu, P. Biomass Gasification, Pyrolysis and Torrefaction; Academic Press: Oxford, UK, 2013. [Google Scholar]
  12. Benfell, K.E.; Liu, G.; Roberts, D.G.; Harris, D.J.; Lucas, J.A.; Bailey, J.G. Modelling char combustion: The influence of parent coal petrography and pyrolysis pressure on the structure and intrinsic reactivity of its char. Proc. Combust. Inst. 2000, 28, 2233–2241. [Google Scholar] [CrossRef]
  13. Liu, T.F.; Fang, Y.T.; Wang, Y. An experimental investigation into the gasification reactivity of chars prepared at high temperatures. Fuel 2008, 87, 460–466. [Google Scholar] [CrossRef]
  14. Duman, G.; Uddin, M.A.; Yanik, J. The effect of char properties on gasification reactivity. Fuel Process. Technol. 2014, 18, 75–81. [Google Scholar] [CrossRef]
  15. Rouquerol, J.; Avnir, D.; Fairbridge, C.W.; Everett, D.H.; Haynes, J.H.; Pernicone, N.; Ramsay, J.D.F.; Sing, K.S.W.; Unger, K.K. Recommendations for the characterization of porous solids. Pure Appl. Chem. 1994, 66, 1739–1758. [Google Scholar] [CrossRef]
  16. Heidari, A.; Stahl, R.; Younesi, H.; Rashidi, A.; Troeger, N.; Ghoreyshi, A.A. Effect of process conditions on product yield and composition of fast pyrolysis of Eucalyptus grandis in fluidized bed reactor. J. Ind. Eng. Chem. 2014, 20, 2594–2602. [Google Scholar] [CrossRef]
  17. Huang, H.; Wang, Y.; Cannon, F.S. Pore structure development of in-situ pyrolyzed coals for pollution prevention in iron foundries. Fuel Process. Technol. 2009, 90, 1183–1191. [Google Scholar] [CrossRef]
  18. Karaman, I.; Yagmur, E.; Banford, A.; Aktas, Z. The effect of process parameters on the carbon dioxide based production of activated carbon from lignite in a rotary reactor. Fuel Process. Technol. 2014, 118, 34–41. [Google Scholar] [CrossRef]
  19. Peiyong, M.; Yadong, S.; Xianjun, X.; Hui, L.; Tao, L.; Yunlong, H. Effect of the Catalytic Pyrolysis Conditions on the Properties of Biological Coke. Energy Procedia 2015, 66, 289–292. [Google Scholar] [CrossRef]
  20. Trubetskaya, A.; Jensen, P.A.; Jensen, A.D.; Llamas, A.D.G.; Umeki, K.; Glarborgm, P. Effect of fast pyrolysis conditions on biomass solid residues at high temperatures. Fuel Process. Technol. 2016, 143, 118–129. [Google Scholar] [CrossRef] [Green Version]
  21. Yangsheng, Z.; Fang, Q.; Zhijun, W.; Yuan, Z.; Weiguo, L.; Qiaorong, M. Experimental investigation on correlation between permeability variation and pores structure during coal pyrolysis. Transp. Porous Media 2010, 82, 401–412. [Google Scholar] [CrossRef]
  22. Yu, Y.; Xu, M.; Yao, H.; Yu, D.; Qiao, Y.; Sui, J.; Liu, X.; Cao, Q. Char characteristics and particulate matter formation during Chinese bituminous coal combustion. Proc. Combust. Inst. 2007, 31, 1947–1954. [Google Scholar] [CrossRef]
  23. Xiumin, J.; Chuguang, Z.; Che, Y.; Dechang, L.; Jianrong, Q.; Jubin, L. Physical structure and combustion properties of super fine pulverized coal particle. Fuel 2002, 81, 793–797. [Google Scholar] [CrossRef]
  24. Fukuyama, H.; Terai, S. Preparing and characterizing the active carbon produced by steam and carbon dioxide as a heavy oil hydrocracking catalyst support. Catal. Today 2008, 130, 382–388. [Google Scholar] [CrossRef]
  25. Hsu, L.Y.; Teng, H. Influence of different chemical reagents on the preparation of activated carbons from bituminous coal. Fuel Process. Technol. 2000, 64, 155–166. [Google Scholar] [CrossRef]
  26. Kopac, T.; Toprak, A. Preparation of activated carbons from Zonguldak region coals by physical and chemical activations for hydrogen sorption. Int. J. Hydrog. Energy 2007, 32, 5005–5014. [Google Scholar] [CrossRef]
  27. Xing, B.; Huang, G.; Chen, L.; Guo, H.; Zhang, C.; Xie, W.; Chen, Z. Microwave synthesis of hierarchically porous activated carbon from lignite for high performance supercapacitors. J. Porous Mater. 2016, 23, 67–73. [Google Scholar] [CrossRef]
  28. Howaniec, N. The effects of pressure on coal chars porous structure development. Fuel 2016, 172, 118–123. [Google Scholar] [CrossRef]
  29. Howaniec, N. Development of porous structure of lignite chars at high pressure and temperature. Fuel Process. Technol. 2016, 154, 163–167. [Google Scholar] [CrossRef]
  30. Howaniec, N. Temperature induced development of porous structure of bituminous coal chars at high pressure. J. Sustain. Min. 2016, 15, 120–124. [Google Scholar] [CrossRef]
  31. Wall, T.F. ACARP Project C6051 Final Report; CRC for Black Coal Utilization: Callaghan, Australia, 1999. [Google Scholar]
  32. Jagiełło, J.; Thommes, M. Comparison of DFT characterization methods based on N2, Ar, CO2, and H2 adsorption applied to carbons with various pore size distribution. Carbon 2004, 42, 1225–1229. [Google Scholar] [CrossRef]
  33. Brunauer, S.; Emmett, P.; Teller, E. Adsorption of gases in multimolecular layers. J. Am. Chem. Soc. 1938, 60, 309–319. [Google Scholar] [CrossRef]
  34. Rouquerol, F.; Rouquerol, J.; Sing, K.S.W.; Llewellyn, P.; Maurin, G. Adsorption by Powders and Porous Solids, Principles, Methodology and Applications; Academic Press: Oxford, UK, 2014. [Google Scholar]
  35. De Boer, J.H.; Linsen, B.G.; van der Plas, T.H.; Zondervan, G.J. Studies on pore systems in catalysts: VII. Description of the pore dimensions of carbon blacks by the t method. J. Catal. 1965, 4, 649–653. [Google Scholar] [CrossRef]
  36. Joliffe, T. Principal Components Analysis; Springer: New York, NY, USA, 1986. [Google Scholar]
  37. Massart, D.L.; Vandeginste, B.G.M.; Buydens, L.M.C.; de Jong, S.; Lewi, P.J.; Smeyers-Verbeke, J. Handbook of Chemometrics and Qualimetrics: Part A; Elsevier: Amsterdam, The Netherlands, 1997. [Google Scholar]
  38. Smoliński, A.; Howaniec, N.; Stańczyk, K. A comparative experimental study of biomass, lignite and hard coal steam gasification. Renew. Energy 2011, 36, 1836–1842. [Google Scholar] [CrossRef]
  39. Vandeginste, B.G.M.; Massart, D.L.; Buydens, L.M.C.; de Jong, S.; Lewi, P.J.; Smeyers-Verbeke, J. Handbook of Chemometrics and Qualimetrics: Part B; Elsevier: Amsterdam, The Netherlands, 1998. [Google Scholar]
  40. Wold, S.; Esbensen, K.; Geladi, P. Principal Components Analysis. Chemom. Intell. Lab. Syst. 1987, 2, 37–52. [Google Scholar] [CrossRef]
Figure 1. Schematic diagram of the high-pressure thermogravimetric analyzer.
Energies 10 01457 g001
Figure 2. Variation in pore surface area of chars: (a) object 1; (b) object 2; (c) object 3; (d) object 4; (e) object 5; and (f) object 6 with pressure applied in pyrolysis.
Energies 10 01457 g002
Figure 3. Variation in pore volume of chars: (a) object 1; (b) object 2; (c) object 3; (d) object 4; (e) object 5; and (f) object 6 with pressure applied in pyrolysis.
Energies 10 01457 g003
Figure 4. (a) Pore surface area and (b) volume of chars produced under atmospheric pressure.
Energies 10 01457 g004
Figure 5. (a) Score plots and (b) loading plots of principal component analysis (PCA) for centered and standardized Xc dataset.
Energies 10 01457 g005
Table 1. Chemical and physical parameters of fuel samples.
ParameterObject 1Object 2Object 3Object 4Object 5Object 6
Moisture, %w/w14.24 (1)7.18 (1)4.74 (2)8.69 (2)3.04 (1)9.15 (1)
Ash, %w/w12.63 (1)9.12 (1)1.51 (3)4.31 (3)4.21 (1)8.93 (1)
Volatiles, %w/w36.90 (1)47.18 (1)73.16 (4)69.89 (4)29.86 (1)30.49 (1)
Fixed carbon, %w/w36.23 (5)36.52 (5)20.59 (5)17.11 (5)62.89 (5)51.43 (5)
Sulfur, %w/w1.78 (6)1.32 (6)0.05 (6)0.12 (6)0.79 (6)0.71 (6)
Carbon, %w/w51.03 (7)56.82 (7)52.19 (8)45.77 (8)76.79 (7)63.72 (7)
Hydrogen, %w/w3.65 (7)5.00 (7)6.22 (8)5.62 (8)4.07 (7)3.82 (7)
Nitrogen, %w/w0.83 (7)0.54 (7)b.d.b.d.1.33 (7)0.67 (7)
Oxygen, %w/w16.11 (5)20.22 (5)35.29 (5)35.58 (5)9.97 (5)13.11 (5)
Heat of combustion, kJ/kg19,640 (9)23,942 (9)18,171 (10)16,920 (10)30,614 (9)25,855 (9)
Calorific value, kJ/kg18,405 (9)22,675 (9)16,697 (10)15,481 (10)29,651 (9)24,665 (9)
Standards and methods: (1) PN-G-04560:1998 Solid fuels—Determination of moisture, volatiles and ash with the application of automatic analyzer; (2) PN-EN 14774-3:2010 Solid biofules—Determination of moisture—Drying method—Part 3: Moisture in analytical sample; (3) PN-EN 14775:2010 Solid biofules—Determination of ash; (4) PN-EN 15148:2010 Solid biofules—Determination of volatiles; (5) by difference; (6) PN-G-04584:2001 Solid fuels—Determination of total and ash sulfur with automatic analyzers; (7) PN-G-04571:1998 Solid fuels—Determination of carbon, hydrogen and nitrogen with automatic analyzers—Macro method; (8) PN-EN 15104:2011 Solid biofules—Determination of carbon, hydrogen and nitrogen—Instrumental methods; (9) PN-81/G-04513 Solid fuels—Determination of heat of combustion and calorific value; (10) PN-EN 14 918:2010 Solid biofules—Determination of calorific value.
Table 2. Chemical and physical parameters of fuel samples.
No.ParametersNo.Parameters
1Moisture, %w/w24DFT method cumulative pore volume, 1 MPa
2Ash, %w/w25Average pore diameter, 1 MPa
3Volatiles, %w/w26Multipoint BET, 2 MPa
4Fixed carbon, %w/w27T-method micropore surface area, 2 MPa
5Sulfur, %w/w28DFT cumulative surface area, 2 MPa
6Carbon, %w/w29Total pore volume, 2 MPa
7Hydrogen, %w/w30T-method micropore volume, 2 MPa
8Nitrogen, %w/w31DFT method cumulative pore volume, 2 MPa
9Oxygen, %w/w32Average pore diameter, 2 MPa
10Heat of combustion, kJ/kg33Multipoint BET, 3 MPa
11Calorific value, kJ/kg34T-method micropore surface area, 3 MPa
12Multipoint BET, 0.1 MPa35DFT cumulative surface area, 3 MPa
13T-method micropore surface area, 0.1 MPa36Total pore volume, 3 MPa
14DFT cumulative surface area, 0.1 MPa37T-method micropore volume, 3 MPa
15Total pore volume, 0.1 MPa38DFT method cumulative pore volume, 3 MPa
16T-method micropore volume, 0.1 MPa39Average pore diameter, 3 MPa
17DFT method cumulative pore volume, 0.1 MPa40Multipoint BET, 4 MPa
18Average pore diameter, 0.1 MPa41T-method micropore surface area, 4 MPa
19Multipoint BET, 1 MPa42DFT cumulative surface area, 4 MPa
20T-method micropore surface area, 1 MPa43Total pore volume, 4 MPa
21DFT cumulative surface area, 1 MPa44T-method micropore volume, 4 MPa
22Total pore volume, 1 MPa45DFT method cumulative pore volume, 4 MPa
23T-method micropore volume, 1 MPa46Average pore diameter, 4 MPa

