A Novel Optimal Current Trajectory Control Strategy of IPMSM Considering the Cross Saturation Effects

College of Electrical and Information Engineering, Hunan University, Changsha 410082, China
*
Author to whom correspondence should be addressed.
Energies 2017, 10(10), 1460; https://doi.org/10.3390/en10101460
Submission received: 10 August 2017
/
Revised: 5 September 2017
/
Accepted: 15 September 2017
/
Published: 21 September 2017
(This article belongs to the Section F: Electrical Engineering)
Abstract
:The nonlinearity and uncertain variation of machine parameters are always caused by cross coupling and magnetic saturation effects, which are easily neglected in the conventional control strategy. In this paper, a current trajectory control strategy (CTCS) is proposed to take the cross coupling and magnetic saturation effects into account under voltage and current constraints. It can be considered as a calculating method considering parameter variation and separating among each iteration step which treats the calculated result of the former step as the initial value of the next step. At first, the torque command is translated into the current reference. Then, the increments between the target value and real value of the torque and the voltage are respectively calculated, which are subsequently converted into the current modification vector in did, diq framework for further analysis. In order to take the influence caused by cross coupling and magnetic saturation effects on the CTCS into consideration, self and mutual inductances are analyzed by finite element analysis (FEA). The results of the simulation and experiment show that the rapid response and robustness on reference speed variation could be achieved by employing the proposed CTCS, and the seamless switching between the constant torque and flux-weakening operation can also be realized.
1. Introduction
The interior permanent magnet synchronous machine (IPMSM) has become an ideal choice for electric vehicles (EVs) nowadays because of its higher torque density, wider speed range, and higher reliability compared with other types of machines [1,2]. Due to fluctuant working conditions, the traction motors of EV are commonly in operation at partial load mode where a low torque and high speed are required [3,4]. This condition indicates that there will be unnecessary distortion of the current and torque caused by frequent handoffs of the motor between the constant torque and constant power region, which thus reveals the importance in machine design and proper control algorithm to avoid those situations. In full speed range, the most popular running state of IPMSM is to realize the maximum torque per ampere (MTPA) operation below the base speed. In other words, it takes full advantage of electric torque with minimum copper loss, then acquires a high speed by sacrificing torque performance in the flux weakening region within safety boundaries [2,5]. The control references are derived by computing the intersection of the constant torque line and the voltage constraint locus [6,7,8]. Dating back to the 1990s, in [8,9], the operation region of a motor has already been divided by precalculating the current reference for each region and pre-settling the speed reference for operation interval switching. Based on this principle, numerous methods have been studied to compute the current control target from analytical equations which substantially control the terminal voltage of a motor. Hence, regardless of feedback and feedforward control, current commands of the constant torque and the constant power region are derived separately and statically [10,11,12,13]. However, due to the nonlinear parameters of IPMSM caused by magnetic saturation, cross-coupling effects, and temperature, not only is the definite switching point of two algorithms difficult to derive, but it also imposes impediments in conventional optimal control which assume that the motor parameters are fixed [14]. In [15], Junggi Lee formulated a mathematic loss model including the cross saturation effect to realize minimum loss control. Unfortunately, complicated fourth-order polynomials were used sectionally to calculate the switch point which broke the control continuity, as well as put off the response of dynamic changes.
Plenty of work has been done to explain the effects of cross coupling and magnetic saturation, and to verify that the cross coupling effect can decrease the saturation degree of a motor in the high speed region [16,17,18]. However, the influences of both effects on the control algorithm are seldom taken into account synergistically [18,19], and it has been verified that the cross coupling and saturation effect can make the simulation results fit the actual prototype more accurately. [20] discussed the interference of cross-coupling inductance and the current dependency of flux linkage in the dq-axis and exploited them using Lagrangian multipliers. Still, only analytical calculations have been done and putting them into MTPA control in practice has not been studied. Ali Rabiei et al. [18,21] explored the influence of cross coupling and core saturation in motor parameters and MTPA trajectory. Their results demonstrated that a modified MTPA curve with parameter variations can minimize the errors between the control trajectory and actual locus, thus enhancing the control accuracy.
This paper proposes a novel current trajectory control strategy which uses the voltage and torque incremental value to derive the dq-axis current reference under predefined electrical constraints. Motor equations are formulated in the presence of inductance uncertainties due to cross coupling and magnetic saturation effects (omitted to the cross saturation effect as follows). In this paper, the demagnetization of a permanent magnet caused by temperature is neglected, as well as the influence of error aroused by inaccurate observations. Both a simulation and A 10 kW IPMSM prototype are studied to validate the sensitivity of the proposed method about reference speed variations.
2. Working Principle
2.1. Cross Saturation Effect
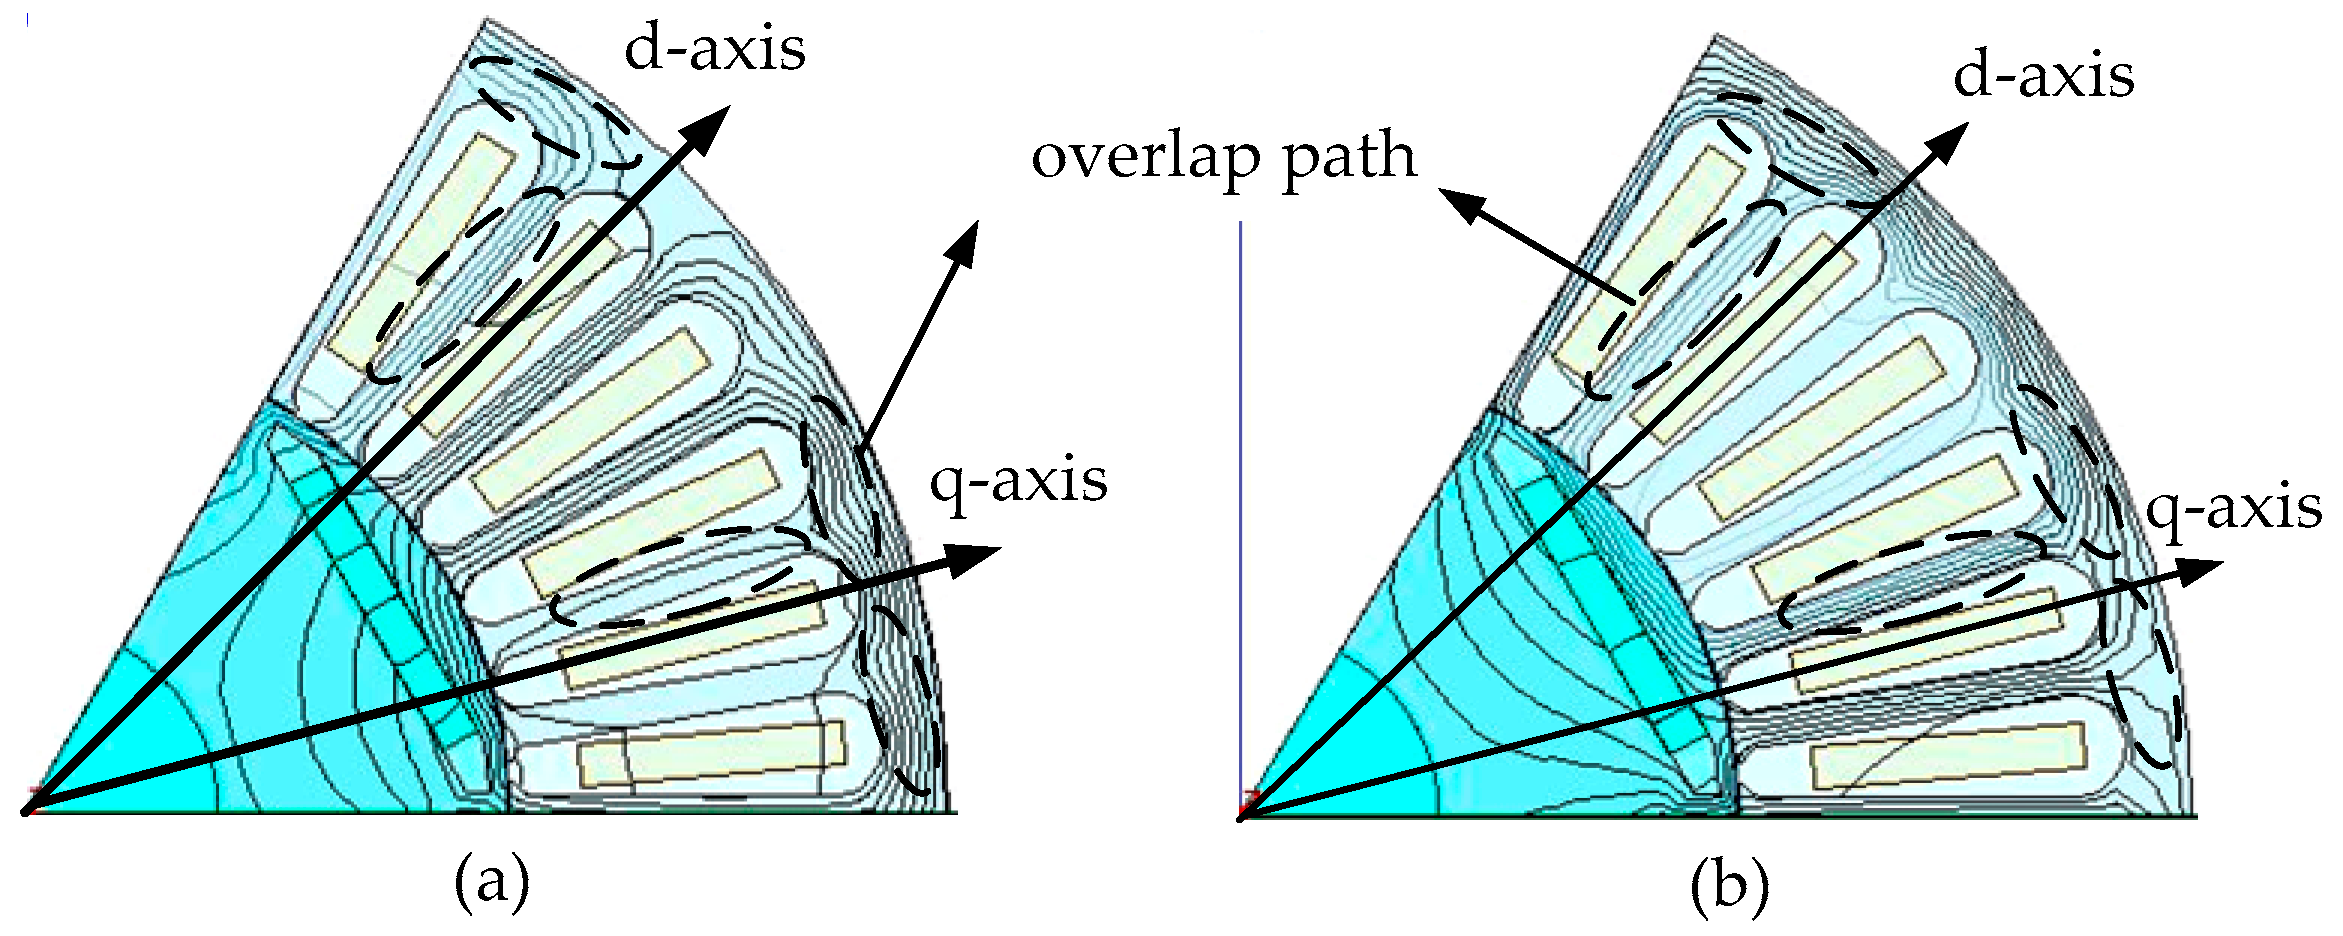
It has been known that regardless of the conventional IPMSM mathematical model, the physical and electrical limitations, or the optimal control strategies, the output performance depends on the machine parameters, such as Ld, Lq, and Ψf. However, the traditional dq-axis flux linkage model is deemed to be orthogonal, which means that the d-axis and q-axis flux are completely decoupled, and the inductance is known to be constant in a normal control strategy. In reality, the magnetic flux circuit has an overlapping loop between the d-axis and q-axis, as shown in Figure 1, where common paths exist (the ellipse) in the stator core. This magnet flux cross portion introduces the mutual inductance Ldq and Lqd, whereas the flux linkage functions are modified as:
where Ldd and Lqq are the self-inductances of the d-axis and q-axis, respectively (omitted to Ld and Lq(i) as following). Ldq and Lqd are the mutual inductances of the d-axis and q-axis, respectively. i and Ψ are the armature current and the flux linkage, respectively. Ψf denotes the flux linkage produced by the PM.
According to the flux linkage Equation (1), the computational model has been modified in [22], as shown in Equation (2). A 10 kW IPMSM has been computed by the finite element analysis (FEA) using ANSYS Maxwell.
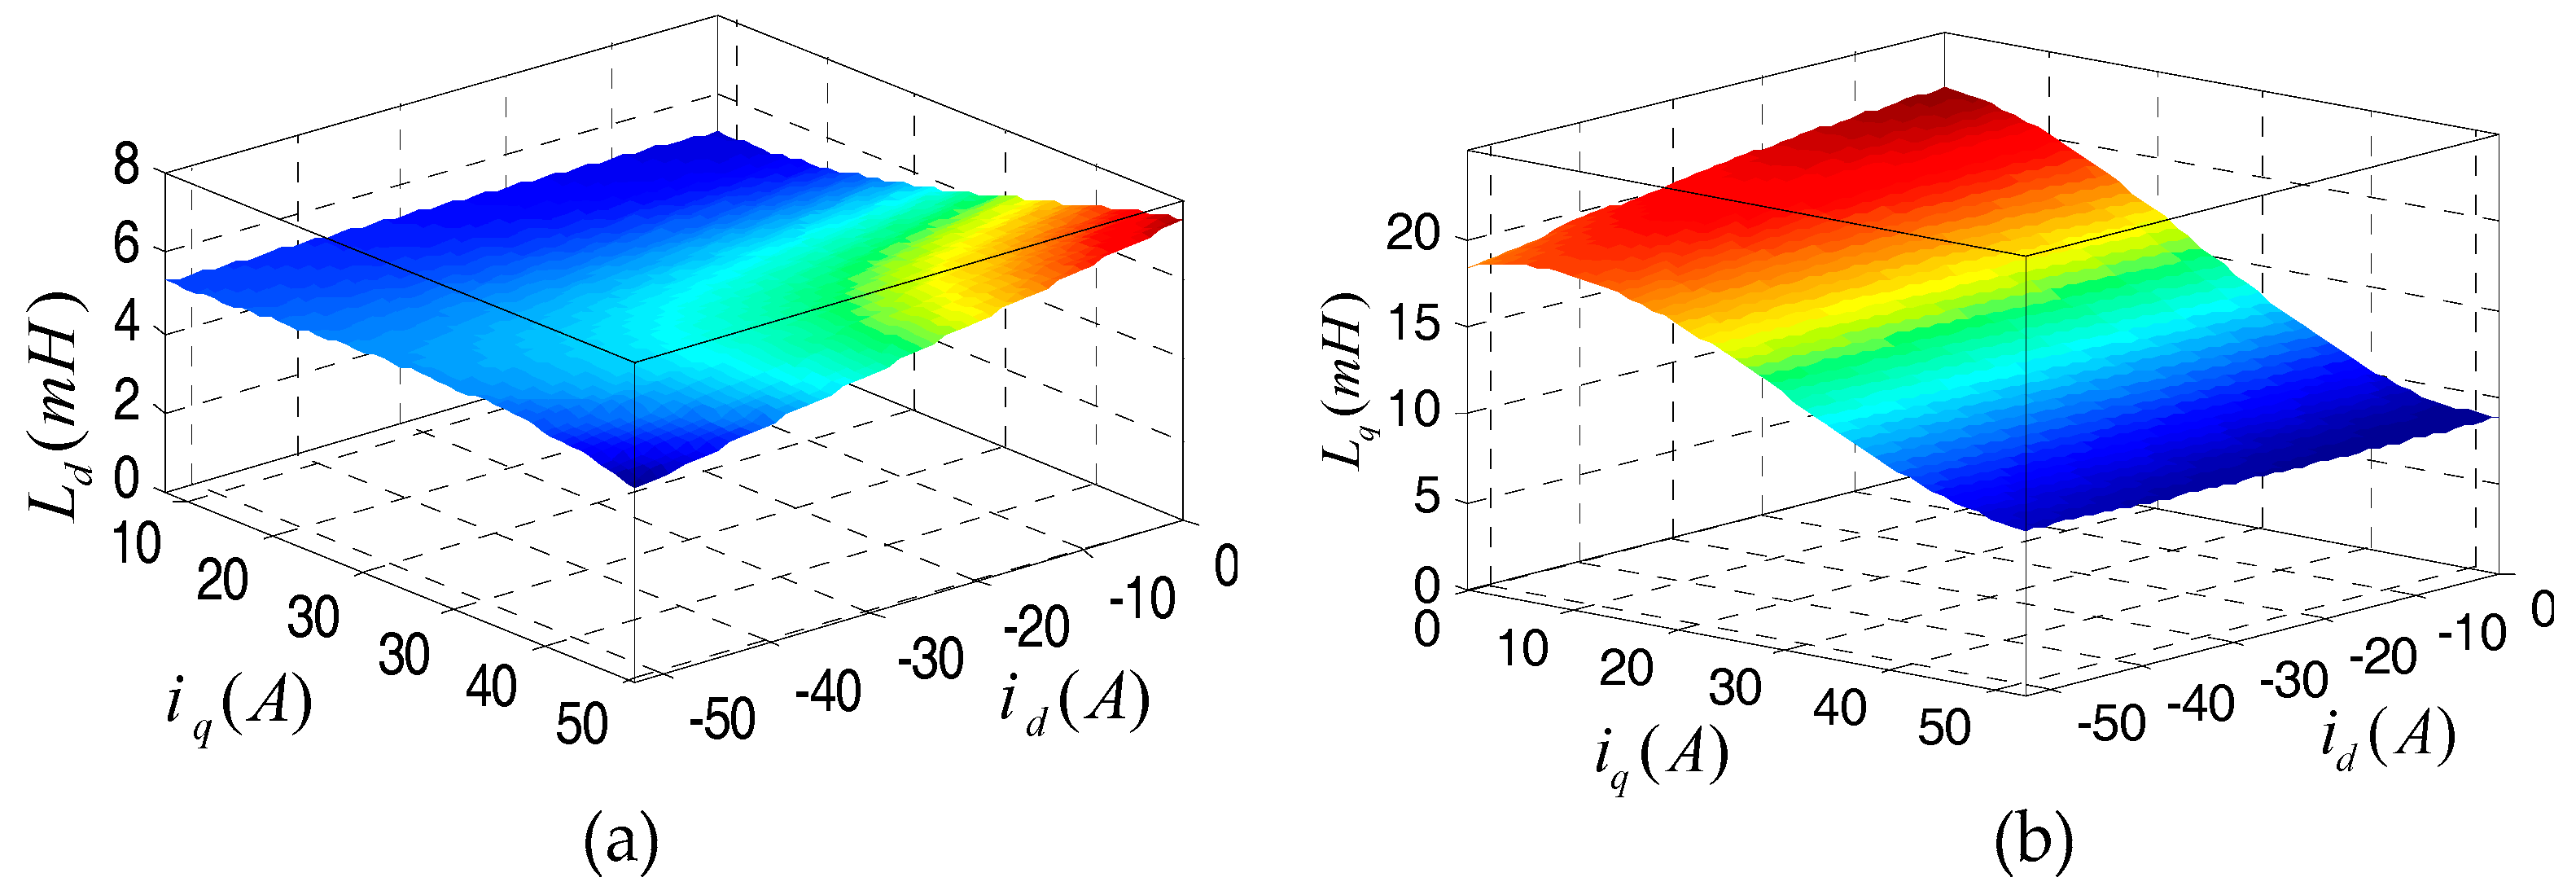
The numerical results of inductance and flux linkage as a function of current are plotted in Figure 2 and Figure 3. It shows the evidence that inductances in IPMSM are nonlinear and susceptible to the interference from the armature current. The d-axis flux linkage arises along with the increase of q-axis current due to the cross coupling effect when the demagnetizing current is small so that the enlargement of d-axis inductance is shown in Figure 3a. It is observed from Figure 2b and Figure 3b that the q-axis flux and inductance are mainly affected by the q-axis current, whereas the effects of the d-axis current on q-axis parameters are more obvious in the unsaturated zone where two axis currents are small. That is because the d-axis of a motor coincides with the axial position of the PM flux direction, which subsequently makes a higher permeability magnetic flux circuit than that in the q-axis. Therefore, the saturation effect plays a dominant role in the q-axis circuit. Consequently, it may be imprecise to apply fixed parameters in the motor model and control strategy to control IPMSM.
Based on the discussion above, the electromagnetic torque can be adjusted as follows in Equations (3) and (4):
where Te and Tecrs denote the electromagnetic torque and torque generated by cross coupling inductances, respectively.
Note that the torque performance of IPMSM could be enhanced when |iq| > |id|.
Before the optimal control strategy is verified, the parameter of IPMSM should be confirmed. In this paper, the temperature dependence of PM flux linkage and inductance is neglected. The parameters computed by FEA are shown in Figure 4. Although Ld is more affected by the d-axis current, the variation as a function of id is negligible with few millihenry and is not distinctive. Therefore, Ld can be regarded as a constant value. The difference in mutual inductance between two axes does not exceed 2 millinery. Therefore, in this paper, it is also assumed to be equal and fixed Ldq = Lqd. The variation in Lq is approximately fitted as a linear function of iq:
2.2. Current Trajectory Control
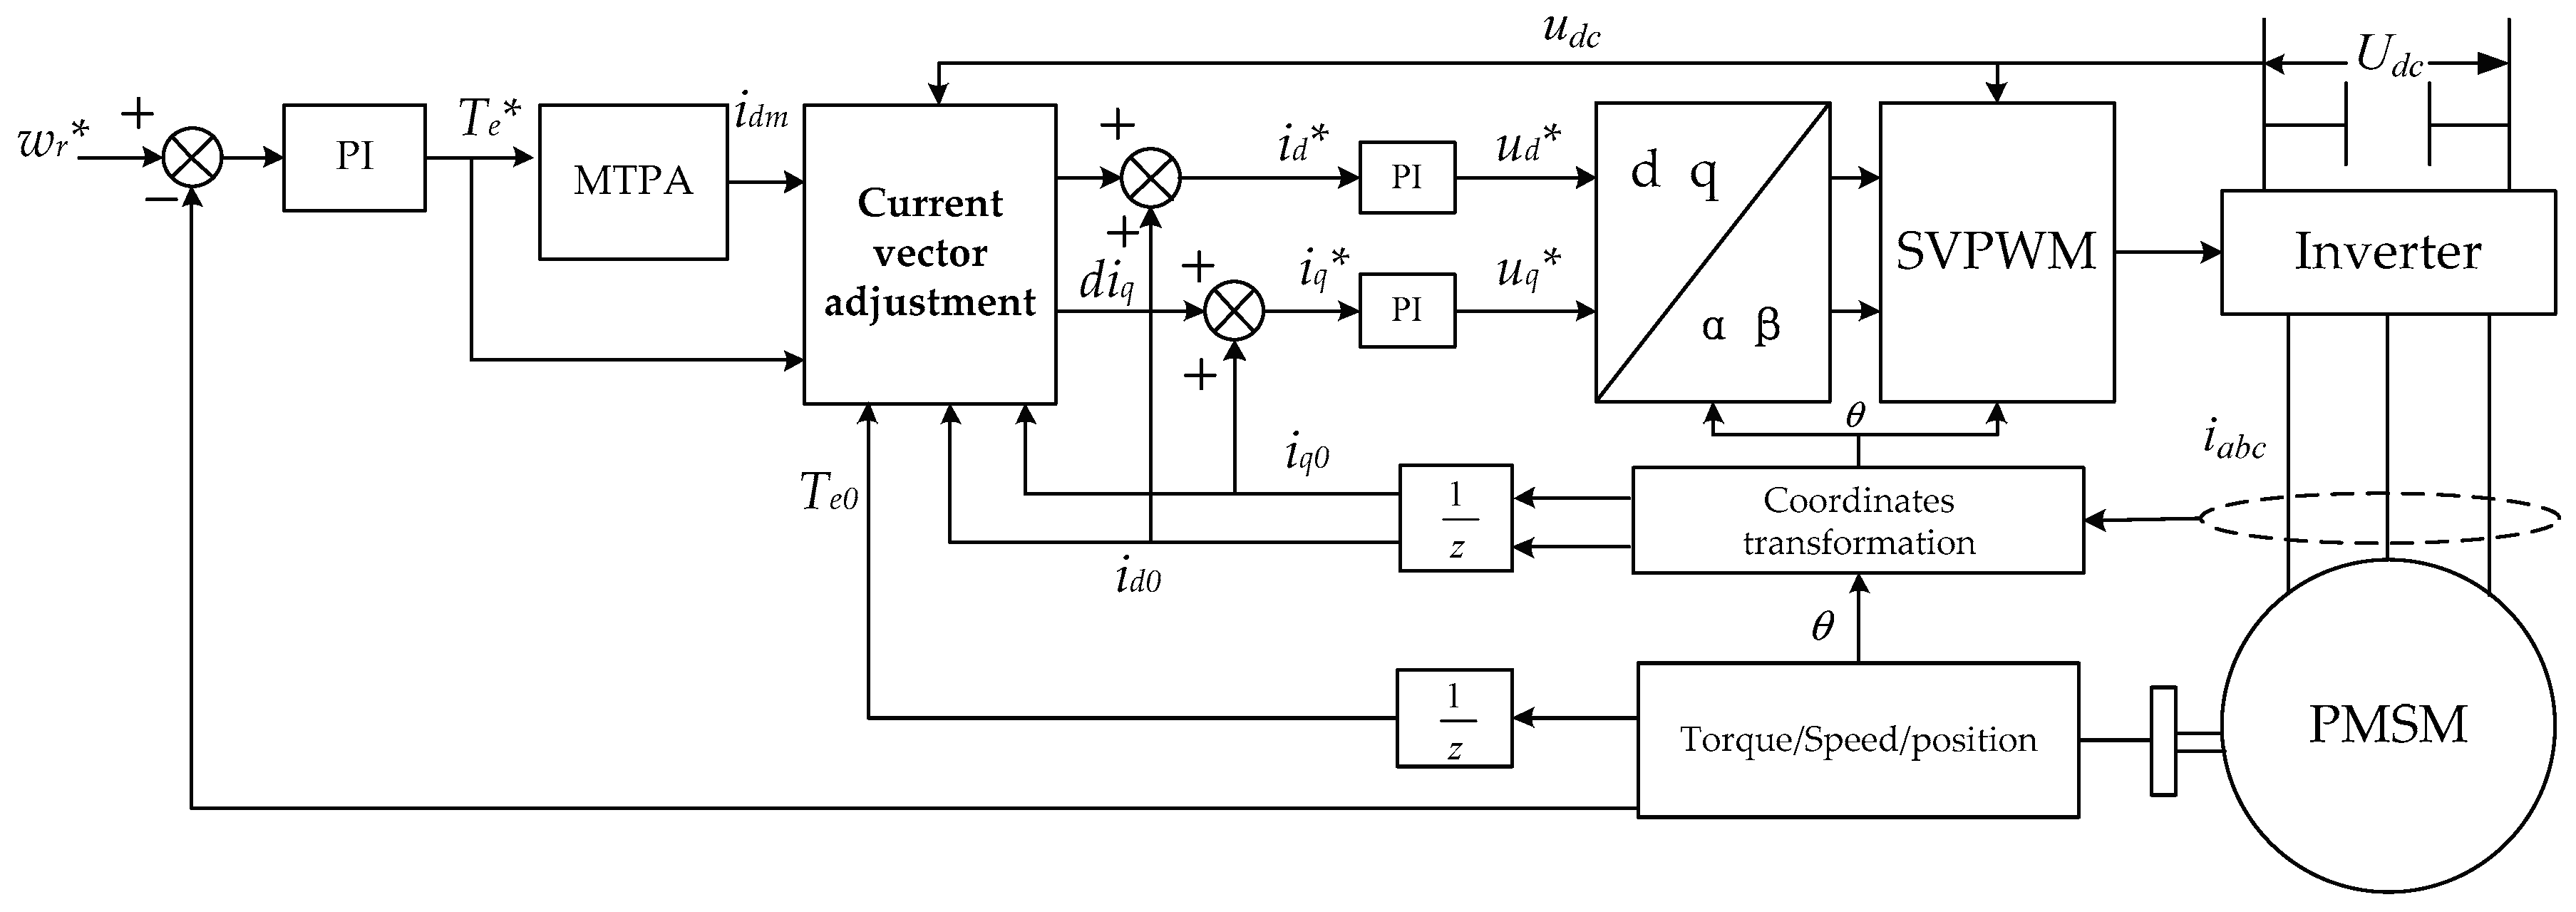
The current trajectory control can be categorized into MTPA control and incremental current vector adjustment control, and the overview is shown in Figure 5. The voltage comparison between the limit and feedback value to measure whether flux weakening should be introduced is omitted. Considering the cross saturation effect, the mathematical model of IPMSM and its terminal voltage amplitude can be modified as:
where Rs represents the stator resistant and ω is the rotor angular speed in rad/s.
2.2.1. Modified MTPA
In the circumstance that only torque control is required, for example EV drives, the MTPA control strategy becomes the primary choice for constant torque operation where the torque command signal is translated into the definite current reference. However, the objective function of MTPA has to be converted to a multidimensional constrained nonlinear optimization function which takes the cross saturation effects into account. It abandons traditional methods such as Newton iteration and the Lagrange multiplier method. In order to track the MTPA point, this paper applied the Non-dominated Sorting Genetic Algorithm (NSGA-II) [23] to solve these problems within equality and inequality constraints. The fitness function of GA is as follows:
subjected to:
The NSGA produces a random population on the Pareto front and converts the variables through mutation and crossover procedures. It can enrich the number of non-dominated results and realize a uniform distribution and rapid convergence. In this way, the optimized d-axis current reference Idm can be derived. Note that the result Idm will not participate in the loop of current vector modification.
2.2.2. Current Vector Adjustment
Bounded by the modulation characteristics of SVPWM, the maximum output voltage of the inverter is . The voltage limit is prior to the current limit because once the voltage constraint is breached, both the voltage and current will be distorted, which can lead to a serious thermal breakdown of the inverter and the motor. Meanwhile, the voltage of the motor is the sign for measuring the need for a flux weakening operation, and the voltage of the machine is thus introduced as the control objective to satisfy this limit.
The torque and voltage differences between the target value and the signal from formal iteration are:
where
The actual voltage amplitude U0 is calculated by the feedback signals of the PI controller ud,0, uq,0. The time constant Tc = 2 ms is introduced to avoid voltage overshoot, where Ts denotes the sample time.
From Equations (3) and (6), the torque and the voltage are determined by the current value, which could be expressed as: y = f(id, iq). The current vector modification strategy firstly translates the voltage and torque incremental signal (Equations (11) and (13)) into the current adjustment amount did, diq in d-q framework based on their partial differential equation as in the following equation:
Then, these current adjustment amounts are taken as the variables of the so-called linearized torque and voltage functions as described by:
where
where
The CTCS combines the voltage and current limits to acquire the intersection of the target torque and allowed voltage adjustment line, as shown in Figure 6. Note that Equations (14) and (15) are also tangential lines of the torque and voltage (the dash line in Figure 6). Point A is the intersection of the constant torque locus and constant voltage locus. The coordinate of A is the initial current vector when torque adjustment signals are injected. For example, when the torque is decreased (the constant torque line moves downward), the voltage value will also descend (move to the left), and the current adjustment vector will therefore shift from A to B.
At the start of current trajectory control, the prior criterion is the distance between the origin point and the voltage variation request line LU. It must be smaller than the radius of the current limit circle, which means that the actual voltage change amplitude dU should be strictly less than the target increment amplitude dUs. Figure 7 shows the geometrical position details of the torque and voltage variation request line within the current limit circle.
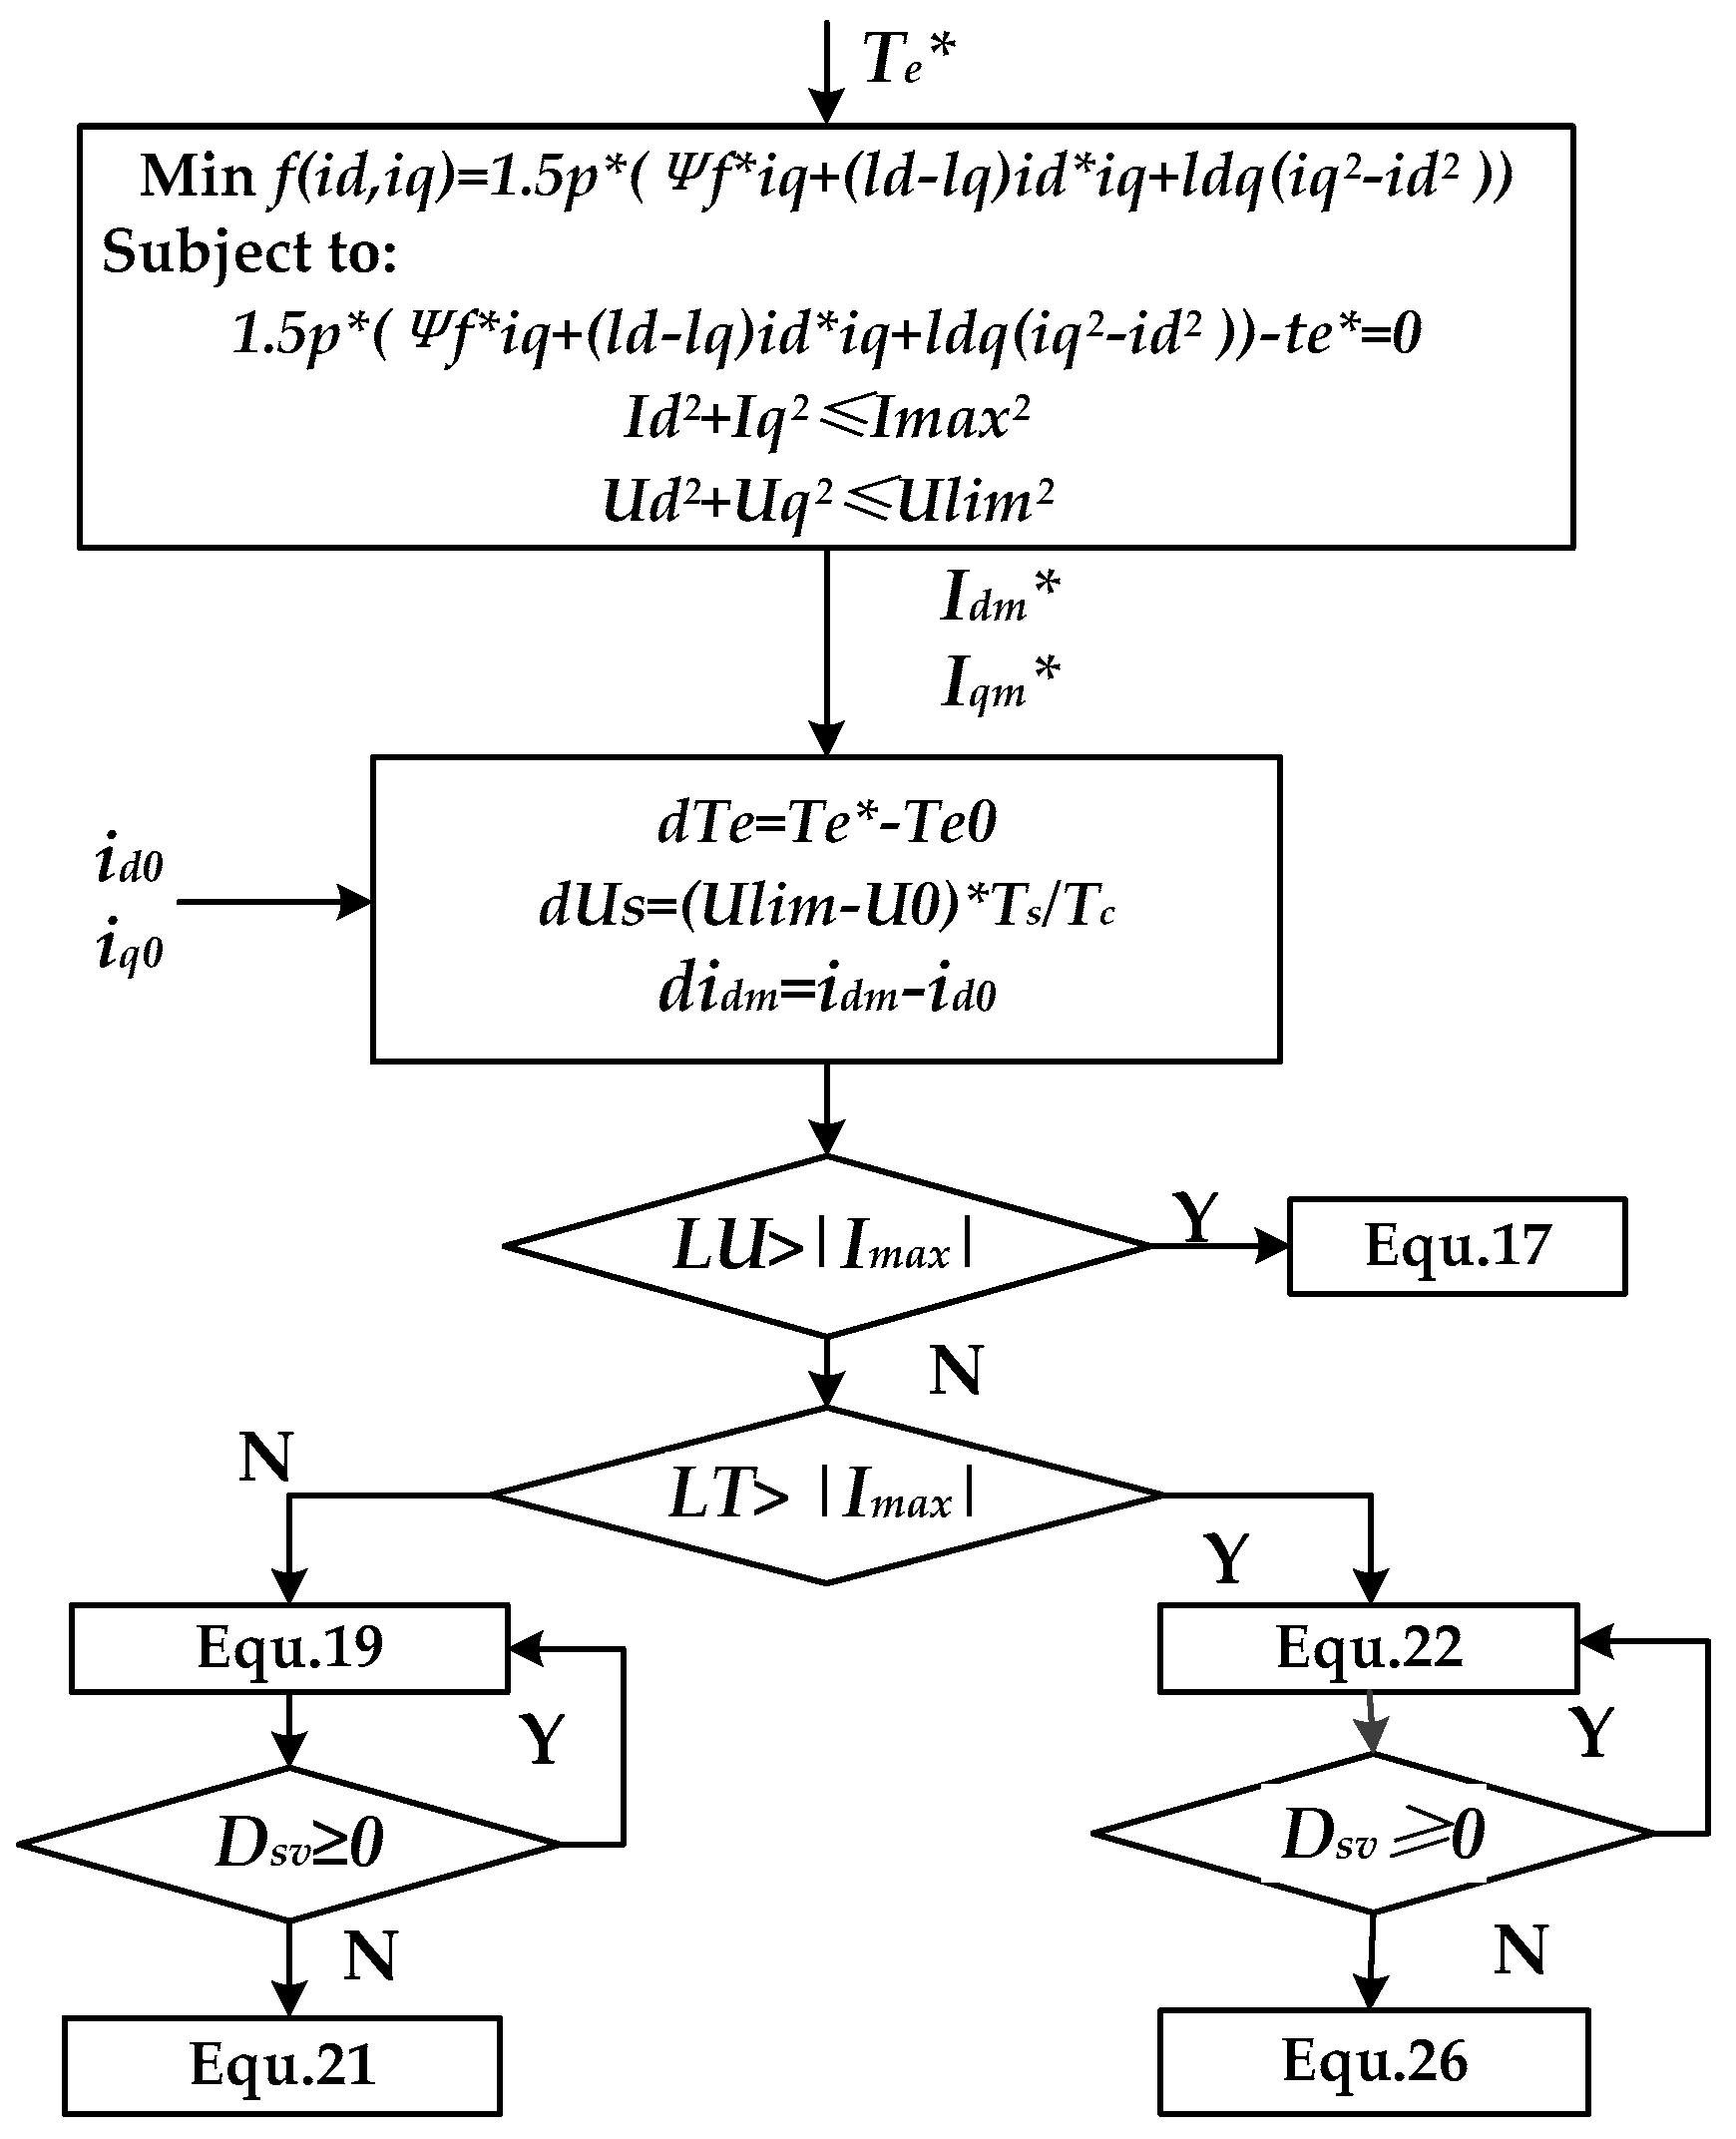
So, when LU ≥ Imax, the current adjustment point is the pedal of the vertical line which crosses the original point to the voltage modification request line. It can be calculated as:
When LU < Imax and LT ≥ Imax, which indicates the torque variation request beyond the current limit circle, the current adjustment vector is the intersection of the vertical line and current limit circle from the original point to the torque modification request line. The current vectorcan be described as:
where p denotes the pole pair number.
After calculating the current adjustment point, the position between the result and voltage incremental request line needs to be determined. Equation (20) is derived for location determination. If Dsv ≥ 0, the current modification vector from Equation (19) is available.
If the intersection locates at the right hand side of the voltage incremental request line (Dsv < 0), the algorithm will lose the ability to control voltage variation and expand the discrepancy to target the current reference idm. Hence, the correction point should locate at the intersection of the voltage request line and the current limit circle, which is also the nearest point to the torque request line. The result can be computed as Equation (21).
When LU < Imax and LT < Imax , the resultant current modification vector can be derived by didm and Equation (22), as shown in Figure 7b.
Judgment Dsv is indispensable for the same reason as what has been mentioned before. If Dsv ≥ 0, the current modification vector from Equation (22) is available.
However, if Dsv < 0, the current adjustment vector is the crosspoint of the torque and voltage incremental line, represented in Equations (14) and (15):
Therefore, the target current correction vector is the crosspoint or the intersection between the voltage incremental line and the current limit.
The flow chart of the current vector adjustment method is shown in Figure 8.
3. Experimental Results and Discussion
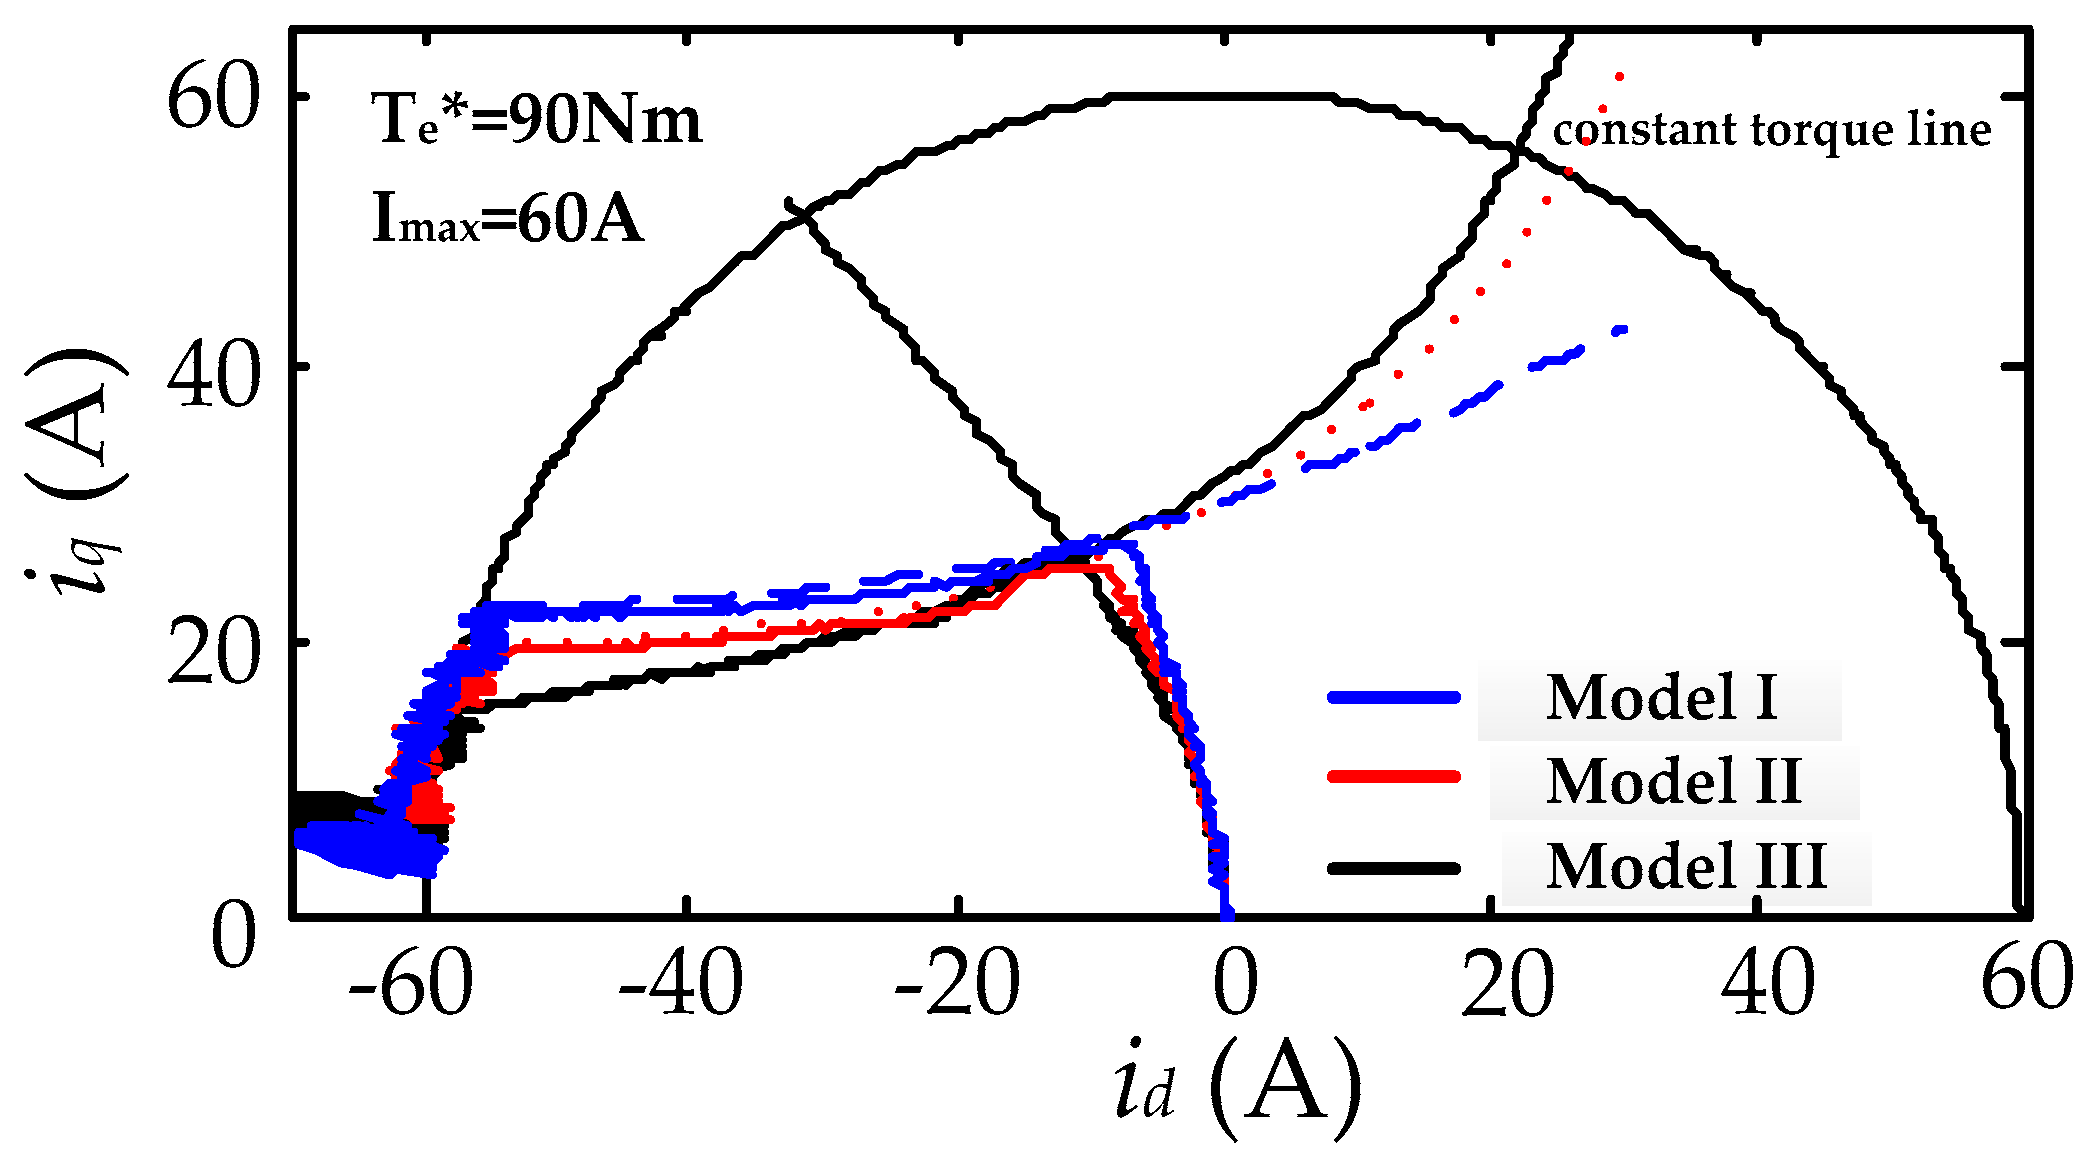
In order to verify the proposed current control strategy, three CTCS models are studied in this paper, namely, Model I which took all of the cross coupling and saturation effects into account, Model II which only considered cross coupling inductance, and Model III which neglected the parameter variations and the cross coupling effect. The inductance and flux variation with current have been simulated as shown in Figure 2 and Figure 3. Simulations are conducted using MATLAB 2010b, but the IPMSM module in the Simulink is unusable so it should be replaced by the mathematical module taking inductance changes into account. The simulation model and experimental prototype specifications are shown in Table 1.
Simulations were performed at a low torque command. Figure 9 shows the current trajectory when the torque is limited to 90 nm. It can be seen that the current trajectory is obviously below the theoretical maximum torque value, and the motor speed climbs from 0 to 3900 rpm.
As shown in Figure 9, the constant torque line is offset upward when parameter variation is considered in the model. It is also observed that the q-axis current component of model I is higher than that in the other two models within the same torque range, and thus the potential of electrical torque can be further explored. However, the MTPA curve has slightly shifted towards the right, caused by the cross saturation effects. Even though this has occured, the proposed current trajectory control strategy can still track the MTPA curve and constant torque line properly along with the increasing speed, and realize the seamless switch to a flux weakening operation. Figure 10 demonstrates that the proposed control strategy obeys the voltage limit stringently in the whole speed region, and even the current constraint can be broken in the models.
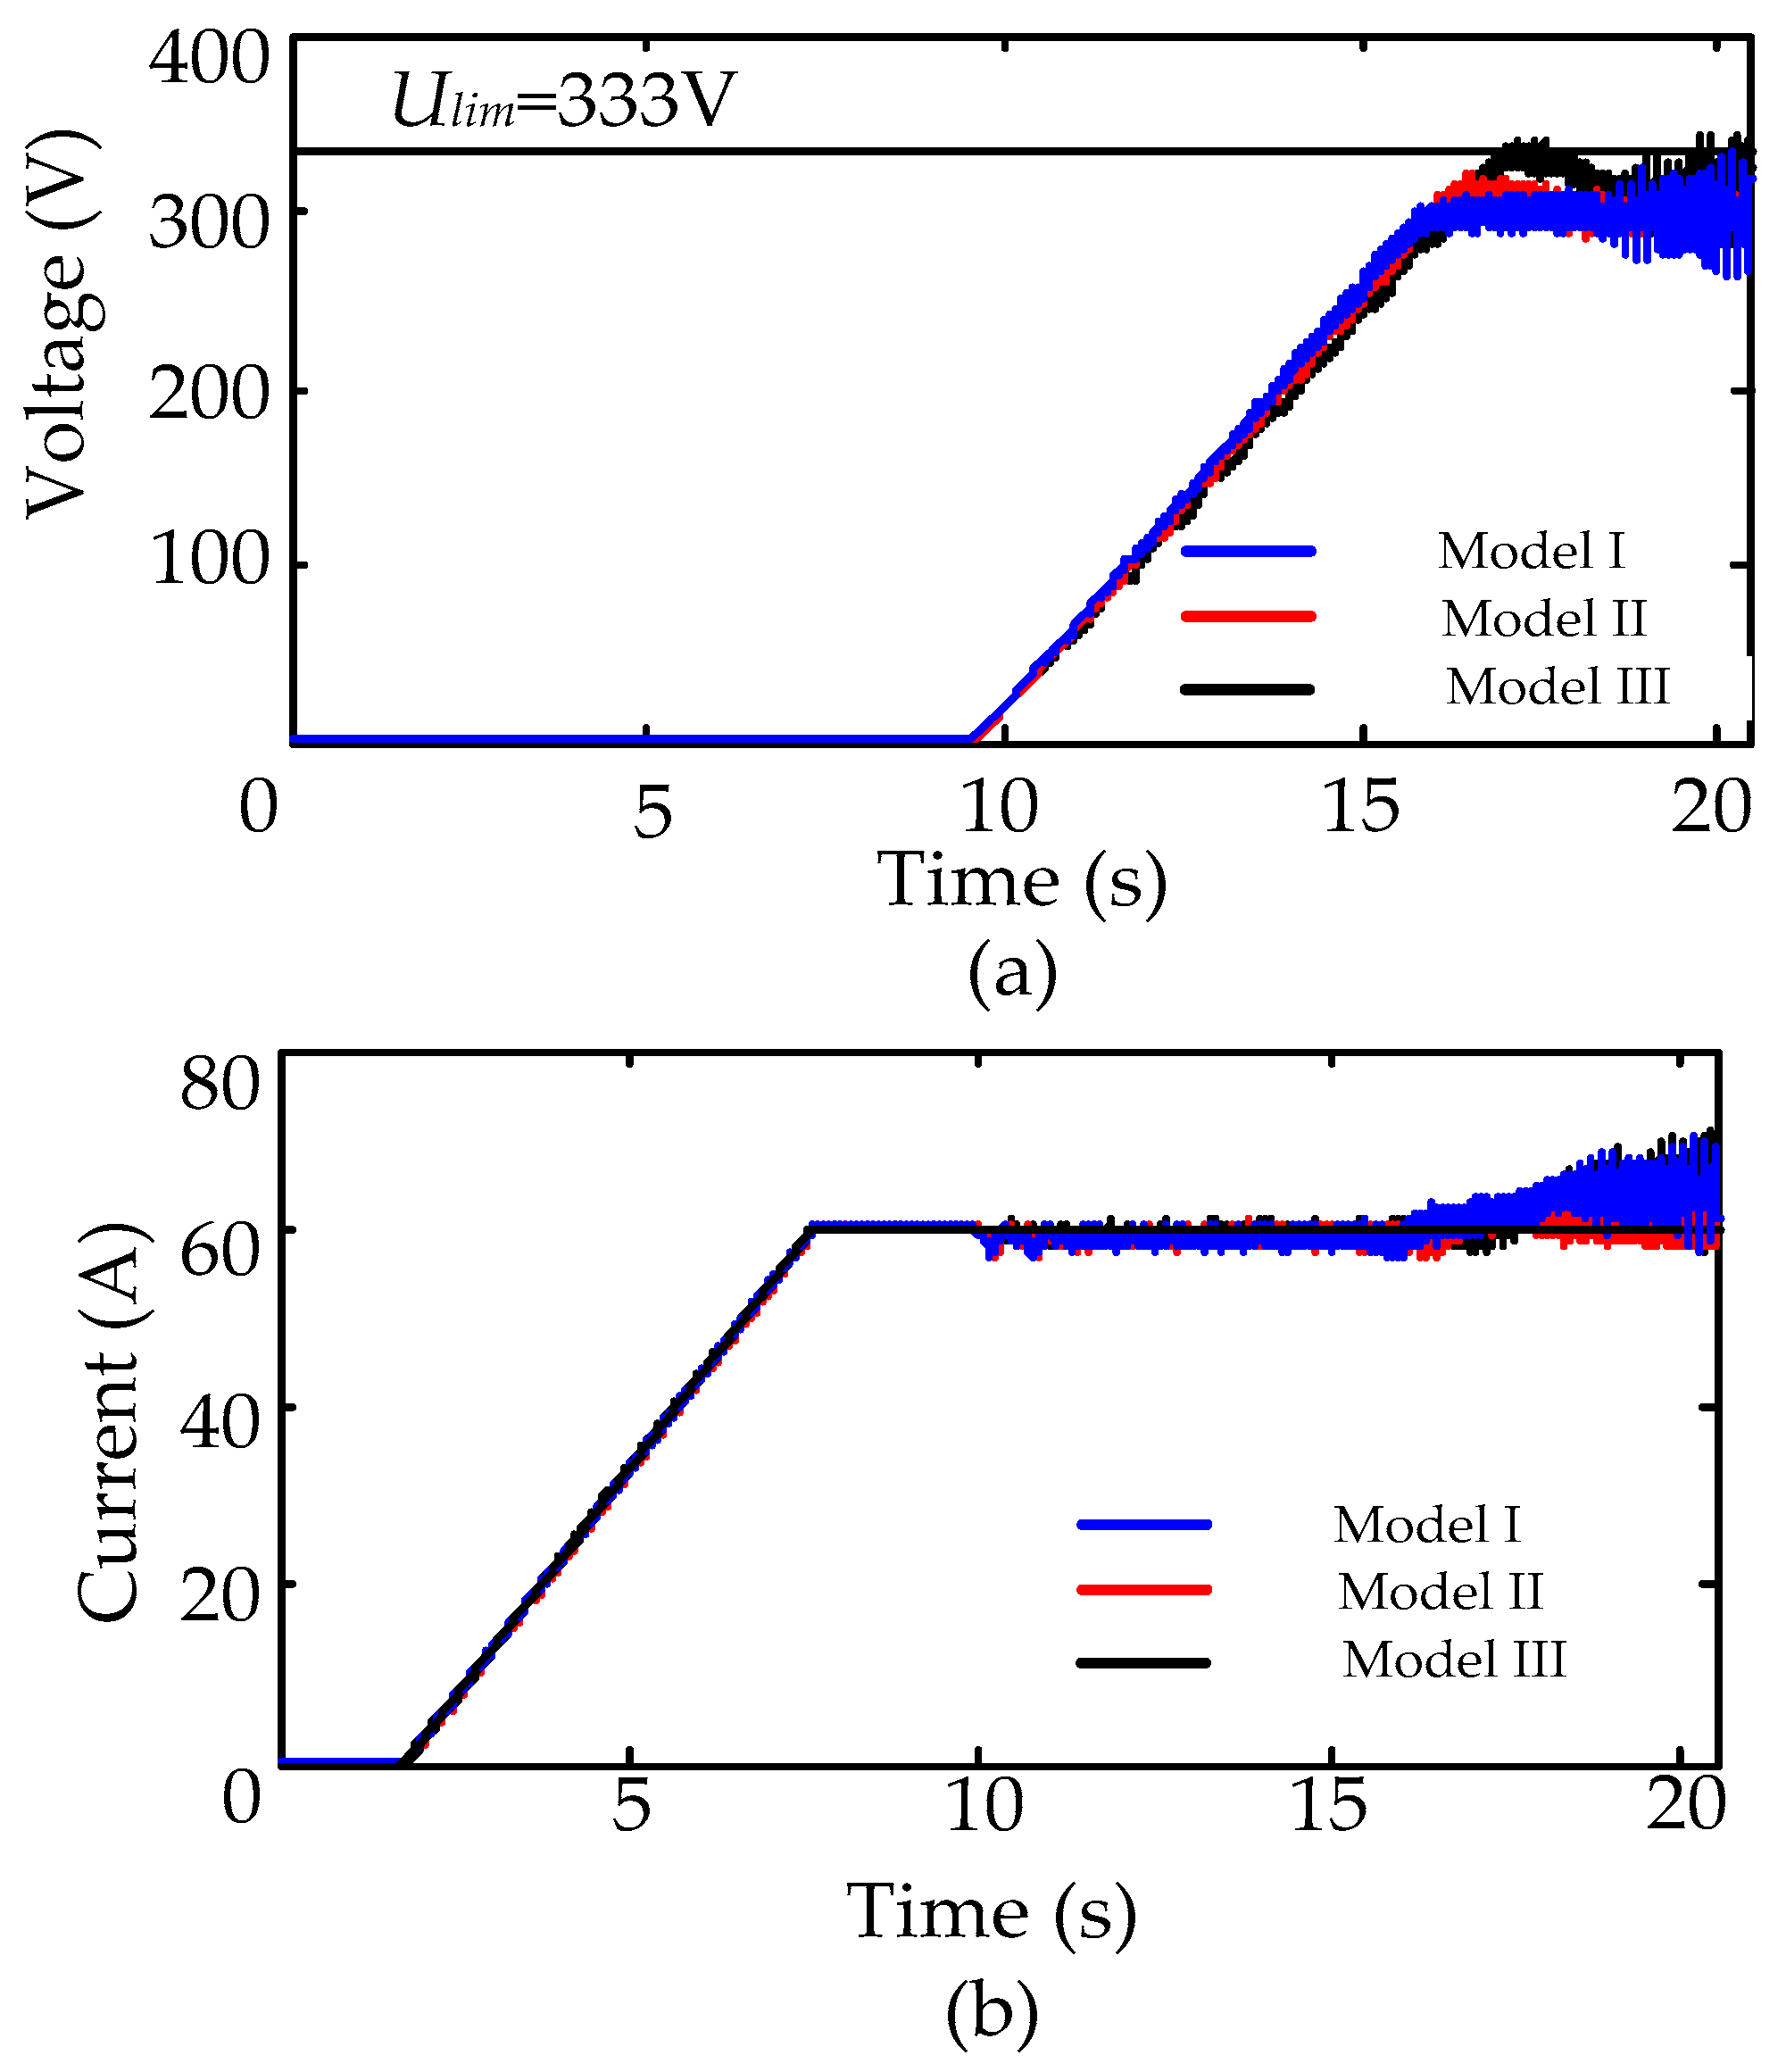
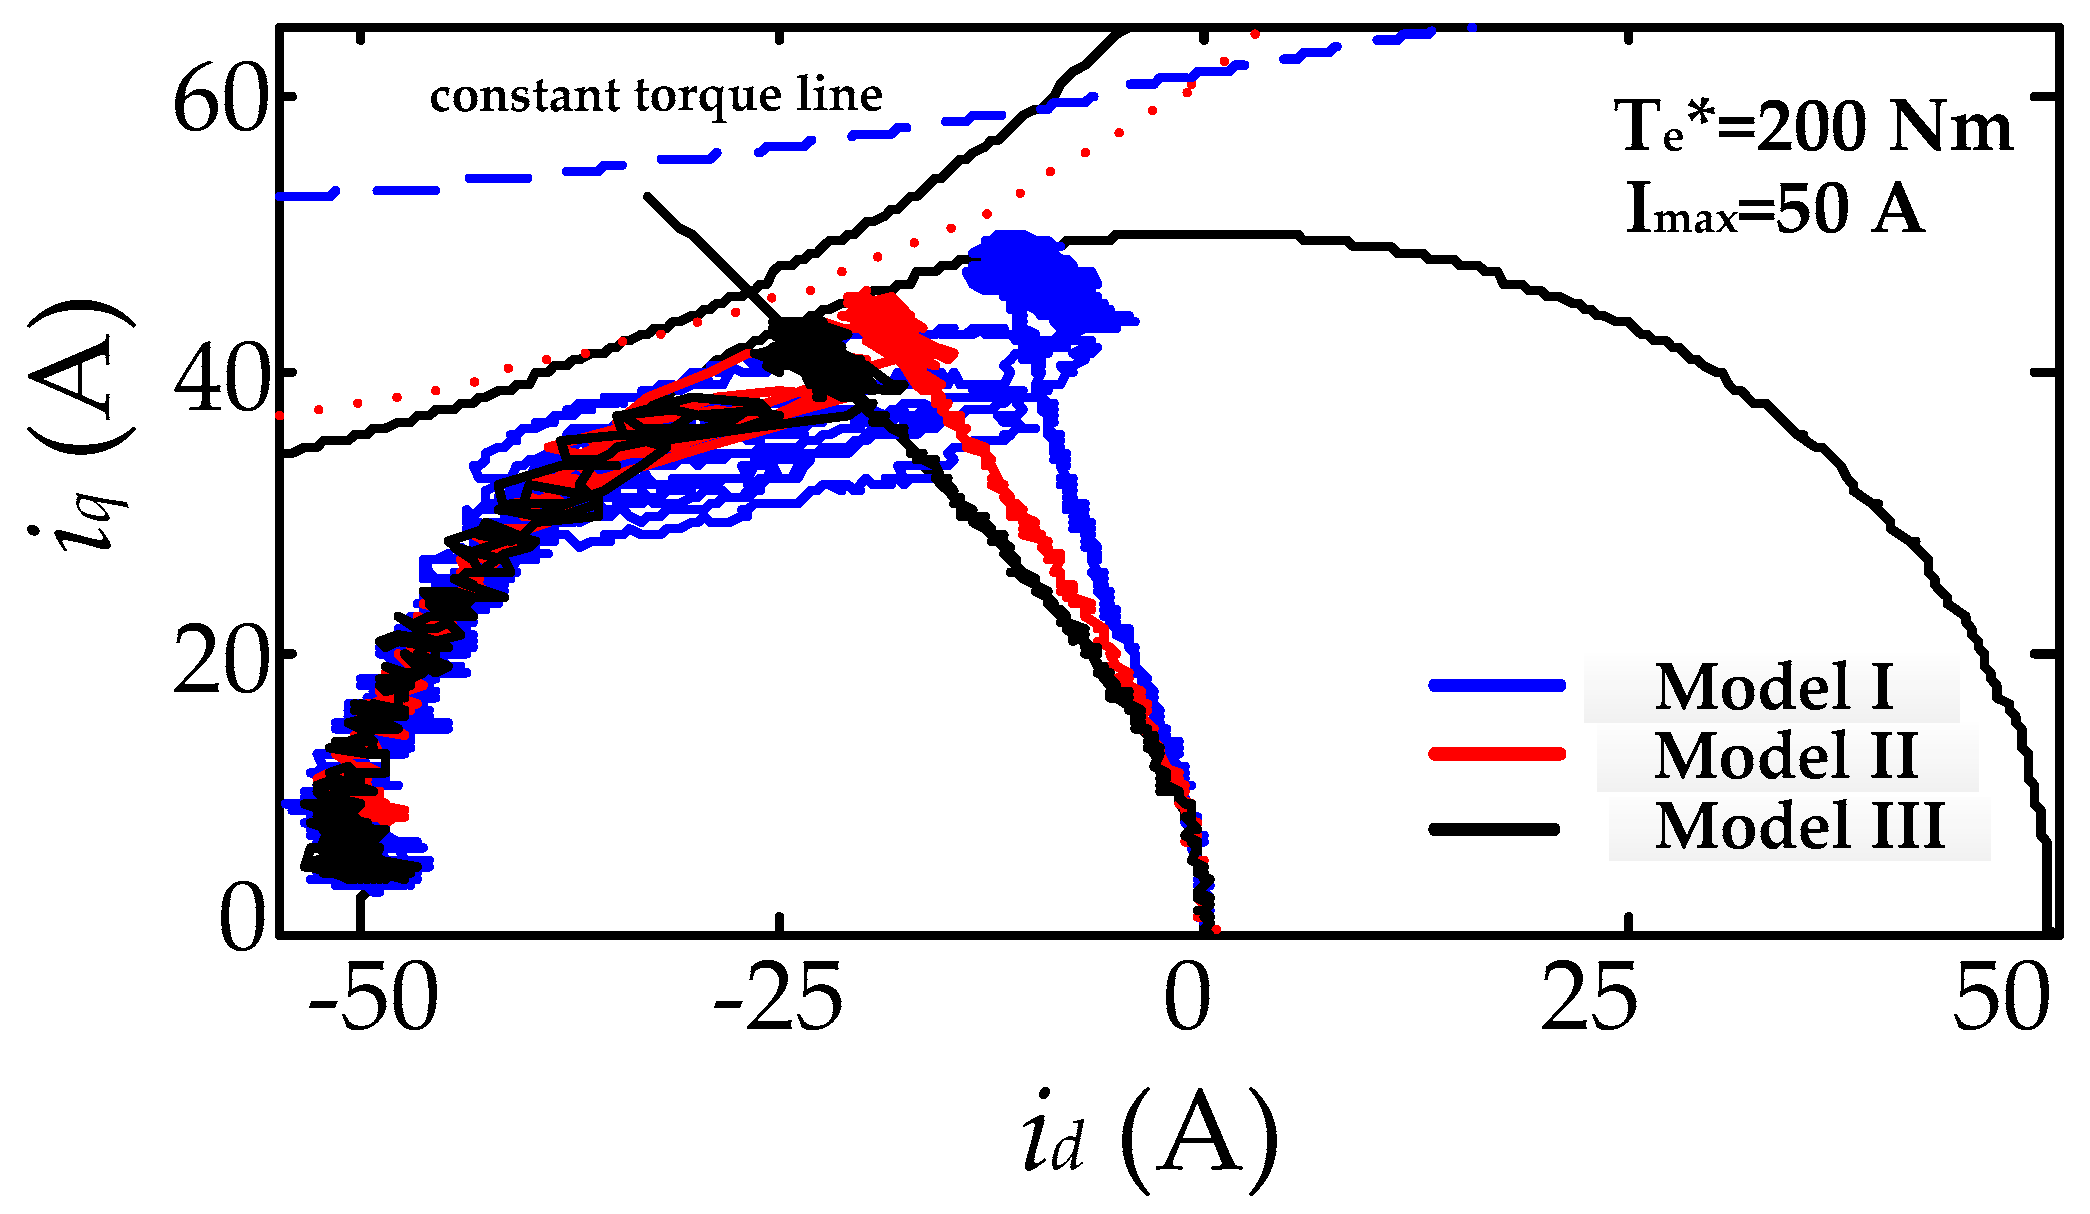
Figure 11 shows the current loci that the torque command is given at 200 nm and the current constraint circle is shrunk to 50 A. Meanwhile, the motor speed reference is set to 3000 rpm. The peak torque of Model I under the current limit is 171.04 nm, and the maximum torque of Model II and Model III is 196.07 nm and 182.94 nm, respectively. It illustrates that the saturation effect will degrade the maximum output torque performance, while the introduction of mutual inductance can slightly enlarge the torque performance. Discrepancies in the MTPA curve and the constant torque line among these three models become more significant due to the cross saturation effects, but the simulation results in Figure 11 and Figure 12 verify that the proposed current trajectory control strategy can help the motor deliver its maximum performance within the voltage safety margin and achieve a seamless transfer to a flux weakening operation, even in an extreme control condition. Moreover, both Figure 10 and Figure 12 indicate that the motor offered the lowest voltage amplitude under CTCS considering the cross saturation effect when it is operated at a deep flux weakening region. This result demonstrated that the CTCS could not only meet the demand of flux weakening during the speed up, but also ensure that the motor voltage did not exceed the limit value.
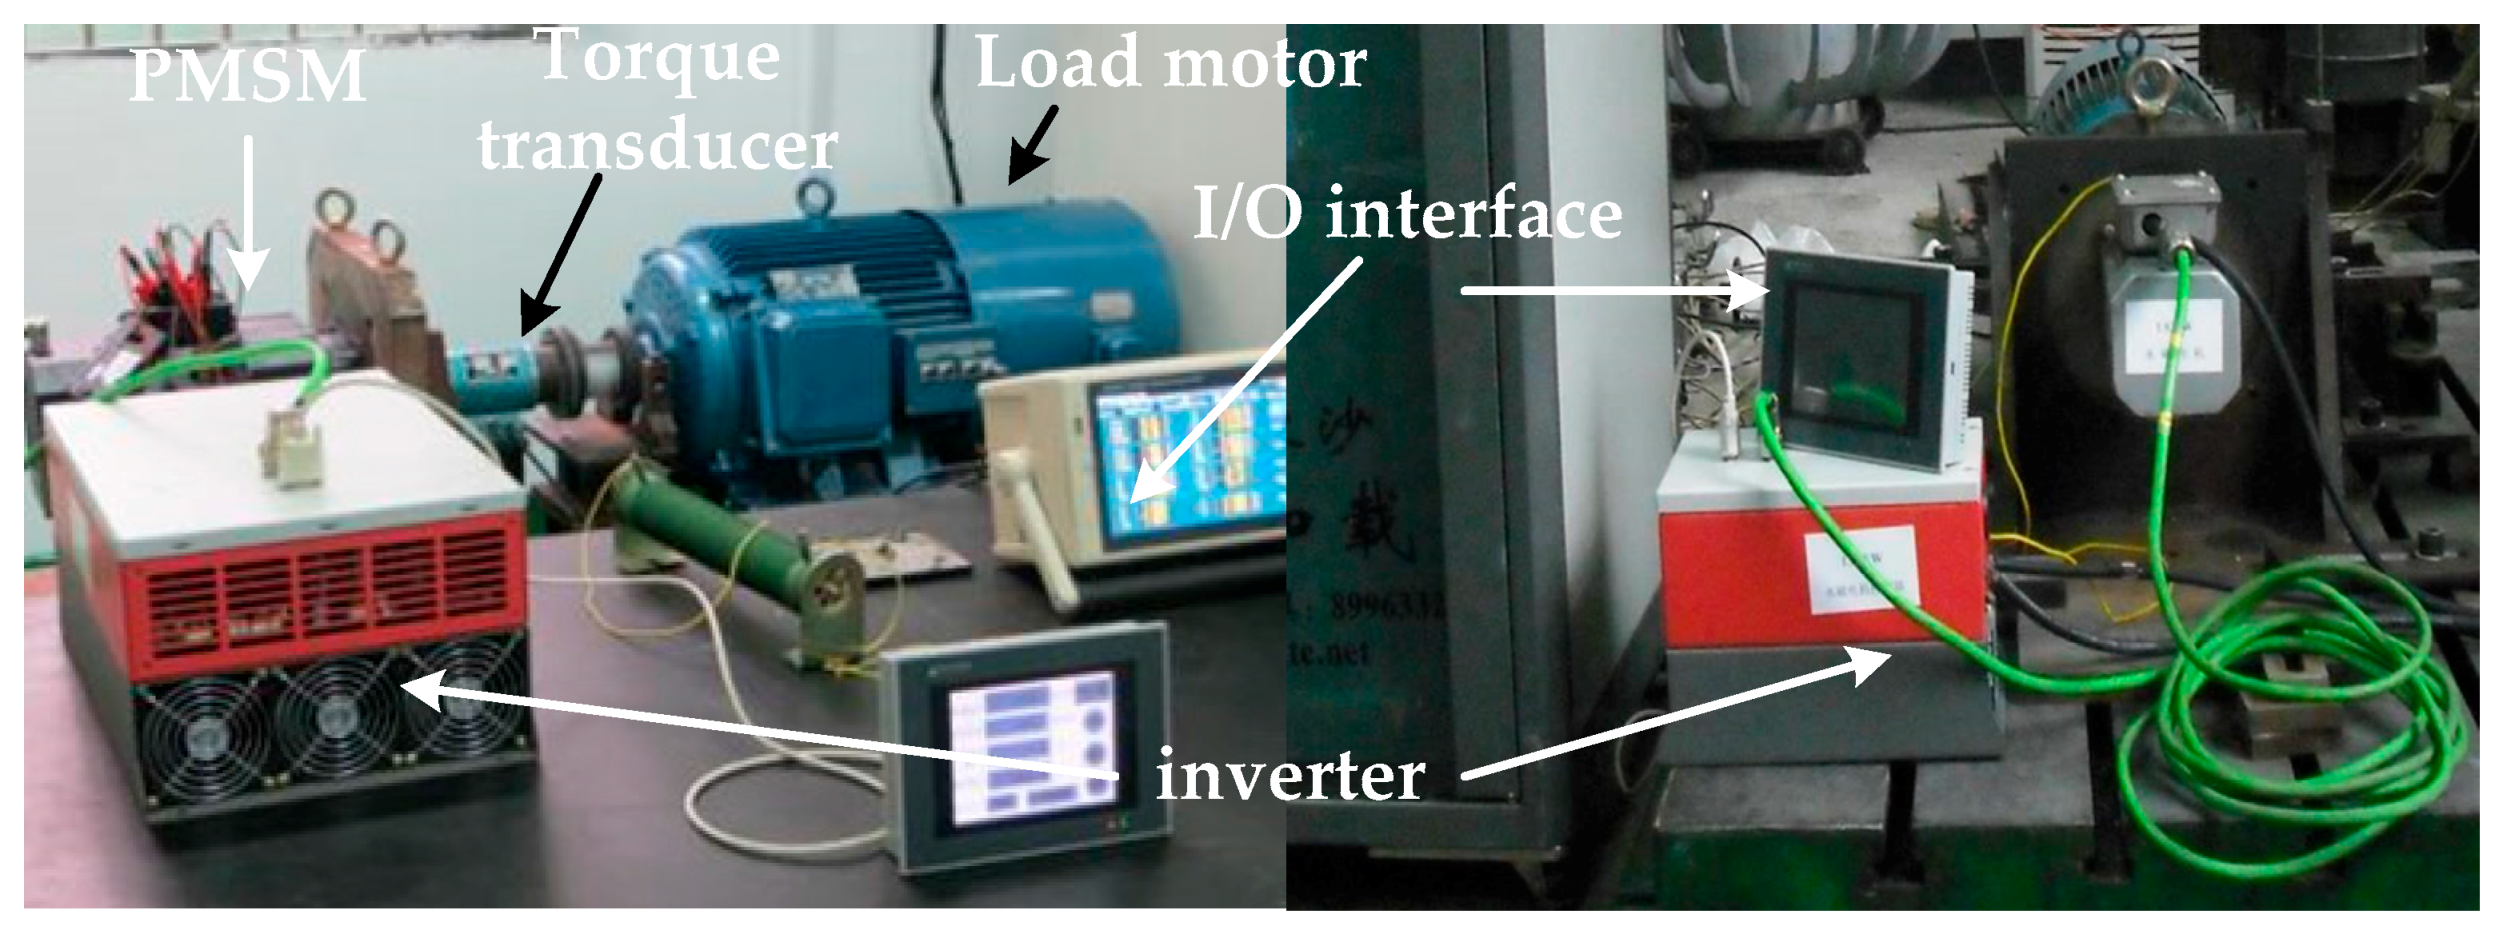
The proposed optimal control scheme has been extensively experimented against a prototype 10 kW IPMSM. A test rig has been set up, as shown in Figure 13. A precision torque transducer (HNJ-500, 0.2 nm) is applied to measure the electrical torque. In the experiment, the switching frequency of the inverter is set to 5 kHz, as well as the sampling frequency of the algorithm. The ambient temperature during the tests was kept at 23 °C, and the changes of permanent magnet flux linkage caused by the temperature were neglected. Two torque control setpoints were introduced to test the dynamic behavior of the motor, while all tests were performed with a constant dc-link voltage of 500 V.
3.1. Torque Speed Characteristic
The first test was conducted with a torque request signal of Te* = 90 nm, which is below the maximum value t limited by the current constraint circle. The current limit Imax, as well as the injected stator current, were regulated at 60 A. The torque-speed characteristic of the three models was performed with the motor speed climbing from 0 to 3100 rpm in ten minutes. The result is displayed in Figure 14. In the low speed region, it is evident that the torque performance of Model I which applied the CTCS and considered the cross-coupling and saturation effects is apparently higher than those in simplified control models. This result demonstrates the accuracy of the theoretical current trajectories in Figure 9. The current tracks the constant torque line with the speed increase, and thus, the torque requirement cannot be satisfied if the cross saturation effects are left out of the control model. In the high speed region, Model I results in the lowest output value, and the negative impact of the saturation effect on the torque in the flux weakening region become visible. However, it has always been known that the demagnetizing current id will increase with an ever-growing stator current, due to the influence of the cross coupling effect, and the d-axis demagnetizing current will introduce a demagnetization process to the q-axis magnetic circuit, which can decrease its saturation degree. Therefore, the torque performance of Model II is higher than the others.
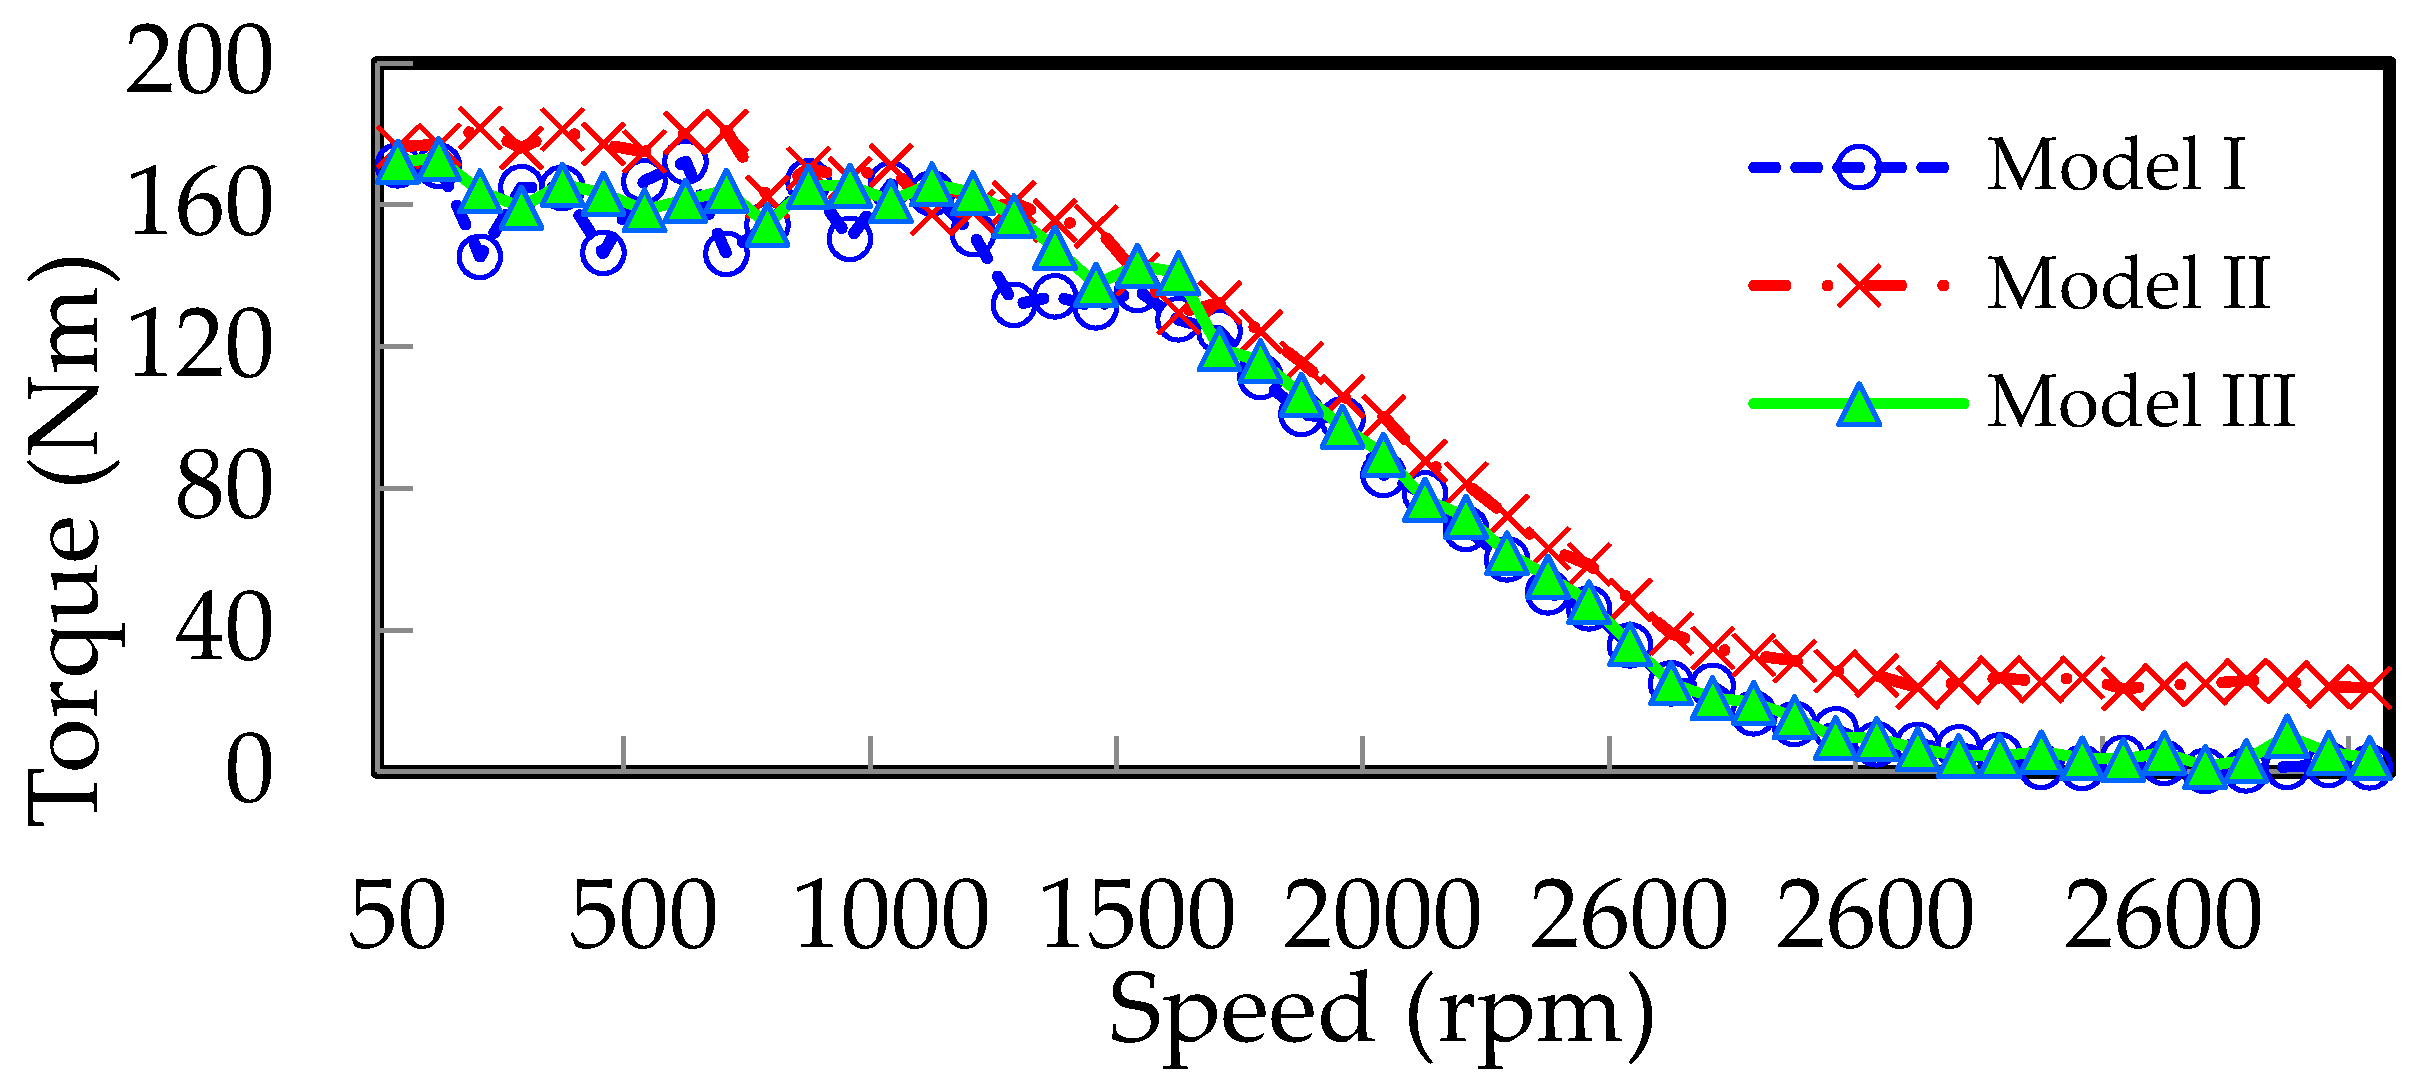
In the next step, a higher torque control target Te* = 200 nm was injected into the motor, which exceeded the maximum torque that the prototype motor can output. Then, the motor accelerated from 0 to 2600 rpm. As shown in Figure 15, the turning speed of the three models is similar, but the torque achieved by model I is slightly smaller than the other models in the constant torque operation region. Because of the restraint of the geometric trajectory algorithm, the required current component id for magnetic weakening in model I is the least of all in the low speed region, which decreases the effort of the reluctance torque component. In the constant power region, when the motor speeded up to 2600 rpm, Model I and Model III achieved the maximum degree of flux weakening. But the output torque of Model II was 40 nm at 2600 rpm, which also verified that the cross coupling inductance can extend the range of the constant power operation but the core saturation can degrade the torque performance, especially in the high speed region.
3.2. Dynamic Performance of Trajectory Control Strategy during Speed Reference Changes
In this experiment, the prototype machine is regulated in speed control mode. The nominal speed of the prototype is 1500 rpm. The current of the motor is limited to 50 A and the dc-linkage voltage of inverter is kept constant at 500 V.
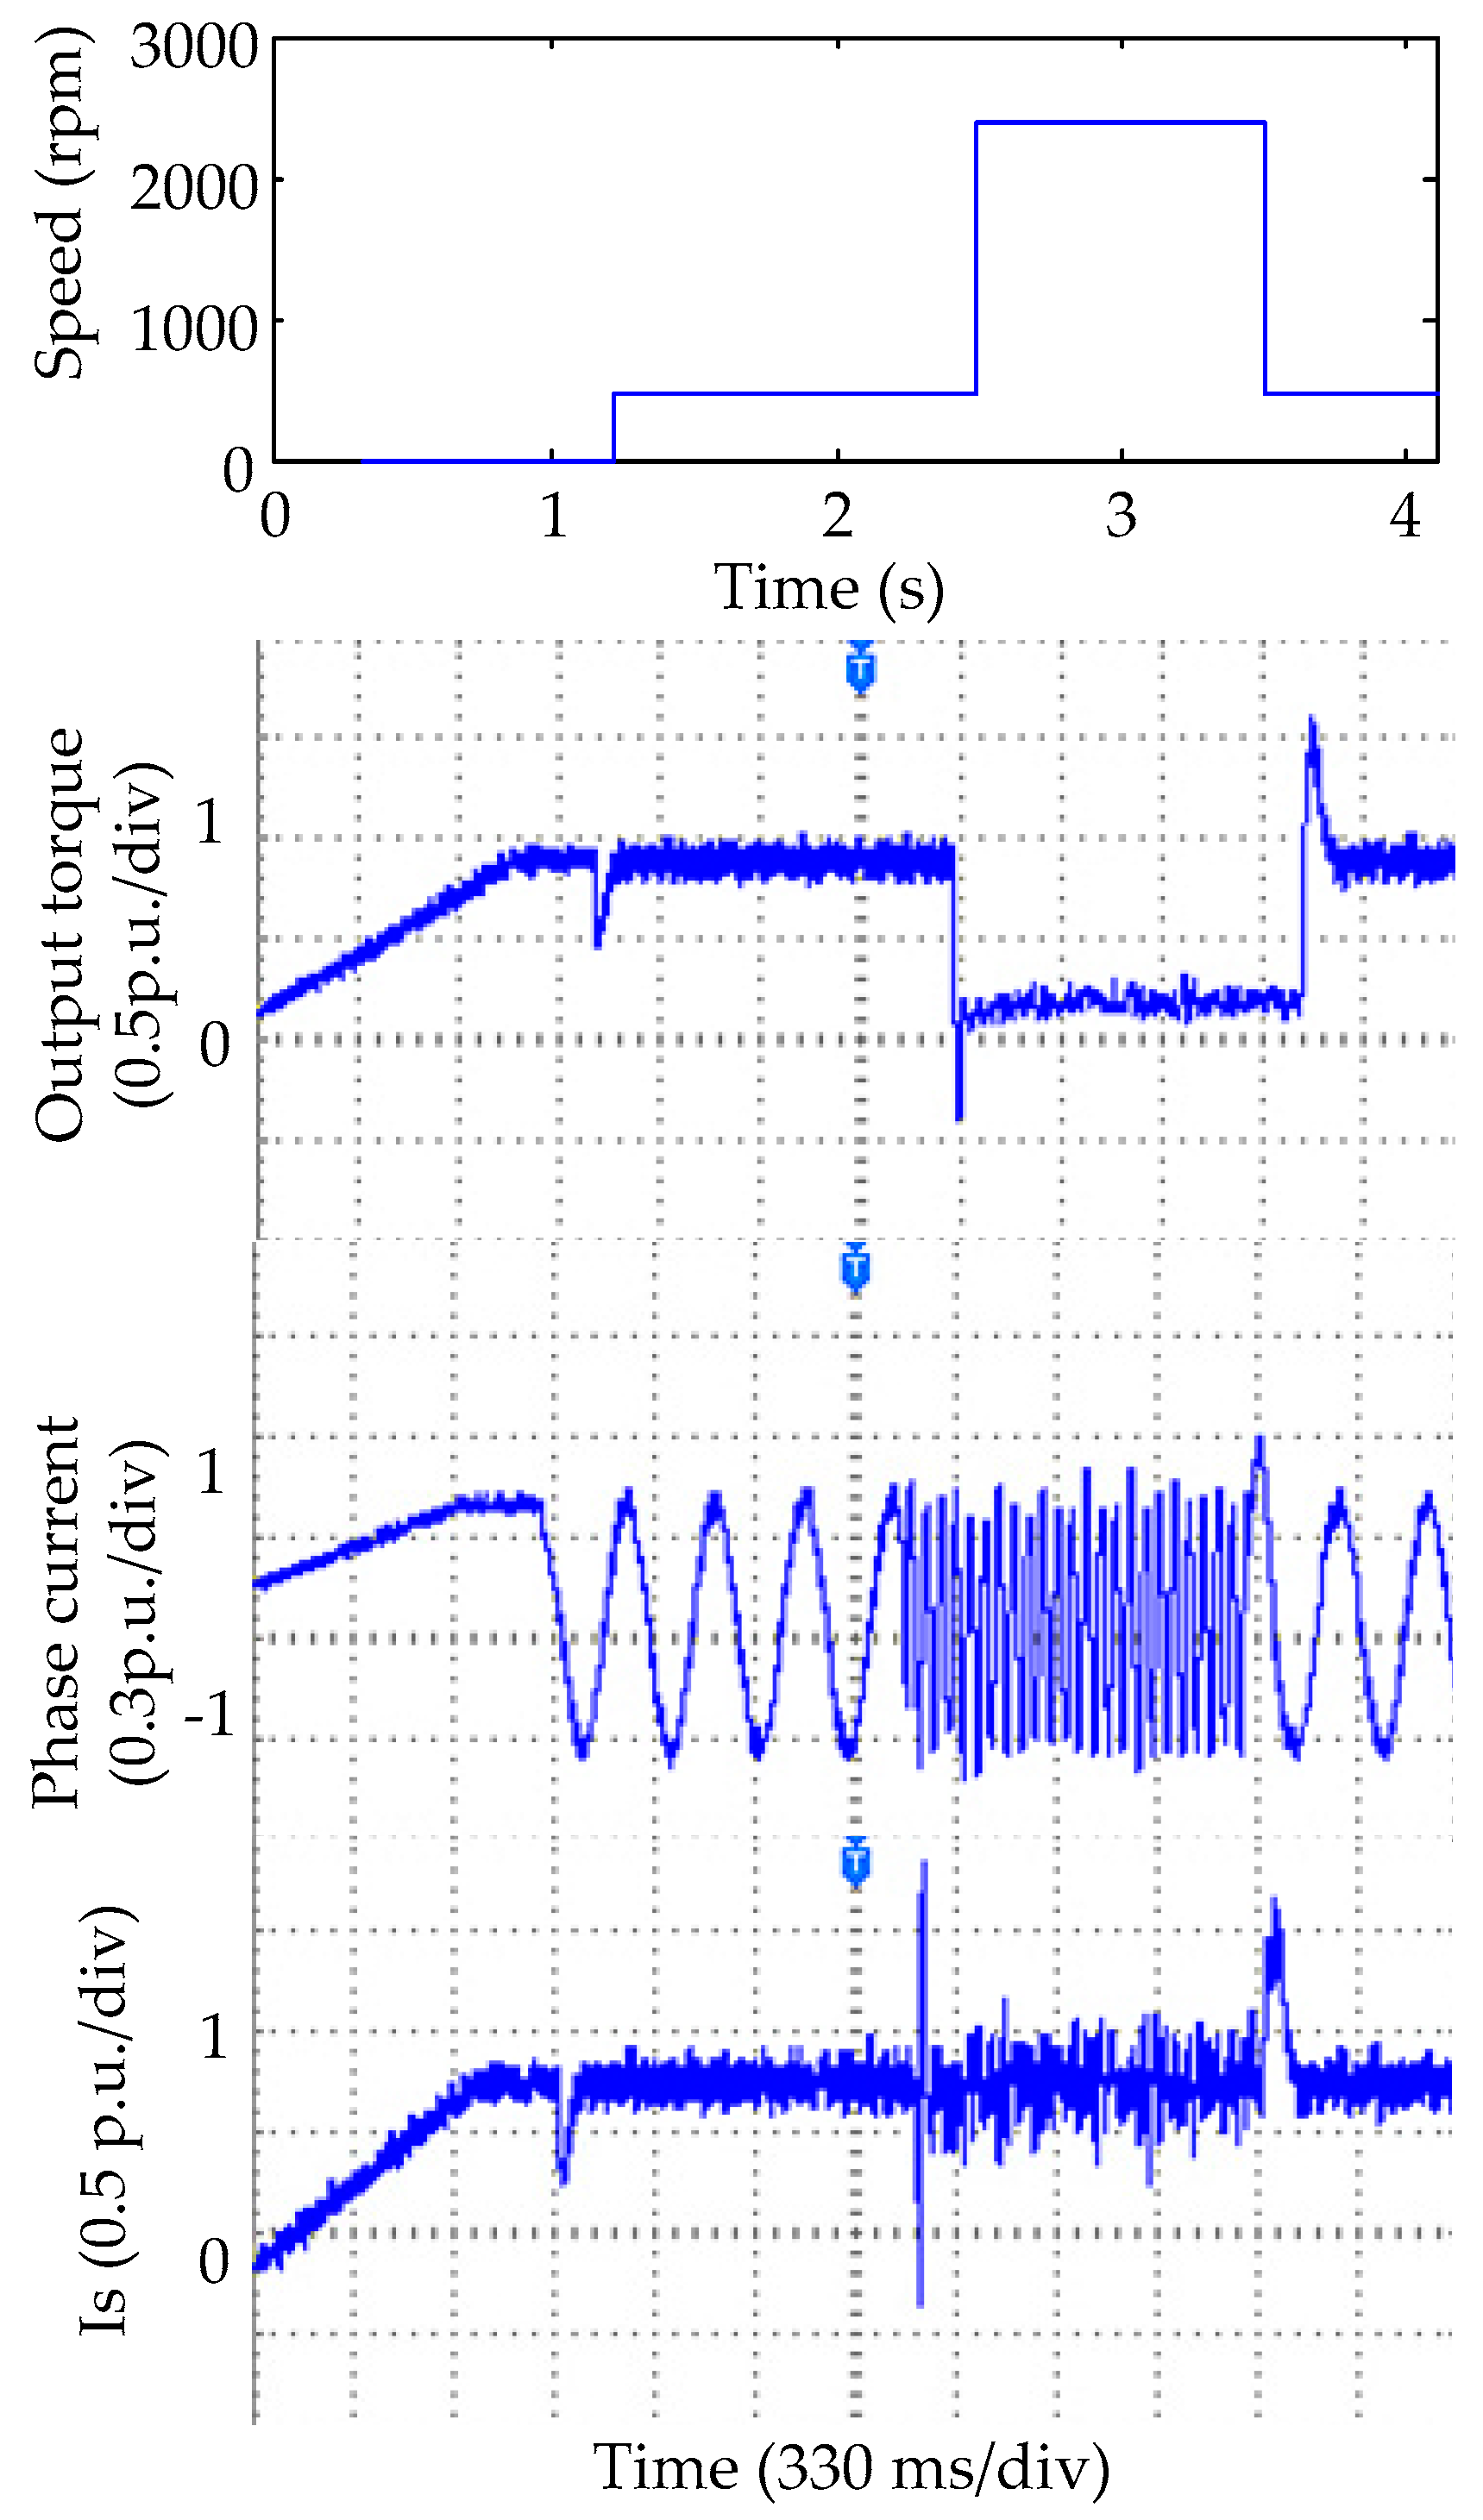
Figure 16 shows the experimental results of the output performance of the control model which considered the cross saturation effects when the step changes in speed reference occurred at the torque control signal below the maximum allowed torque (Te* = 90 nm). Figure 17 shows the experimental torque performance and current responses under the proposed control method when step changes in speed reference are applied to the torque command beyond the allowed torque (Te* = 200 nm).
It is observed from Figure 16 and Figure 17 that the reference speed changed in step manners within 5 min. It can be known that when the reference speed is below the nominal value, the motor is operated in the constant region, and the experimental results show that the proposed CTCS can help the motor meet the torque demands rapidly. Deeper flux weakening is required to avoid the overshoot of voltage when the reference speed rises above the rated speed. It can be seen in Figure 16 and Figure 17 that the dynamic responses of the current are quick and the system has a decent robustness. The torque and current performance verify that the proposed algorithm implements free seamless handoff between MTPA mode and the flux-weakening operation within a safe current region.
4. Conclusions
This paper proposed a novel current trajectory control strategy and studied the variations of machine parameters caused by the cross saturation effects. The MTPA control, which is the first step of the proposed current trajectory optimization, could be modified to translate the torque request into the current reference for the following current vector adjustment. Then, the current vectors can be conditioned towards the optimal direction by judging the position of the required torque and voltage incremental value within the current limit circle in the did, diq system. The CTCS creatively omitted the extra comparison loop of the motor voltage and the voltage limit, which is the threshold to determine whether flux weakening should be aroused. The simulation and experimental works demonstrated that parameter variation and cross coupling effects can apparently affect the MTPA trajectory and output torque performance, and therefore, the control precision of the conventional fixed parameter control strategy is relatively low. The proposed current trajectory control strategy takes parameter changes into account in each step and shows a decent agreement with the actual operation situation of the motor; therefore, the control precision could be apparently improved. The results of the simulation and experiment can also verify that the proposed control strategy can realize a seamless switch between the constant torque and constant power operation and implement a rapid response, ensuring a fine robustness of the system in full-range of the speed.
Acknowledgments
This work was supported in part by the Education Ministry Joint Fund of China (6141A02022506).
Author Contributions
Huimin Li, Jian Gao designed the proposed control strategy; Huimin Li conducted experimental works, modeling, and the FEA simulation; Shoudao Huang and Peng Fan helped write the paper.
Conflicts of Interest
The author declares no conflict of interest.
References
- Liang, P.; Pei, Y.; Chai, F.; Zhao, K. Analytical calculation of d- and q-axis inductance for interior permanent magnet motors based on winding function theory. Energies 2016, 9, 580. [Google Scholar] [CrossRef]
- Guo, Q.; Zhang, C.; Li, L.; Zhang, J.; Wang, M. Maximum efficiency per torque control of permanent-magnet synchronous machines. Appl. Sci. 2016, 6, 425. [Google Scholar] [CrossRef]
- EL-Refaie, A.M.; Jahns, T.M.; Reddy, P.B.; McKeever, J.W. Modified vector control algorithm for increasing partial-load efficiency of fractional-slot concentrated-winding surface PM machines. IEEE Trans. Ind. Appl. 2008, 44, 1543–1551. [Google Scholar] [CrossRef]
- Dang, L.; Bernard, N.; Bracikowski, N.; Berthiau, G. Design optimization with flux-weakening of High-speed PMSM for electrical vehicle considering the driving cycle. IEEE Trans. Ind. Electron. 2017. [Google Scholar] [CrossRef]
- Jung, S.Y.; Hong, J.; Nam, K. Current minimizing torque control of the IPMSM using Ferrari’s method. IEEE Trans. Power Electron. 2013, 28, 5603–5617. [Google Scholar] [CrossRef]
- Ge, H.; Bilgin, B.; Emadi, A. Global loss minimization control of PMSM considering cross coupling and saturation. In Proceedings of the 2015 IEEE Energy Conversion Congress and Exposition (ECCE), Montreal, QC, Canada, 20–24 September 2015; pp. 6139–6144. [Google Scholar]
- Han, S.H.; Soong, W.L.; Jahns, T.M.; Güven, M.K.; Illindala, M.S. Reducing harmonic eddy-current losses in the stator teeth of interior permanent magnet synchronous machines during flux weakening. IEEE Trans. Energy Convers. 2010, 25, 441–449. [Google Scholar] [CrossRef]
- Morimoto, S.; Takeda, Y.; Hirasa, T.; Taniguchi, K. Expansion of operating limits for permanent magnet motor by current vector control considering inverter capacity. IEEE Trans. Ind. Appl. 1990, 26, 866–871. [Google Scholar] [CrossRef]
- Morimoto, S.; Takeda, Y.; Hirasa, T.; Taniguchi, K. Expansion of operating limits for permanent magnet motor by optimum flux-weakening. In Proceedings of the IEEE Industry Applications Society Annual Meeting, San diego, CA, USA, 1–5 October 1989; pp. 51–56. [Google Scholar]
- Morimoto, S.; Sanada, M.; Takeda, Y. Wide-speed operation of interior permanent magnet synchronous motors with high-performance current regulator. IEEE Trans. Ind. Appl. 1994, 30, 920–926. [Google Scholar] [CrossRef]
- Ching-Tsai, P.; Sue, S.M. A linear maximum torque per ampere control for IPMSM drives over full-speed range. IEEE Trans. Energy Convers. 2005, 20, 359–366. [Google Scholar]
- Dey, T.; Mukherjee, K.; Syam, P. Dynamic adjustments of the d-q axes reference voltage limits during flux weakening and MTPA control of an IPMSM drive for an EV application. In Proceedings of the 2nd International Conference on Control, Instrumentation, Energy & Communication (CIEC), Kolkata, West Bengal, India, 28–30 January 2016; pp. 324–328. [Google Scholar]
- Lu, D.; Kar, N.C. A review of flux-weakening control in permanent magnet synchronous machines. In Proceedings of the IEEE Vehicle Power and Propulsion Conference, Lille, France, 1–3 September 2010; pp. 1–6. [Google Scholar]
- Kang, G.; Lim, J.; Nam, K.; Ihm, H.B.; Kim, H.G. A MTPA control scheme for an IPM synchronous motor considering magnet flux variation caused by temperature. In Proceedings of the IEEE Application Power Electronics Conference, Anaheim, CA, USA, 22–26 February 2004; pp. 1617–1621. [Google Scholar]
- Lee, J.; Nam, K.; Choi, S.; Kwon, S. Loss-minimizing control of IPMSM with the use of polynomial approximations. IEEE Trans. Power Electron. 2009, 24, 1071–1082. [Google Scholar]
- Chen, M.D.; Levi, E.; Pelka, M. Iron saturation effects in pm ac motors. IEEE Trans. Magn. 1985, 21, 1262–1265. [Google Scholar] [CrossRef]
- Kim, H.; Hartwig, J.; Lorenz, R.D. Using on-line parameter estimation to improve efficiency of IPM machine. In Proceedings of the IEEE 33rd Annual Power Electronics Specialists Conference, Cairns, Australia, 23–27 June 2002; pp. 815–820. [Google Scholar]
- Rabiei, A.; Thiringer, T.; Alatalo, M.; Grunditz, E.A. Improved maximum torque per ampere algorithm accounting for core saturation, cross-coupling effect, and temperature for a PMSM intended for vehicular applications. IEEE Trans. Transp. Electrification 2016, 2, 150–159. [Google Scholar] [CrossRef]
- Lee, S.T.; Burres, T.A.; Tolbert, L.M. Power-factor and torque calculation with consideration of cross saturation of the interior permanent magnet synchronous motor with brushless field excitation. In Proceedings of the IEEE International Electric Machine and Drives Conference, Miami, FL, USA, 3–6 May 2009; pp. 317–322. [Google Scholar]
- Li, Z.; Li, H. MTPA control of IPMSM system considering saturation and cross-coupling. In Proceedings of the 15th International Conference on Electrical Machines and Systems (ICEMS), Sapporo, Japan, 21–24 October 2012; pp. 1–5. [Google Scholar]
- Sun, T.; Wang, J.; Chen, X. Maximum torque per ampere (MTPA) control for interior permanent magnet synchronous machine drives based on virtual signal injection. IEEE Trans. Power Electron. 2015, 30, 5036–5045. [Google Scholar] [CrossRef]
- Stumberger, B.; Stumberger, G.; Dolinar, D.; Hamler, A.; Trlep, M. Evaluation of saturation and cross-magnetization effects in interior permanent-magnet synchronous motor. IEEE Trans. Ind. Appl. 2003, 39, 1264–1271. [Google Scholar] [CrossRef]
- Deb, K.; Pratap, A.; Agarwal, S.; Meyarivan, T. A Fast and elitist multiobjective genetic algorithm: NSGA-II. IEEE Trans. Evol. Comput. 2002, 6, 182–196. [Google Scholar] [CrossRef]
Figure 1.
Magnet flux circuit under different current excitation meanwhile set as Ψf = 0. (a) d-axis magnet flux circuit with iq = 0; (b) q-axis magnet flux circuit with id = 0.
Figure 1.
Magnet flux circuit under different current excitation meanwhile set as Ψf = 0. (a) d-axis magnet flux circuit with iq = 0; (b) q-axis magnet flux circuit with id = 0.

Figure 2.
Flux linkages as a function of the dq-axis current. (a) d-axis flux linkage; (b) q-axis flux linkage.
Figure 2.
Flux linkages as a function of the dq-axis current. (a) d-axis flux linkage; (b) q-axis flux linkage.
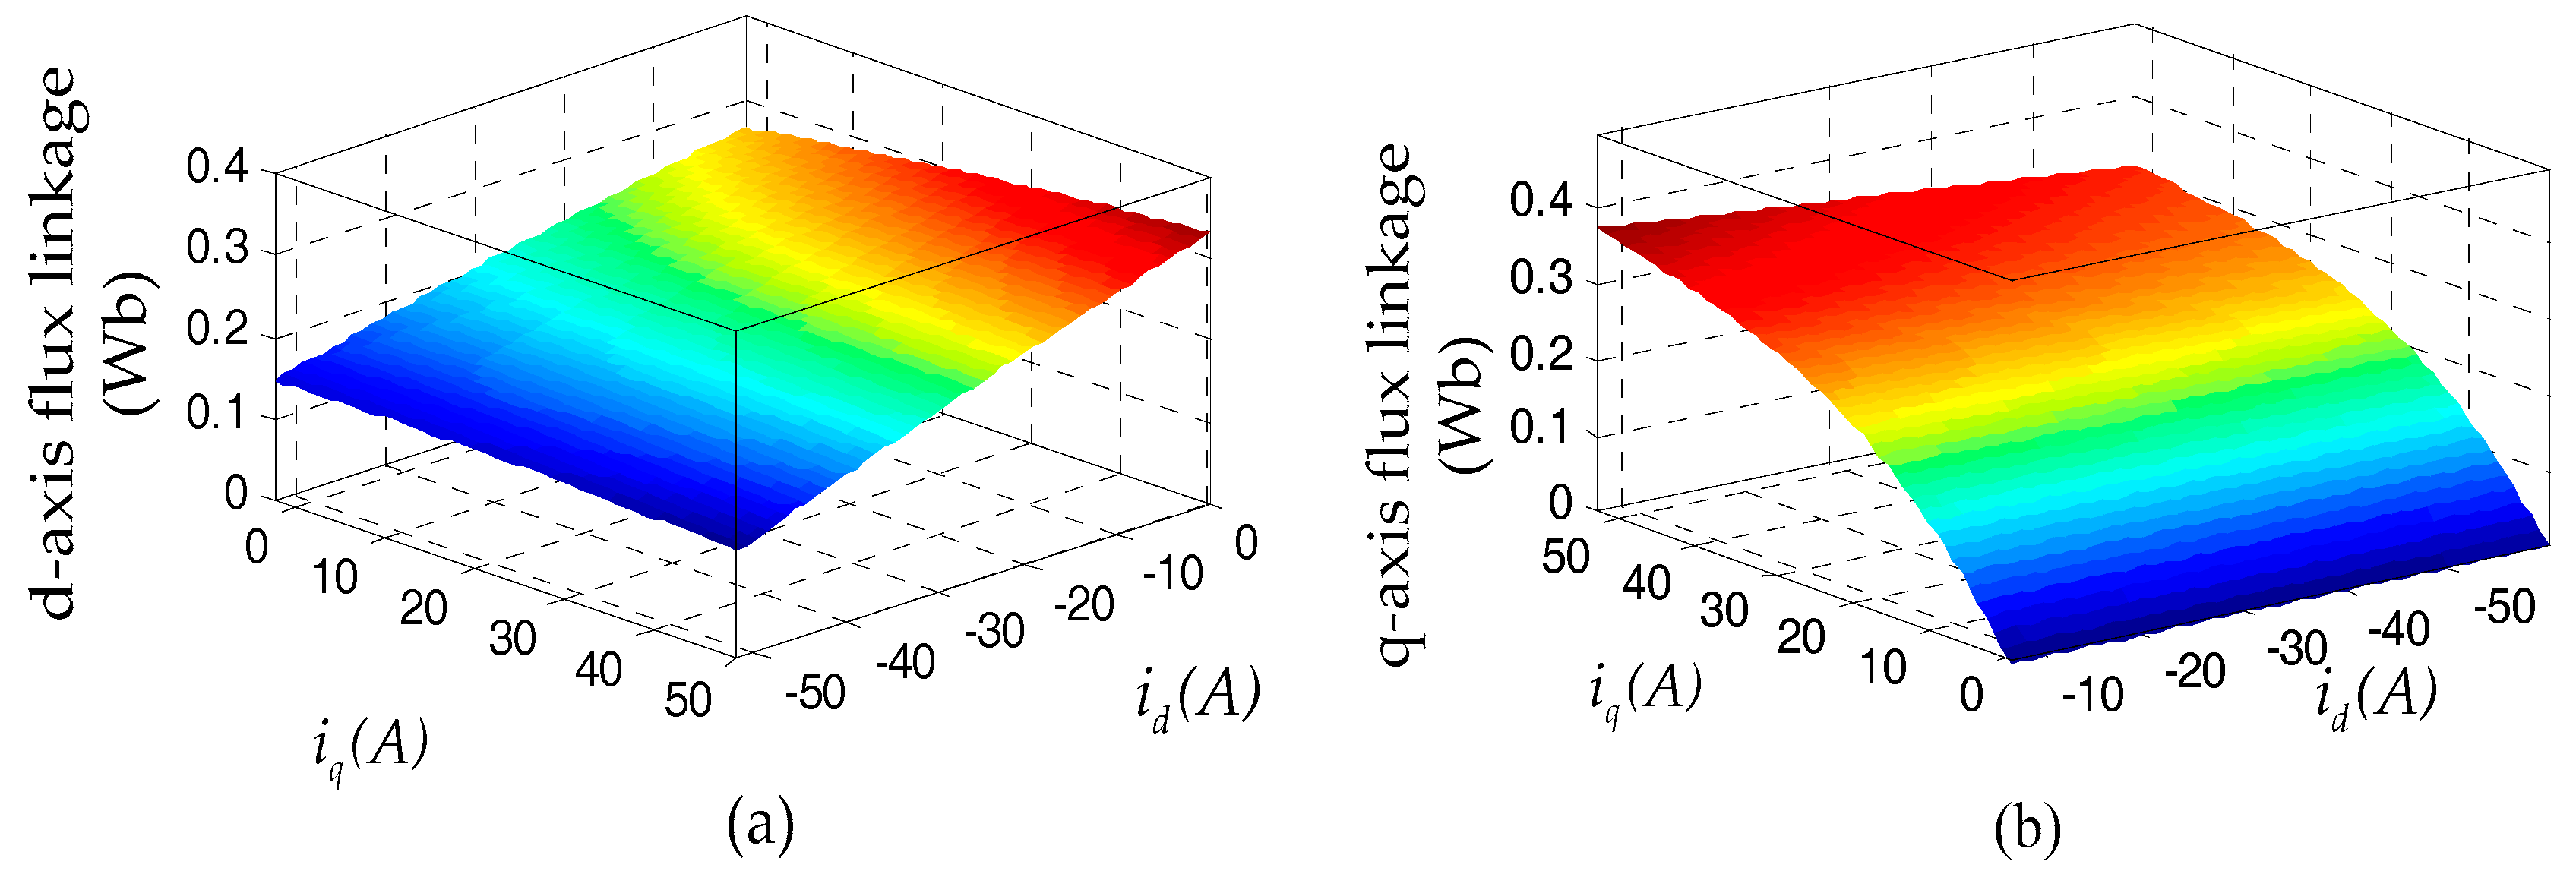
Figure 3.
Nonlinear stator inductance as a function of the dq-axis current. (a) d-axis inductance; (b) q-axis inductance.
Figure 3.
Nonlinear stator inductance as a function of the dq-axis current. (a) d-axis inductance; (b) q-axis inductance.

Figure 4.
Nonlinear characteristic of stator inductance as a function of current. (a) d-axis inductance with d-axis current; (b) q-axis inductance with q-axis current.
Figure 4.
Nonlinear characteristic of stator inductance as a function of current. (a) d-axis inductance with d-axis current; (b) q-axis inductance with q-axis current.
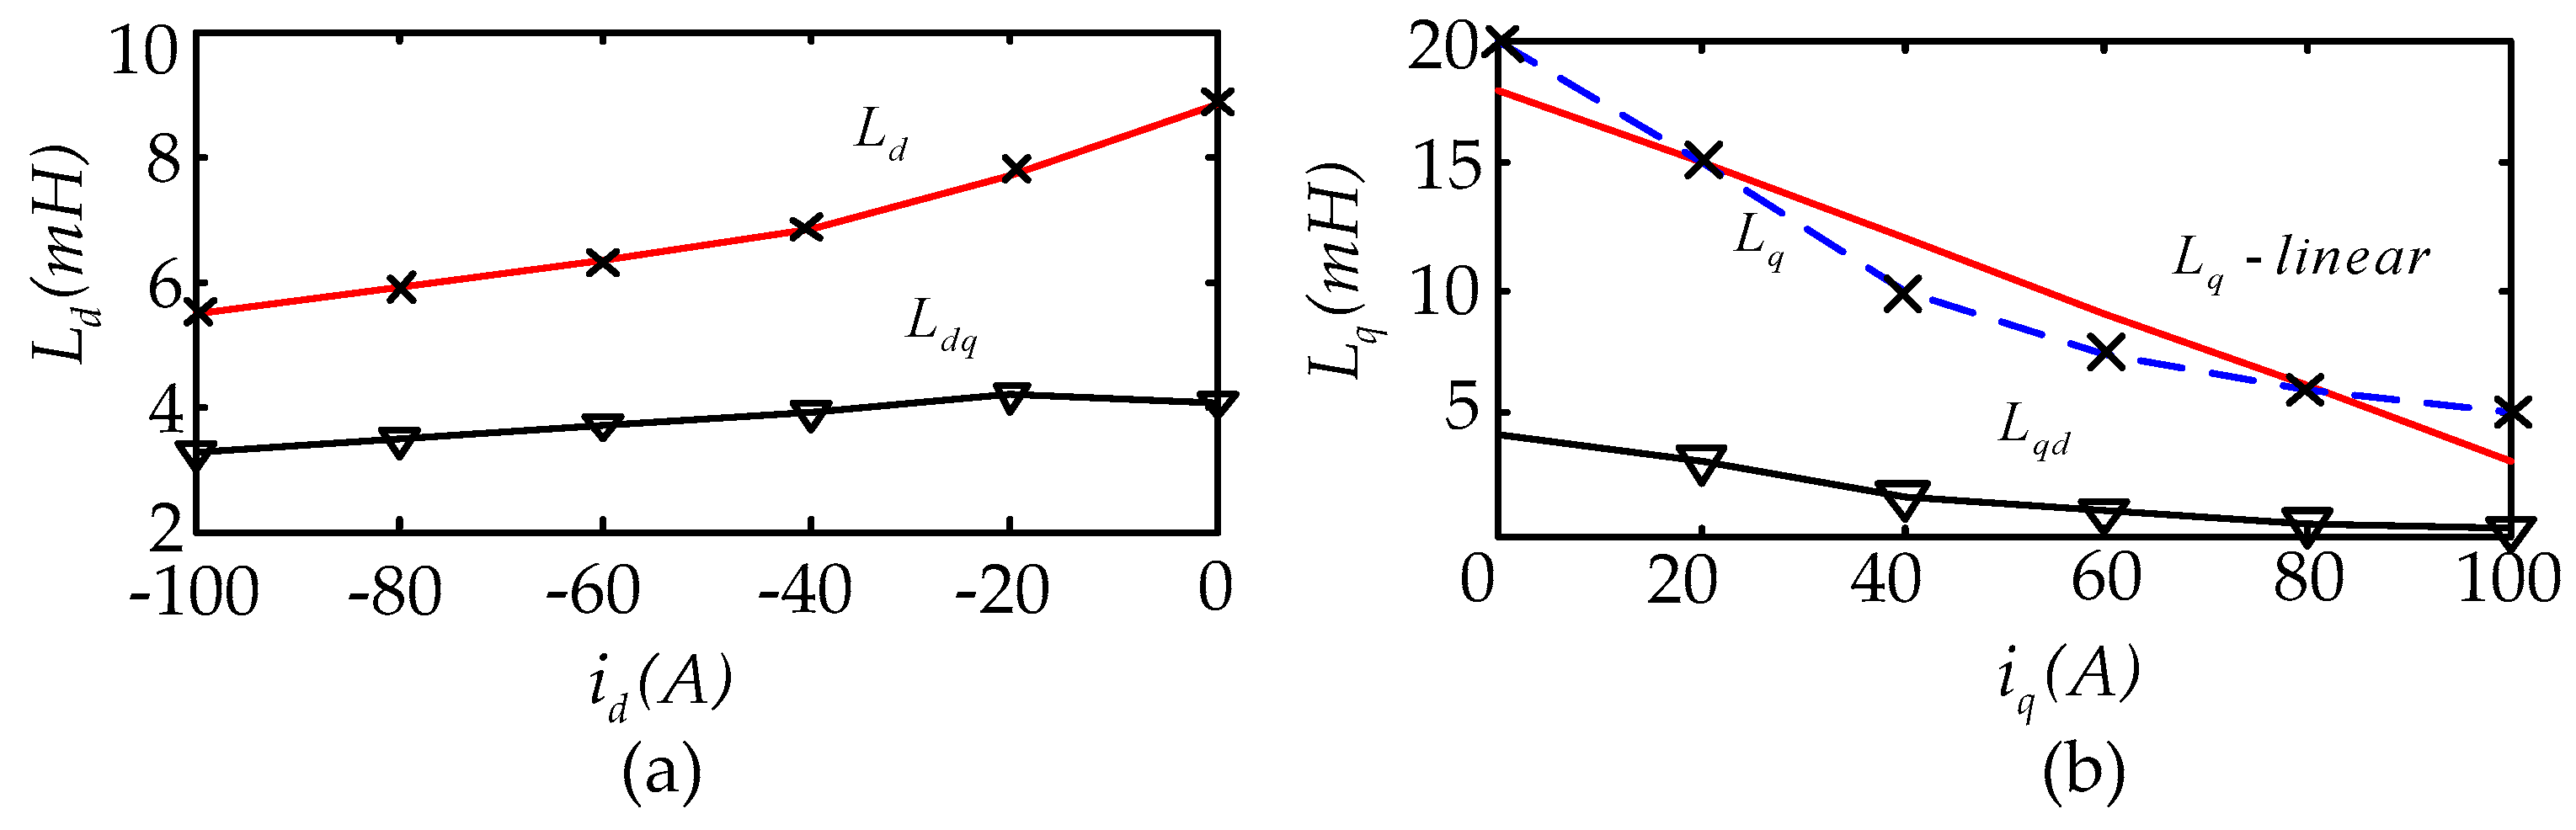
Figure 5.
An overview of the current trajectory control strategy.

Figure 6.
Linearized torque and voltage locus in the dq-axis framework.

Figure 7.
Geometrical description of the current incremental adjustment vector. (a) Voltage change line beyond the current limit circle; (b) the crosspoint of the torque and voltage request line located in the right hand side of the optimal current point.
Figure 7.
Geometrical description of the current incremental adjustment vector. (a) Voltage change line beyond the current limit circle; (b) the crosspoint of the torque and voltage request line located in the right hand side of the optimal current point.
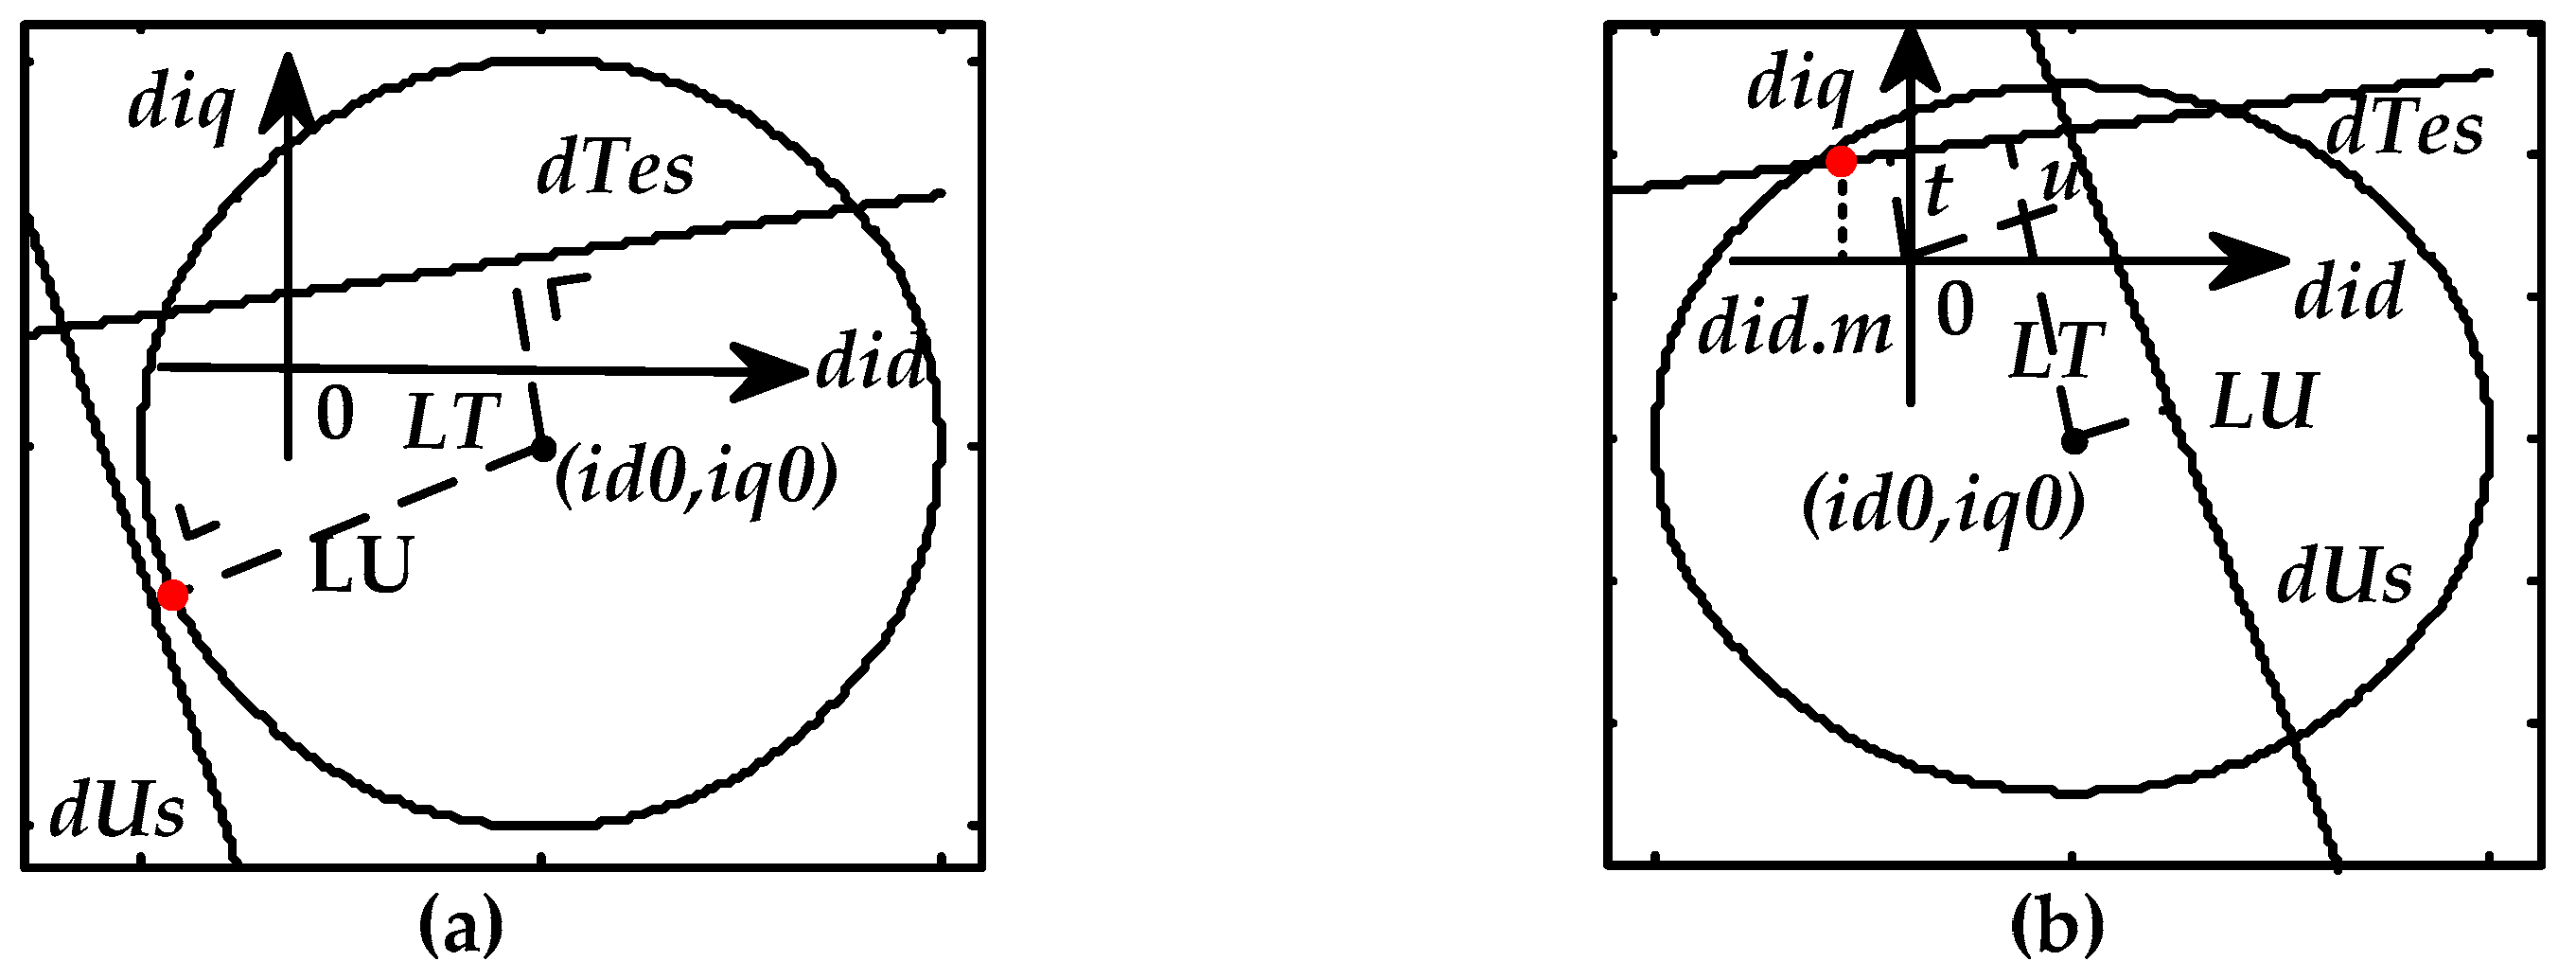
Figure 8.
Schematic overview of the incremental current adjustment control.

Figure 9.
Simulation result of current trajectory when torque command is limited to 90 nm.

Figure 10.
Simulation result of (a) voltage and (b) current amplitude when torque command is limited to 90 nm.
Figure 10.
Simulation result of (a) voltage and (b) current amplitude when torque command is limited to 90 nm.

Figure 11.
Simulation result of current trajectory when torque command is limited to 200 nm.

Figure 12.
Simulation result of (a) voltage and (b) current amplitude when torque command is limited to 200 nm.
Figure 12.
Simulation result of (a) voltage and (b) current amplitude when torque command is limited to 200 nm.
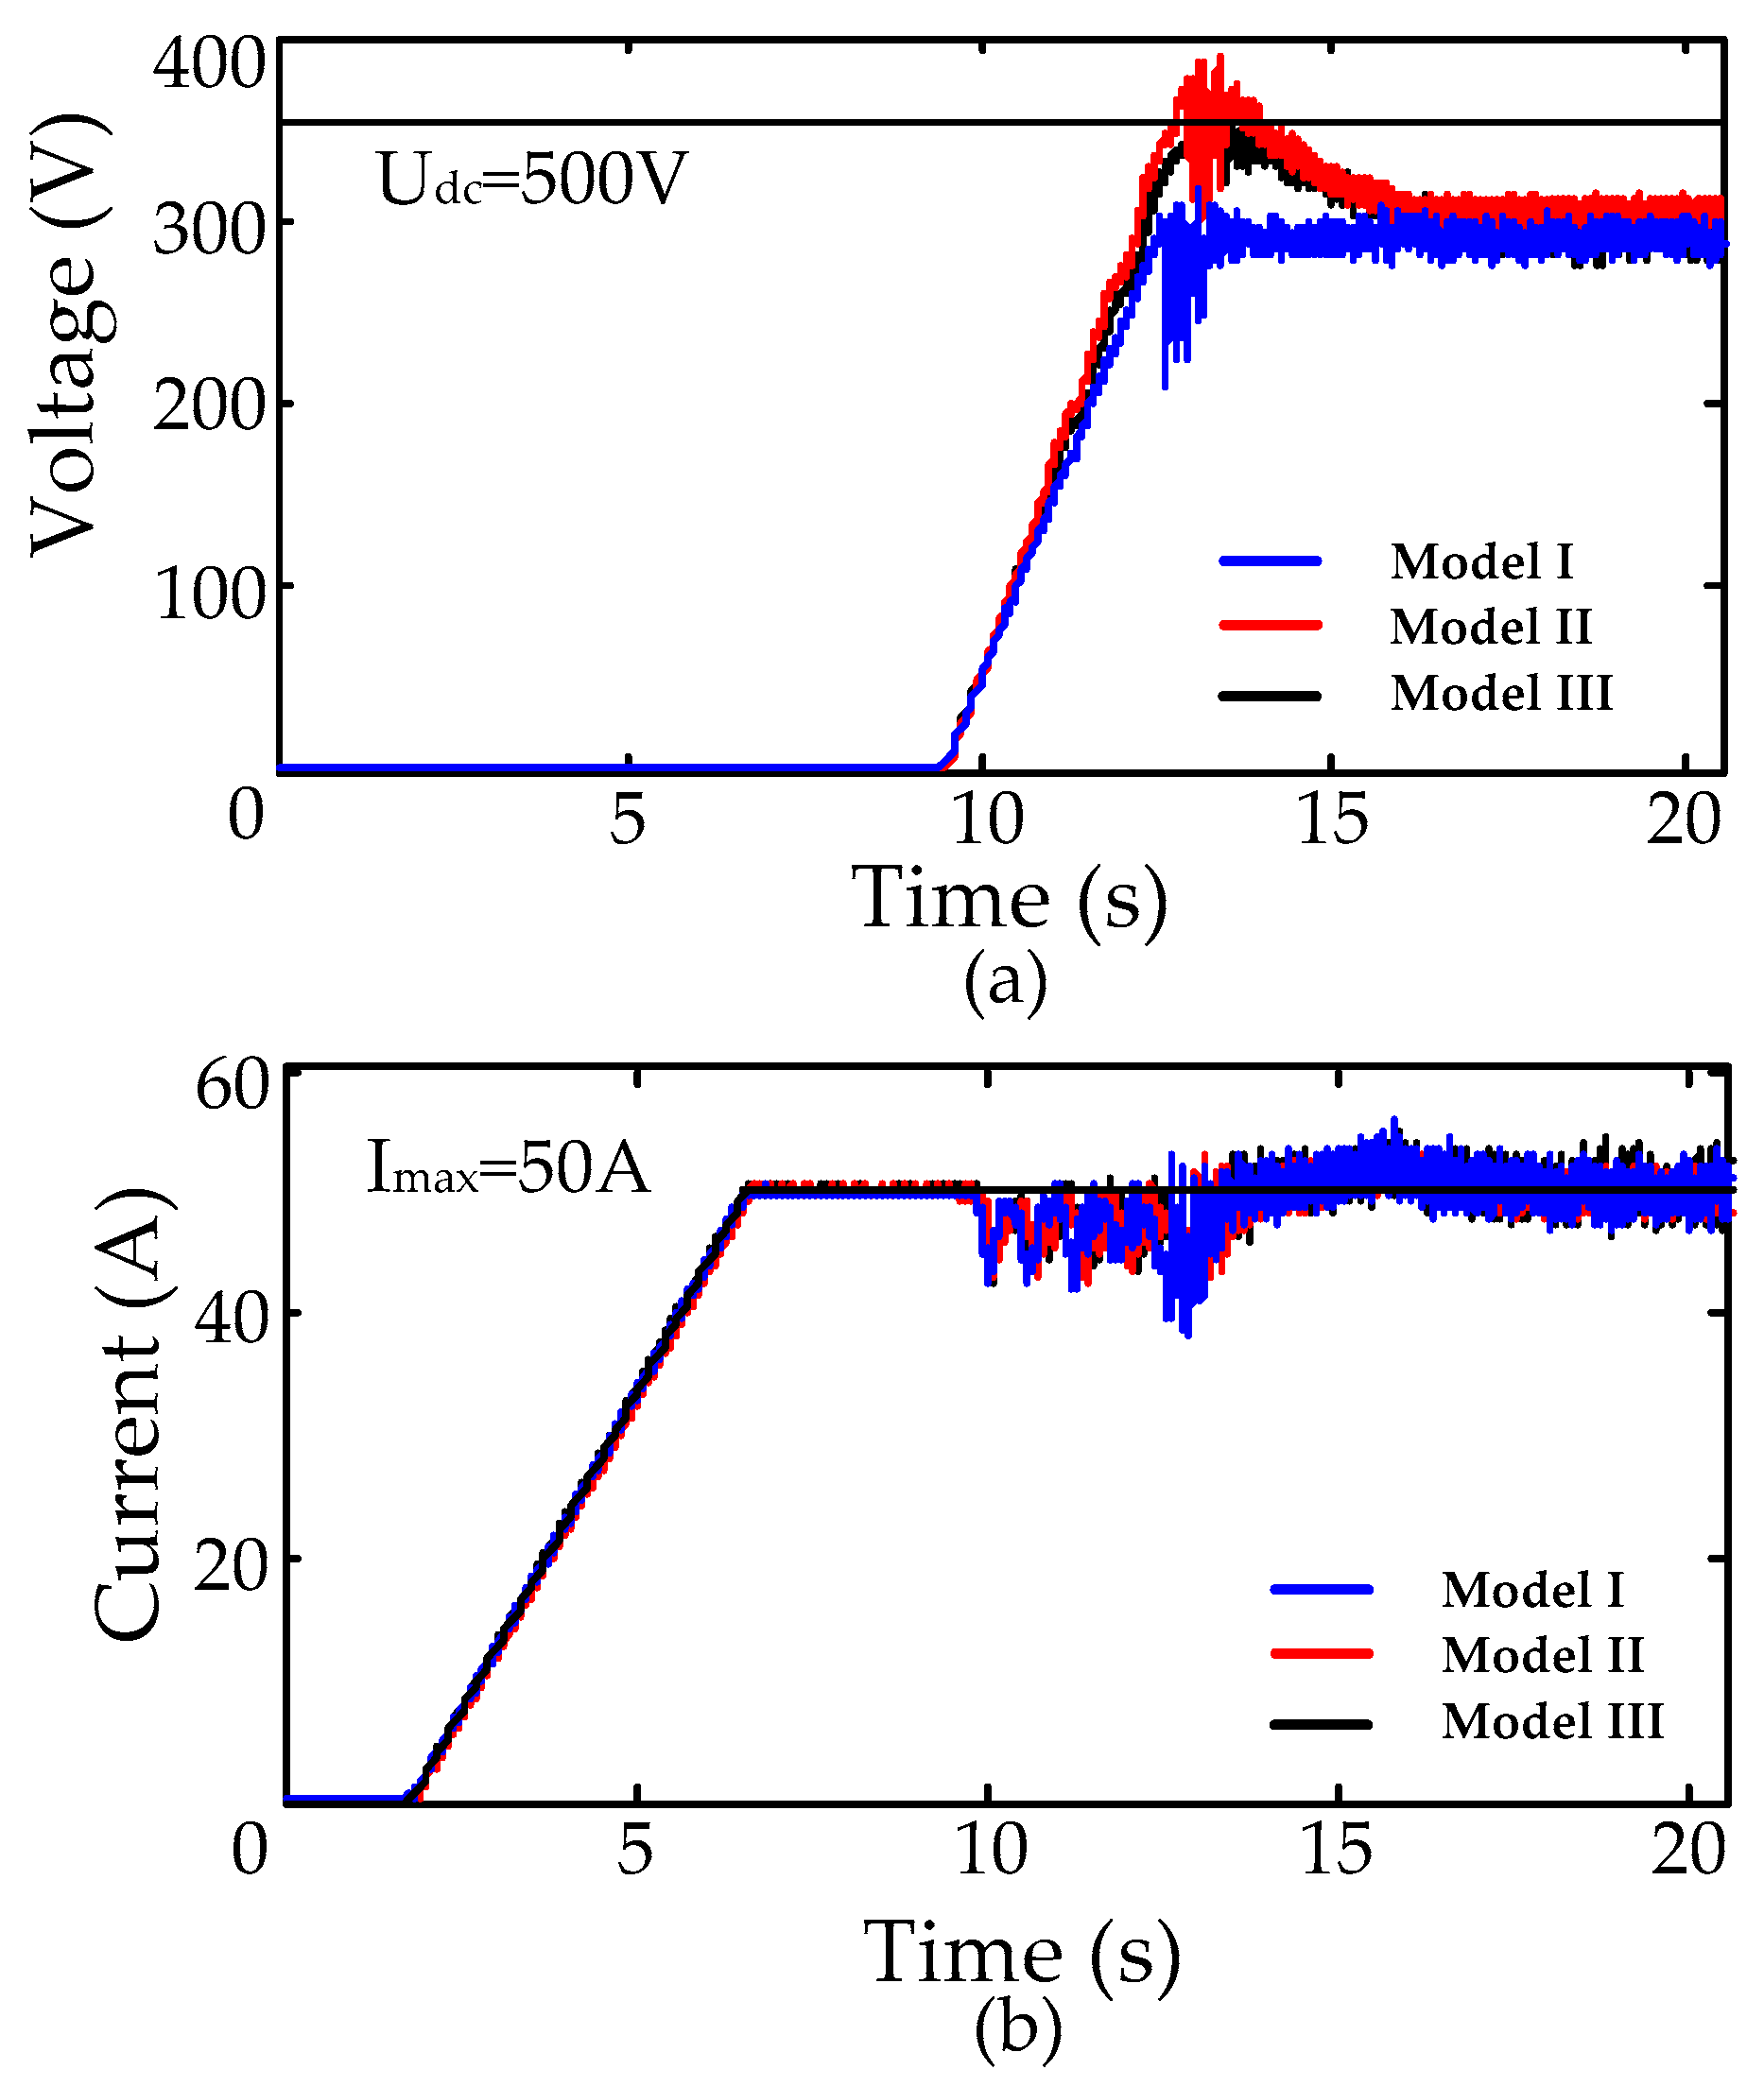
Figure 13.
Laboratory prototype of current trajectory control with sampling frequency f = 5 kHz.

Figure 14.
Torque-speed characteristic in different models when the torque command Te* = 90 nm.
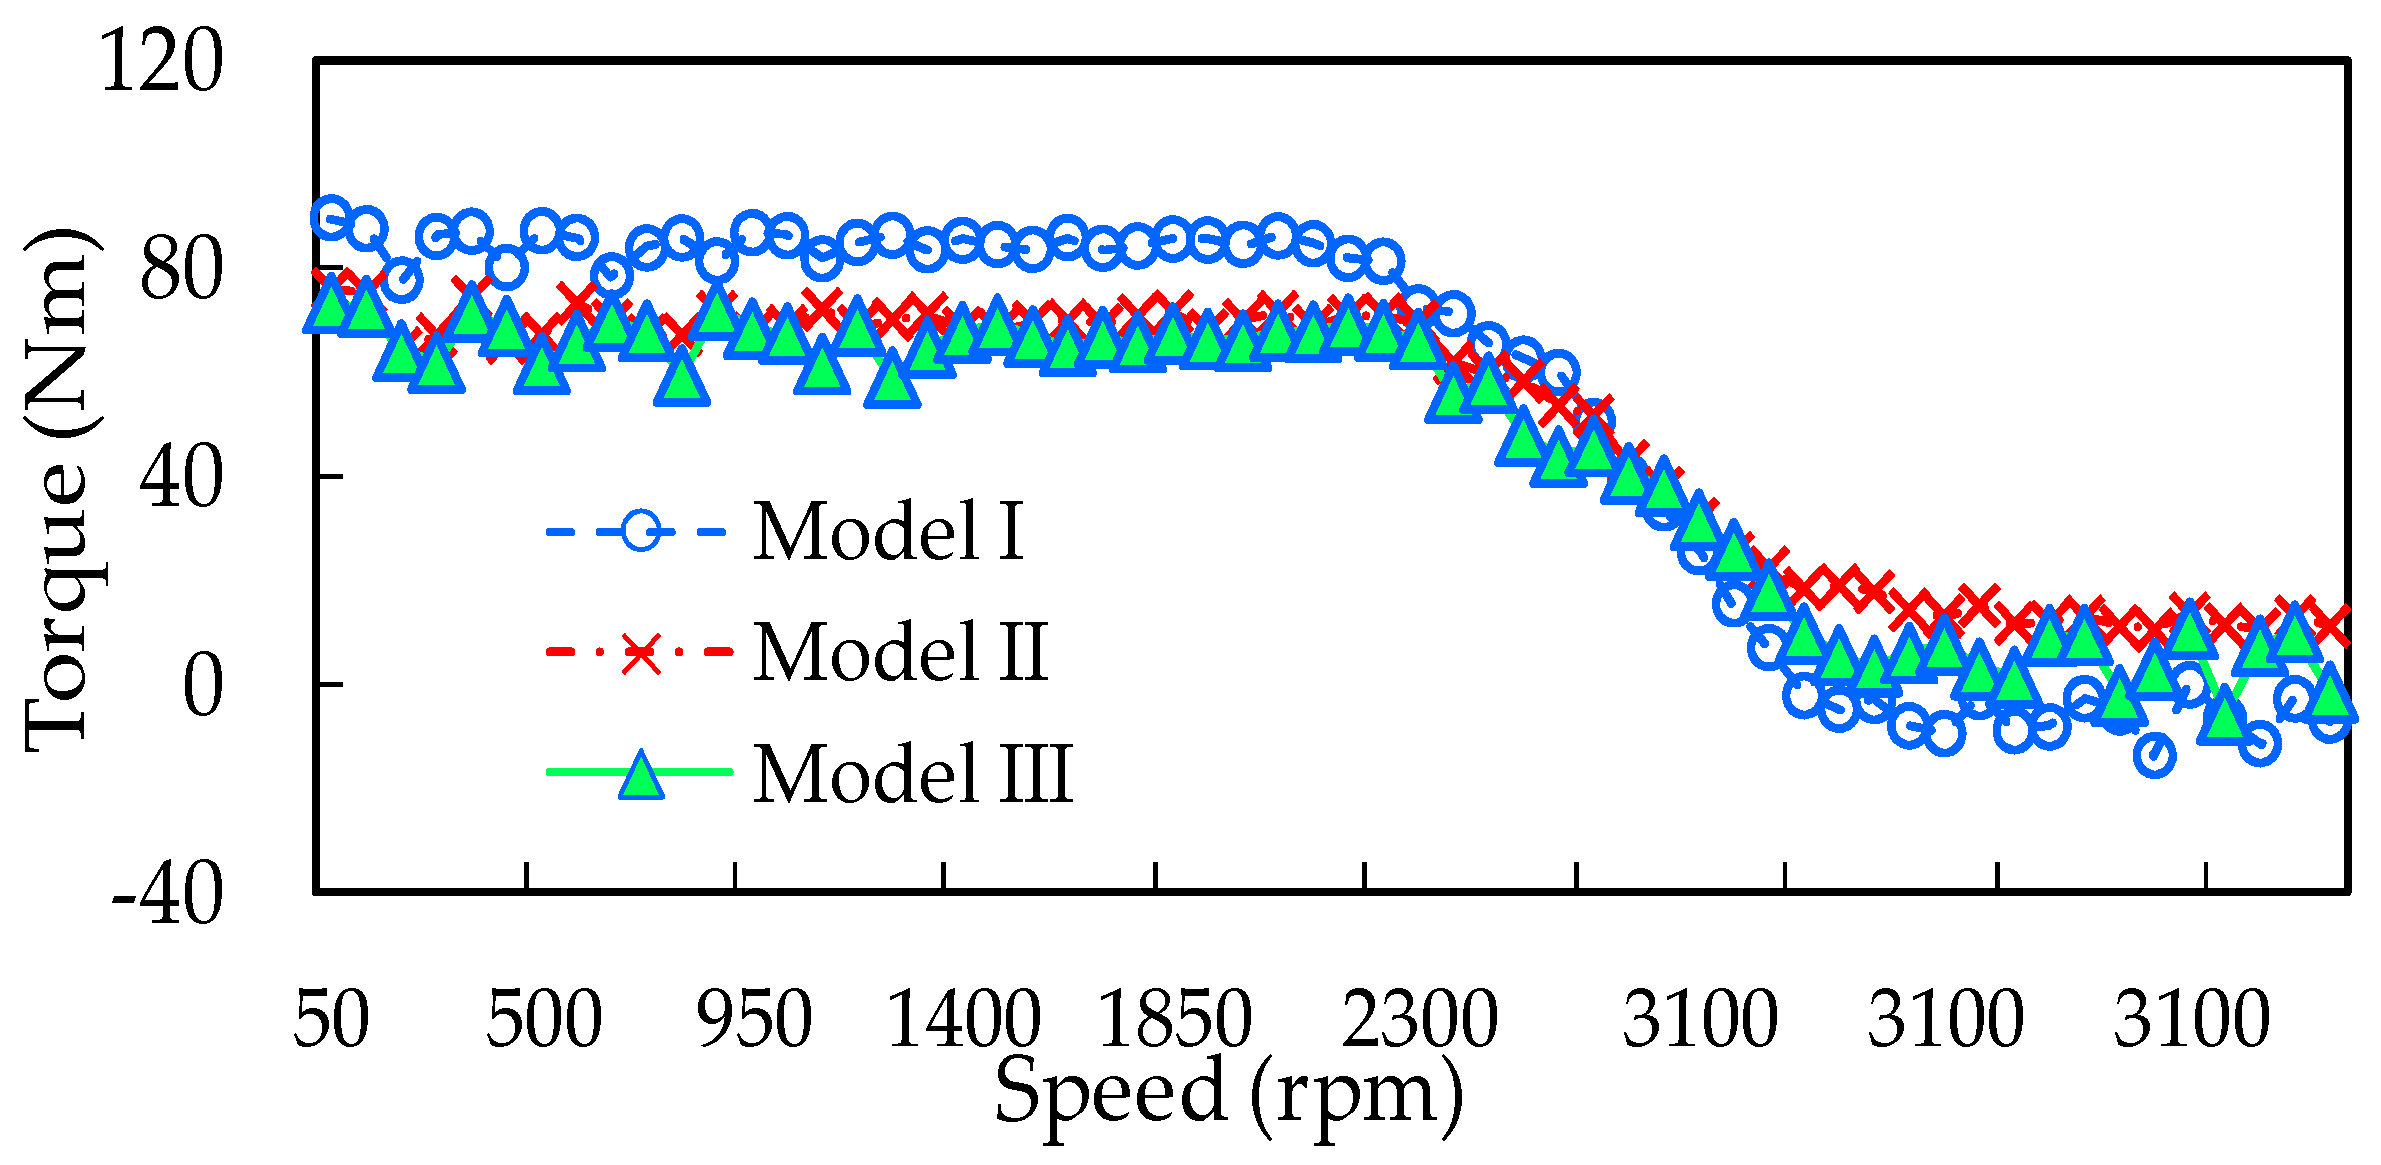
Figure 15.
Torque-speed characteristic in different models when the torque command Te* = 200 nm.

Figure 16.
Dynamic response to speed reference step variation with the proposed control strategy when torque command is 90 nm.
Figure 16.
Dynamic response to speed reference step variation with the proposed control strategy when torque command is 90 nm.
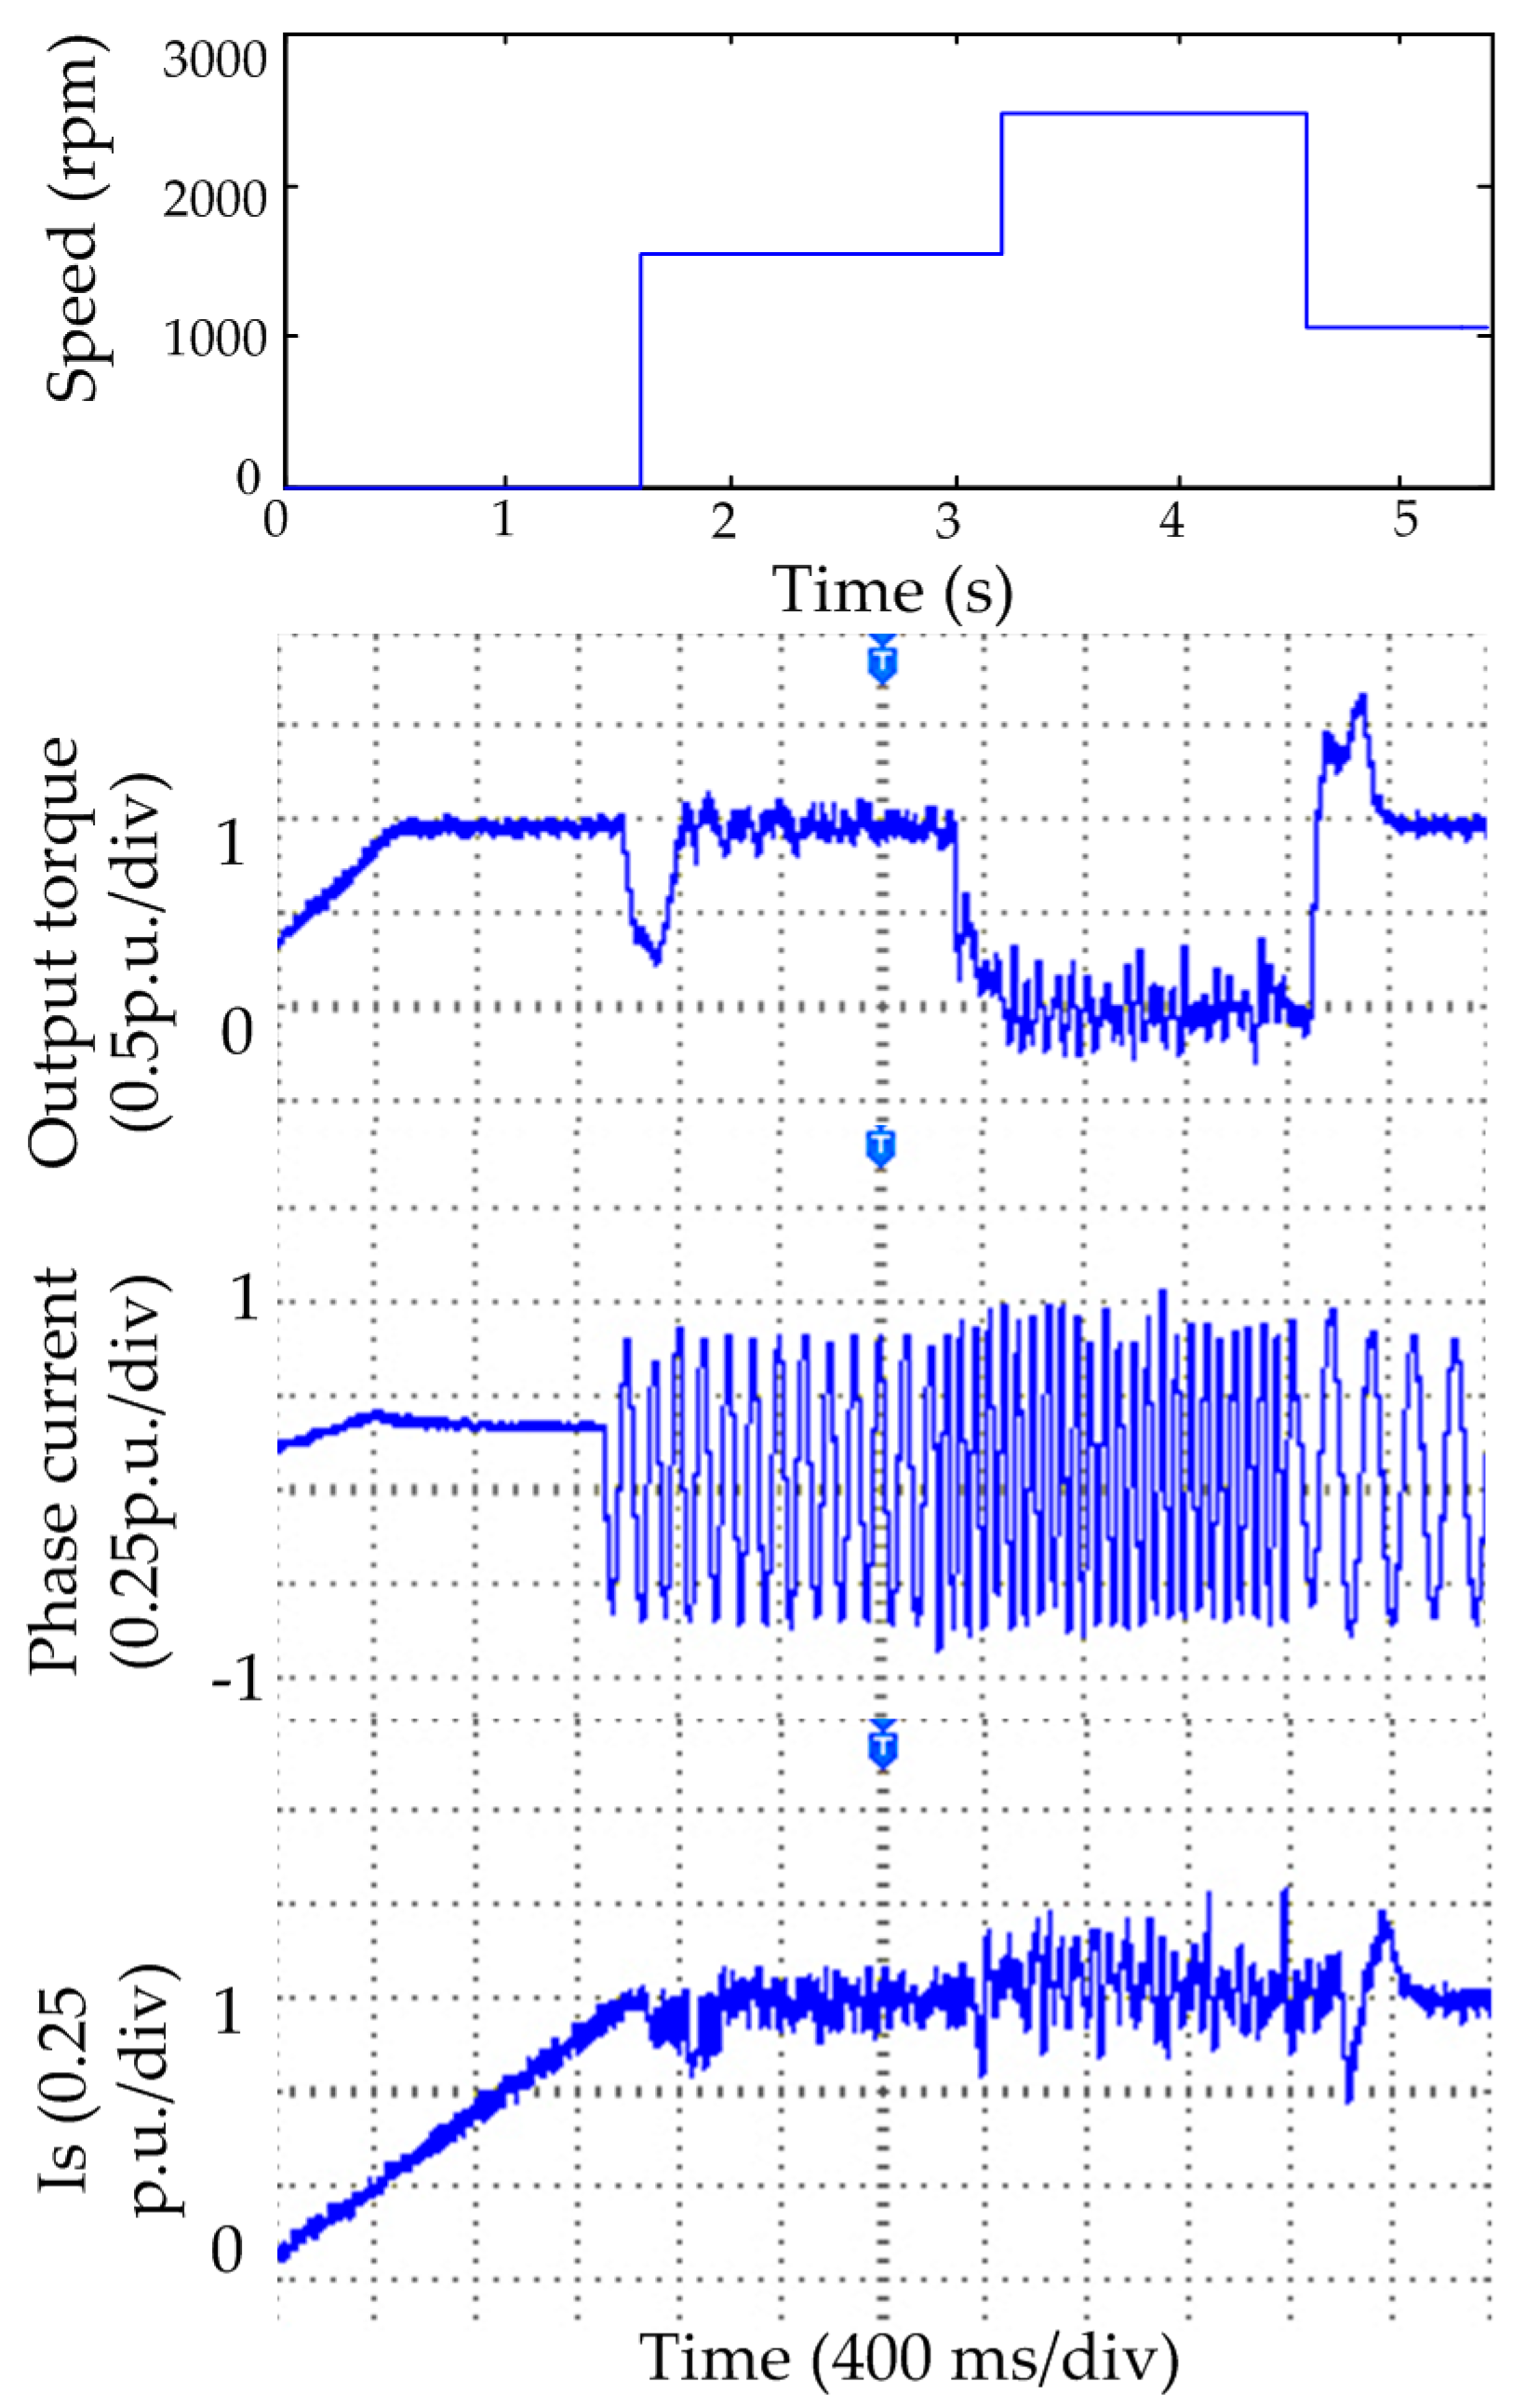
Figure 17.
Dynamic response to speed reference step variation with the proposed control strategy when torque command is 200 nm.
Figure 17.
Dynamic response to speed reference step variation with the proposed control strategy when torque command is 200 nm.

Table 1.
Interior IPMSM Specification.
| Parameter | Value |
|---|---|
| Rated Power | 10 kW |
| Rated Torque | 70 nm |
| Rated Speed | 1500 rpm |
| Number of pole pairs | 3 |
| d-axis inductance Ld | 5.6419 mH |
| Mutual inductance Ldq = Lqd | 1.98 mH |
| Stator resistance Rs | 0.03165 Ω |
| magnetic flux ψf | 0.6304 V·s |
© 2017 by the authors. Licensee MDPI, Basel, Switzerland. This article is an open access article distributed under the terms and conditions of the Creative Commons Attribution (CC BY) license (http://creativecommons.org/licenses/by/4.0/).
Share and Cite
MDPI and ACS Style
Li, H.; Gao, J.; Huang, S.; Fan, P. A Novel Optimal Current Trajectory Control Strategy of IPMSM Considering the Cross Saturation Effects. Energies 2017, 10, 1460. https://doi.org/10.3390/en10101460
AMA Style
Li H, Gao J, Huang S, Fan P. A Novel Optimal Current Trajectory Control Strategy of IPMSM Considering the Cross Saturation Effects. Energies. 2017; 10(10):1460. https://doi.org/10.3390/en10101460
Chicago/Turabian StyleLi, Huimin, Jian Gao, Shoudao Huang, and Peng Fan. 2017. "A Novel Optimal Current Trajectory Control Strategy of IPMSM Considering the Cross Saturation Effects" Energies 10, no. 10: 1460. https://doi.org/10.3390/en10101460
Note that from the first issue of 2016, this journal uses article numbers instead of page numbers. See further details here.