The Energy Footprint of China’s Textile Industry: Perspectives from Decoupling and Decomposition Analysis


1
Fashion Institute, Zhejiang Sci-Tech University, Hangzhou 310018, China
2
Ecological Civilization Research Center of Zhejiang Province, Zhejiang Sci-Tech University, Hangzhou 310018, China
*
Author to whom correspondence should be addressed.
Energies 2017, 10(10), 1461; https://doi.org/10.3390/en10101461
Submission received: 22 August 2017
/
Revised: 15 September 2017
/
Accepted: 18 September 2017
/
Published: 22 September 2017
(This article belongs to the Special Issue Industrial Energy Efficiency 2018)
Abstract
:Energy is the essential input for operations along the industrial manufacturing chain of textiles. China’s textile industry is facing great pressure on energy consumption reduction. This paper presents an analysis of the energy footprint (EFP) of China’s textile industry from 1991 to 2015. The relationship between EFP and economic growth in the textile industry was investigated with a decoupling index approach. The logarithmic mean Divisia index approach was applied for decomposition analysis on how changes in key factors influenced the EFP of China’s textile industry. Results showed that the EFP of China’s textile industry increased from 41.1 Mt in 1991 to 99.6 Mt in 2015. EFP increased fastest in the period of 1996–2007, with an average annual increasing rate of 7.7 percent, especially from 2001 to 2007 (8.5 percent). Manufacture of textile sector consumed most (from 58 percent to 76 percent) of the energy among the three sub-sectors, as it has lots of energy-intensive procedures. EFP and economic growth were in a relative decoupling state for most years of the researched period. Their relationship showed a clear tendency toward decoupling. Industrial scale was the most important factor that led to the increase of EFP, while decreasing energy intensity contributed significantly to reducing the EFP. The promoting effect of the factors was larger than the inhibiting effect on EFP in most years from 1991 to 2015.
1. Introduction
Energy-related greenhouse gas (GHG) emissions have raised a great deal of concern in recent decades, as GHGs have an adverse environmental impact [1]. The world’s consumption of energy increased from 4661 Mt in 1973 to 9425 Mt in 2014 according to statistics of the International Energy Agency [2]. The statistics also showed that the industry sector occupied approximately 30.5% of the world’s total energy (i.e., coal, oil, natural gas, electricity) consumption in 2014. The concentration of energy saving technologies and energy efficiency assessment methods in industry sectors has increased significantly in order to reduce GHGs emissions.
The textile industry is a significant contributor to many national economies, encompassing both small and large-scale operations worldwide [3]. The global fiber production has increased rapidly with the growing consumption of textiles and clothing. It is reported that global fiber production was approximately 97.8 million tons in 2016 [4]. Energy is the essential input for every operation along the industrial manufacturing chain of textiles. In general, the textile industry is not considered an energy-intensive industry compared with the metal smelting industry or the raw chemical materials and chemical products manufacturing industry. However, the textile industry comprises a large number of plants, which together consume a significant amount of energy.
China has been the world’s largest producer and exporter of textiles and clothing since 1994 according to WTO trade statistics [5]. The fiber production of China’s textile industry occupies more than 50 percent of the global fiber production [6]. The textile industry is a recognized traditional pillar industry in China. Specifically, China’s textile industry contributes to increasing employment and income, promoting urbanization and social development. However, it also consumed large quantities of energy in the past thirty years of rapid development. China’s textile industry is facing great pressure to reduce industrial energy consumption. During the 13th Five-Year-Plan period (i.e., from 2016 to 2020), the energy consumption per unit industrial value-added of China’s textile industry must decrease by more than 18 percent [6].
Globally, the textile industry has become one of the industries concerned with sustainable initiatives. Several studies have paid attention to energy consumption in the textile industry. Rasul [7] and Kruska et al. [8] elucidated the rational use of energy in textile industry. In addition, Rasul presented in detail a number of feasible options for energy conservation measures in the textile industry. Kruska et al. introduced innovative technologies of energy use in textile industry. Abdel-Dayem et al. [9] and Muneer et al. [10] investigated the potential of solar energy utilization in the textile industry. Palanichamy et al. [11] shared the experiences of economic and efficient measures of energy conservation in the textile industry situated in Tamilnadu State, India. They also studied energy use in the Indian textile industry and presented the energy-efficiency potential availability, as well as suggesting some energy policies suitable for the Indian context to achieve the estimated energy-savings potential [12]. Tang et al. [13] established models for the ratio of energy consumption to yarn production over a full yarn package based on an analysis of power distribution during yarn winding in ring spinning. Ozturk [14] estimated the energy consumption and energy cost for the Turkish textile sector with a survey and analyzed the relationship between the energy usage and textile production. Kocabas et al. [15] analyzed energy consumption within the context of the European Union’s Integrated Pollution Prevention and Control (IPPC) Directive on a large-scale textile mill in Turkey. Zabaniotou et al. [16] described the development of alternative energy in the textile industry by energy recovery from cotton ginning waste. Palamutcu [17] calculated the actual and estimated energy consumption using production ratios of electric energy in the various stages of the cotton textile process in Turkey. Hong et al. [18] examined the energy conservation situation in the Taiwanese textile industry and identified the areas for making energy savings to provide an energy efficiency baseline. Martínez [19] used energy intensity, specific energy consumption, and carbon emission intensity and measured energy efficiency performance in the German and Colombian textile industries. Hasanbeigi et al. [20] compared energy intensity for five major sub-sectors of the textile industry in Iran. Peng et al. [21] analyzed the overall textile industry energy efficiency gap between China and the US and measured the longitudinal changes in the energy efficiency of China’s overall textile industry and subsectors. Lin et al. [22] measured the rebound effect in China’s textile industry and revealed that energy efficiency improvement is conducive for energy savings to a certain degree, but is not the only way for China’s textile industry to realize energy savings and emission reduction. Huang et al. [23] analyzed the energy-related GHGs emissions in China’s textile industry and analyzed the emission characteristics.
Industrial energy consumption information is one of the key references for the establishment of national energy policies in order to achieve energy reduction targets. This paper aims to contribute to the understanding of energy consumption in China’s textile industry, the main factors that affect the energy utilization, and the degrees of influence of these factors. This paper also focuses on the relationship between energy consumption and industry development. It will fill the gaps in this research area and provide a scientific reference for policy interventions on energy management for the sustainable energy consumption of China’s textile industry.
2. Methodology and Data Sources
2.1. Energy Footprint
Measurement of energy is the most important issue for industrial products from the viewpoints of efficiency and cost. The energy footprint (EFP) is one way to measure that energy consumption [24]. There exit various definitions of EFP. The EFP can be measured in local or global hectares, and in units of energy/functional unit [25,26]. In this paper, we measured EFP in units of energy and followed the definition of the demand for non-renewable energy resources [25]. The EFP of China’s textiles industry can be calculated as follows:
where Ei is the consumption amount of energy i (Mt standard coal equivalent (SCE)).
Energy footprint intensity (EFPI) is an indicator that measures changes in energy efficiency. It can be calculated as follows:
where TIOV is the abbreviation of total industrial output value of China’s textile industry (Billion U.S. dollars (USD)).
2.2. Decoupling Indicator
A decoupling index is a proper technique to determine the link between environmental pressure and economic growth. The decoupling index of EFP from economic growth in the textile industry is defined as exploring the relationship between textiles production-related energy consumption and the textile industry economy [27]. In this paper, the decoupling indicator can be calculated according to Equation (3) [28].
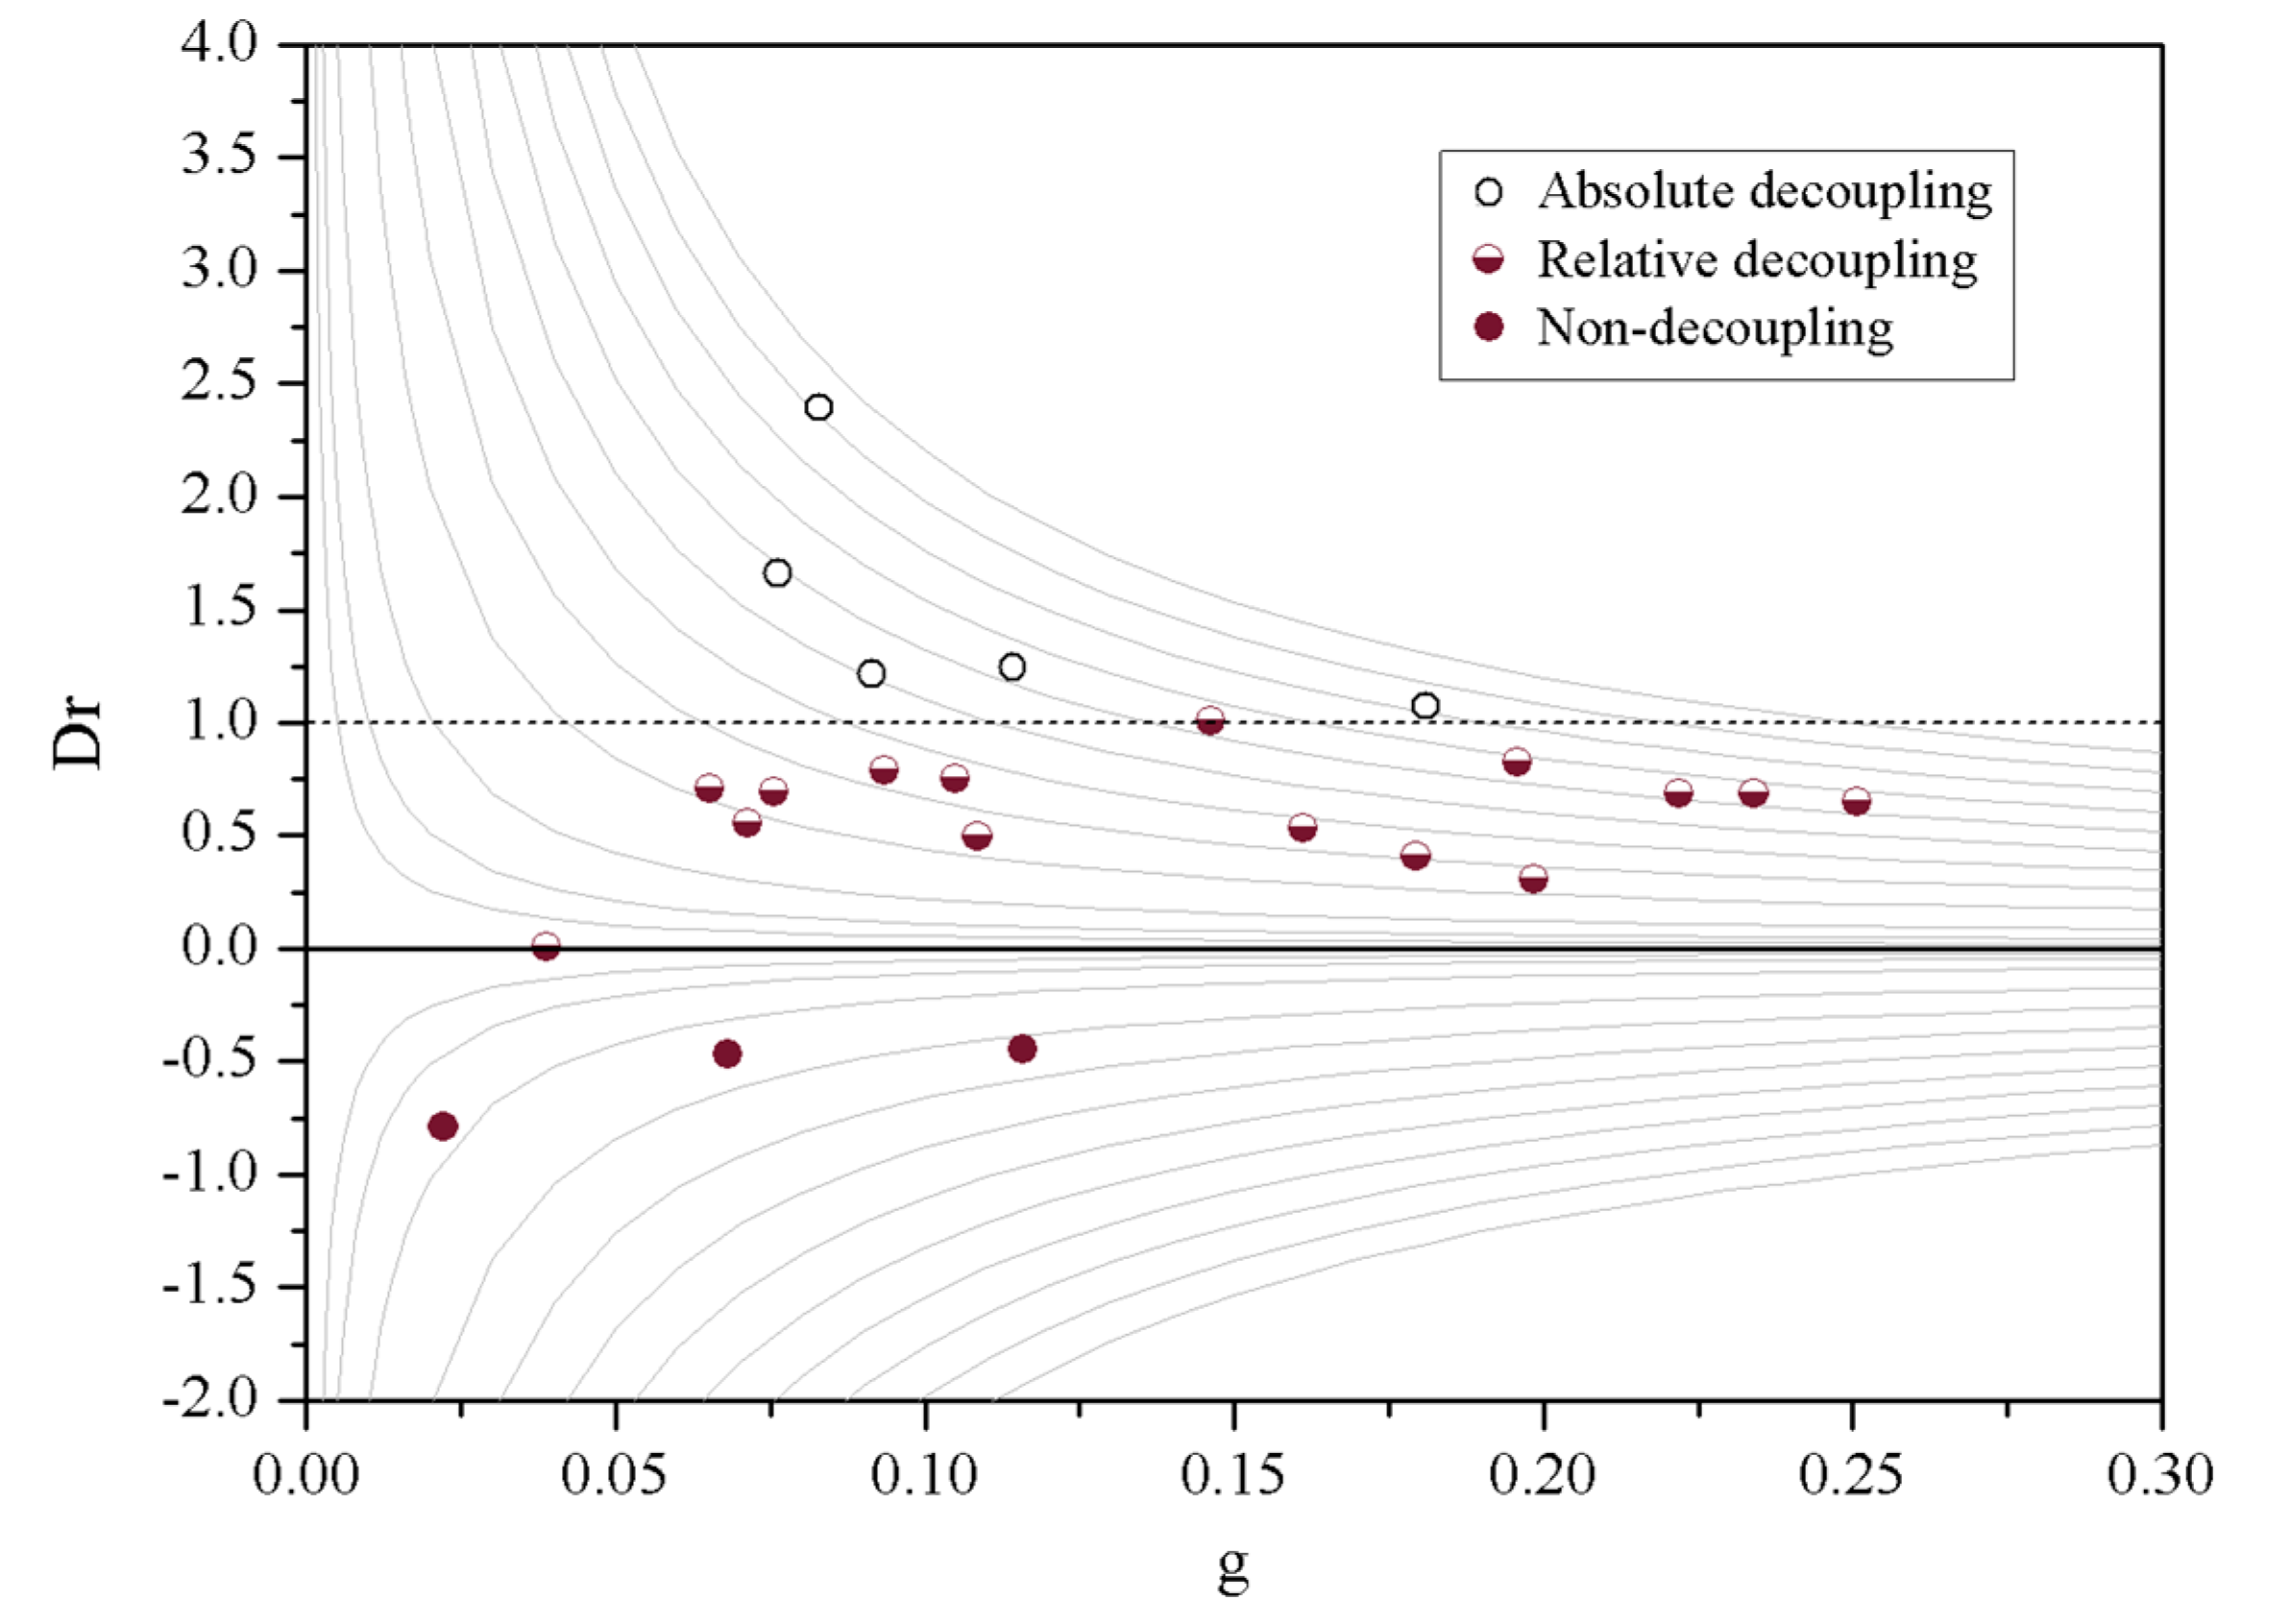
There are three grades (see Table 1 and Figure 1) of decoupling state according to the values of Dr, t, and g. Absolute decoupling means the textile industry economy (i.e., TIOV) growth is achieved with decreasing EFP. Relative decoupling means that EFP increases with TIOV growth but the increasing rate of EFP is smaller than that of TIOV. A typical non-decoupling means that TIOV growth is achieved with increasing EFP and EFP increases faster than TIOV.
2.3. Decomposition Model
Index decomposition analysis is an effective approach to identify key factors (e.g., industry scale, energy efficiency, energy structure, etc.) responsible for environmental stresses change and the impact mechanism. The logarithmic mean Divisia index (LMDI) approach is a widely used decomposition method due to its desirable properties in the context of decomposition analysis, such as theoretical foundation, adaptability, as well as ease of result interpretation [29,30]. In this paper, we use LMDI method to provide a clear view on the degree of influence of the driving factors. Equation (1) can be further expressed as follows:
where TIOVj is the total industrial output value of sub-sector j of China’s textile industry (Billion USD). Ej is the total consumption of energy in the sub-sector j (Mt SCE). Eij is the amount of energy consumption i in the sub-sector j (Mt SCE). VT represents the industry scale factor. Sj represents the industry structure factor. Ij represents the energy efficiency factor. ESij represents the energy structure factor.
The change of EFP during a period t is equivalent to the sum of effects linked to change in each factor. It can be expressed as follows:
where ΔEFP is the change of EFP from the base year (i.e., year zero) to year t. EFPt is the energy footprint of year t. EFP0 is the energy footprint of the base year. VT-eff, Sj-eff, Ij-eff, and ESij-eff represents the effect of each factor, respectively. They can be calculated from the following expressions:
2.4. Data Sources
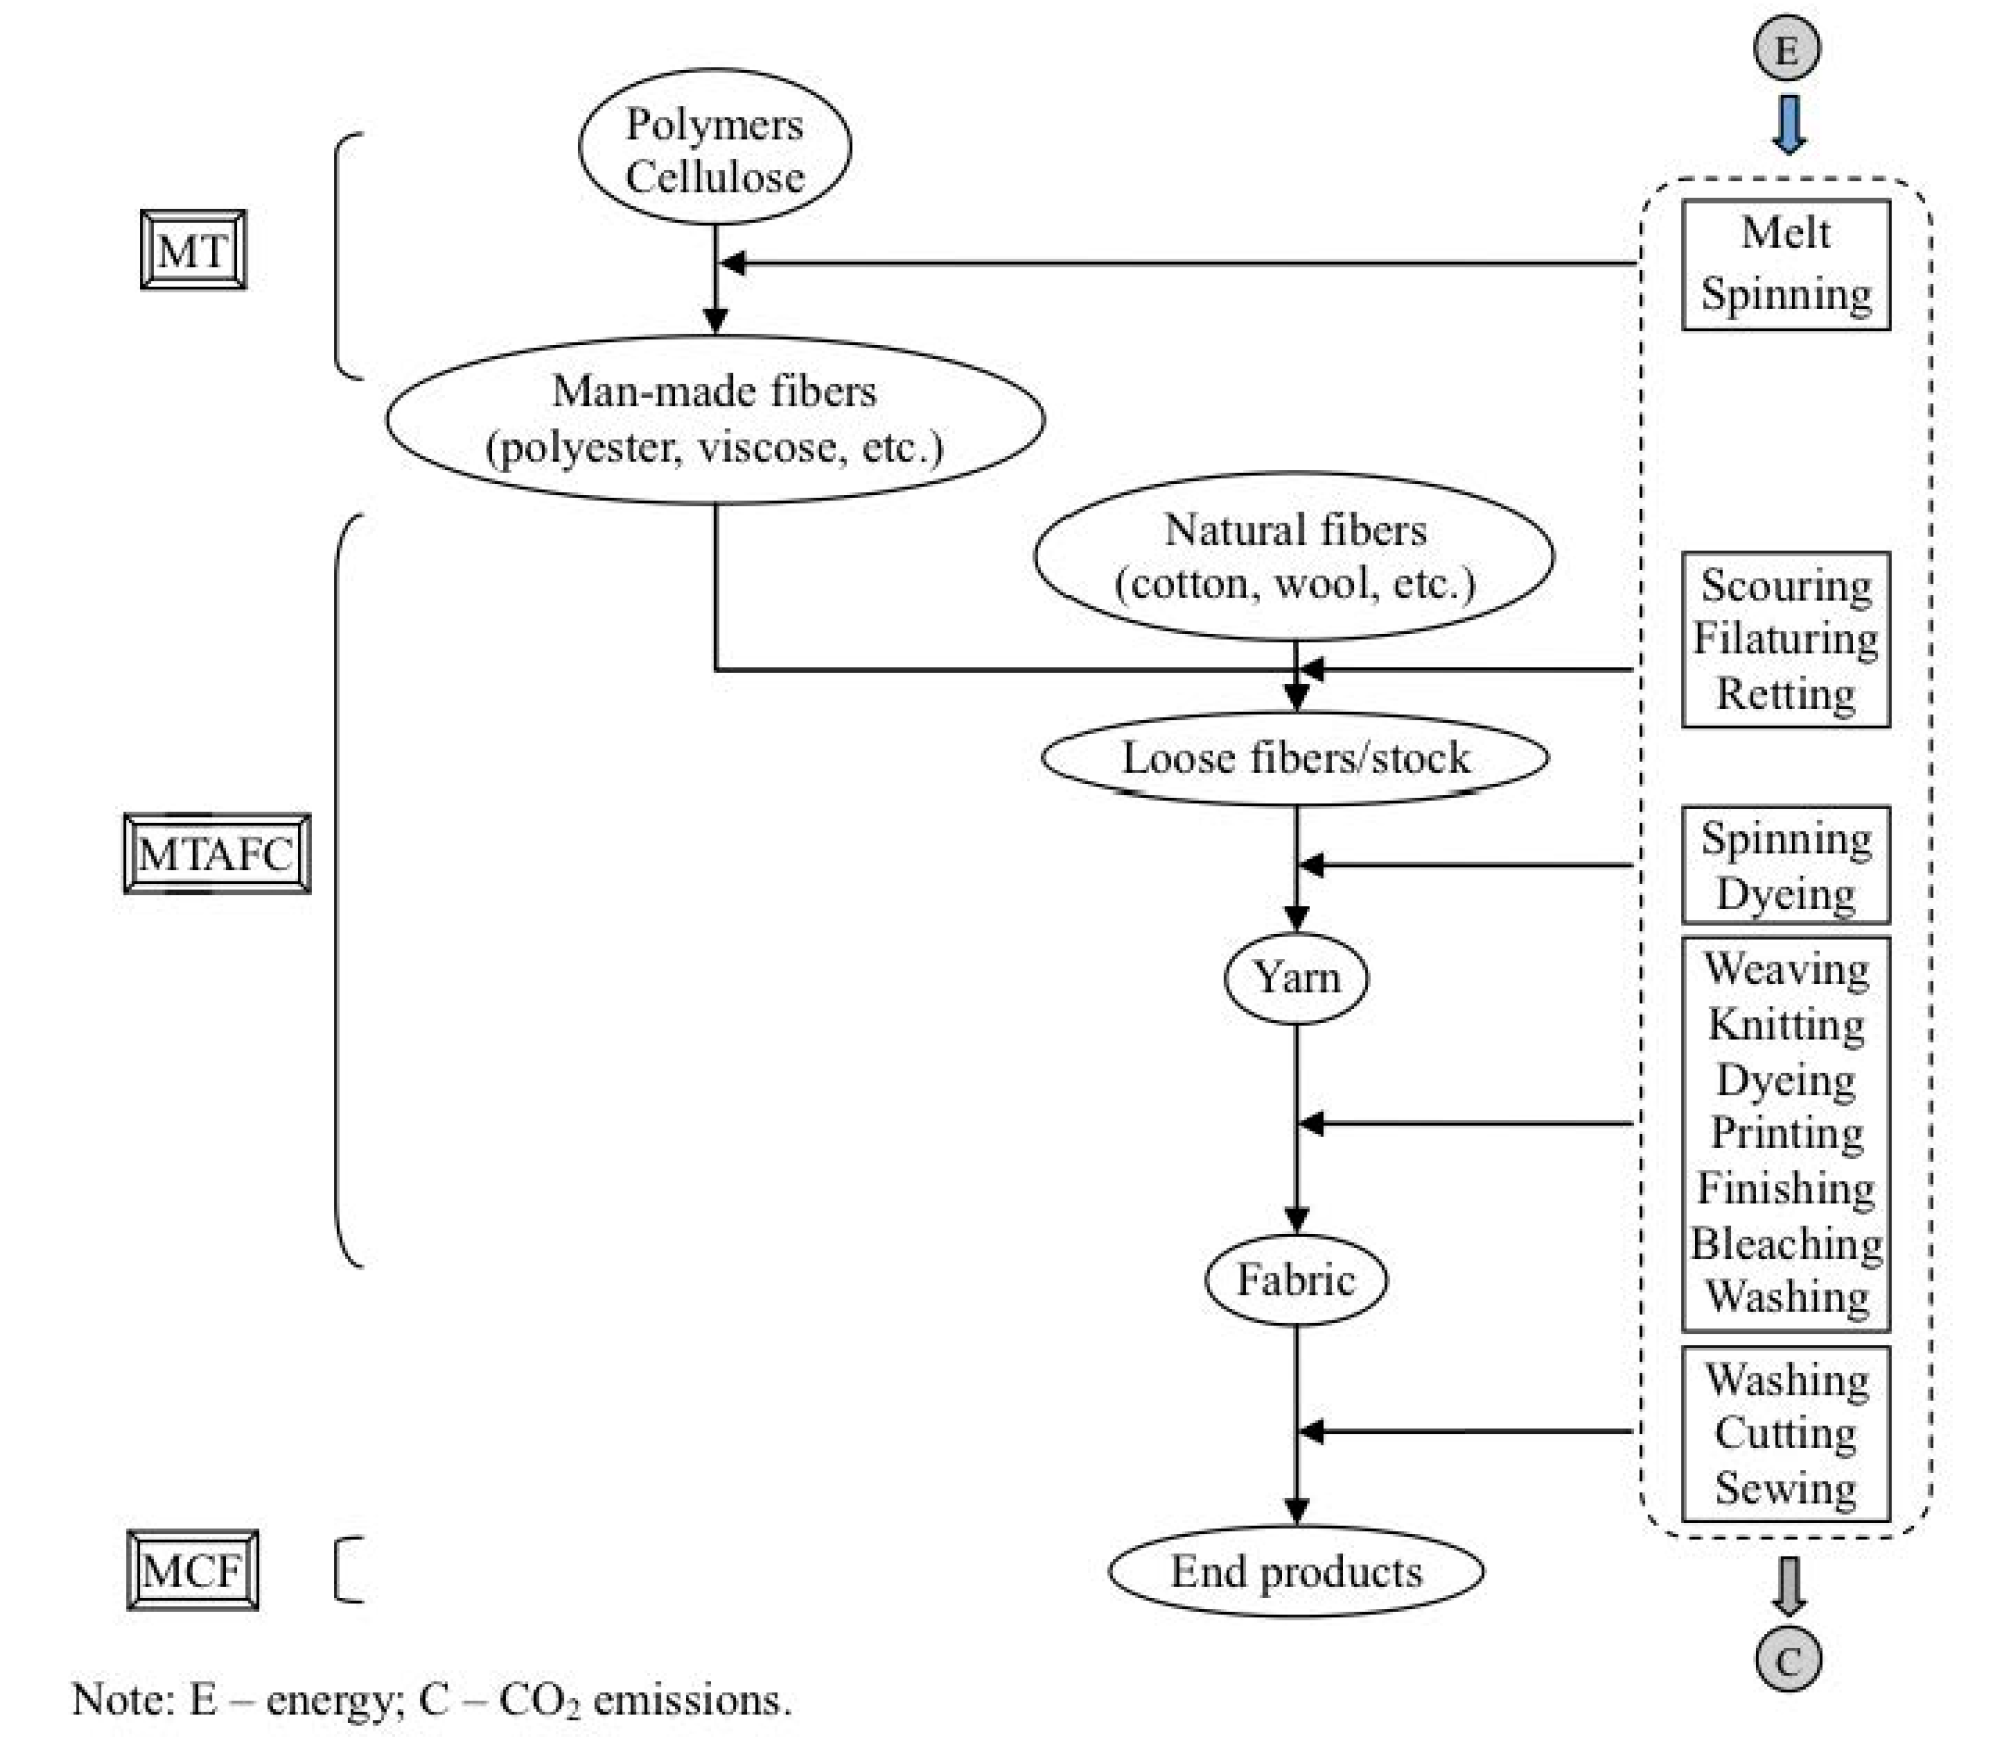
This analysis covers the years 1991–2015. China’s textile industry has three sub-sectors (see Figure 2): Manufacture of Textile (MT); Manufacture of Textile Wearing Apparel, Footwear and Caps (MTAFC); and Manufacture of Chemical Fibers (MCF). The China Energy Statistical Yearbook (1992–2016) releases sectors’ yearly industrial energy consumption data collected from terminal factories. We used these aggregate data directly for EFP calculation. The statistical data of TIOV were collected from the China Statistical Yearbook (1992–2016).
3. Empirical Analysis
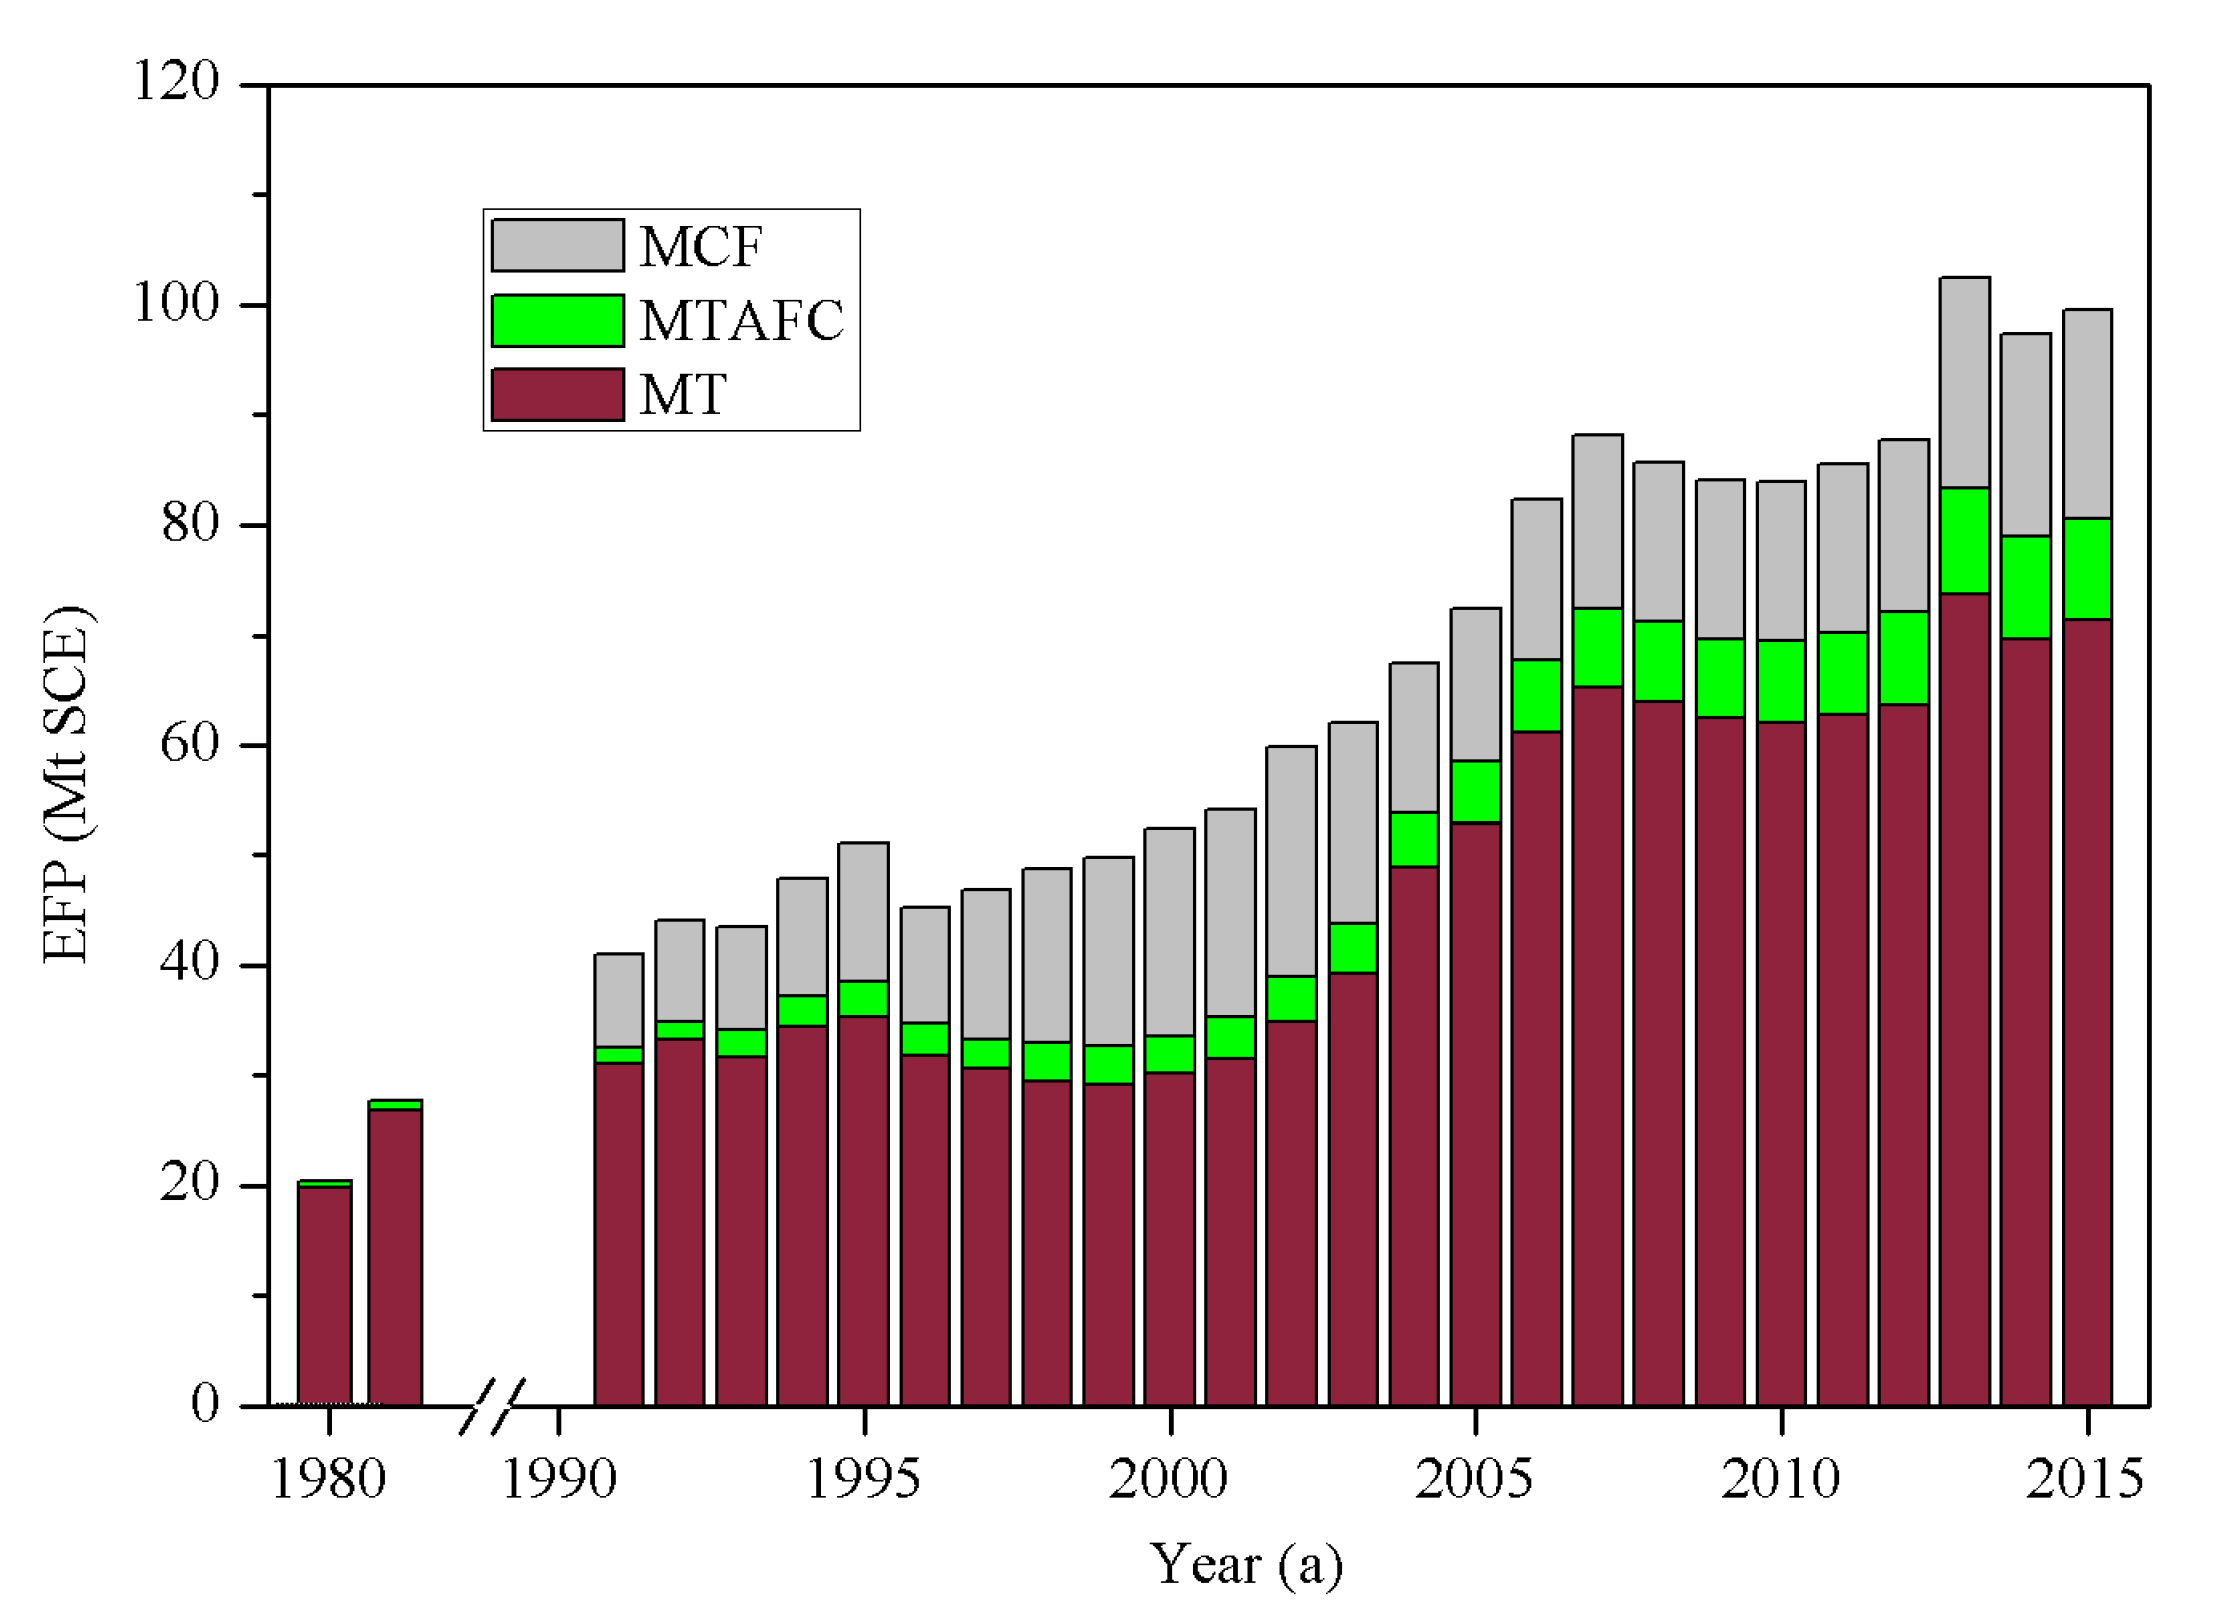
Figure 3 displays the EFP of China’s textile industry calculated according to Equation (1) with the collected data. It can be seen that the EFP of China’s textile industry increased dramatically from 1980 to 2015. The average annual increasing rate is 4.6 percent. There are three increasing periods, 1980–1995, 1996–2007, and 2008–2015, as shown in Figure 3. The peak values of the three periods appeared in 1995 (5107 Mt SCE), 2007 (8815 Mt SCE), and 2013 (10246 Mt SCE). The average annual increasing rates were 6.3 percent, 7.7 percent, and 2.2 percent, respectively. The MT sector consumes most of the energy among the three sub-sectors, followed by MCF sector and MTAFC sector.
From Figure 4 we can see that EFPIs of China’s textile industry and the three sub-sectors decreased, especially from 1995 to 2015. The EFPI of MTAFC was smaller than that of MT and MCF. EFPI of MCF was the largest before 2004 and there was a sharp decrease from 2002 to 2004. The average EFPI of China’s textile industry showed a similar trend to that of MT.
The economy of China’s textile industry increased largely from 1991 to 2015. From Figure 5 we can see that most years are in a relative decoupling state. Five years (2008, 2009, 2010, 2014, 2015) achieved absolute decoupling and three years (1994, 1997, 1998) were in the non-decoupling state. China’s textile industry has witnessed a clear tendency toward decoupling, moving from non-decoupling to absolute decoupling.
Figure 6 shows the decomposition results of contribution values for the change of the EFP of China’s textile industry. As can be seen from Figure 6, Ij and Sj are inhibiting factors in the growth of EFP while VT and ESij are the promoting factors. Ij contributed significantly to reducing the EFP. The smaller it is, the more effectively it inhibits. The inhibiting effect on EFP increasing from Sj is not very significant compared with Ij. VT is the most important factor that led to the increase of EFP. ESij had the least effect among the four effect factors. The promoting effect was larger than the inhibiting effect on EFP in most years during the study period. Therefore, the changes of EFP were positive in value and EFP increased.
4. Discussion
After nearly forty years of rapid development in industry scale and technologies since China’s reform and open, the textile industry has been equipped with completed industrial production chains. As one of the most complicated manufacturing industries, the textile industry is characterized by specialized production and is comprised of fragmented and heterogeneous sectors that are dominated by small- and medium-sized enterprises. Spinning, weaving, dyeing, and finishing are typical operations that are intensive in terms of energy consumption. These procedures belong to the MT sector, as shown in Figure 2. Therefore, the EFP of MT was much larger than that of the other two sub-sectors.
Spinning. The term “spinning” can refer to the operations (e.g., melt-spinning, dry-spinning, and wet-spinning) of making synthetic fibers or the whole process (including opening, carding, combing/drawing, roving, spinning, and winding) of making yarn from different types of natural fibers. Generally, spinning is named as the activity of yarn manufacturing, and is classified as conventional (e.g., ring spinning) and unconventional (e.g., rotor, wrap, air-jet, and self-twist spinning). In spinning, the electricity is consumed in melting polymers, driving machines, air conditioning, and lighting, but the highest electricity consumption occurs in driving machines [31].
Weaving. At this stage, many kinds of yarns are used to produce woven fabrics by processes such as winding, warping, sizing, drawing in (weaving preparation), and weaving. In order to increase the woven fabric production, high-productivity shuttleless looms such as water jet looms and air jet looms have successfully been put into practice. Energy consumed in weaving mainly includes two types of energy: electrical and heat. Machines, air conditioning, lamps used for illumination, fans, and compressors consume electrical energy, while heat is consumed by processes such as sizing and sometimes by air conditioning [32]. Generally, heat energy is obtained from burning fossil fuels such as coal, diesel oil, fuel oil, and natural gas.
Dyeing and Finishing. Fibers, yarns, and fabrics can be dyed with a wide range of machines and technologies. Dyeing and finishing processes consist of many interwoven unit operations, and the processes generally go through repeated wet and dry operations. High temperature is always an essential condition in dyeing and finishing. Heat is the largely consumed energy in dyeing and finishing, and it is applied via steam or heat conduction oil coil in heating dye liquor, heat setting, drying, etc. Coal and natural gas are two conventional fuels used to heat water and conduction oil, and electrical energy is used in powering the dyeing and finishing machinery.
The energy efficiency of China’s textile industry during the earlier developing period (1980–1995) was low. The industry scale increased rapidly, and large quantities of textile products were manufactured for exports with energy-intensive machines. Thus, both the TIOV of China’s textile industry and energy consumption increased rapidly. EFP and China’s textile industry economy did not reach decoupling (i.e., non-decoupling). Besides, EFPI had a volatile trend, interchanging intervals of increase and decrease along this period.
China’s textile industry experienced a recession from 1996 to 2000, which consequently restrained the energy consumption. There was a sharp decrease for EFP in 1996. In 2001, China joined the World Trade Organization and became its 143th member. This highly affected the exports of textiles and apparel. The average annual increasing rate of EFP was 8.5 percent from 2001 to 2007—the largest in the research period. Global financial crisis occurred in 2008 and led to a slight recession in China’s textile industry from 2008 to 2010. The average annual decreasing rate of EFP was 1.2 percent from 2007 to 2010. With the recovery of global demand and the promotion of the domestic consumption of clothing, the industrial production of textiles and clothing increased and resulted in EFP increasing from 2011.
Chinese government has made great efforts in improving the energy efficiency of China’s textile industry to reduce energy consumption. The goals of energy intensity decreases are specified in the “Five-Year Plan” of China’s textile industry. For example, 15 percent per GDP decrease in the 10th Five-Year Plan (2001–2005), 20 percent per GDP decrease in the 12th Five-Year Plan (2011–2015), and 18 percent per GDP decrease in the 13th Five-Year Plan (2016–2020). Many policies and standards were also issued to restrict energy consumption in the manufacturing of fibers, textiles, and end-products (e.g., apparel, home textiles). For example, “Entry criteria on printing and dyeing industry (2010)”, “HJ/T 185-2006 Cleaner production standard-Textile industry (Dyeing and finishing of cotton)” and “HJ/T 429-2008 Cleaner production standard-Chemical fiber industry (Polyester fiber)”. Eliminating energy intensity production equipment and popularizing energy saving technologies in textile companies, such as energy recovery from waste hot water and steam, rapid enzymatic single-bath treatment (REST), and cold pad-batch process are meaningful to reduce the energy intensity.
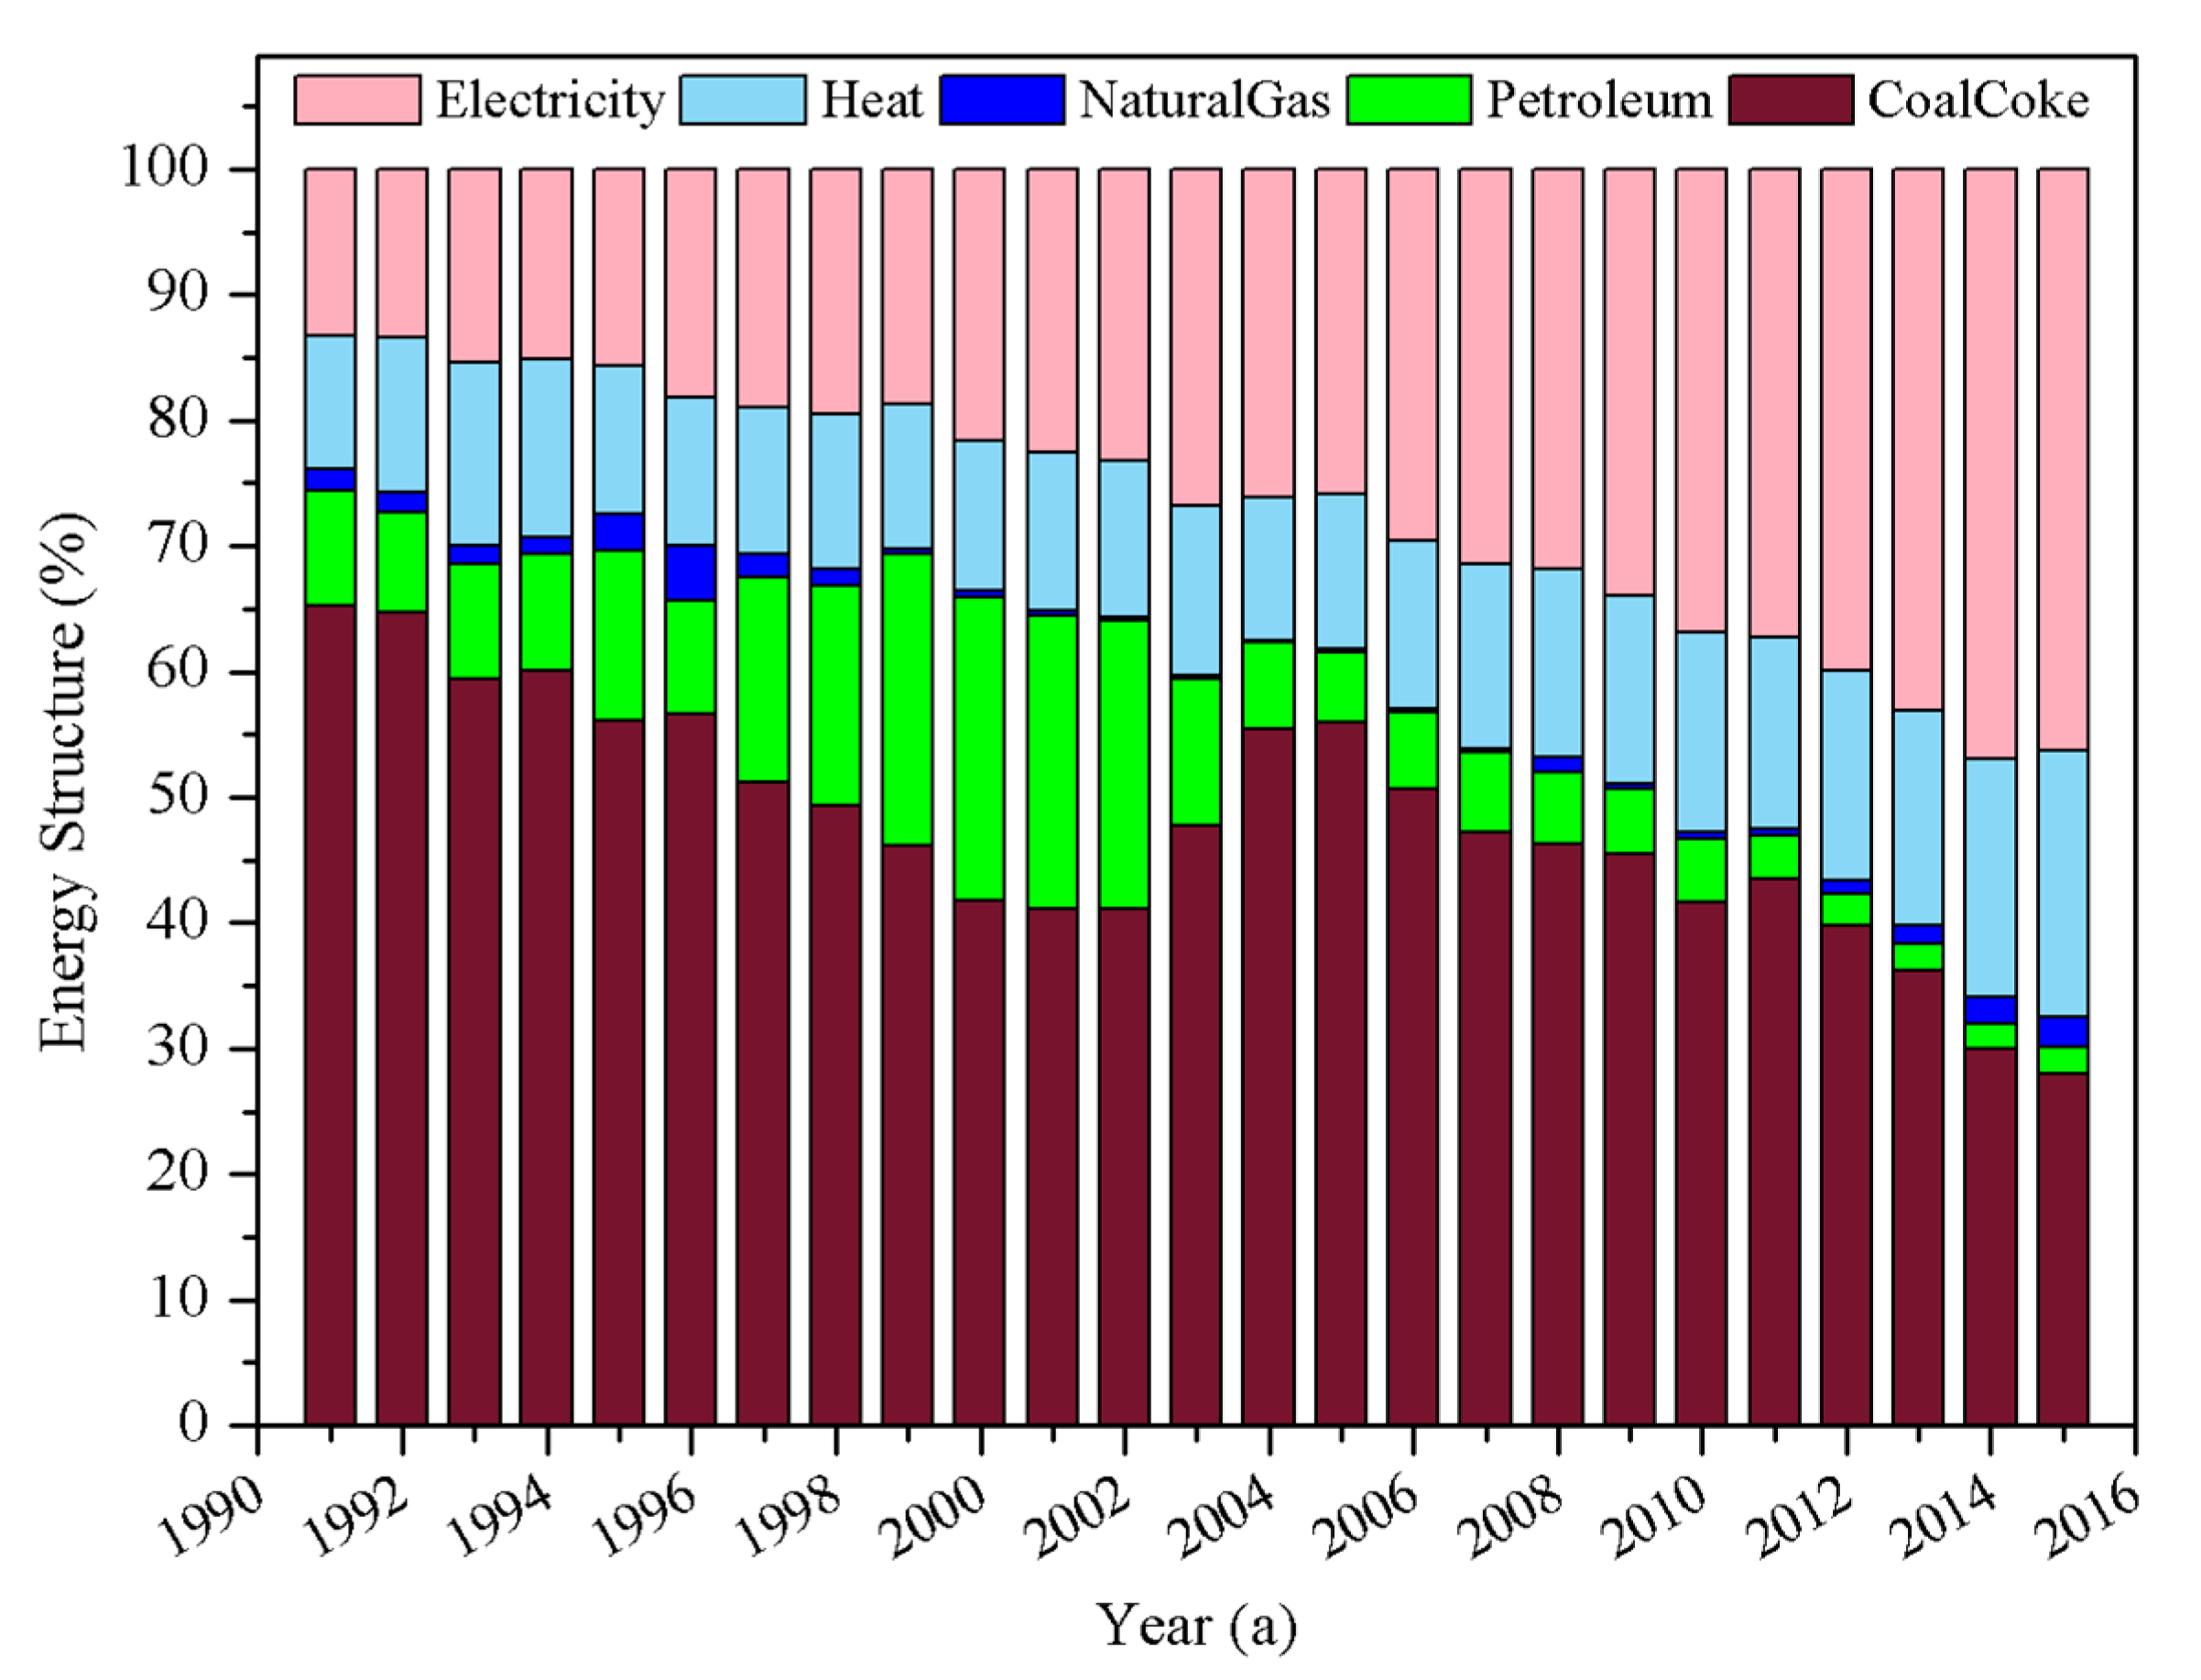
Figure 7 shows the energy structure of China’s textile industry. Coal and coke, electricity, heat, and petroleum products (e.g., kerosene, diesel oil, fuel oil) are the main contributors to energy consumption in China’s textile industry. With the popularization of automated machines to offer better productivity and quality, the consumption of electricity increased largely from 1991 to 2015. However, thermal power that consumes coal and coal products is still the dominant source of electricity consumed in China’s industry. For example, thermal power accounted for approximately 75 percent of China’s total electric production in 2014 [33]. Though the direct consumption of coal and coal products decreased, China’s textile industry still consumed large quantities of coal and coal products, as the indirect consumption increased rapidly. This also caused huge CO2 emissions in China’s textile industry [34].
5. Conclusions
Energy consumption is a key factor that affects the sustainable development of China’s textile industry. A detailed analysis of energy consumption in China’s textile industry can provide essential information for the establishment of energy policies. This paper measured the EFP of China’s textile industry from 1991 to 2015 and investigated the relationship between EFP and economic growth in the textile industry. Key factors that influence the EFP of China’s textile industry were also quantitatively analyzed. The results showed that the EFP of China’s textile industry increased more than one time from 1991 to 2015. The average annual increasing rate in the period of 1996–2007 was the largest. Industrial scale expansion is the main factor promoting the large increase of energy consumption in China’s textile industry. The MT sector consumes most of the energy among the three sub-sectors, as many energy intensive procedures concentrate in this sector.
Decoupling analysis indicated that EFP and economic growth in China’s textile industry were in a relative decoupling state for most years in the research period. The promoting effect of the factors was larger than the inhibiting effect on EFP, increasing in most years from 1991 to 2015. Increasing demands for textiles and clothing promote the industrial production of fibers, yarns, fabrics, and end products that consume larger quantities of energy. Energy consumption restriction policies and the popularization of energy saving technologies promote the decoupling of energy consumption from economic growth, diminishing the gap between promoting factors and inhibiting factors.
With the increasing demand on domestic and foreign markets, China’s textile industry is expected to continue its rapid growth in the near future. Industrial scale will still promote the increase of EFP. Energy efficiency improvement is the core to reduce energy consumption. Technology upgrading is a necessary process to reduce the energy consumption. It will also improve the industrial productivity. Industrial structure optimization is another important mission for the government to reduce the EFP of China’s textile industry. At present, the industry structure factor contributed little to the inhibition of EFP’s increasing trend. Policies and standards should be strengthened to reduce the proportion of the energy intensive sector and promote high value-added textile products manufacturing with less energy intensity.
Acknowledgments
The authors are grateful to the Zhejiang Provincial Natural Science Foundation for providing funding supports to this research through project LY17G030035 and LQ16G030012, to the National Natural Science Foundation of China for providing funding supports to this research through project 71503233, to Zhejiang Sci-Tech University for providing funding supports to this research through project ‘Zhejiang Sci-Tech University Scientific Research Foundation (15072022-Y)’.
Author Contributions
Laili Wang and Yi Li conceived and designed the experiments; Laili Wang and Wanwen He collected the data; Laili Wang and Yi Li calculated and analyzed the results; and Laili Wang wrote the paper. All authors assisted with editing and revision of the paper.
Conflicts of Interest
The authors declare no conflict of interest.
References
- Saidur, R.; Rahim, N.A.; Ping, H.W.; Jahirul, M.I.; Mekhilef, S.; Masjuki, H.H. Energy and emission analysis for industrial motors in Malaysia. Energy Policy 2009, 37, 3650–3658. [Google Scholar] [CrossRef]
- International Energy Agency (IEA). Key World Energy Statistics. 2016. Available online: http://www.iea.org/publications/freepublications/publication/KeyWorld2016.pdf (accessed on 19 August 2017).
- United Nations Environment Programme (UNEP). The Textile Industry and the Environment; Technical Report Series No.16; UNEP/IE: Paris, France, 1993; pp. 1–10. [Google Scholar]
- Lenzing Group. Annual Report 2016. Available online: http://www.lenzing.com/fileadmin/template/pdf/konzern/geschaftsberichte_gb_ugb_jfb/GB_EN/GB_2016_EN.pdf (accessed on 19 August 2017).
- World Trade Organization (WTO). International Trade Statistics 2011. Available online: http://www.wto.org/english/res_e/statis_e/its2011_e/its11_toc_e.htm (accessed on 19 August 2017).
- Ministry of Industry and Information Technology of the People’s Republic of China (MIIT). Textile Industry Development Plan (2010–2020). Available online: http://www.miit.gov.cn/n1146290/n4388791/c5267286/content.html (accessed on 19 August 2017).
- Rasul, M.G. A Review on Rational Use of Energy and its Conservation Measures in Process Industry: A Case of Textile Industry. In Proceedings of the International Mechanical Engineering Congress and Exhibition, Perth, Australia, 15–19 May 1994; pp. 109–115. [Google Scholar]
- Kruska, M.; Meyer, J.; Elsasser, N.; Trautmann, A.; Weber, P.; Mac, T. Rationale use of energy in textile industry. In NRW-Initiative on Renewable Energy; Energy Agency: Scotland, UK, 2001. [Google Scholar]
- Abdel-Dayem, A.M.; Mohamad, M.A. Potential of solar energy utilization in the textile industry—A case study. Renew. Energy 2001, 23, 685–694. [Google Scholar] [CrossRef]
- Muneer, T.; Maubleu, S.; Asif, M. Prospects of solar water heating for textile industry in Pakistan. Renew. Sustain. Energy Rev. 2006, 10, 1–23. [Google Scholar] [CrossRef]
- Palanichamy, C.; Nadarajan, C.; Naveen, R.; Babu, N.S.; Dhanalakshmi. Budget constrained energy conservation—An experience with a textile industry. IEEE Trans. Energy Convers. 2001, 16, 340–345. [Google Scholar] [CrossRef]
- Palanichamy, C.; Sundar Babu, N. Second stage energy conservation experience with a textile industry. Energy Policy 2005, 33, 603–609. [Google Scholar] [CrossRef]
- Tang, Z.X.; Wang, X.G.; Fraser, B. Minimizing energy consumption of yarn winding in ring spinning. Text. Res. J. 2004, 74, 1097–1103. [Google Scholar] [CrossRef]
- Ozturk, H.K. Energy usage and cost in textile industry: A case study for Turkey. Energy 2005, 30, 2424–2446. [Google Scholar] [CrossRef]
- Kocabas, A.M.; Yukseler, H.; Dilek, F.B.; Yetis, U. Adoption of European Union’s IPPC Directive to a textile mill: Analysis of water and energy consumption. J. Environ. Manag. 2009, 91, 102–113. [Google Scholar] [CrossRef] [PubMed]
- Zabaniotou, A.; Andreou, K. Development of alternative energy sources for GHG emissions reduction in the textile industry by energy recovery from cotton ginning waste. J. Clean. Prod. 2010, 18, 784–790. [Google Scholar] [CrossRef]
- Palamutcu, S. Electric energy consumption in the cotton textile processing stages. Energy 2010, 35, 2945–2952. [Google Scholar] [CrossRef]
- Hong, G.B.; Su, T.L.; Lee, J.D.; Hsu, T.C.; Chen, H.W. Energy conservation potential in Taiwanese textile industry. Energy Policy 2010, 38, 7048–7053. [Google Scholar] [CrossRef]
- Martínez, C.I.P. Energy use and energy efficiency development in the German and Colombian textile industries. Energy Sustain. Dev. 2010, 14, 94–103. [Google Scholar] [CrossRef]
- Hasanbeigi, A.; Hasanabadi, A.; Abdorrazaghi, M. Comparison analysis of energy intensity for five major sub-sectors of the textile industry in Iran. J. Clean. Prod. 2012, 23, 186–194. [Google Scholar] [CrossRef]
- Peng, L.H.; Zhang, Y.T.; Wang, Y.J.; Zeng, X.L.; Peng, N.J.; Yu, A. Energy efficiency and influencing factor analysis in the overall Chinese textile industry. Energy 2015, 93, 1222–1229. [Google Scholar] [CrossRef]
- Lin, B.; Zhao, H.L. Technological progress and energy rebound effect in China’s textile industry: Evidence and policy implications. Renew. Sustain. Energy Rev. 2016, 60, 173–181. [Google Scholar] [CrossRef]
- Huang, B.J.; Zhao, J.; Geng, Y.; Tian, Y.H.; Jiang, P. Energy-related GHG emissions of the textile industry in China. Resour. Conserv. Recycl. 2017, 119, 69–77. [Google Scholar] [CrossRef]
- Palamutcu, S. Energy Footprints in the Textile Industry; Woodhead Publishing: Cambridge, UK, 2015; pp. 31–61. [Google Scholar]
- Schindler. Energy and GHG Footprint, A Big Step Forward. 2010. Available online: http://www.schindler.com/com/internet/en/about-schindler/corporate-citizenship/site-ecology/energy-and-ghg-footprint.html (accessed on 19 August 2017).
- Cucek, L.; Klemes, J.J.; Kravanja, Z. A review of footprint analysis tools for monitoring impacts on sustainability. J. Clean. Prod. 2012, 34, 9–20. [Google Scholar] [CrossRef]
- Tapio, P. Towards a theory of decoupling: Degrees of decoupling in the EU and the case of road traffic in Finland between 1970 and 2001. Transp. Policy 2005, 12, 137–151. [Google Scholar] [CrossRef]
- Lu, Z.W.; Wang, H.M.; Yue, Q. Decoupling indicators: Quantitative relationships between resource use, waste emission and economic growth. Resour. Sci. 2011, 33, 2–9. [Google Scholar]
- Ang, B.W. Decomposition analysis for policymaking in energy: Which is the preferred method? Energy Policy 2004, 32, 1131–1139. [Google Scholar] [CrossRef]
- Ang, B.W. The LMDI approach to decomposition analysis: A practical guide. Energy Policy 2005, 33, 867–871. [Google Scholar] [CrossRef]
- Erdem, K.; Emel, K. An investigation on energy consumption in yarn production with special reference to ring spinning. Fibres Text. East. Eur. 2007, 15, 18–24. [Google Scholar]
- Erdem, K.; Emel, C. Analysis of energy consumption in woven fabric production. Fibres Text. East. Eur. 2010, 18, 14–20. [Google Scholar]
- China Electricity Council (CEC). Present Situation and Prospect of Power Industry in China. Available online: http://www.cec.org.cn/yaowenkuaidi/2015-03-10/134972.html (accessed on 19 August 2017).
- Wang, L.L.; Du, C.; Wu, X.Y. Analysis of carbon emission of China’s textile and apparel industry. China Text. Lead. 2011, 30, 19–22. [Google Scholar]
Figure 1.
The framework for decoupling states.
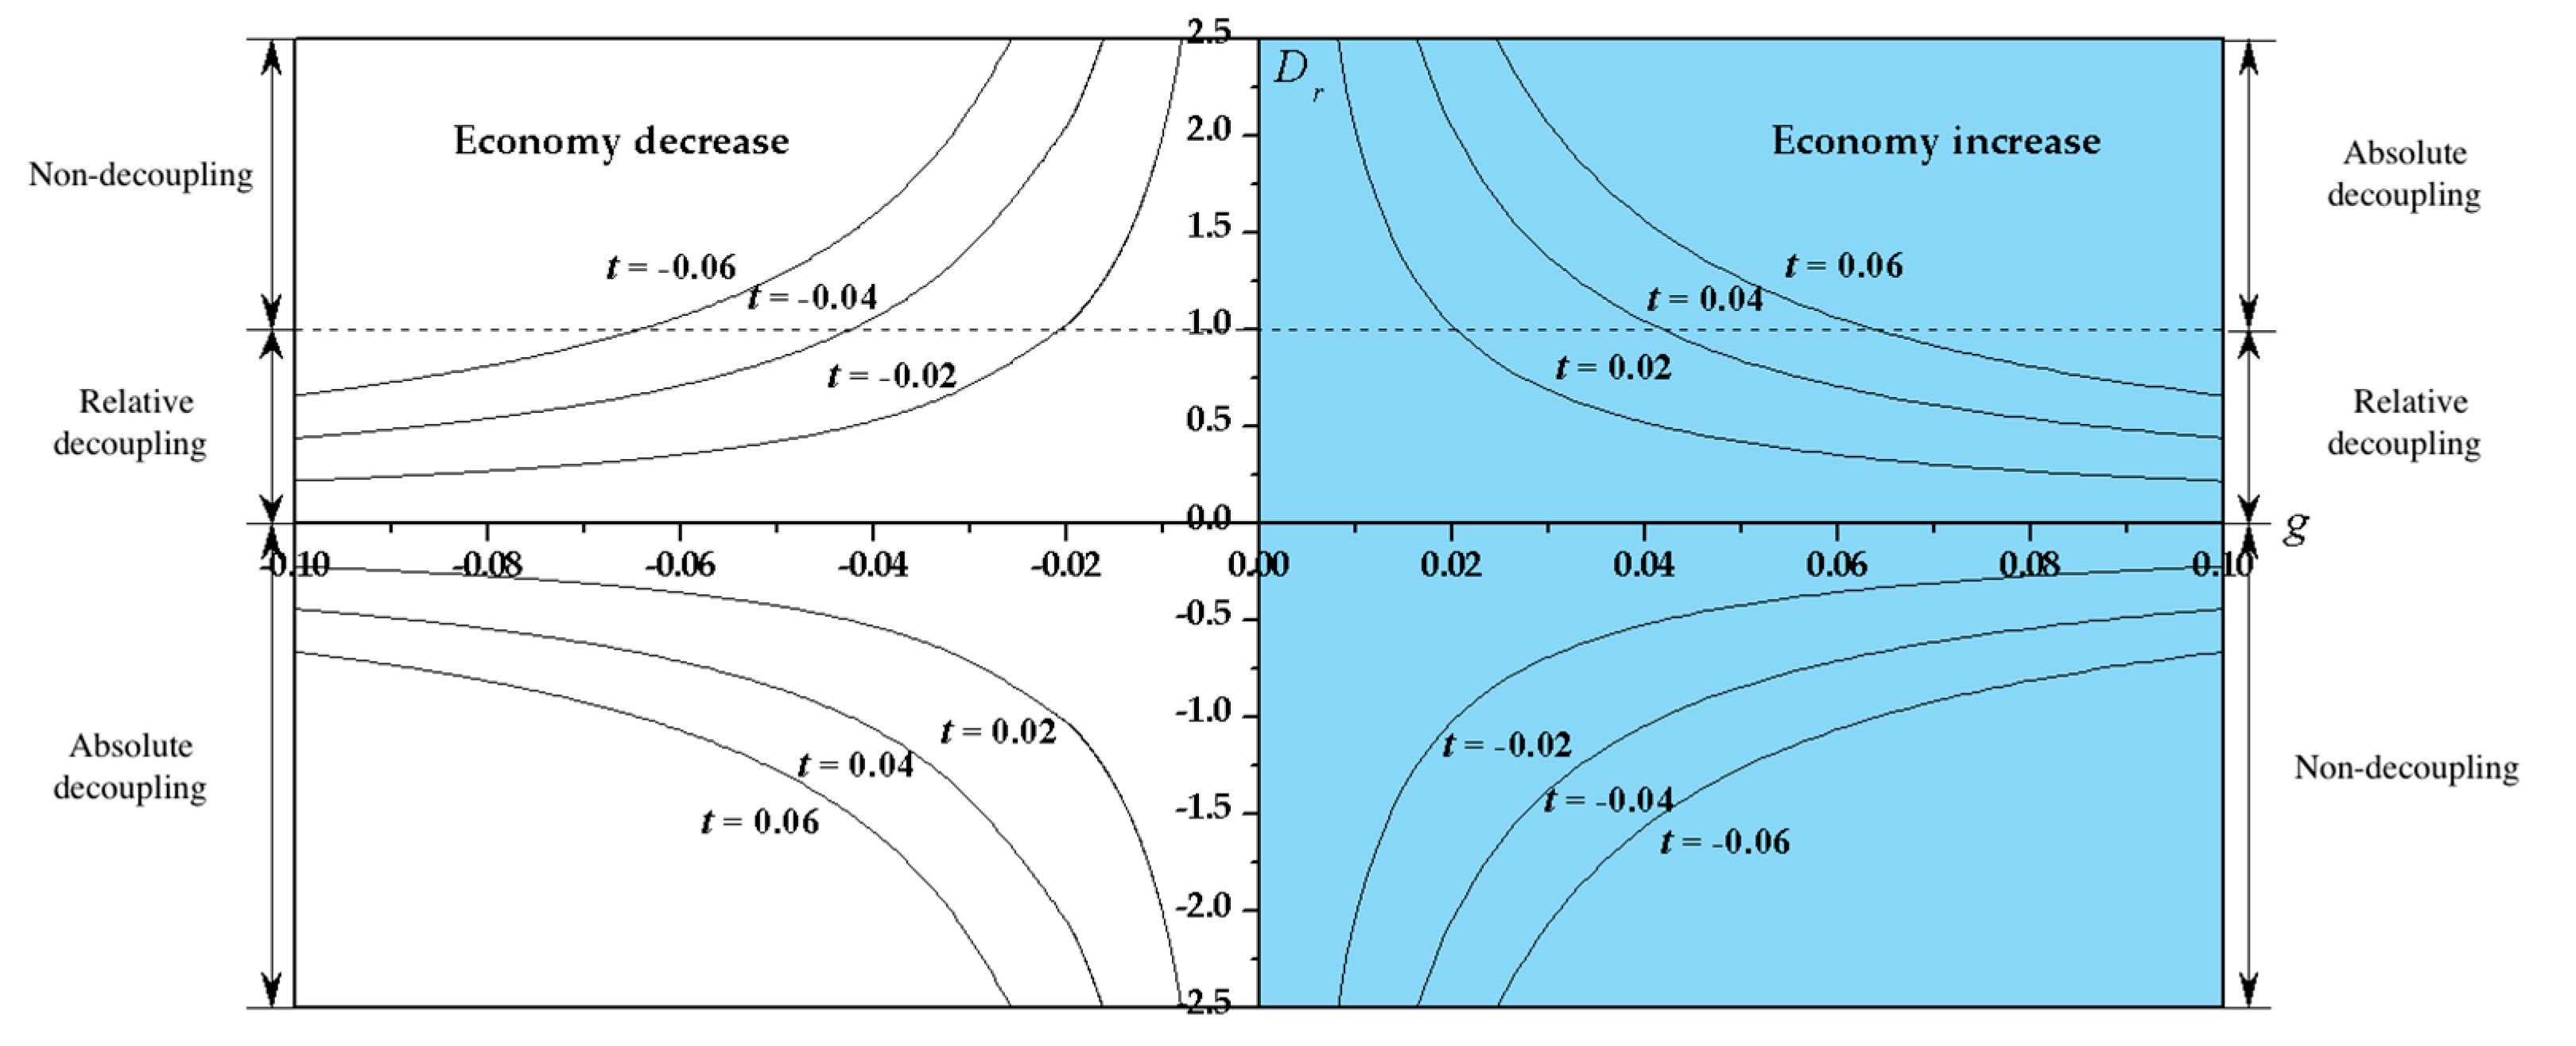
Figure 2.
General schematic presentation of textile industrial production and sectors. MT: Manufacture of Textile; MTAFC: Manufacture of Textile Wearing Apparel, Footwear and Caps; MFC: Manufacture of Chemical Fibers.
Figure 2.
General schematic presentation of textile industrial production and sectors. MT: Manufacture of Textile; MTAFC: Manufacture of Textile Wearing Apparel, Footwear and Caps; MFC: Manufacture of Chemical Fibers.

Figure 3.
Energy footprints (EFPs) of China’s textile industry and the sub-sectors.

Figure 4.
Energy footprint intensities (EFPIs) of China’s textile industry and the sub-sectors.
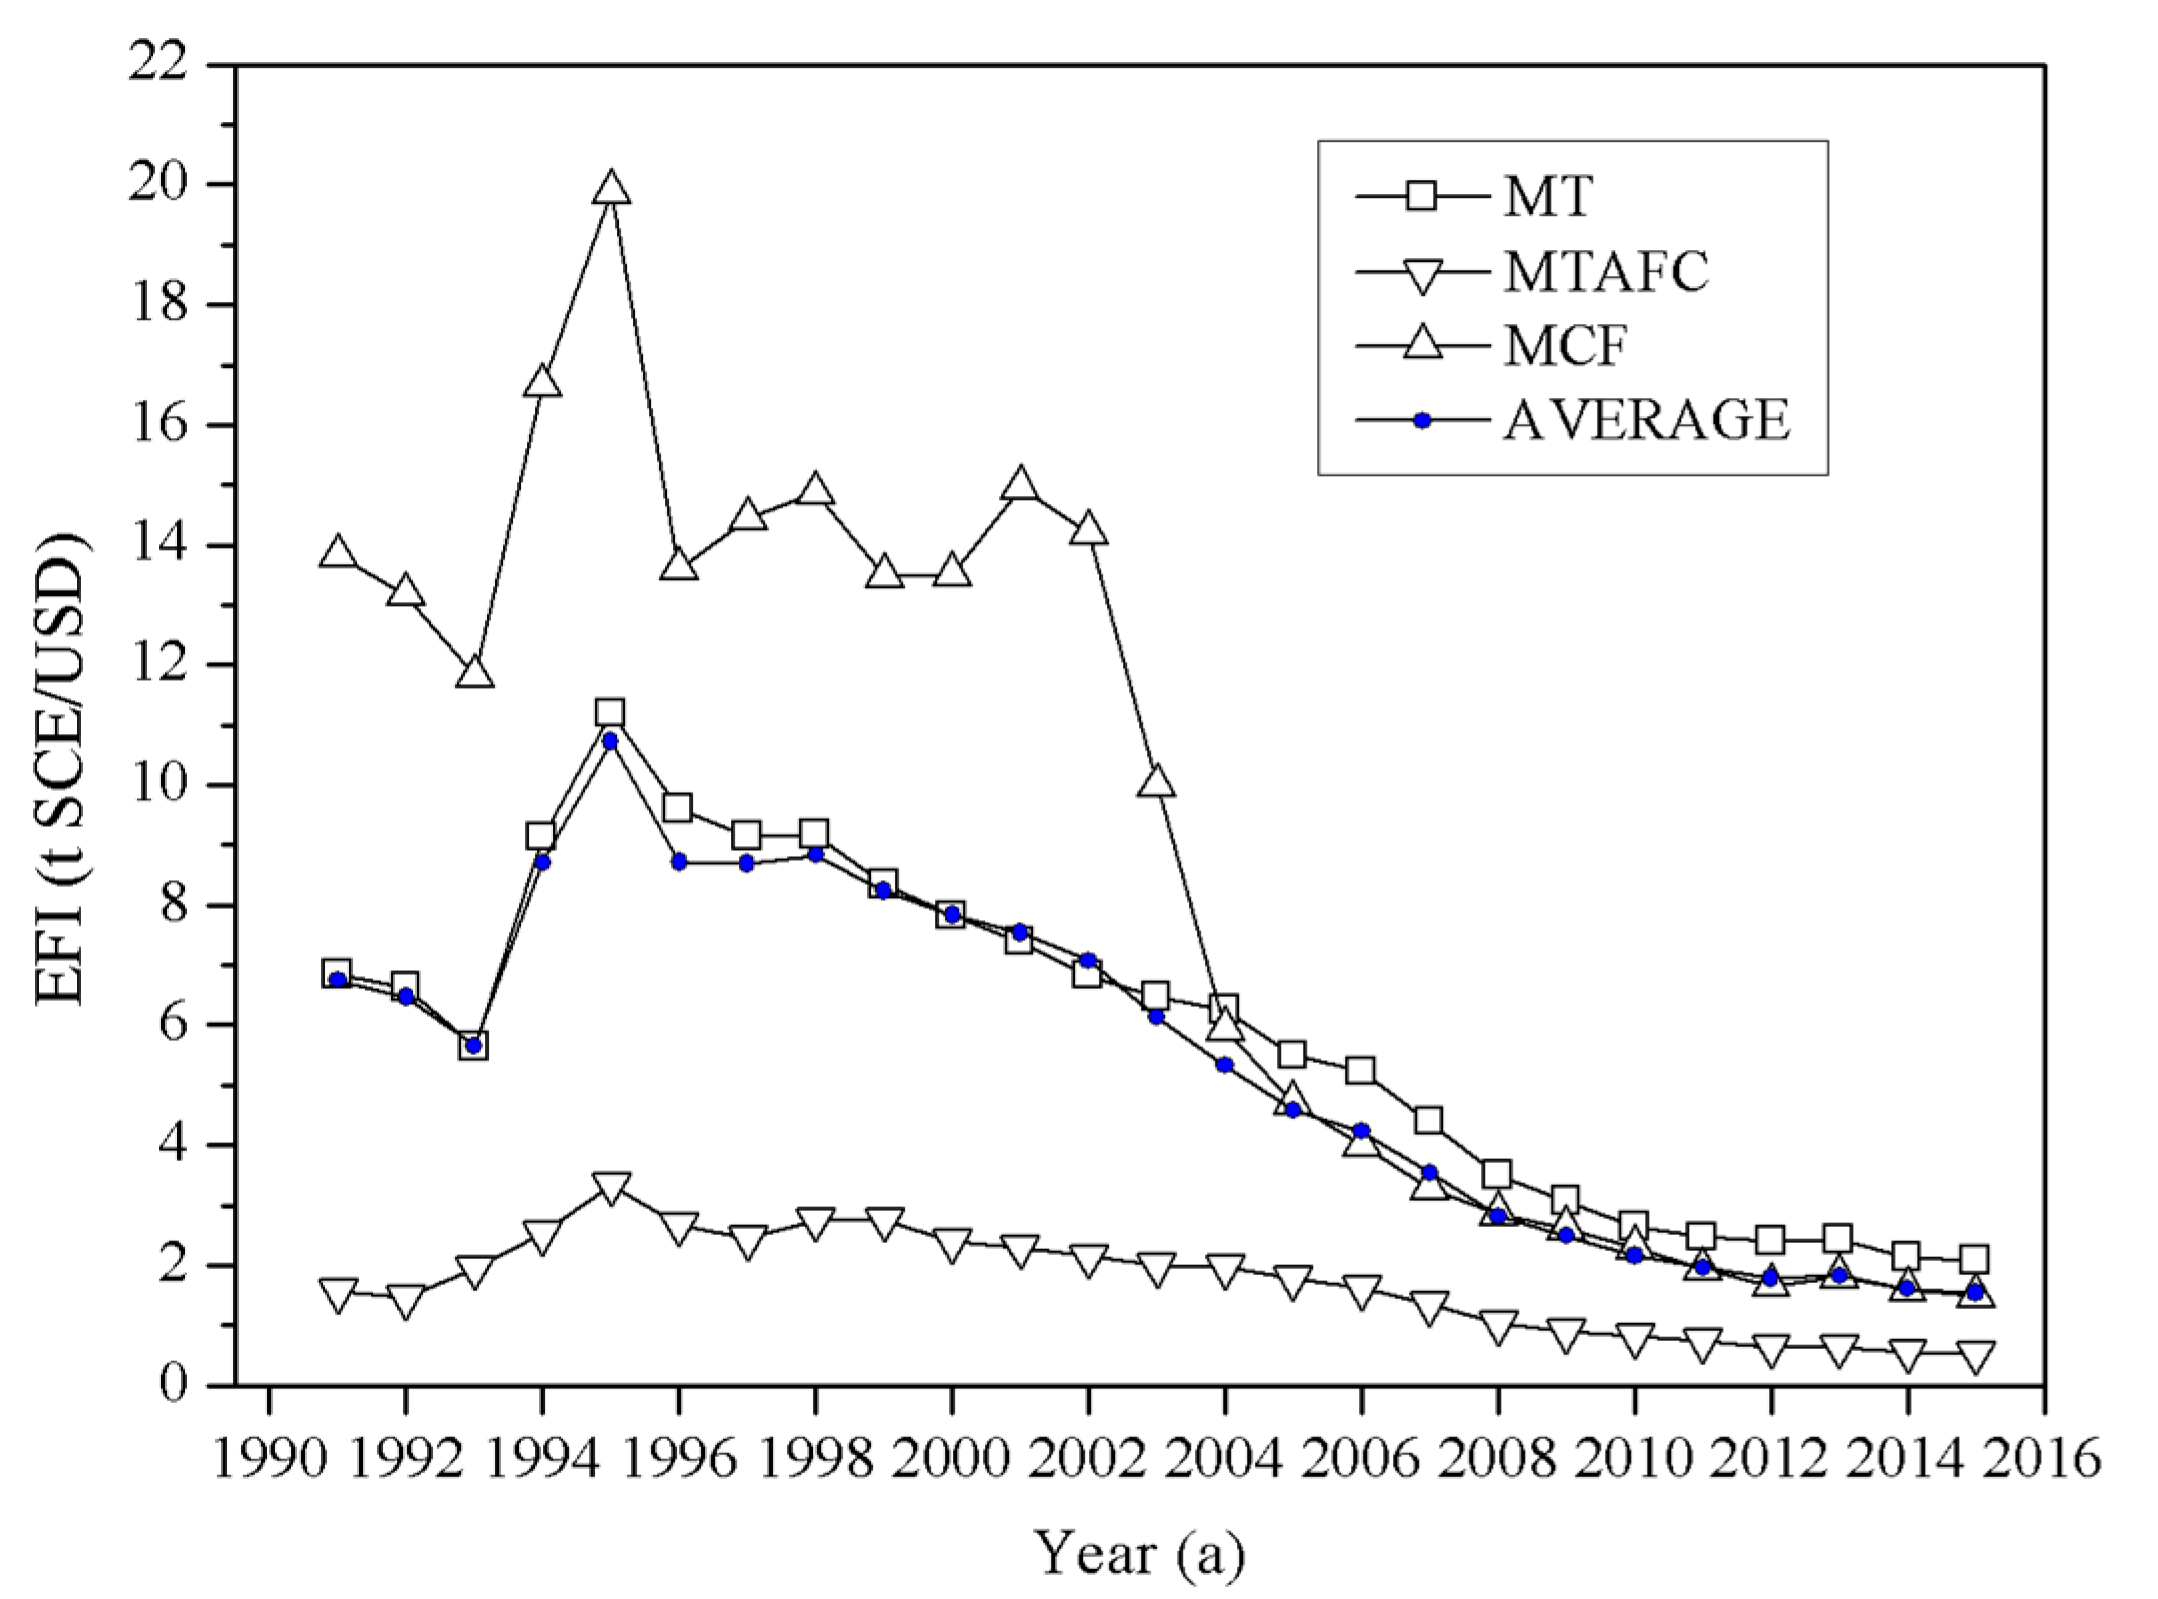
Figure 5.
Decoupling of EFP from economic growth in China’s textile industry.

Figure 6.
Contribution values of effect factors for the change of EFP.
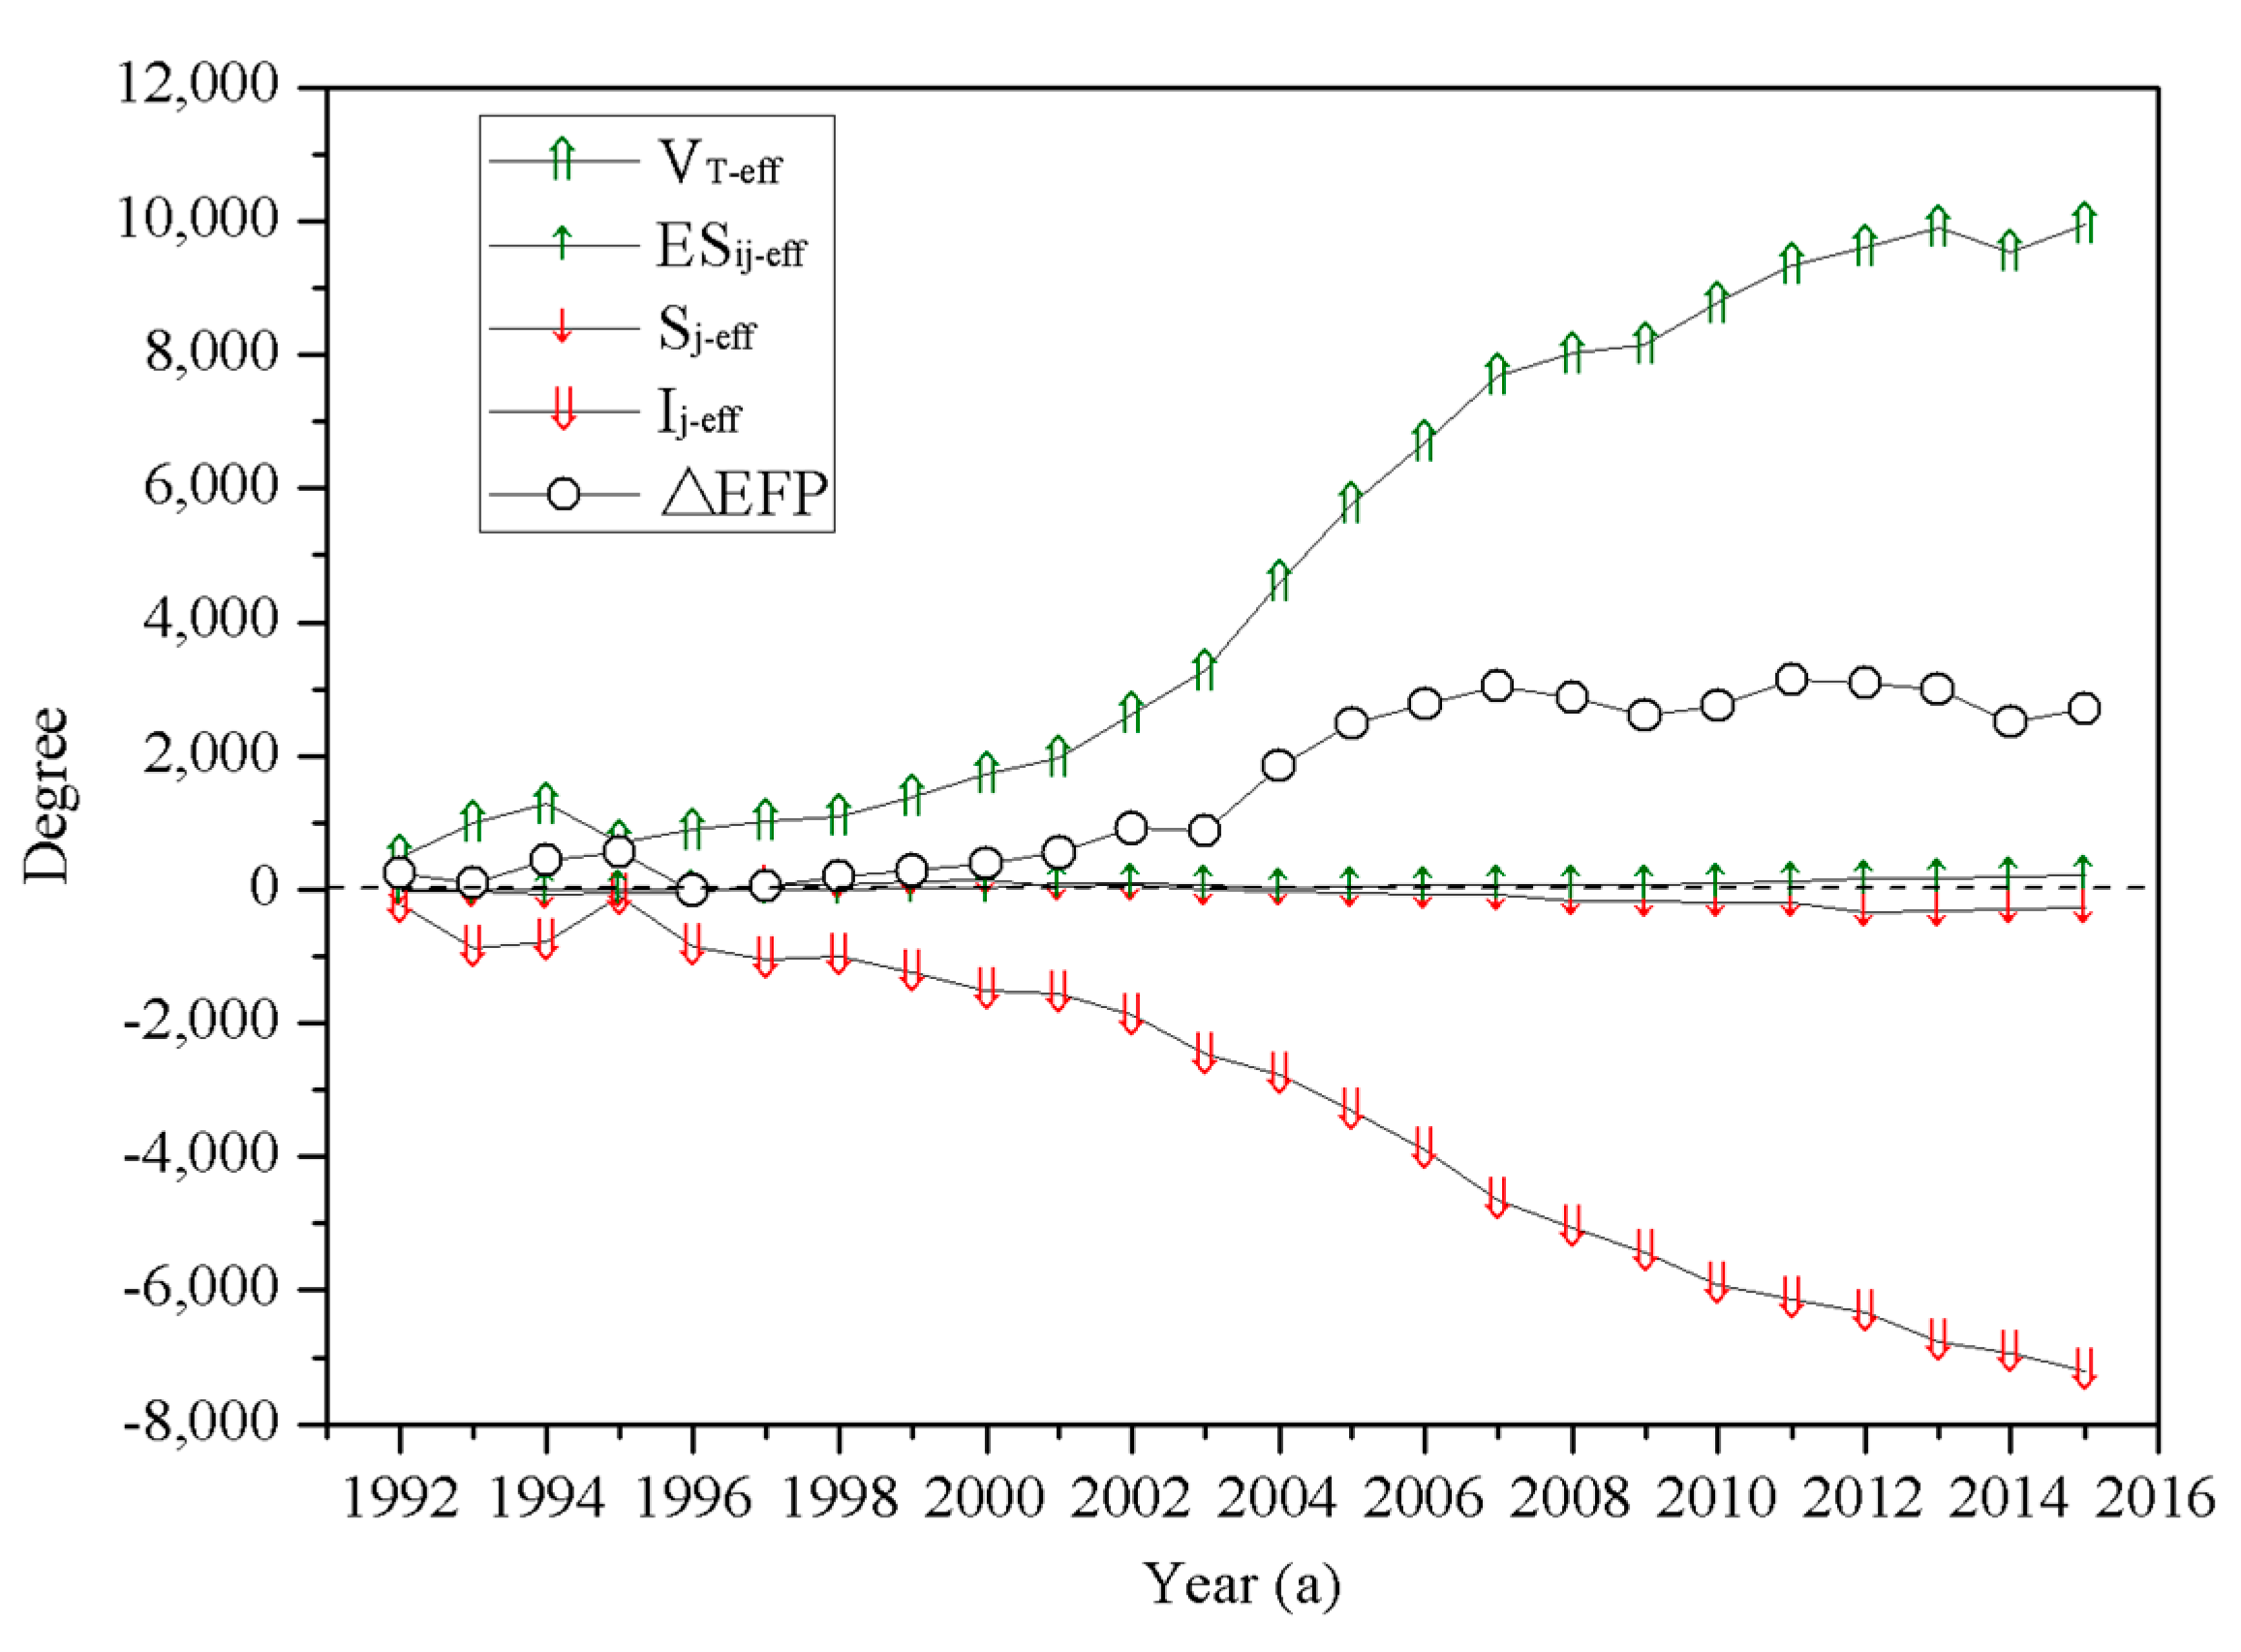
Figure 7.
Energy structure of China’s textile industry.

Table 1.
Decoupling judgments on EFP from economic growth in the textile industry.
| Decoupling State | Economy Increase | Economy Decrease |
|---|---|---|
| Absolute decoupling | Dr ≥ 1 | Dr ≤ 0 |
| Relative decoupling | 0 ≤ Dr ≤ 1 | 0 ≤ Dr ≤ 1 |
| Non-decoupling | Dr ≤ 0 | Dr ≥ 1 |
© 2017 by the authors. Licensee MDPI, Basel, Switzerland. This article is an open access article distributed under the terms and conditions of the Creative Commons Attribution (CC BY) license (http://creativecommons.org/licenses/by/4.0/).
Share and Cite
MDPI and ACS Style
Wang, L.; Li, Y.; He, W. The Energy Footprint of China’s Textile Industry: Perspectives from Decoupling and Decomposition Analysis. Energies 2017, 10, 1461. https://doi.org/10.3390/en10101461
AMA Style
Wang L, Li Y, He W. The Energy Footprint of China’s Textile Industry: Perspectives from Decoupling and Decomposition Analysis. Energies. 2017; 10(10):1461. https://doi.org/10.3390/en10101461
Chicago/Turabian StyleWang, Laili, Yi Li, and Wanwen He. 2017. "The Energy Footprint of China’s Textile Industry: Perspectives from Decoupling and Decomposition Analysis" Energies 10, no. 10: 1461. https://doi.org/10.3390/en10101461
Note that from the first issue of 2016, this journal uses article numbers instead of page numbers. See further details here.