Zonal Voltage Control Combined Day-Ahead Scheduling and Real-Time Control for Distribution Networks with High Proportion of PVs

1
School of Electrical Engineering and Automation, Hefei University of Technology, Hefei 230009, China
2
State Grid Zhejiang Electric Power Research Institute, Hangzhou 310014, China
*
Author to whom correspondence should be addressed.
Energies 2017, 10(10), 1464; https://doi.org/10.3390/en10101464
Submission received: 21 August 2017
/
Revised: 18 September 2017
/
Accepted: 19 September 2017
/
Published: 22 September 2017
Abstract
:Considering the possible overvoltage caused by the high proportion of photovoltaic systems (PVs) accessing distribution networks in the future, traditional centralized control methods will be too complex to satisfy the control response time demands. To solve this problem this paper presents a two-level voltage control method. At the day-ahead level, based on the PV-output and load-demand forecast, a community detection algorithm using an improved modularity index is introduced to divide the distribution network into clusters; a day-ahead optimal scheduling is drawn up on the basis of the network partition, and the objective is to minimize the operation costs of the distribution networks. At the real-time level, under the day-ahead optimal scheduling and network partition of the upper level, a real-time optimal voltage control algorithm is proposed based on the real-time operation data of the distribution networks, and the objective is to correct the day-ahead optimal scheduling through modifications. Thus, the algorithm realizes the combination of day-ahead scheduling and real-time control and achieves complete zonal voltage control for future distribution networks with high proportion of PVs. The proposed method can not only optimize the tap operation of an on-load tap changer (OLTC), improving the PV hosting capacity of the distribution network for a high proportion of PVs, but can also reduce the number of control nodes and simplify the control process to reduce the optimization time. The proposed approach is applied to a real, practical, 10 kV, 62-node feeder in Zhejiang Province of China to verify its feasibility and effectiveness.
1. Introduction
The increasing demand for renewable energy and the escalating concerns over environmental issues have driven the rapid and continuous growth of photovoltaic (PV) generation [1]. With the continuous integration of large-scale distributed PVs, there has been a higher proportion of PVs in some distribution networks. This can have a significant negative impact on the stability and economic performance of the existing distribution networks and may even affect the implementation of certain technologies such as predictive diagnostics [2] or model predictive control [3]. Moreover, existing distribution networks are growing in systems not designed with security criteria [4], and with the increase in PV penetration, the distribution networks will have significant security problems [5], such as overvoltage, power reversal and overload [6]. Among these problems, the overvoltage problem [7] challenges the safe and stable operation of distribution networks, thus restricting the PV-hosting capacity of a distribution network and the economic efficiency of PV sources.
With the continuous development of the PV industry and the increasing proportion of PV installations, the voltage-regulating ability of PV units has been developed. Along with the improved function of the intelligent inverters [8], the control functions of PV inverters have been greatly enriched, especially with respect to active and reactive power control. These methods, such as active power curtailment (APC) [9], reactive power compensation (RPC) [10] and optimal inverter dispatch (OID) [11], have become major ways to achieve voltage regulation for PV inverters; meanwhile, research on the coordinated control between PV inverters and on-load tap changers (OLTCs) has drawn wide attention. In [12], an economic model is established for OLTC and PV inverters to obtain the optimal dispatch for OLTCs and the reactive power output of PV inverters; the goal is to minimize the operational costs of the systems. A voltage control strategy based on the optimal inverter dispatch of PV, the operation of the OLTC and the energy storage system is proposed in [13]; furthermore, to optimize the capacities of the energy storage system (ESS) and the PV inverters, a two-level optimization procedure based on particle swam optimization (PSO) and dynamic programming (DP) is adopted. These foregoing methods for PV inverters mainly use the centralized mode, utilizing a power dispatching automation system, which is suitable for situations in which the proportion of PVs is relatively low and the node numbers of networks is relatively small. However, as the proportion of distributed PVs accessing the distribution networks grows, the number of PV installations will increase massively, and the locations will be comparatively decentralized, which will cause the increase of both control nodes and control variables for future distribution networks. If PV inverters are still controlled in a centralized manner, the control response time will not be satisfactory because of the extremely high dimensions of the control variables and the complicated control process. Considering the deficiency of the centralized control method, the zonal voltage control method has been proposed as a promising solution for this problem in recent years [14,15,16,17]. In contrast to centralized control methods, zonal voltage control selects a partition index to divide the power grid into sub-networks with the corresponding partitioning method; the internal nodes will have strong coupling between each other in the same sub-network, but weak coupling between nodes in different sub-networks. Therefore, the voltage of nodes can be independently controlled in a sub-network without affecting the other sub-networks, making the control process simpler, decentralized, rapid and practical.
In addition, in research on the coordinated control of PV inverters and OLTCs, optimizing the operation of OLTCs has become the focus [18,19]. Among the existing works on OLTC control methods, one main stream is formulated based on the real-time measurement of distribution networks. In [20], a voltage control strategy was proposed based on the compensation of OLTCs, to determine the OLTC tap-position by the relation between the current direction of the distribution network and the voltage of the measured point. A remote-control strategy was proposed in [21], to determine the transformer tap position by measuring the voltage at the remote node of the line. Although real-time measurement can be used to regulate the voltage according to the actual operation of the distribution network, it may cause frequent tap-changing of OLTCs, shorten the service life and increase the maintenance costs. The other main stream is to perform the optimal dispatch of an OLTC tap through the forecast of the distribution network’s operating data. In [22], based on the forecast of PV output and load demand, the optimum tap-position and minimum tap-changing for the OLTC are obtained by using the interior point technique method, and the goal is to minimize the tap-position change of OLTC. In [23], a hybrid volt/var control architecture was proposed based on the forecast of PV output and load demand, which generated an optimal dispatch schedule for OLTCs by a genetic algorithm. The studies based on forecasted data can guarantee the economic operation of the distribution network, prolong the OLTC service life; however, the control effect depends on the forecasting methods and forecasting accuracy. If there is a large difference between the forecast value and the actual operation, the control strategy will be ineffective. Considering the shortcomings of the two research methods mentioned above, the OLTC operation can be pre-scheduled utilizing the forecasting data of the distribution network and be corrected by real-time measurement, which not only can guarantee the operation constraints of OLTC but can also overcome the shortcomings caused by forecasting errors.
With the high proportion of PVs accessing distribution networks in the future, the number of PV nodes in the distribution networks will grow substantially, and the number of control nodes will increase dramatically as well. This will not only raise the dimension of control variables, making the process of control more complex but also reduce the prediction accuracy of the PVs due to their decentralized positions. These shortcomings will bring great challenges to the voltage control of distribution networks. Consequently, to solve the problem of the over-voltage and complex control process due to the high proportion of PVs in future distribution networks, as well as the inadequacies of existing OLTC controlled methods, this paper presents a two-level voltage control method with the combination of day-ahead optimal scheduling and real-time optimal control, which are based on zonal control. At the day-ahead level, based on the forecast of PV output and load demand, a community detection algorithm using an improved modularity index is introduced to divide the distribution network into clusters. On this basis, a day-ahead optimal scheduling is drawn up for the OLTC, PVs and distributed Shunt Capacitors (SC) in each sub-network, while the objective is to minimize the operation costs of the distribution networks. At the real-time level, on the basis of the day-ahead optimal scheduling and network partitioning of the day-ahead level, a real-time optimal voltage control algorithm is proposed based on the real-time operation data of the distribution networks; the objective is to minimum deviating from the day-ahead scheduling. Thus, the algorithm will perform the combination of day-ahead scheduling and real-time control and constitute the complete zonal voltage control for future distribution networks with high proportion of PVs. Finally, taking an actual feeder as an example, this paper proves that the proposed method can effectively and efficiently solve the overvoltage problem caused by the high proportion of PVs in future distribution networks.
2. Reactive Power-Voltage Sensitivity Based the Optimal Network Partition
2.1. Basic Concepts and Descriptions
With the high proportion of PVs accessing distribution networks, the number of control nodes in the distribution networks will grow sharply, and the process of voltage regulation will become more complicated. If we still control PV inverters in a centralized manner, the control response time will not be satisfactory because of the extremely high dimensions of the control variables. According to the different coupling degree between different nodes, the nodes with a strong-coupling degree are divided into the same sub-network, and nodes with a weak-coupling degree are divided into different sub-networks; thus, the corresponding voltage control strategy is formulated within the sub-network. Then, the problem of voltage control in whole distribution network can be transformed into voltage control in each sub-network, which can effectively narrow the range of controlled areas and reduce the dimension of control variables.
Girvan and Newman proposed a complex network detection algorithm based on a modularity index (ρ) to measure the quality of a partition [24]. As opposed to other clustering methods, the community detection algorithm based on the modularity index can obtain the optimal number of communities without predetermining the number of clusters in a data set. The modularity index is defined as follows [25,26]:
where Aij = 0 if no link exists between the two nodes. Otherwise Aij = 1; ; ; and function if nodes i and j are in the same sub-network; otherwise, .
In this paper, the edge weight Aij of the distribution network is expressed as the reactive power-voltage (V-Q) sensitivity matrix. With the Jacobian matrix [27] of the load flow in the power system, the calculation of the power flow in the distribution networks satisfies the following equation:
The relationships between the changes in node voltages and power injections can be represented by the Jacobian matrix APδ, BPU, CQδ and DQU, taking Equation (2) into the matrix transform as in the following equation:
To describe the coupling degree of two nodes, an average edge weight index is used to represent the V-Q weight Aij, that is:
where and represent the (i, j) and (j, i) elements of SVQ. In this way, the weight matrix A is symmetric.
2.2. Improved Modularity Index
The conventional modularity index calculated by the distribution network topology can only represent the coupling degree by the topology. However, if a high proportion of PVs access the distribution network, it will be unreasonable to partition only by the topology. Considering the available reactive power of PV inverters, decentralized installation of PVs, and other voltage-regulated devices such as distributed SCs in a distribution network, this paper proposes an improved modularity index that adds the reactive power balance degree γ and intra-partition coupling degree β to the conventional modularity index ρ. The reactive power balance degree γ represents the ability of reactive power balance within a sub-network; it can prevent the unbalanced quantity of the PVs and the distributed SCs between different sub-networks and avoid a shortage or surplus of adjustable reactive power. The intra-partition coupling degree β represents the coupling degree among the nodes within a sub-network, which can enhance the partitioning accuracy of the primary modularity index ρ. The greater the β is, the higher the coupling degree between the nodes in a sub-network will be.
The reactive power balance degree in the sub-network Ck is defined as:
when the reactive power support capability is oversupplied or there is no need for reactive power support in the sub-network, γ is 1. For the other situations, γ is less than 1. The minimum reactive power required in Ck is given by:
The intra-partition coupling degree in the sub-network Ck is defined as:
where the function avg() describes the mean value of all the weighted edges of sub-network Ck.
If the network is divided into N clusters, then the improved modularity index ρim can be expressed as:
In Equation (8), the average of all represents the reactive power balance ability in the current partition state, the average of represents the coupling degree between nodes within each sub-network in the current partition state. Adding these two average values to the conventional modularity index as the improved modularity index will not only embody the distribution network topology but can also reflect the reactive power balance ability and coupling degree between nodes within a sub-network, considering the integration of PVs.
2.3. Network Partition Optimization Algorithm
The forecast of the PV output and load demand was adopted to partition the distribution network, as a basis for day-ahead optimal scheduling and real-time optimal control. For a distribution network with n nodes, the network partition optimization algorithm is summarized as follows:
- Step 1:
- Obtain the complete forecast data of PV output and load demand one day ahead.
- Step 2:
- Collect the forecast data for the initial time, initialize the network partition so that each sub-network has only one node, and compute the initial improved modularity index ρim of each sub-network using (8).
- Step 3:
- For each node i, another node j is randomly selected from the remaining nodes to form a new sub-network (i, j). The modularity index of the new partition is calculated. Measure the modularity variation Δρ = − ρim for each possible partition where a pair of nodes is merged. The nodes i and j will be grouped into the same sub-community if the modularity variation reaches the highest value, and the total value of modularity will be updated.
- Step 4:
- Treat the newly formed sub-networks as individual nodes, and conduct the network merge process by repeating Step 3. The network is updated with the newly formed sub-communities.
- Step 5:
- The process is stopped when nodes can no longer be merged into any sub-network and the modularity does not increase. The optimal partition, the sub-network sets and the associated modularity indices are obtained.
- Step 6:
- Obtain the forecast data of the next period, and repeat the partitioning procedure until partitioning of the distribution network is completed for all periods.
In the existing study on a grid side, the distribution network partitioning is mainly determined by the network topology. However, the time-varying load demand and PV generation will also have impacts on the partition result on the distribution network side. The proposed partition method not only can consider the network topology but can also adapt the addition or removal of any PV nodes. Furthermore, it is updated by time-varying load demands and PV generation, resulting in a dynamic partition scheme.
3. Day-Ahead Optimal Scheduling of Distribution Networks
In the control of OLTC, if the tap changing is determined by the bus voltage at the secondary side of the OLTC or the remote voltage at the end points of feeders, it will raise the number of tap-changes because of voltage fluctuation at the monitoring point, even exceeding the maximum allowable number of tap changes. Optimizing the OLTC by day-ahead optimal scheduling not only can minimize the tap-changing of OLTCs according to the operation condition of the distribution network all day long and extend the OLTC service life but can also reduce the required installations of monitoring and communication devices. Along with the growing proportion of PVs, the scale of PVs continues expanding as well. Because of the increase of PVs and their decentralized installation in the distribution network, the voltage regulation will become more complicated. In this work, taking advantage of the zonal control, the day-ahead optimal scheduling is created on the basis of distribution network partition at the day-ahead level to maintain the economic operation of distribution networks whilst reducing OLTC tap operations, and the OLTC service life can be prolonged.
3.1. Operation Cost Model of the Distribution Network
3.1.1. OLTC Model
The OLTC operation cost for each tap-position change mainly comprises the maintenance cost and service life cost. The OLTC operation cost is described as follows [12]:
In a day’s operation, not only should the tap meet the constraint of allowable operations, but there are also limits on the tap-position:
3.1.2. PV Model
Traditionally, PV inverters are controlled to operate with power factor equal to 1, but, because PV panels have a low efficiency, the active power generated from the PV panels is smaller than the PV inverter rated power, the PV inverter can be controlled to operate with power factor different from 1 so as to inject or absorbed reactive power [11,19]. As shown in Figure 1, for example, when the active power generated from the PV panel is P3, the PV inverter will have maximum Q3 reactive capacity to regulate the voltage, which will not lead to the decrease of PV active output. The maximum reactive power that can be inject or absorbed depends on the active power generated by the PV panel and the PV inverter rated power.
The operation cost of PVs is mainly composed of the inverter losses by the absorption or release of reactive power. When reactive power regulation is performed by PV inverters, both the release and absorption of reactive power will cause losses on the inverters. Therefore, the absolute value of reactive power regulated by the PV inverters is taken to characterize the operation cost of the PVs:
when reactive power regulation is performed by PV inverters, the constraint of the reactive power and the power factor must be satisfied by:
where Qmax,n depends on the minimum power factor 0.95.
3.1.3. Distributed SC Model
The distribution network usually contains other auxiliary voltage regulators, such as an SC (Shunt Capacitor) and an SVC (Static Var Compensator) [28]. In this work, the distributed SCs were selected as the auxiliary voltage regulators, cooperating with the OLTC and PVs to achieve the voltage control, to enhance the network’s ability to host PVs. The operational cost of the distributed SCs mainly comprises the maintenance cost of its tap:
3.1.4. Grid Losses Model
The grid losses model can be expressed as follows:
3.2. Objective Function and Problem Solving
The cost function in (17) is constructed to minimize the operation cost of the distribution networks:
The problem is subject to the following constraints:
- OLTC constraints: Equations (10)–(11).
- PV constraints: Equations (13)–(14).
- SC constraints: Equation (16).
- Network constraints:
Note that, when the reactive power is absorbed by the PV units, QPVi is negative.
To solve the optimization problems, an improved particle swarm optimization algorithm (IPSO) [29,30] is adopted to conduct the day-ahead optimal scheduling for OLTC, PVs and distributed SCs. The IPSO method can be described as follows:
where rd() is a uniform random value in the range of [0, 1]. The gbest term is considered a “social influence” term. When this effect is removed from the PSO, the performance is abysmal. Therefore, the social interaction is an important factor for improving the PSO performance. To enhance the social interactions, the IPSO uses some fittest-particle information to modify the particle position and velocity. Specifically, at the ith iteration, the particles are rearranged in descending order according to their objective values, and the last n particles are selected to modify the particle position and velocity. Each particle of the proposed IPSO method modifies its position and velocity using the best solution particle achieved and the gbest of neighbourhood particles. It is similar to the social society in that a group of leaders can make better decisions. However, in the standard PSO, only one gbest of neighbourhood particles is employed. As a particle swarm population searches over time, individuals are drawn towards one another’s successes, with the usual result being the clustering of individuals in optimal regions of the space.
4. Real-Time Optimal Control of Distribution Networks
With the future integration of the high proportion of PVs, the changes in PV output will have a significant impact on the existing distribution networks. If one only relies on the day-ahead optimal scheduling to support the operation of distribution networks, the control strategy will fail due to forecast errors. If the real-time optimal control strategy is formulated using the real-time operation data, the goal is to correct the day-ahead optimal scheduling through modifications. The real-time control strategy can maintain the economic operation of the distribution network and reduce the negative influence of forecast errors. However, for distribution networks with high proportion of PVs, because of large-scale installations and the decentralized location of PVs, the voltage control strategy using traditional centralized real-time control methods will be complicated due to the large number of control variables, and it is difficult to satisfy the control-response-time requirements. With the network partition, it is able to perform the real-time optimal voltage control for the OLTC, as well as the PVs and distributed SCs in the selected sub-network. Furthermore, it can implement the independent voltage control in a sub-network without affecting other sub-networks. In addition, the control variables only contain the PVs and distributed SCs in the selected sub-networks, which can greatly reduce the dimensions of the variables, decrease the computation complexity, and more rapidly create a real-time optimal voltage control strategy tracking day-ahead optimal scheduling. To correct the day-ahead optimal scheduling through modifications, this work formulates the real-time optimal voltage control strategy based on the network partition with respect to the real-time level, and the objective is to minimize the deviation from day-ahead optimal scheduling for the actual operation of the distribution network. The objective function is:
The problem is subjected to the following constraints: Equations (13)–(14) and (18)–(20). To achieve the real-time optimal voltage control strategy in (23), the IPSO is employed. Through the above constraints, by adjusting the tap-position of the OLTC and the reactive power regulated by PVs ΔQPV and SCs ΔQSC in the selected sub-networks, full power flow calculations are conducted, and then the best real-time dispatch for OLTC, PVs and distributed SCs is obtained.
For a distribution network with a high proportion of PVs, the implementation of a real-time voltage optimal control strategy is described as follows:
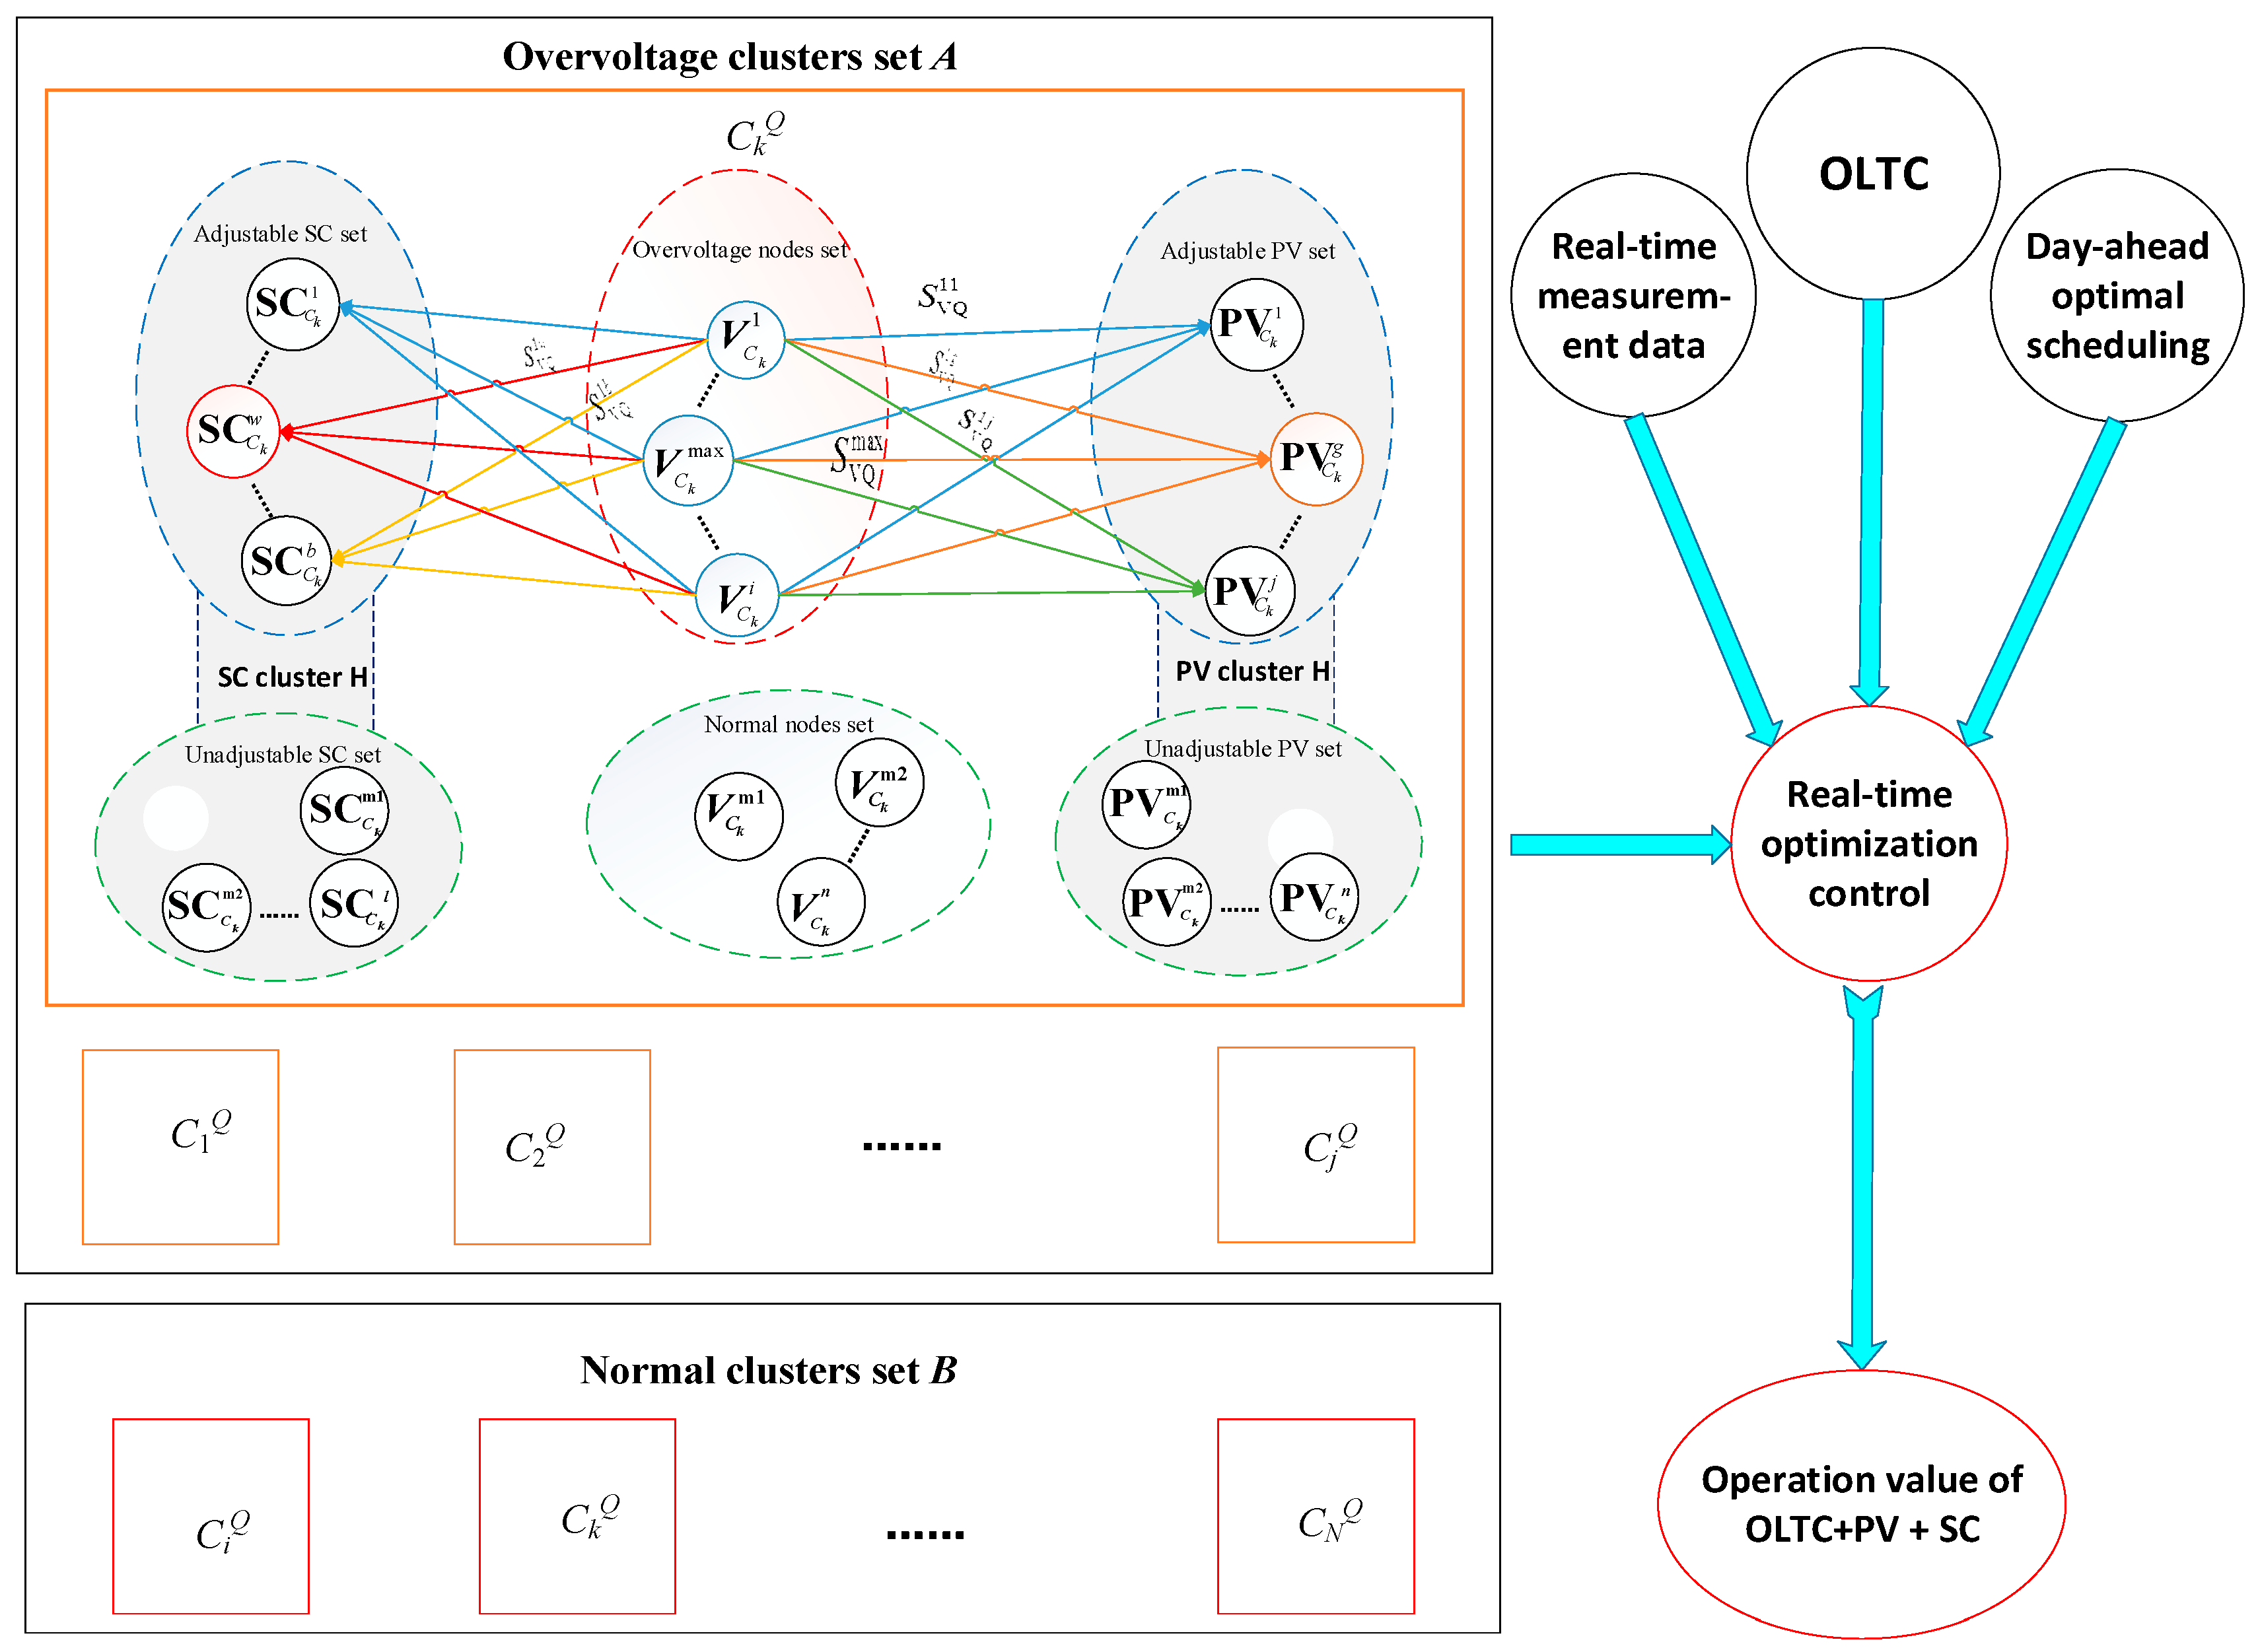
First, the sub-networks in the controlling period were obtained according to the day-ahead distribution network partition as described in Section 2. It is assumed that the distribution network is partitioned into N sub-networks {C1Q, C2Q, …, CkQ, …, CNQ}, as shown in Figure 2. Because the internal nodes have strong coupling between each other in the same sub-network but a weak coupling between nodes in different sub-networks, the node voltage can be independently controlled within a sub-network without affecting other sub-networks. Then, the sub-networks containing overvoltage nodes are denoted as overvoltage cluster set A, and the sub-networks without overvoltage nodes are denoted as normal voltage cluster set B. On this basis, the real-time optimal voltage control is accomplished. The real-time optimal voltage control is mainly for the sub-networks containing overvoltage nodes by adjusting the OLTC, as well as PVs and distributed SCs. The PVs and SCs in the sub-networks without any overvoltage nodes will not participate in the regulation and continue to operate in accordance with the day-ahead optimal scheduling. CkQ is taken as an example to explain the control process of the PVs and distributed SCs within a sub-network. In Figure 2, it is assumed that there are n nodes, m PV units and l SCs in CkQ. In CkQ, all the nodes with a PV installed are denoted as PV cluster H. In H, the PVs with available adjustable reactive power are assigned to adjustable PV set {, , …, }, and the others are assigned to unadjustable PV set {, , …, }. In addition, the overvoltage load nodes are assigned to overvoltage nodes set {, , …, }, and the others are assigned to normal nodes set {, , …, }. Meanwhile, all the nodes with a distributed SC installed are denoted as SC cluster G. In G, the offline distributed SCs are assigned to adjustable SC set {, , …, }, and the others are assigned to the unadjustable SC set {, , …, }. Taking the tap-position of OLTC, as well as the available PV reactive power in the adjustable PV set and the available distributed SC reactive power in the adjustable SC set of overvoltage clusters set A, as the decision variables, take the day-ahead optimal scheduling as the reference, and the optimal reactive power regulating strategy can be obtained using (23) by PVs and SCs in every selected sub-network, as well as the actual tap-position of OLTC. Finally, the above optimized results are sent to each control unit for the real-time regulation of the distribution network.
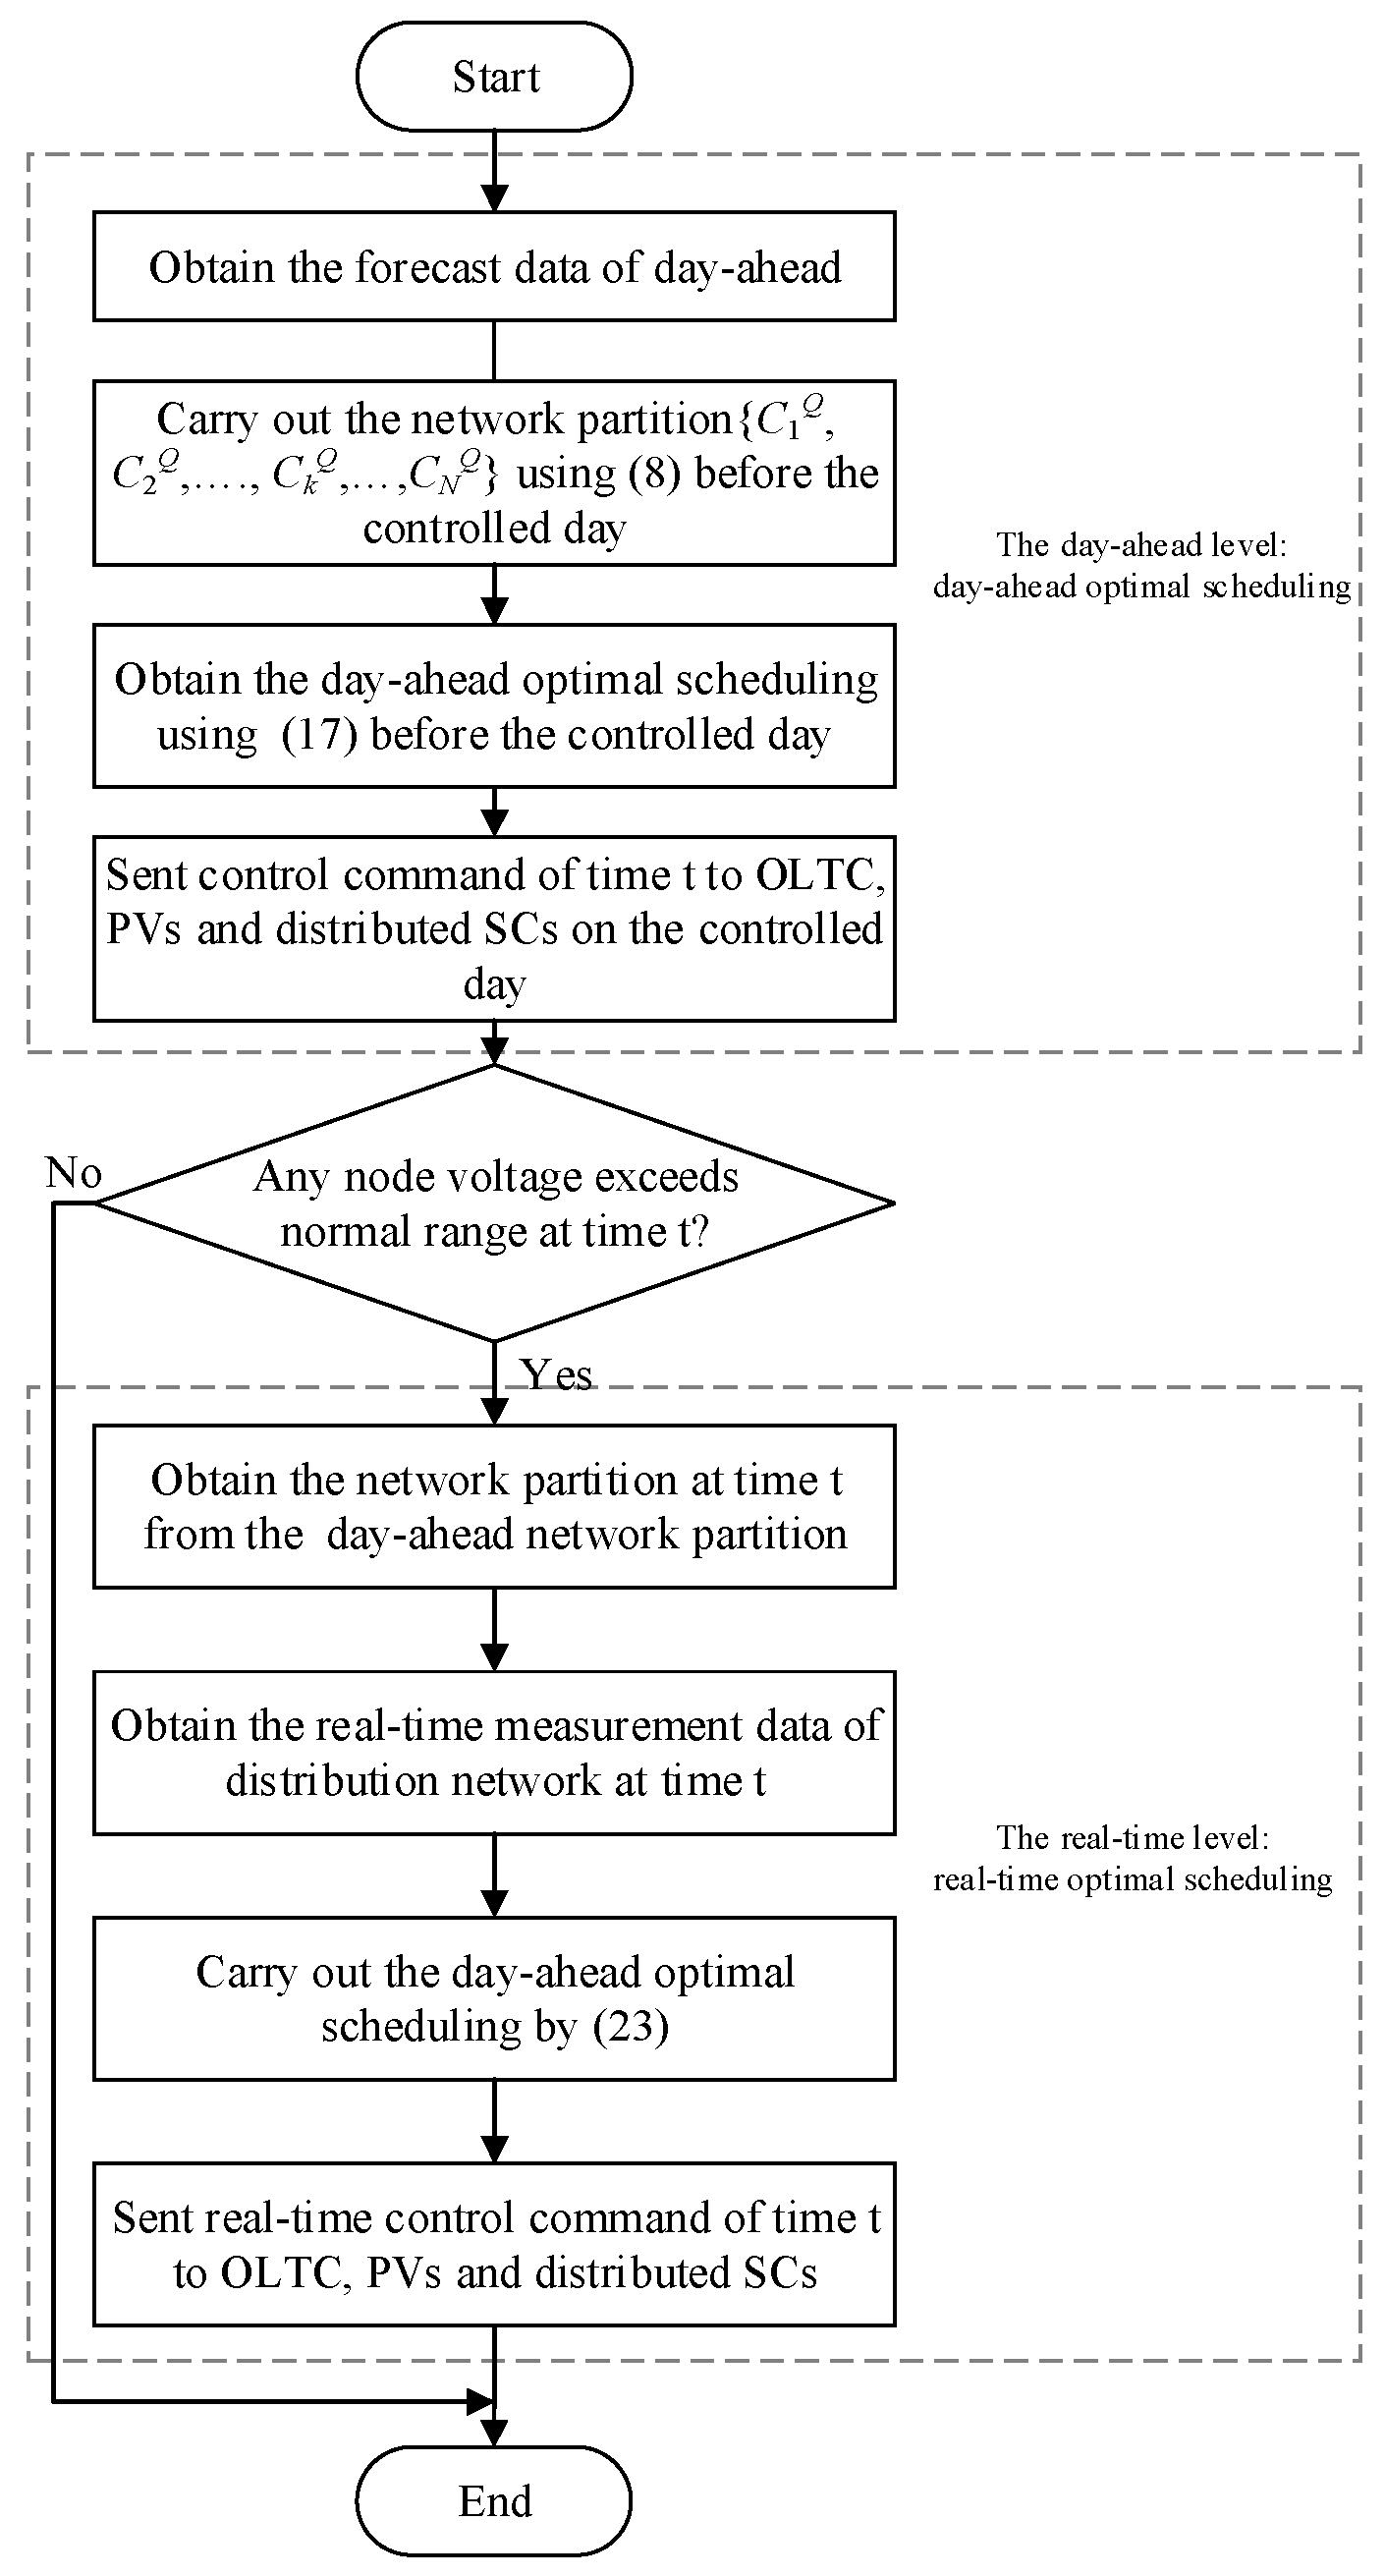
Based on the above, the combination of day-ahead optimal scheduling and real-time optimal voltage control are summarized in Figure 3, as follows:
5. Case Study
5.1. Case Study System
A practical three-phase balanced 10 kV radial feeder located in Zhejiang Province, China, is utilized to verify the proposed approach. As shown in Figure 4, there are 62 load nodes with a total nominal load of 26.32 MVA along the feeder. Each PV unit in the system is integrated into the feeder through a step-up transformer.
For the practical system, the capacity and location of the PVs are shown in Table 1. No overvoltage issue has been reported during its past operation under this situation. According to the future PV installation plan, 8.3 MW PVs will be added to this feeder. The future PV installation capacity of each new PV unit together with the existing ones is shown in Figure 5. To improve the PV-hosting capacity of the distribution network with high proportion of PVs, distributed SCs are selected as auxiliary voltage regulating equipment and installed along the feeder. The locations of distributed SCs are shown in Figure 4; each SC access point is connected to five groups of SCs, and the capacity of each group is 10 kVar. In this paper, the tap changer of OLTC is set at ±8 taps with 0.625% voltage regulation per tap. The detailed line parameters are listed in Table A1 of the Appendix A, and the load parameters are listed in Table A2 of the Appendix A.
Given the detail of this distribution network, a corresponding simulation model is established using the OpenDSS (version 7.6.5.13) programme. The base voltage and the base power are set as 10 kV and 100 MVA, respectively. The day of 16 July 2014 with the strongest solar irradiance is selected to verify the feasibility and effectiveness of the proposed strategy. The voltage at the primary side of the OLTC among 16 July 2014is shown in Figure 6. The forecast value and real-time value of solar irradiance (with respect to the reference irradiance of 1500 W/m2) of 16 July 2014, as well as load demand, are shown in Figure 7. The ambient temperature is set at 25 °C in the simulation studies. The operational power factor of each inverter ranges from −0.95 to 0.95. The actual PV generation efficiency of the distributed PVs is 78%.
5.2. Distribution Network Partition
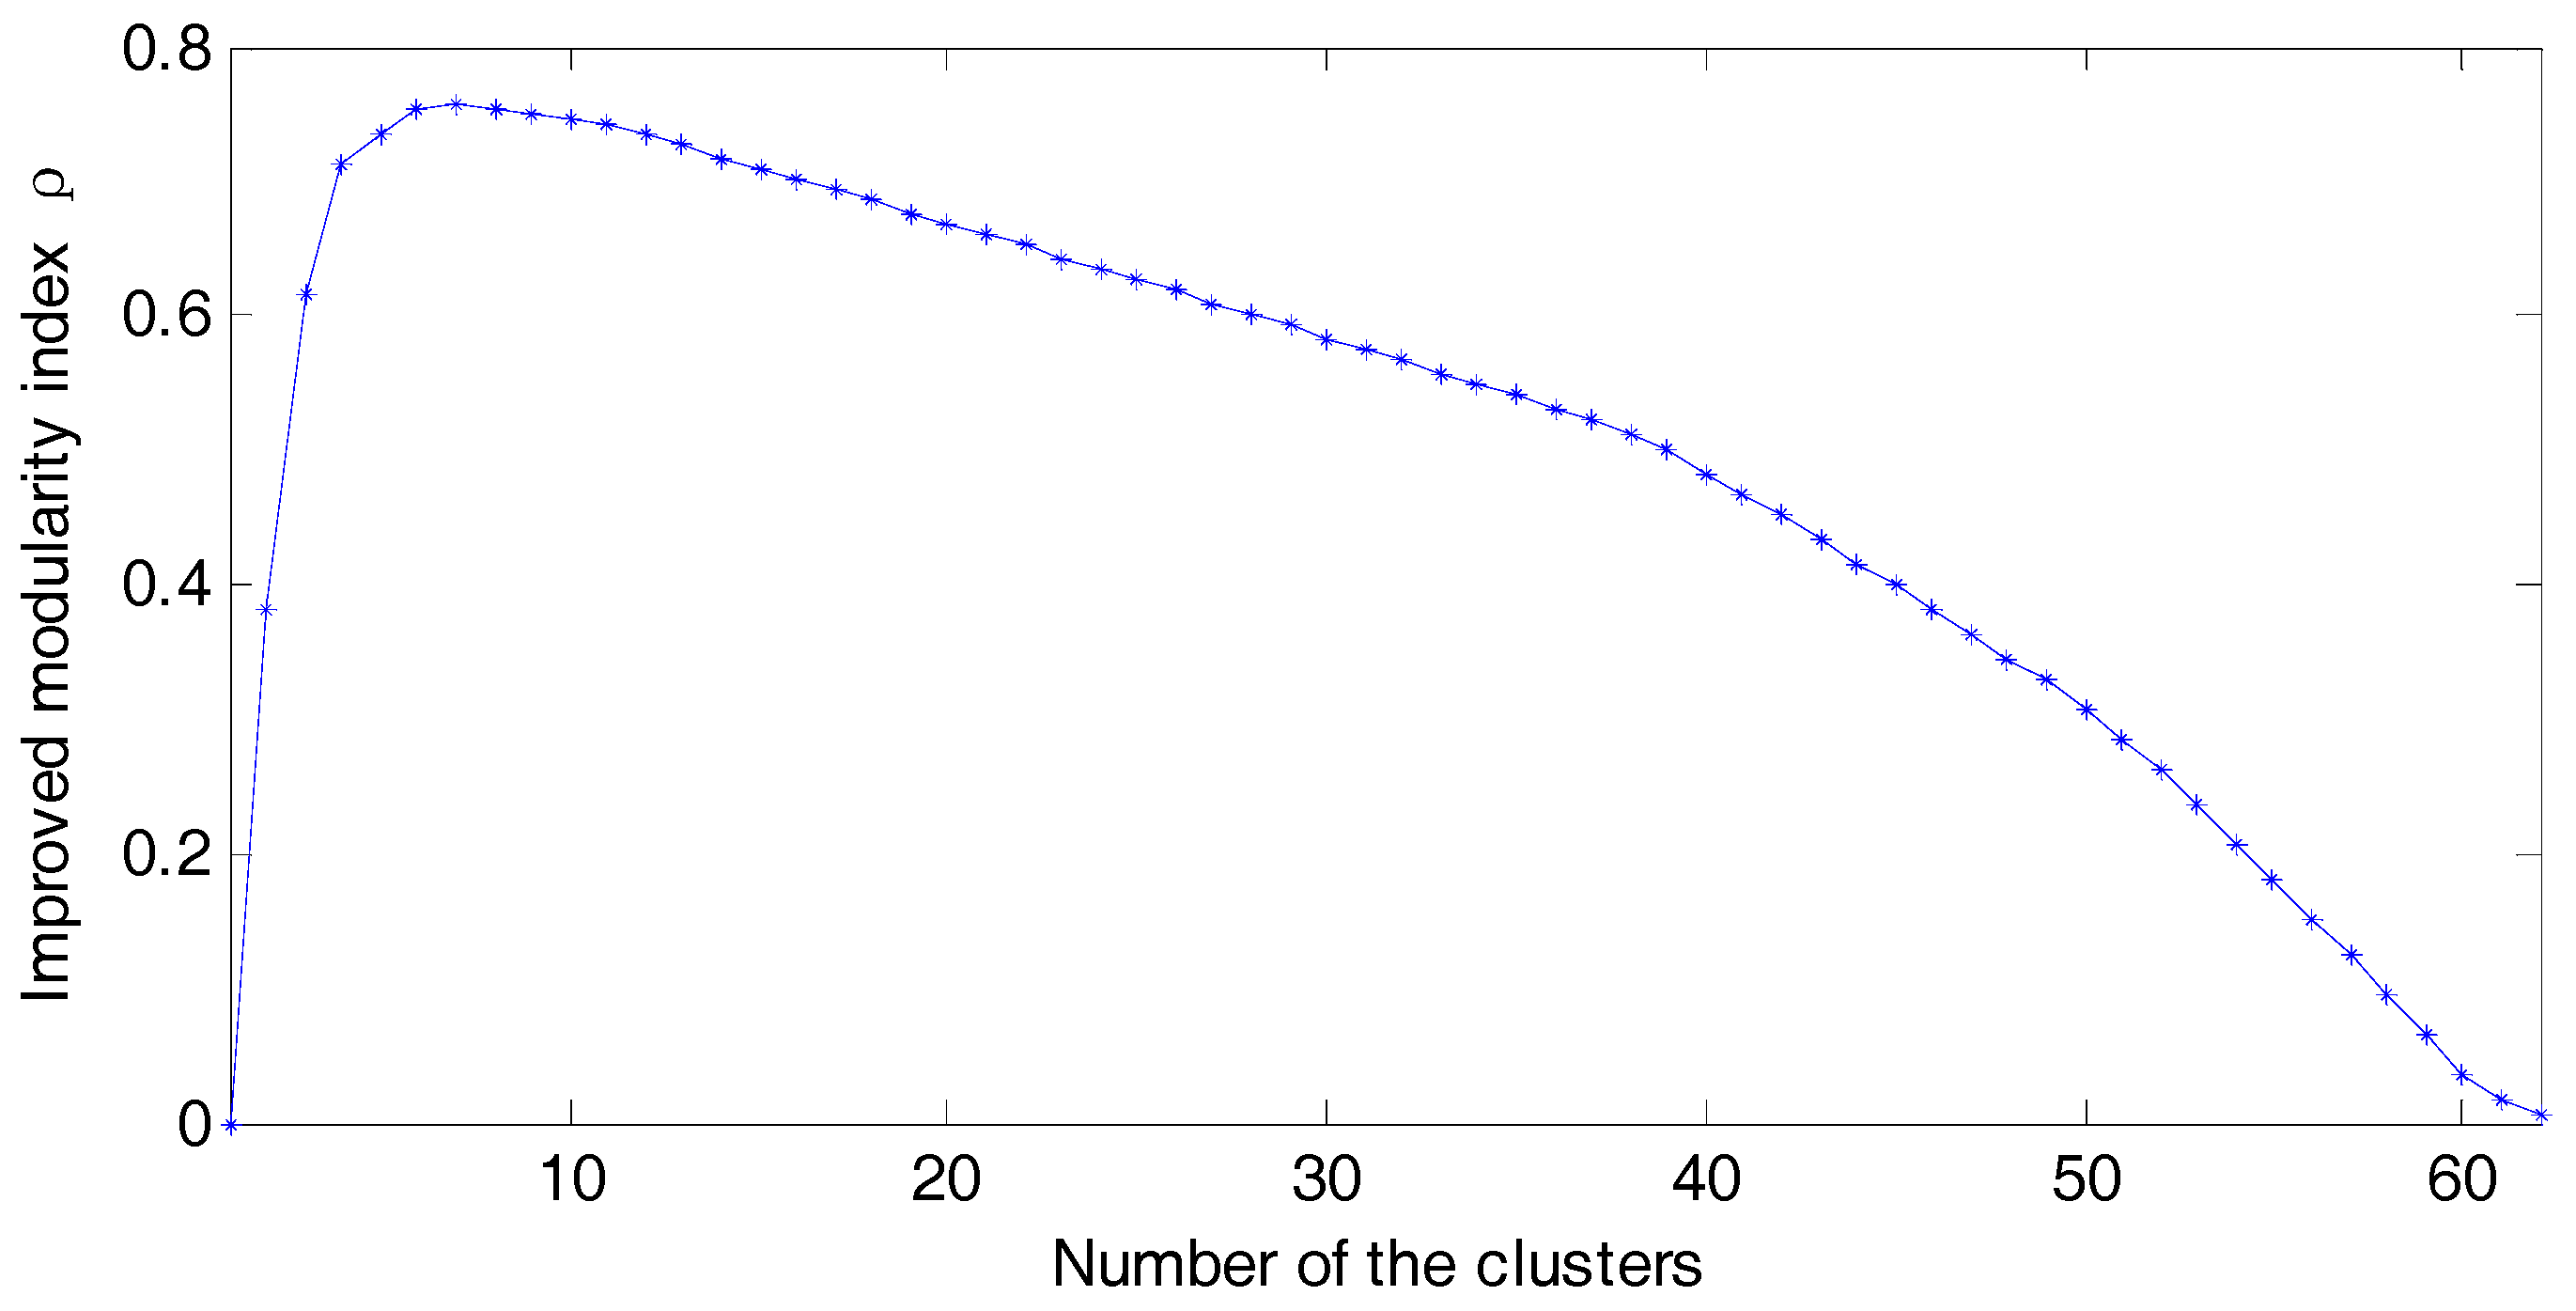
The distribution network is day-ahead partitioned according to the forecast of PV output and load demand, as the basis of day-ahead optimal scheduling and real-time optimal control. This paper chooses the whole day forecast value of 16 July 2014 as a reference, to accomplish the network partition by the proposed partitioning method for all of the periods. The distribution network, at 12:00 of 16 July 2014, is taken as an example to explain the details of the proposed partitioning method. Figure 8 shows the value of the improved modularity index ρim versus the number of sub-networks for the practical network, using the partitioning method described in Section 2. The modularity index reaches its maximum value ρim = 0.765 when the feeder is partitioned into seven sub-networks. Consequently, the optimal number of sub-networks is seven. The final optimal partition result is shown by the red dashed frame in Figure 4, where the sub-networks are denoted as {CQ1, CQ2, CQ3, CQ4, CQ5, CQ6, CQ7}. As shown in Figure 4, the partitioning result is related to the geographic attributes of the load nodes because the reactive power-voltage sensitivity between different nodes is related to the impedance between nodes, and the impedance between nodes SC is directly related to the geographical attributes.
5.3. Result of the Two-Level Voltage Control Method
According to the forecast of the PV output and load demand on 16 July 2014, the day-ahead optimal scheduling for the distribution network is obtained by the proposed method described in Section 3 on 15 July 2014. In each control period of 16 July 2014, combining the day-ahead optimal scheduling, the real-time operation values of OLTC, as well as the PVs and distributed SCs in selected sub-networks (take the node 23 as an example), are modified according to the real-time measurement by the proposed method in Section 4.
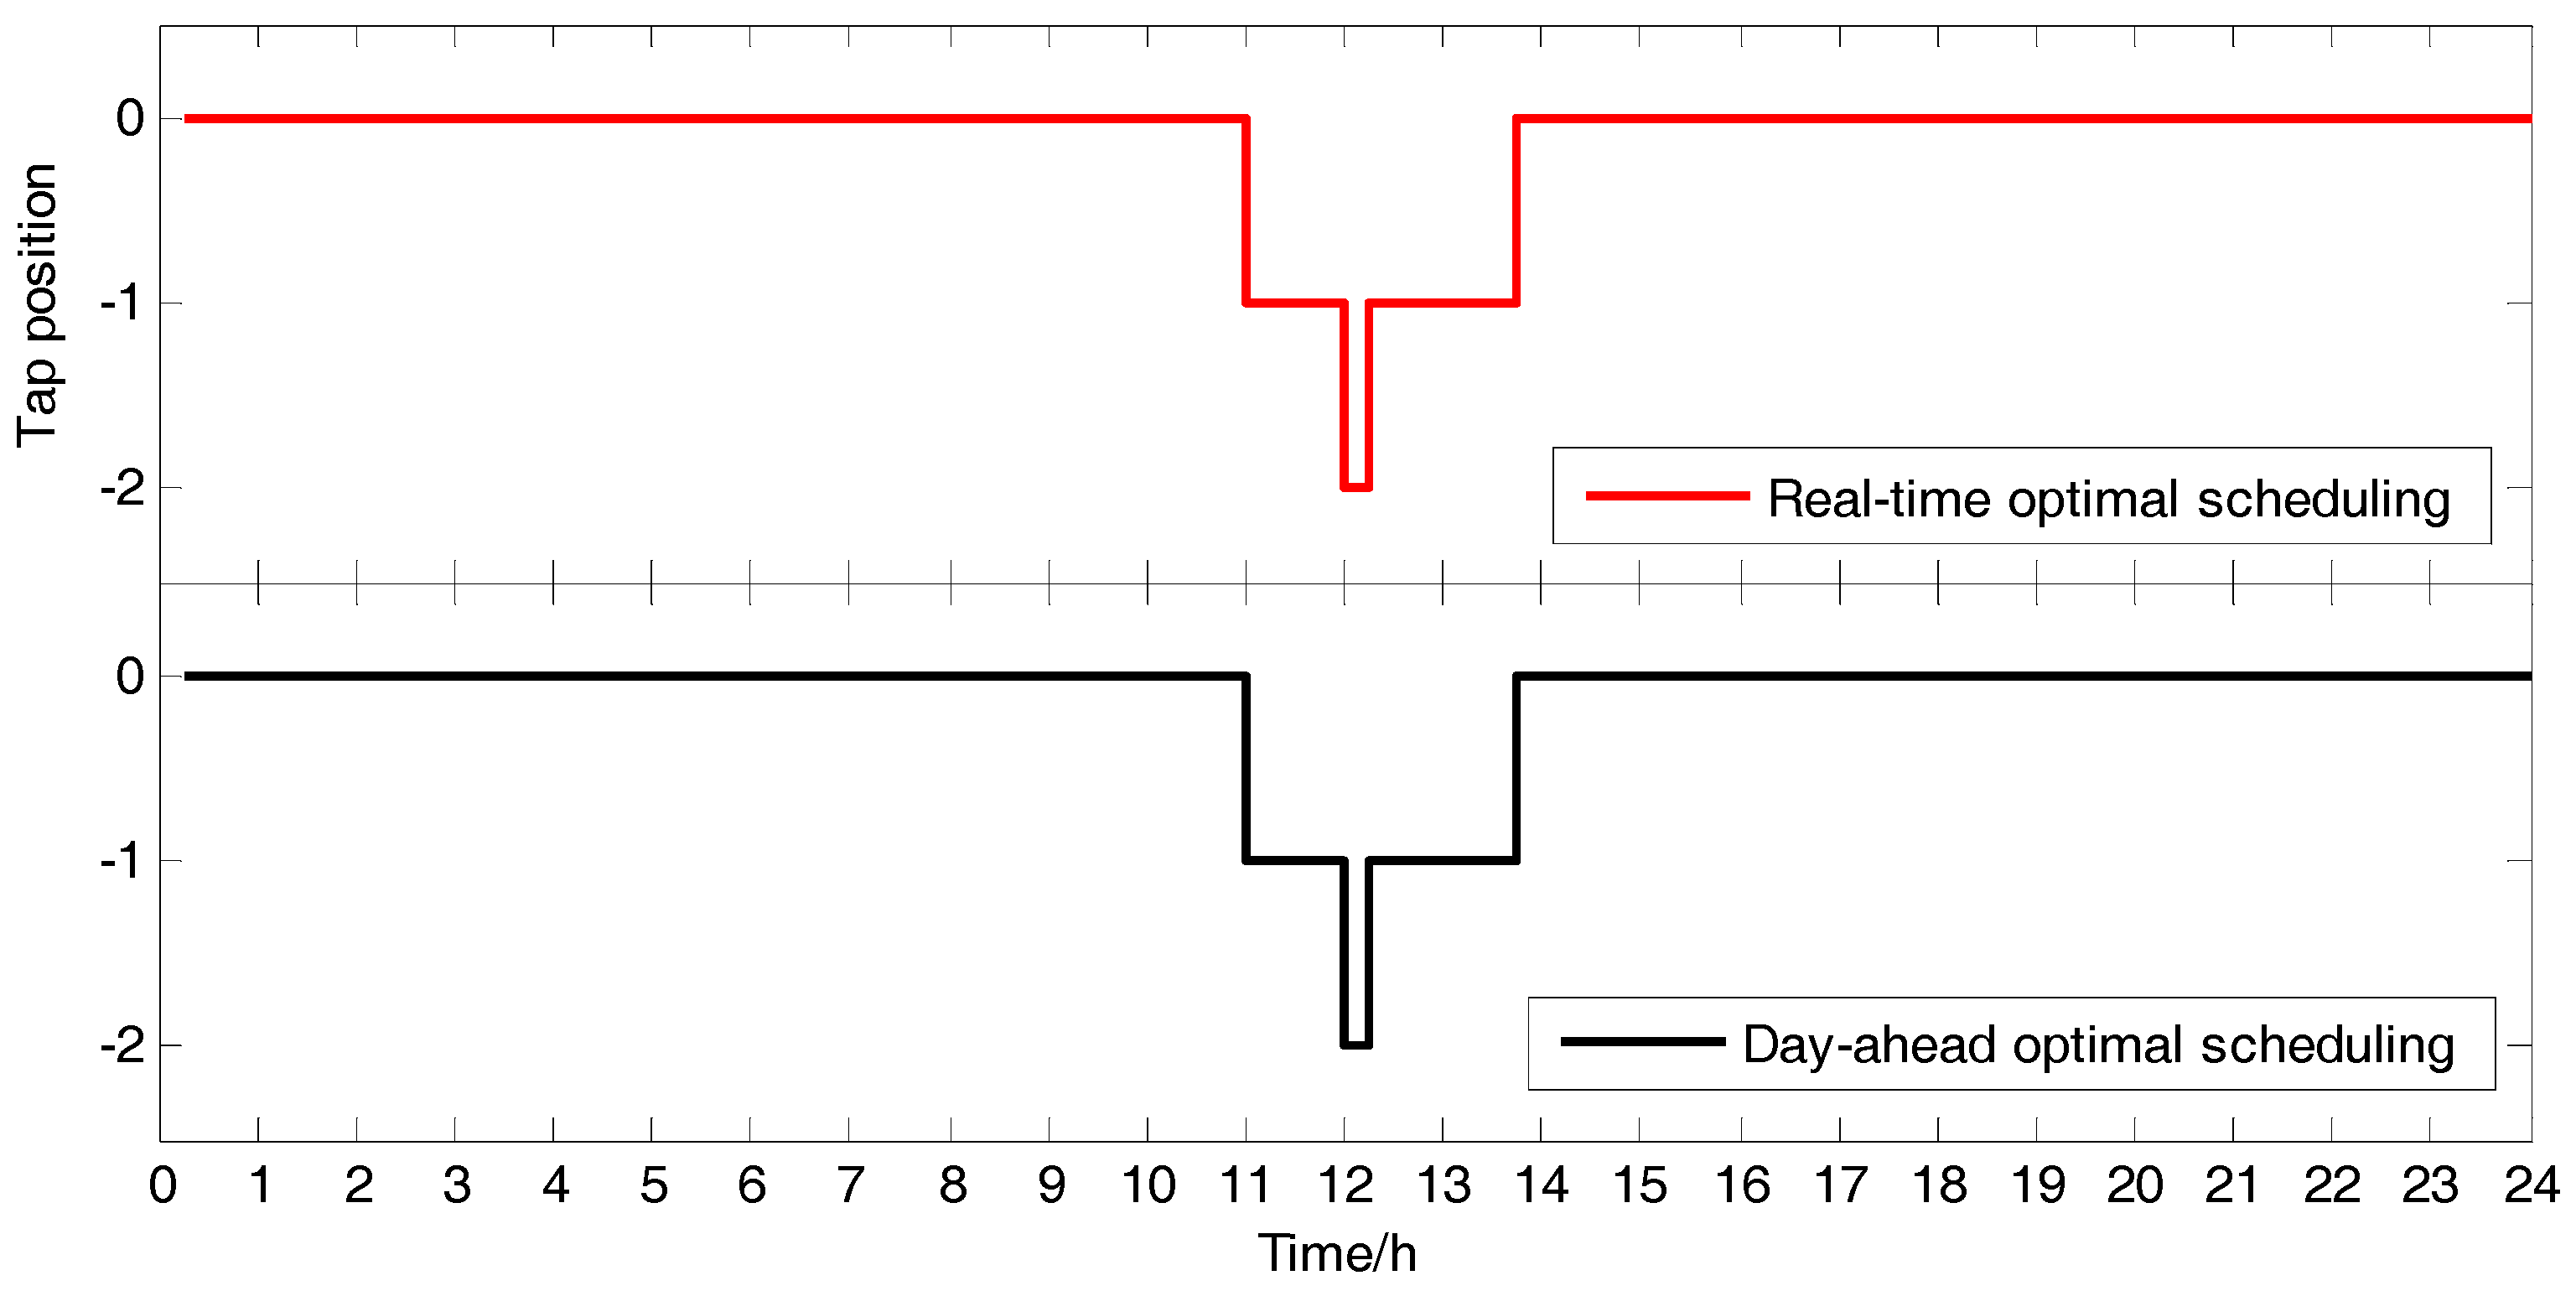
The tap operation given by the two-level voltage control method for LOTC on 16 July 2014 is shown in Figure 9. It can be seen that the real-time tap operation in real-time voltage optimal control is exactly the same as the plan in the day-ahead optimal scheduling, and the real-time level (real-time voltage optimal control) can a minimum deviation from the day-ahead level (day-ahead optimal scheduling), which achieves the economic efficiency of OLTC operation. To illustrate that the proposed method can effectively reduce the number of tap-changes, the method constant set-point control (CSC) [21] is selected as a comparative case. The comparison of OLTC tap-position on 16 July 2014 controlled by the proposed method and CSC are shown in Figure 10.
In Figure 10, the tap-position is changed eight times per day by the CSC, which is the critical value allowed for the constraints. If the greater voltage deviation occurs due to weather conditions in one day, it may cause the total number of tap-changes to exceed the allowable value and shorten the OLTC service life. However, in the proposed method, the OLTC tap-position only changes four times, which effectively reduces the number of tap-changes. Moreover, the total number of tap-changes per day is much less than the maximum allowable value. Thus, the optimization process takes the coordination of the control response time into account, which can regulate the voltage effectively and reduce the number of tap-changes, thereby prolonging the OLTC service life.
The reactive power absorbed by the PV inverter of node 23 in day-ahead optimal scheduling and the final real-time voltage optimal control on 16 July 2014 are shown in Figure 11. In the proposed method, the PV inverters absorbed the reactive power during the periods 11:00~11:30, 12:00~12:15, 12:45~13:00 and 13:30~13:45. Because at these periods, due to the sufficient solar irradiance, the PV output rises immensely, causing overvoltage in the distribution network. In Figure 11, the reactive power absorbed by PV inverters in day-ahead optimal scheduling is larger than that in real-time optimal voltage control during the periods 11:00~11:30 and 12:00~12:15, but the reactive power absorbed by PV inverters in two methods are the same during the periods 12:45~13:00 and 13:30~13:45. Because, during the periods 11:00~11:30 and 12:00~12:15, the forecast value of PVs was larger than the real-time value, the PV output based on the forecasted value is more than that in real-time; if the PV inverters operate by the day-ahead optimal scheduling, the reactive power capacity of PV the inverters is insufficient in real-time, and the voltage cannot be adjusted to a safe operating range. However, during the periods 12:45~13:00 and 13:30~13:45, the forecasted value of the PVs is smaller than the real-time value, and the reactive power capacity of the PV inverters is sufficient in real-time, which will not deviate from the day-ahead optimal scheduling. Therefore, during the periods 12:45~13:00 and 13:30~13:45, the reactive power absorbed by PV inverters in the day-ahead optimal scheduling is same as that in real-time voltage optimal voltage control. The operation of SCs in node 23 under the day-ahead optimal scheduling and the final real-time voltage optimal control on 16 July 2014 are shown in Figure 12. The difference occurs between the two curves during periods 11:00~11:30 and 12:00~12:15. Because the PV output based on the forecasted value is more than that in real-time during these periods, the reactive power capacity of the PV inverters is insufficient in real-time, and thus, some SCs must quit operation.
5.4. Real-Time Voltage Optimal Voltage Control
To illustrate that the real-time optimal voltage control can effectively correct the day-ahead optimal scheduling through modifications and efficiently adjust the node voltage to a safe operating range, the worst voltage of the distribution network at 12:00 on 16 July 2014 is selected to be analysed in this paper. Without any voltage regulation measures, the node voltage at 12:00 on 16 July 2014 is shown in Figure 13. As the solar irradiance reaches the maximum value at 12:00, a power reversal occurs in the distribution network, which causes an increased voltage at each node; the maximum node voltage reaches 1.068 p.u.
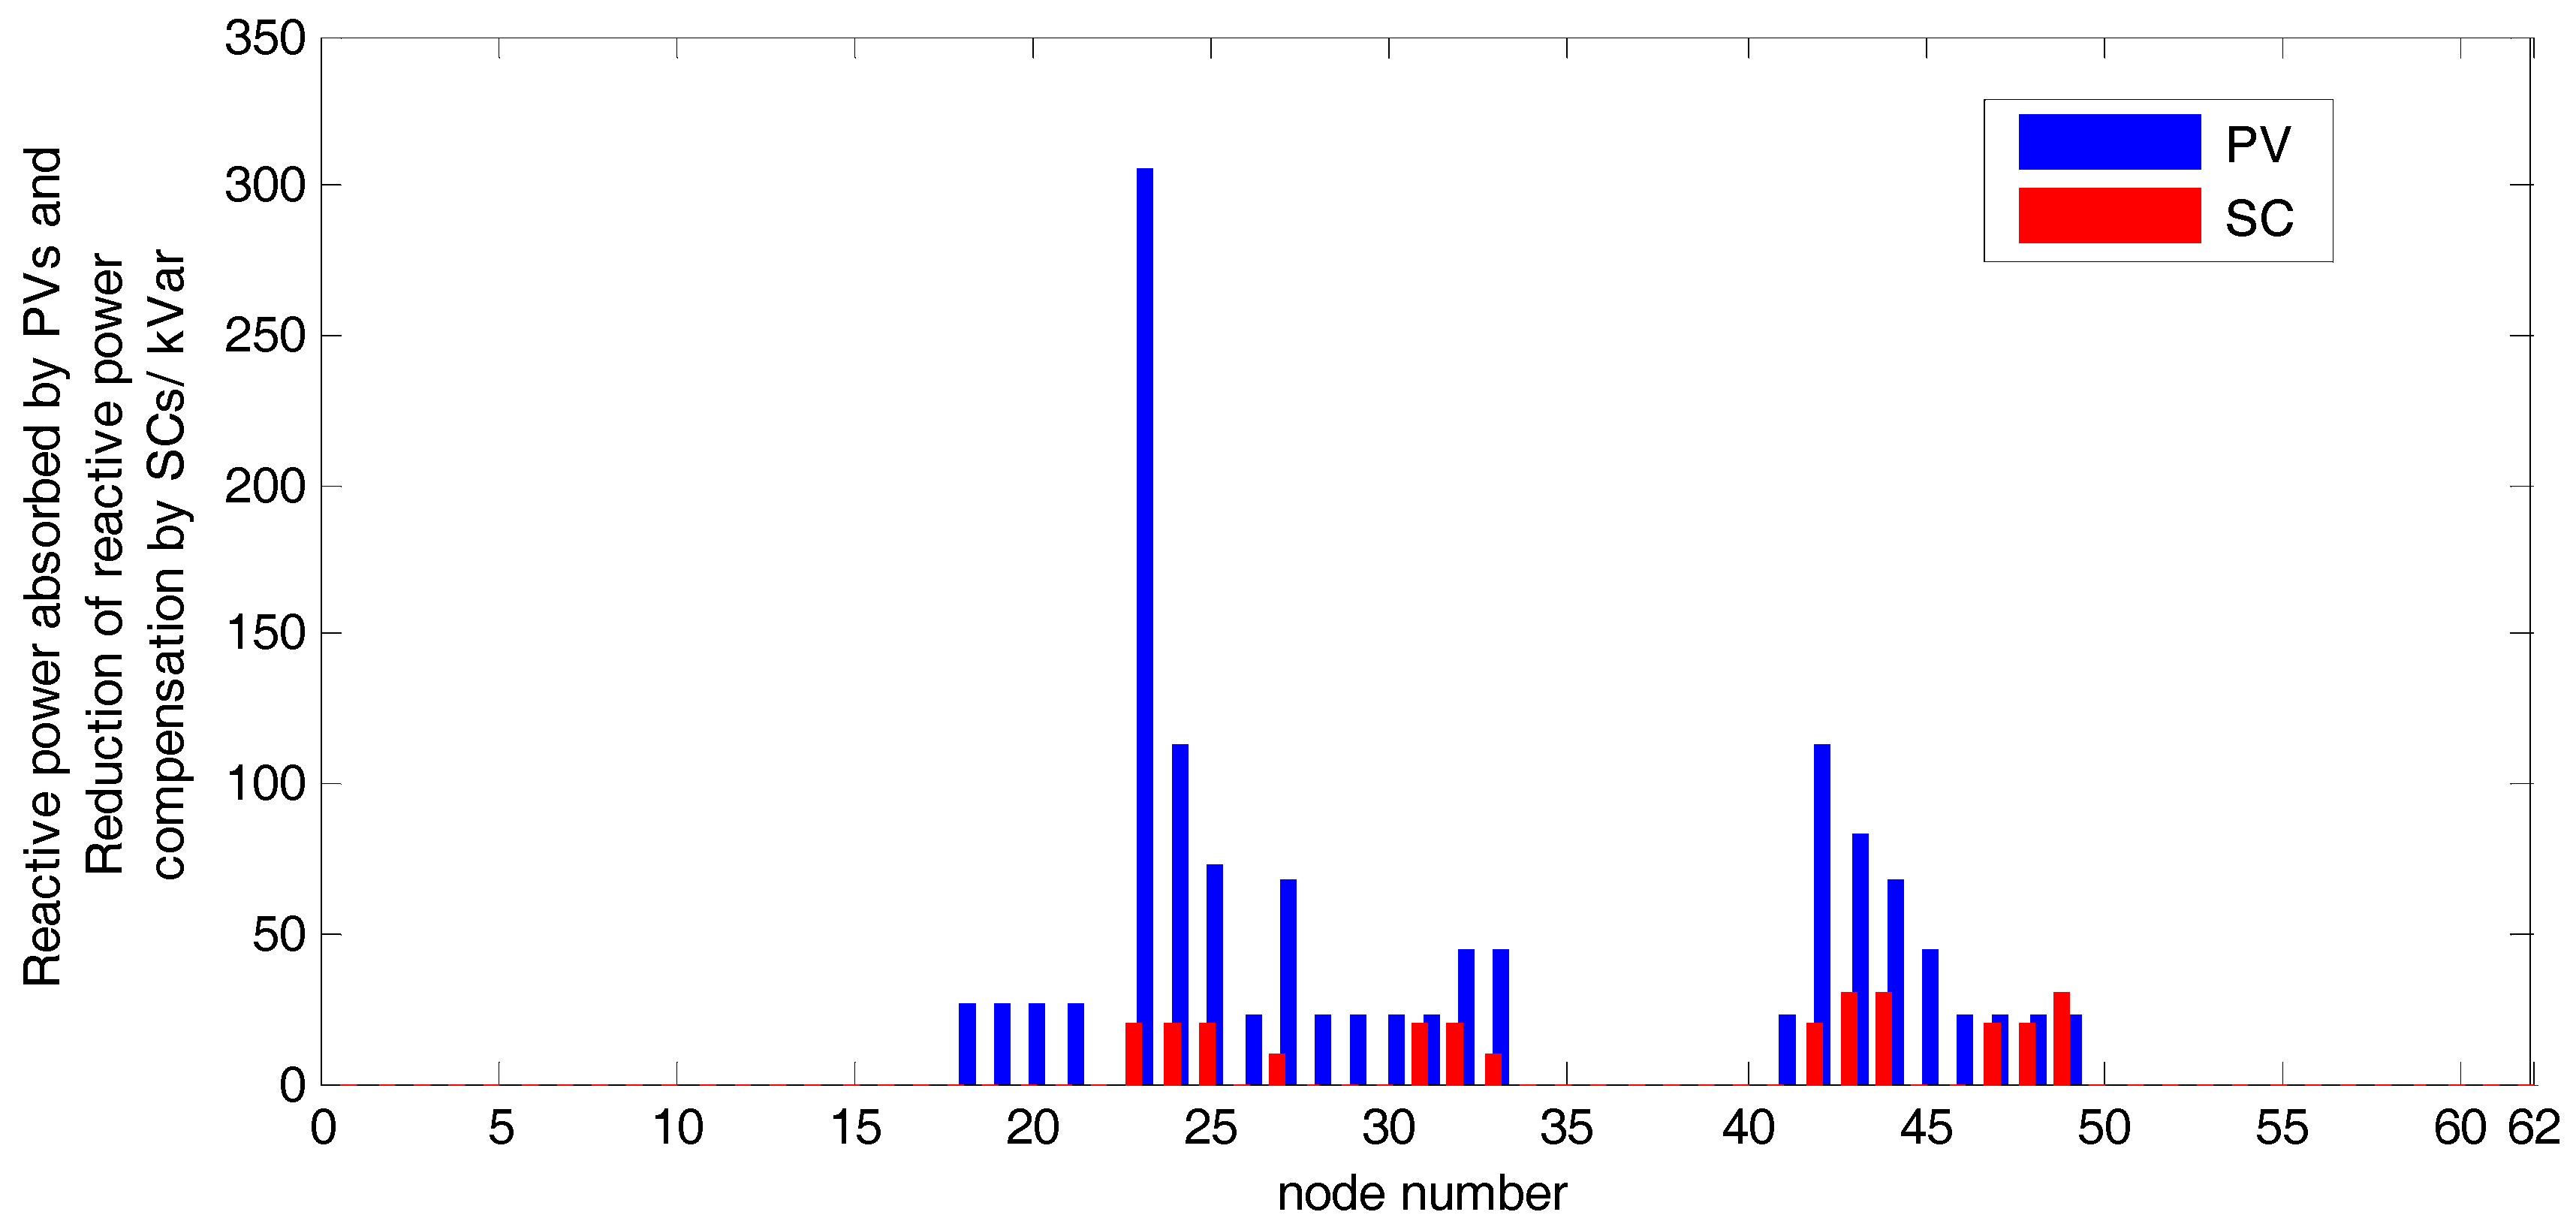
Figure 4 and Figure 13 show that the sub-network set with overvoltage nodes is M{CQ2, CQ3, CQ5}. The node voltages in the other sub-networks (CQ1, CQ4, CQ6 and CQ7) are operating within the safe range. According to the proposed method, the sub-networks CQ2, CQ3, CQ5 are chosen to perform the real-time voltage optimal voltage control. After the voltage regulation for all the selected sub-networks, the reactive power absorbed by PV inverters and reduction of the reactive power compensation due to the SC termination in each node are shown Figure 14. From Figure 4 and Figure 13, overvoltage does not exist in sub-networks CQ1, CQ4, CQ6 and CQ7. Thus, the PV inverters and distributed SCs in CQ1, CQ4, CQ6 and CQ7 continue to operate by the day-ahead optimal scheduling, but because of the existing overvoltage in sub-networks CQ2, CQ3, CQ5, the PV inverters and distributed SCs in these sub-networks must operate by the real-time voltage optimal voltage control.
The voltage profile of the feeder after control by the proposed method is shown in Figure 15. The black dotted line (namely, the base case) represents the voltage profile of the feeder when no PVs access the feeder. The blue line represents the voltage profile of the feeder when all the PVs access the feeder. The red line represents the voltage profile using the proposed voltage control scheme. As shown in this figure, the proposed method can effectively regulate the voltages of the feeder within the acceptable range.
To further illustrate the advantages of the proposed method, this paper sets up two comparison cases: first, at the real-time level, it still adapts the proposed real-time voltage optimal voltage control method, but the OLTC does not participate in the voltage control; second, in the two-level voltage control, day-ahead optimal scheduling and the real-time optimal voltage control are conducted based on centralized control (non-partition). The voltage profile under the three control methods is shown in Figure 16.
Table 2 shows the difference between the first comparison case and the proposed method. Whereas the OLTC does not participate in the voltage regulation, the operation cost of the feeder is much higher. In addition, Figure 16 illustrates that the voltage is not regulated to the specified range under the first comparison method. Therefore, the comparison results demonstrate that the real-time voltage optimal voltage control method at the real-time level, which only relies on zonal control but without the OLTC, cannot complete the voltage regulation for the feeder. However, the real-time voltage optimal voltage control method at the real-time level proposed in this paper not only can effectively regulate the node voltage to the specified range but can also greatly increase the PV hosting capacity for the feeders with high proportion of PVs. In the second comparison case, the two-level voltage control scheme is formulated based on centralized control, which can be regarded as all nodes being assigned to one sub-network. In Figure 16, both of the two-level voltage control schemes based on centralized control and zonal control can regulate the voltage to the specified range, and the voltage profile under the two schemes have the same trend and a similar amplitude.
This finding demonstrates that the proposed scheme has nearly the same control effect as does the centralized control scheme; thus, zonal control is feasible. The reactive power regulated by the PVs and distributed SCs in the second comparison case is shown in Figure 17.
Figure 14 and Figure 17 show that, using the centralized control method, the quantity of PVs involved in the voltage regulation is much greater than that in the zonal control method. Table 3 shows the difference between the second comparison case and the proposed method in this paper.
From the table, with the centralized control method, the total reactive power absorbed by the PVs is 1674 kVar, 11 groups of distributed SCs quit operation, and the system operating cost is 169.41/$. However, with the zonal control method, the total reactive power absorbed by the PVs is 1290 kVar, 27 groups of distributed SCs quit operation, and the system operating cost is 176.15/$. In comparison, the centralized control method is more economical than the zonal control method because the centralized control method provides global optimization for the feeder, but the zonal control method optimized in the selected sub-networks provides local optimization. As shown, the operational costs of the two methods are quite close. Considering the growing proportion of PVs, the cost of zonal control will be further reduced. Therefore, it is acceptable in practical engineering applications.
In voltage control, the magnitude of the voltage is an important index to evaluate the quality of the control. However, with the high proportion of PVs accessing distribution networks, the number of control nodes increases rapidly, and the output of the PV units can be greatly affected by the weather conditions. Considering the requirements of real-time control, the control response time is an important index to evaluate the quality of control. Table 3 shows the control response time under centralized control method l and the zonal control method, and the control response time is obtained in the MATLAB (version 2014a) simulation environment.
Table 3 lists that the control response time under the centralized control method is 30.61 s. However, the control time under the zonal control method is 4.23 s. The main reason is that, when the node voltage is regulated by the centralized control method, all the PVs and SCs are involved in the optimization process, which greatly increases the optimization complexity. By contrast, under the zonal control method, the network partition can divide the nodes into sub-networks, which can reduce the optimization scale for the PVs and distributed SCs from the entire distribution network to the selected sub-networks. When the voltage regulation is performed within the selected sub-networks, the optimization is achieved only among the PVs and SCs within the selected sub-networks, and there is no need to consider the impact of other sub-networks. Consequently, this method can greatly reduce the number of control nodes and simplify the optimization process. With the increasing proportion of PVs, the advantage of the proposed zonal control method will be more obviously promising over the control response time. Thus, compared with centralized control method, the proposed method will be more suitable for voltage control in future distribution network with high proportion of PVs.
The above-described theoretical and empirical analysis reveals that the scheme proposed in this paper can reduce the number of control nodes, simplify the optimization process, and regulate the voltage of the distribution network to the specified range, rapidly and economically; this advantage will be increasingly more obvious as the number of control nodes increases. In addition, the proposed scheme can optimize the number of OLTC tap-changes, prolong the OLTC service life, and increase the PV-hosting capacity of distribution networks with high proportion of PVs. Therefore, the proposed scheme can satisfy the actual engineering requirements and can be applied to the voltage regulation of future distribution networks with high proportion of PVs.
6. Conclusions
As a high proportion of PV units are installed, overvoltage within distribution networks will become serious. Meanwhile, the number of control nodes will grow significantly, and methods based on traditional centralized control will not satisfy the control-response-time requirements. To solve the overvoltage problem caused by a high proportion of PV units, this paper presents a two-level voltage control method with the combination of day-ahead optimal scheduling and real-time optimal control. In the day-ahead level, based on the PV-output and load-demand forecasts, a community detection algorithm using an improved modularity index is introduced to divide the distribution network into clusters; a day-ahead optimal scheduling is created on the basis of network partitioning, and the objective is to minimize the operational costs of the distribution networks. At the real-time level, according to the day-ahead optimal scheduling and network partition of the day-ahead level, a real-time optimal voltage control algorithm is proposed based on the real-time operation data of the distribution networks; the objective is to correct the day-ahead optimal scheduling through modifications. The proposed method not only can optimize the tap operation of an on-load tap changer (OLTC) and improve the accommodation capacity of the distribution network with high proportion of PVs but can also reduce the number of control nodes and simplify the control process to reduce the control response time. Based on this paper, the reliability of voltage control, as well as the uncertainty in forecasting the PV outputs and load demands, will be addressed in future work to improve the PV hosting capacity of distribution networks, thereby promoting the rapid and sustainable development of distributed PV systems in the future.
Acknowledgments
This work was supported by the National Key R&D Program of China (No. 2016YFB0900400) and Project Funded by China Postdoctoral Science Foundation.
Author Contributions
Chuanliang Xiao helped design the study, analyse the data, and write the manuscript. Bo Zhao helped conduct the study and edit the manuscript. Ming Ding helped edit the manuscript. Zhihao Li helped edit the manuscript. Xiaohui Ge helped edit the manuscript.
Conflicts of Interest
The authors declare no conflict of interest.
Nomenclature
| A | weighted adjacency matrix of the network |
| Aij | weighted value of the edge between nodes i and j |
| ki | the sum of all the weighted values of the links connected with node i |
| m | the total edge weight |
| ΔP | the changes in the injections of active power |
| ΔQ | the changes in the injections of reactive power |
| Δδ | the incremental change in phase angle |
| ΔU | the incremental change in voltage magnitude |
| SPU | voltage magnitude sensitivity with respect to active power |
| SQU | voltage magnitude sensitivity with respect to reactive power |
| SPδ | voltage phase angle sensitivity with respect to active power |
| SQδ | voltage phase angle sensitivity with respect to reactive power |
| Qsupplied | the total reactive power supported by the PVs and SCs in the sub-network Ck |
| γ | reactive power balance degree |
| β | intra-partition coupling degree |
| ρ | conventional modularity index |
| ρim | improved modularity index |
| Δvi | the incremental voltage change of node i |
| the reactive-voltage sensitivity of ith PV unit on the ith node in sub-network Ck | |
| Cinstall | the maintenance cost of OLTC |
| NOLTC | the maximum allowable number of OLTC operations without maintenance |
| tapOLTC(t) | tap-position of OLTC at time t |
| tapOLTC(t − 1) | tap-position of OLTC at time t − 1 |
| TapOLTC,min | the lower boundary of the tap-position |
| TapOLTC,max | the upper boundary of the tap-position |
| T_OLTC | the total tap operations within a day |
| TTOmax | the maximum allowable tap operations |
| cPV | the compensation factor of inverter losses due to the reactive power utilization |
| CK | the Kth sub-network |
| nPV | the numbers of PVs within CK |
| QPV,n(t) | the absorbed/injected value of utilized reactive power from a PV inverter in node n at the time t |
| Qmax,n | maximum reactive power capacity of the PV inverter in node n |
| PPV,n | the active power of each PV inverter in node n at time t |
| LSC | the maintenance cost caused by the SC tap-changing |
| SSC | the capacity of one group SC |
| QSC,n(t) | reactive power regulated by SC in node n at time t |
| QSC,n(t − 1) | reactive power regulated by SC in node n at time t − 1 |
| cLOSS | the grid loss compensation cost |
| Iline,n(t) | the current of line n at time t |
| Zline,n | impedance of line n |
| PGi | active power generated by conventional generators |
| QGi | reactive power generated by conventional generators |
| PPVi | the active power generated by PV units |
| QPVi | the reactive power generated by PV units |
| PDi | active power demand of loads |
| QDi | reactive power demand of loads |
| Vi | the voltage magnitudes of node i |
| Bij | susceptance of the branch consisting of nodes i and j |
| Gij | conductance of the branch consisting of nodes i and j |
| θij | the phase difference of node i and node j |
| QSC,i | reactive power generated by distributed SCs |
| d | index of generations |
| xd | the positions of the particles at the dth generation |
| xd+1 | the positions of the particles at the d+1th generation |
| vd | corresponding velocities of the particles of the dth generation |
| vd+1 | corresponding velocities of the particles of the d + 1th generation |
| c0 | the inertia weight factor |
| c1, c2 | the acceleration constants |
| gi,t | current position of the particle i in these particles at iteration t. |
| (t) | Tap-position of OLTC at time t in real-time optimal control |
| (t) | Tap-position of OLTC at time t in day-ahead optimal scheduling |
| (t) | reactive power regulated by a PV inverter in node n at the time t in real-time optimal control |
| (t) | reactive power regulated by a PV inverter in node n at the time t in day-ahead optimal scheduling |
| (t) | reactive power regulated by SC in node n at time t in real-time optimal control |
| (t) | reactive power regulated by SC in node n at time t in day-ahead optimal scheduling |
Appendix A

Table A1.
Detailed line parameters.
| From | To | Line Impedance (Ω/km) | Line Type | Length (km) |
|---|---|---|---|---|
| 1 | 2 | 0.0754 + j0.085 | DL-300 | 0.92 |
| 1 | 3 | 0.0754 + j0.085 | DL-300 | 0.86 |
| 1 | 4 | 0.0754 + j0.085 | DL-300 | 0.89 |
| 2 | 5 | 0.32 + j0.119 | JKLY-70 | 0.05 |
| 5 | 6 | 0.32 + j0.119 | JKLY-70 | 0.14 |
| 6 | 7 | 0.32 + j0.119 | JKLY-70 | 0.25 |
| 7 | 8 | 0.32 + j0.119 | JKLY-70 | 0.12 |
| 5 | 9 | 0.32 + j0.119 | JKLY-70 | 0.23 |
| 9 | 10 | 0.32 + j0.119 | JKLY-70 | 0.12 |
| 10 | 11 | 0.32 + j0.119 | JKLY-70 | 0.14 |
| 11 | 12 | 0.32 + j0.119 | JKLY-70 | 0.21 |
| 12 | 13 | 0.32 + j0.119 | JKLY-70 | 0.19 |
| 13 | 14 | 0.32 + j0.119 | JKLY-70 | 0.24 |
| 9 | 15 | 0.32 + j0.119 | JKLY-70 | 1.12 |
| 15 | 16 | 0.32 + j0.119 | JKLY-70 | 0.23 |
| 16 | 17 | 0.32 + j0.119 | JKLY-70 | 0.21 |
| 17 | 18 | 0.32 + j0.119 | JKLY-70 | 0.19 |
| 18 | 19 | 0.32 + j0.119 | JKLY-70 | 0.09 |
| 19 | 20 | 0.32 + j0.119 | JKLY-70 | 0.11 |
| 20 | 21 | 0.32 + j0.119 | JKLY-70 | 0.15 |
| 15 | 22 | 0.32 + j0.119 | JKLY-70 | 1.33 |
| 22 | 23 | 0.32 + j0.119 | JKLY-70 | 0.34 |
| 23 | 24 | 0.32 + j0.119 | JKLY-70 | 0.23 |
| 24 | 25 | 0.32 + j0.119 | JKLY-70 | 0.13 |
| 25 | 26 | 0.32 + j0.119 | JKLY-70 | 0.07 |
| 26 | 27 | 0.32 + j0.119 | JKLY-70 | 0.12 |
| 27 | 28 | 0.32 + j0.119 | JKLY-70 | 0.13 |
| 28 | 29 | 0.32 + j0.119 | JKLY-70 | 0.06 |
| 26 | 30 | 0.32 + j0.119 | JKLY-70 | 0.12 |
| 30 | 31 | 0.32 + j0.119 | JKLY-70 | 0.18 |
| 30 | 31 | 0.32 + j0.119 | JKLY-70 | 0.34 |
| 34 | 32 | 0.32 + j0.119 | JKLY-70 | 0.23 |
| 32 | 33 | 0.32 + j0.119 | JKLY-70 | 0.21 |
| 3 | 34 | 0.099 + j0.093 | JKLY-185 | 0.05 |
| 34 | 35 | 0.099 + j0.093 | JKLY-185 | 0.34 |
| 35 | 36 | 0.099 + j0.093 | JKLY-185 | 0.23 |
| 36 | 37 | 0.099 + j0.093 | JKLY-185 | 0.31 |
| 37 | 38 | 0.099 + j0.093 | JKLY-185 | 0.22 |
| 38 | 39 | 0.099 + j0.093 | JKLY-185 | 0.12 |
| 39 | 40 | 0.099 + j0.093 | JKLY-185 | 0.19 |
| 40 | 41 | 0.099 + j0.093 | JKLY-185 | 1.12 |
| 41 | 42 | 0.099 + j0.093 | JKLY-185 | 0.35 |
| 42 | 43 | 0.099 + j0.093 | JKLY-185 | 0.34 |
| 43 | 44 | 0.099 + j0.093 | JKLY-185 | 0.18 |
| 44 | 45 | 0.099 + j0.093 | JKLY-185 | 0.13 |
| 45 | 46 | 0.099 + j0.093 | JKLY-185 | 0.25 |
| 46 | 47 | 0.099 + j0.093 | JKLY-185 | 0.24 |
| 47 | 48 | 0.099 + j0.093 | JKLY-185 | 0.16 |
| 48 | 49 | 0.099 + j0.093 | JKLY-185 | 0.32 |
| 4 | 50 | 0.32 + j0.119 | JKLY-70 | 0.06 |
| 50 | 51 | 0.32 + j0.119 | JKLY-70 | 0.32 |
| 51 | 52 | 0.32 + j0.119 | JKLY-70 | 0.28 |
| 52 | 53 | 0.32 + j0.119 | JKLY-70 | 0.26 |
| 53 | 54 | 0.32 + j0.119 | JKLY-70 | 0.29 |
| 54 | 55 | 0.32 + j0.119 | JKLY-70 | 1.03 |
| 55 | 56 | 0.32 + j0.119 | JKLY-70 | 0.12 |
| 56 | 57 | 0.32 + j0.119 | JKLY-70 | 0.09 |
| 57 | 58 | 0.32 + j0.119 | JKLY-70 | 0.23 |
| 58 | 59 | 0.32 + j0.119 | JKLY-70 | 0.36 |
| 59 | 60 | 0.32 + j0.119 | JKLY-70 | 0.34 |
| 60 | 61 | 0.32 + j0.119 | JKLY-70 | 0.28 |
| 61 | 62 | 0.32 + j0.119 | JKLY-70 | 0.22 |
Table A2.
Load parameters.
| Bus No. | Load (kW + j kVar) | Bus No. | Load (kW + j kVar) |
|---|---|---|---|
| 1 | 0 | 32 | 100.784 + j15.001 |
| 2 | 20.008 + j6.423 | 33 | 50.147 + j15.331 |
| 3 | 32.112 + j5.221 | 34 | 10.334 + j0.356 |
| 4 | 24.445 + j6.889 | 35 | 1212.768 + j223.489 |
| 5 | 14.565 + j11.235 | 36 | 1222.636 + j343.321 |
| 6 | 1345.55 + j460.228 | 37 | 338.492 + j27.128 |
| 7 | 24.142 + j4.421 | 38 | 121.464 + j22.788 |
| 8 | 353.018 + j96.561 | 39 | 126.418 + j32.336 |
| 9 | 18.334 + j5.214 | 40 | 314.048 + j23.834 |
| 10 | 591.154 + j140.336 | 41 | 119.422 + j22.218 |
| 11 | 542.785 + j175.564 | 42 | 154.296 + j36.647 |
| 12 | 260.592 + j23.833 | 43 | 260.592 + j30.833 |
| 13 | 152.645 + j30.001 | 44 | 699.356 + j75.389 |
| 14 | 150.088 + j50.362 | 45 | 129.378 + j78.331 |
| 15 | 14.332 + j4.365 | 46 | 299.663 + j65.227 |
| 16 | 111.506 + j10.369 | 47 | 599.153 + j25.233 |
| 17 | 100.587 + j63.245 | 48 | 552.632 + j85.336 |
| 18 | 110.114 + j10.336 | 49 | 541.088 + j120.333 |
| 19 | 90.223 + j36.102 | 50 | 30.231 + j12.244 |
| 20 | 110.004 + j42.331 | 51 | 1117.921 + j332.145 |
| 21 | 100.753 + j14.557 | 52 | 1197.551 + j351.214 |
| 22 | 6.331 + j1.254 | 53 | 1307.672 + j110.221 |
| 23 | 426.991+ j85.933 | 54 | 116.778 +j22.214 |
| 24 | 622.155+ j120.383 | 55 | 120.345 + j56.333 |
| 25 | 738.499 + j145.361 | 56 | 117.672 + j42.351 |
| 26 | 12.366 + j2.366 | 57 | 100.447 + j10.236 |
| 27 | 110.568 + j36.688 | 58 | 325.661 + j145.361 |
| 28 | 100.888 + j34.444 | 59 | 101.352 + j31.224 |
| 29 | 200.963 + j80.382 | 60 | 100.398 + j45.14 |
| 30 | 103.224 + j36.225 | 61 | 114.872 + j32.331 |
| 31 | 100.355 + j15.253 | 62 | 500.231 + j112.454 |
References
- Hosenuzzaman, M.; Rahim, N.A.; Selvaraj, J.; Hasanuzzaman, M.; Malek, A.B.M.A.; Nahar, A. Global prospects, progress, policies, and environmental impact of solar photovoltaic power generation. Renew. Sustain. Energy Rev. 2015, 41, 284–297. [Google Scholar] [CrossRef]
- Saponara, S.; Fanucci, L.; Bernardo, F.; Falciani, A. Predictive Diagnosis of High-Power Transformer Faults by Networking Vibration Measuring Nodes with Integrated Signal Processing. IEEE Trans. Instrum. Meas. 2016, 65, 1749–1760. [Google Scholar] [CrossRef]
- Lee, J.H. Model predictive control: Review of the three decades of development. Int. J. Control Autom. Syst. 2011, 9, 415. [Google Scholar] [CrossRef]
- Saponara, S.; Bacchillone, T. Network Architecture, Security Issues, and Hardware Implementation of a Home Area Network for Smart Grid. J. Comput. Netw. Commun. 2012, 2012, 285–293. [Google Scholar] [CrossRef]
- Mcdaniel, P.; Mclaughlin, S. Security and Privacy Challenges in the Smart Grid. IEEE Secur. Priv. 2009, 7, 75–77. [Google Scholar] [CrossRef]
- Ding, M.; Wang, W.; Wang, X.; Song, Y.; Chen, D.; Sun, M. A Review on the Effect of Large-scale PV Generation on Power Systems. Proc. CSEE 2014, 34, 1–14. [Google Scholar]
- Kekatos, V.; Wang, G.; Conejo, A.J.; Giannakis, G.B. Stochastic reactive power management in microgrids with renewables. IEEE Trans. Power Syst. 2014, 30, 3386–3395. [Google Scholar] [CrossRef]
- Smith, J.W.; Sunderman, W.; Dugan, R.; Seal, B. Smart inverter volt/var control functions for high penetration of PV on distribution systems. In Proceedings of the IEEE/PES Power Systems Conference and Exposition (PSCE), Phoenix, AZ, USA, 20–23 March 2011; pp. 1–6. [Google Scholar]
- Alyami, S.; Wang, Y.; Wang, C.; Zhao, J. Adaptive Real Power Capping Method for Fair Overvoltage Regulation of Distribution Networks With High Penetration of PV Systems. IEEE Trans. Smart Grid 2014, 5, 2729–2738. [Google Scholar] [CrossRef]
- Jahangiri, P.; Aliprantis, D.C. Distributed volt/var control by PV inverters. IEEE Trans. Power Syst. 2013, 28, 3429–3439. [Google Scholar] [CrossRef]
- Dall’Anese, E.; Dhople, S.V.; Giannakis, G.B. Optimal dispatch of photovoltaic inverters in residential distribution systems. IEEE Trans. Sustain. Energy 2014, 5, 487–497. [Google Scholar] [CrossRef]
- Efkarpidis, N.; Rybel, T.D.; Driesen, J. Optimization control scheme utilizing small-scale distributed generators and OLTC distribution transformers. Sustain. Energy Grids Netw. 2016, 8, 74–84. [Google Scholar] [CrossRef]
- Yang, H.T.; Chen, Y.T.; Liao, J.T.; Yang, C.-T. Over-voltage mitigation control strategies for distribution system with high PV penetration. In Proceedings of the IEEE, International Conference on Intelligent System Application to Power Systems, Porto, Portugal, 11–16 September 2015. [Google Scholar]
- Biserica, M.; Foggia, G.; Chanzy, E.; Passelergue, J.C. Network partition for coordinated control in active distribution networks. In Proceedings of the IEEE Powertech, Grenoble, France, 16–20 June 2013. [Google Scholar]
- Xu, Y.; Jiang, W.; Cheng, X. Partitioning for reactive voltage based on spectral clustering and pilot nodes selection. Power Syst. Prot. Control 2016, 44, 73–78. [Google Scholar]
- Hu, Z.; Wang, X.; Wang, X.; Chen, H. A Two-Layered Network Partitioning Approach for Optimal Reactive Power Dispatching. Power Syst. Technol. 2004, 28, 37–41. [Google Scholar]
- Wei, Z.; Liu, J.; Cheng, F.; Song, Q.; Deng, J.; Chen, X. Fast powernetwork partitioning method in Mvar control space based on community wining. Proc. CSEE 2011, 31, 166–172. [Google Scholar]
- Long, C.; Procopiou, A.T.; Ochoa, L.F.; Bryson, G.; Randles, D. Performance of OLTC-based control strategies for LV networks with photovoltaics. In Proceedings of the IEEE Power & Energy Society General Meeting, Denver, CO, USA, 26–30 July 2015; pp. 1–5. [Google Scholar]
- Chen, Y.; Strothers, M.; Benigni, A. Day-ahead optimal scheduling of PV inverters and OLTC in distribution feeders. In Proceedings of the IEEE Power and Energy Society General Meeting, Boston, MA, USA, 17–21 July 2016; pp. 1–5. [Google Scholar]
- Gao, C. Voltage Control in Distribution Networks Using On-Load Tap Changer Transformers. Ph.D. Thesis, University of Bath, Bath, UK, 2013. [Google Scholar]
- Long, C.; Ochoa, L.F. Voltage Control of PV-Rich LV Networks: OLTC-Fitted Transformer and Capacitor Banks. IEEE Trans. Power Syst. 2015, 31, 4016–4025. [Google Scholar] [CrossRef]
- Agalgaonkar, Y.P.; Pal, B.C.; Jabr, R.A. Distribution Voltage Control Considering the Impact of PV Generation on Tap Changers and Autonomous Regulators. IEEE Trans. Power Syst. 2013, 29, 182–192. [Google Scholar] [CrossRef] [Green Version]
- Wang, Z.; Chen, H.; Wang, J.; Begovic, M. Inverter-Less Hybrid Voltage/Var Control for Distribution Circuits with Photovoltaic Generators. IEEE Trans. Smart Grid 2014, 5, 2718–2728. [Google Scholar] [CrossRef]
- Girvan, M.; Newman, M.E.J. Community structure in social and biological networks. Proc. Natl. Acad. Sci. USA 2002, 99, 7821–7826. [Google Scholar] [CrossRef] [PubMed]
- Newman, M.E.J. Fast algorithm for detecting community structure in networks. Phys. Rev. E 2004, 69, 066133. [Google Scholar] [CrossRef] [PubMed]
- Newman, M.E.J.; Girvan, M. Finding and evaluating community structure in networks. Phys. Rev. E 2004, 69, 026113. [Google Scholar] [CrossRef] [PubMed]
- Zeng, L.; Wang, L. Maximum penetration of DG based on voltage sensitivity. East China Electr. Power 2013, 41, 1175–1180. [Google Scholar]
- Oshiro, M.; Tanaka, K.; Senjyu, T.; Toma, S.; Yona, A.; Saber, A.Y.; Funabashi, T.; Kim, C.-H. Optimal voltage control in distribution systems using PV generators. Int. J. Electr. Power Energy Syst. 2011, 33, 485–492. [Google Scholar] [CrossRef]
- Zhao, B.; Guo, C.X.; Cao, Y.J. Improved particle swam optimization algorithm for OPF problems. In Proceedings of the Power Systems Conference and Exposition, New York, NY, USA, 10–13 October 2004; pp. 233–238. [Google Scholar]
- Zhao, B.; Guo, C.X.; Cao, Y.J. An improved particle swarm optimization algorithm for optimal reactive power dispatch. In Proceedings of the IEEE Power Engineering Society General Meeting, San Francisco, CA, USA, 16 June 2005; pp. 272–279. [Google Scholar]
Figure 1.
Reactive power output bounds of PV inverter.
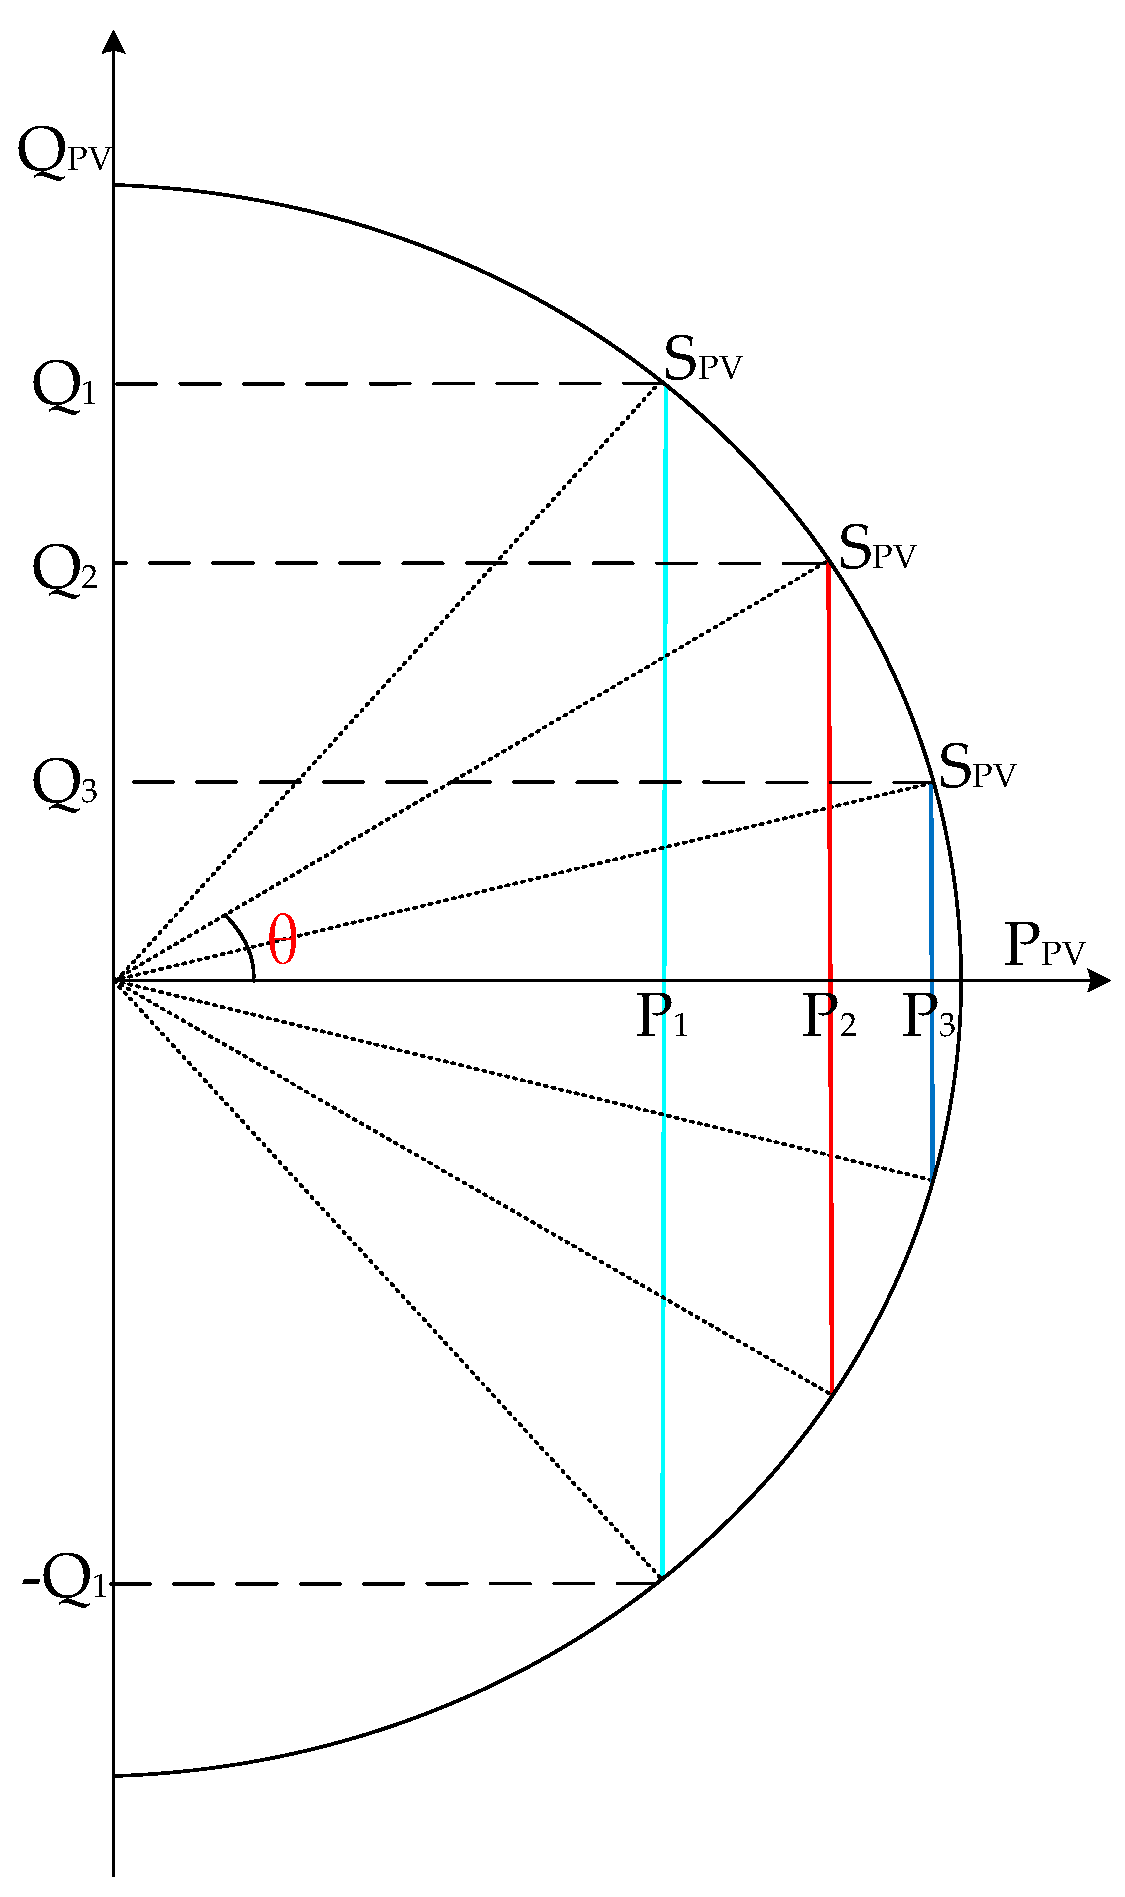
Figure 2.
Network partition and process of voltage control.

Figure 3.
Flowchart of the proposed voltage control.

Figure 4.
Topology of the real feeder under study.
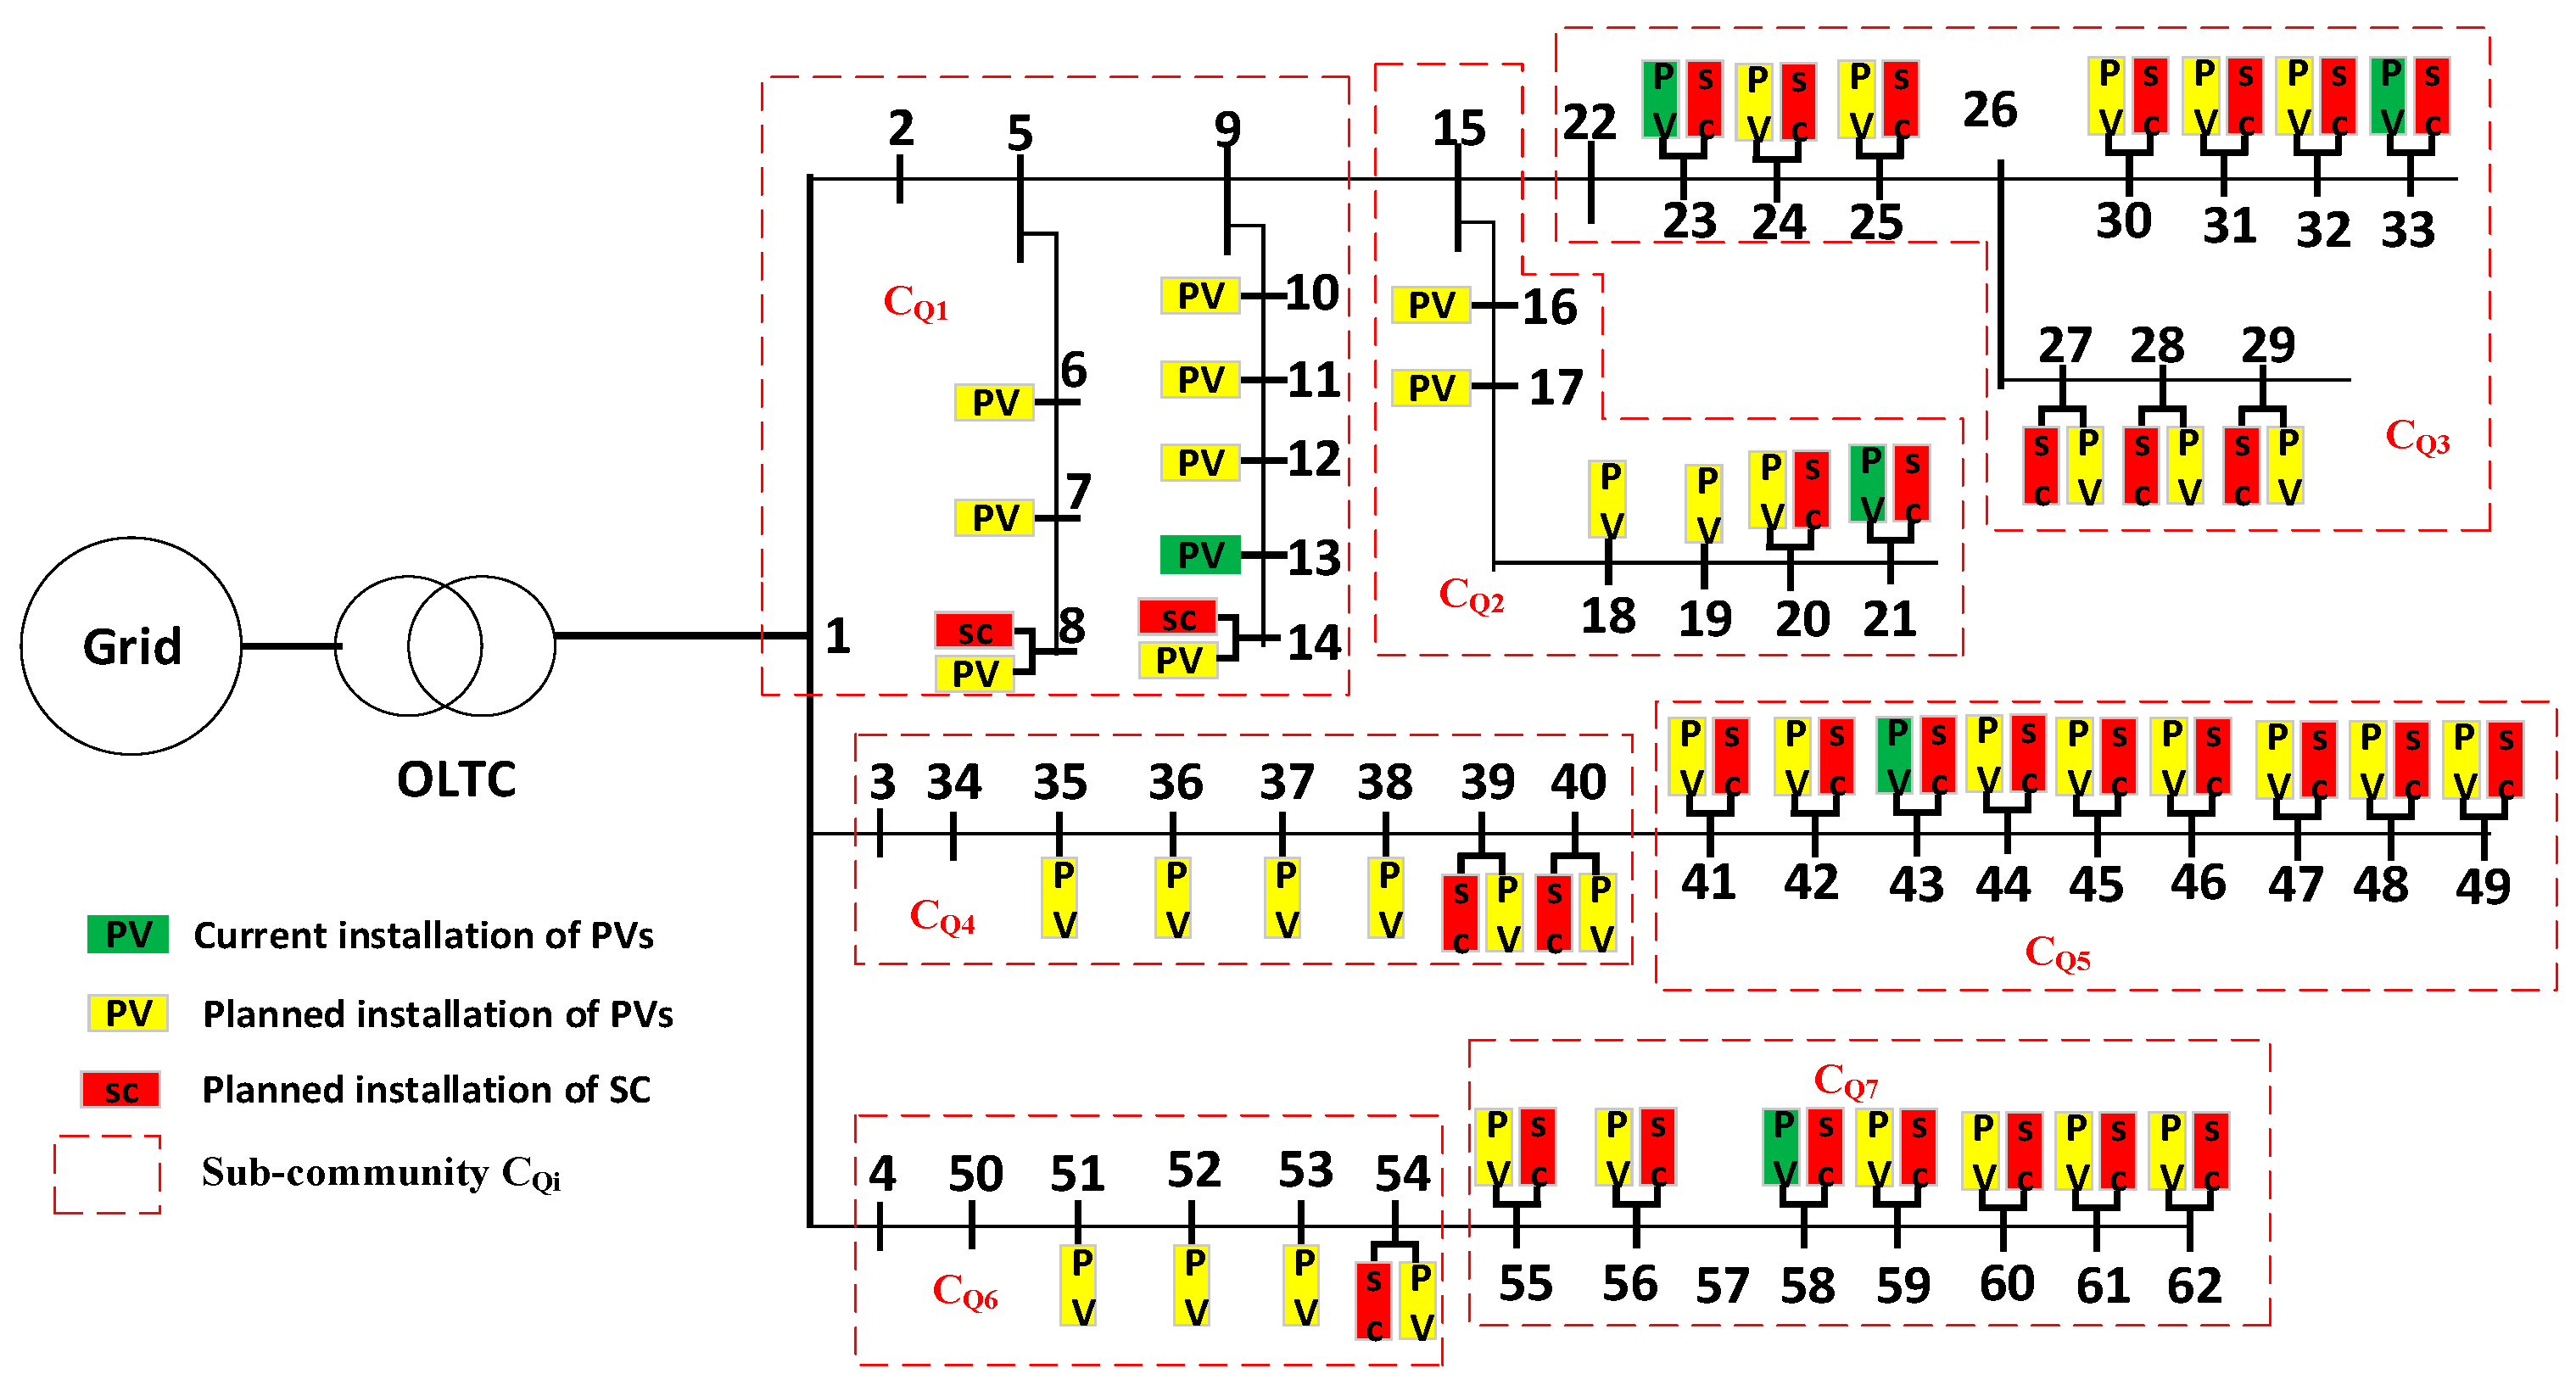
Figure 5.
Current and planned PV installations in the distribution network.
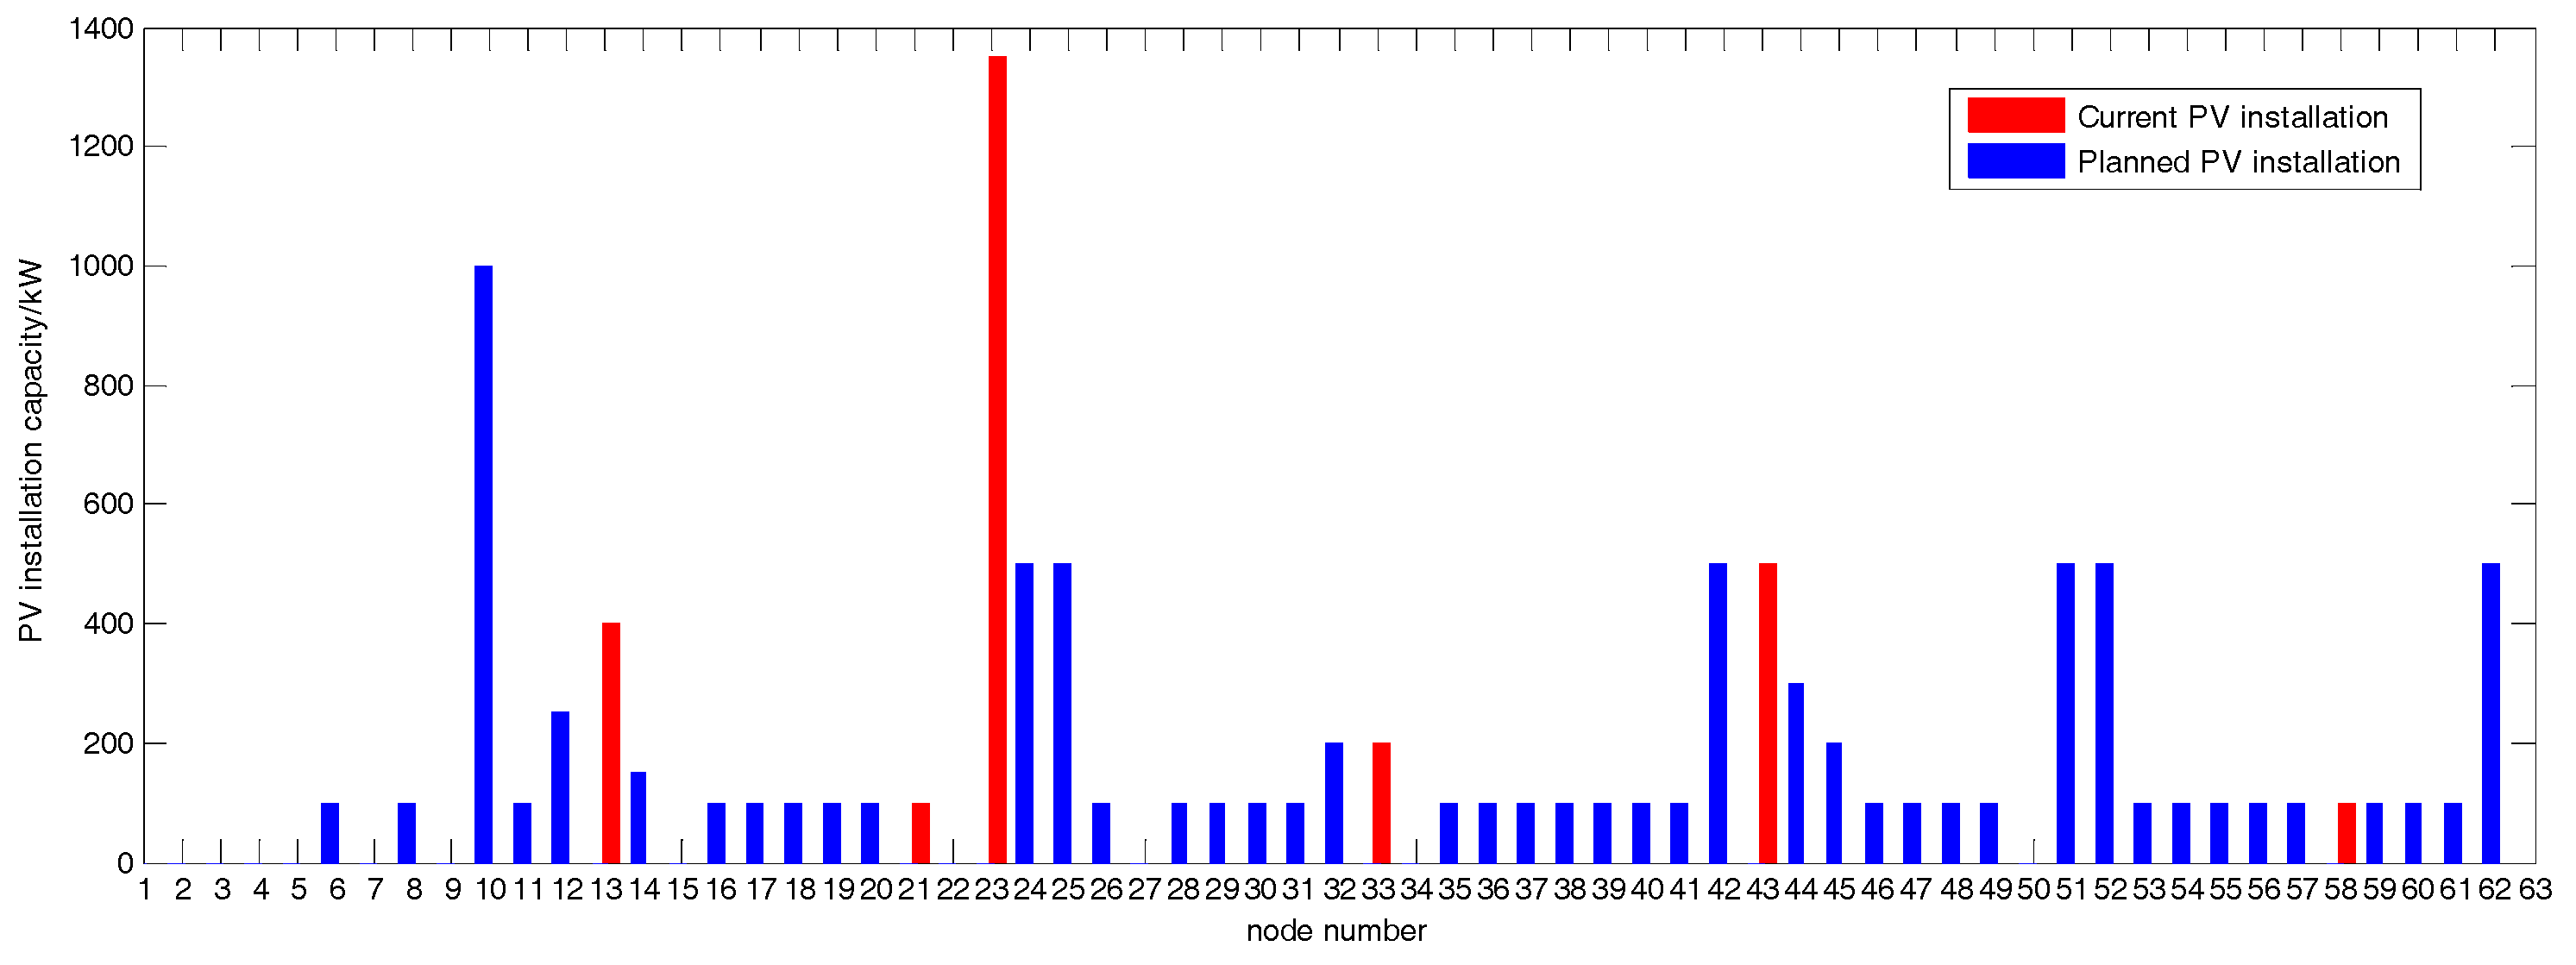
Figure 6.
Primary side voltage of the on-load tap changer (OLTC).
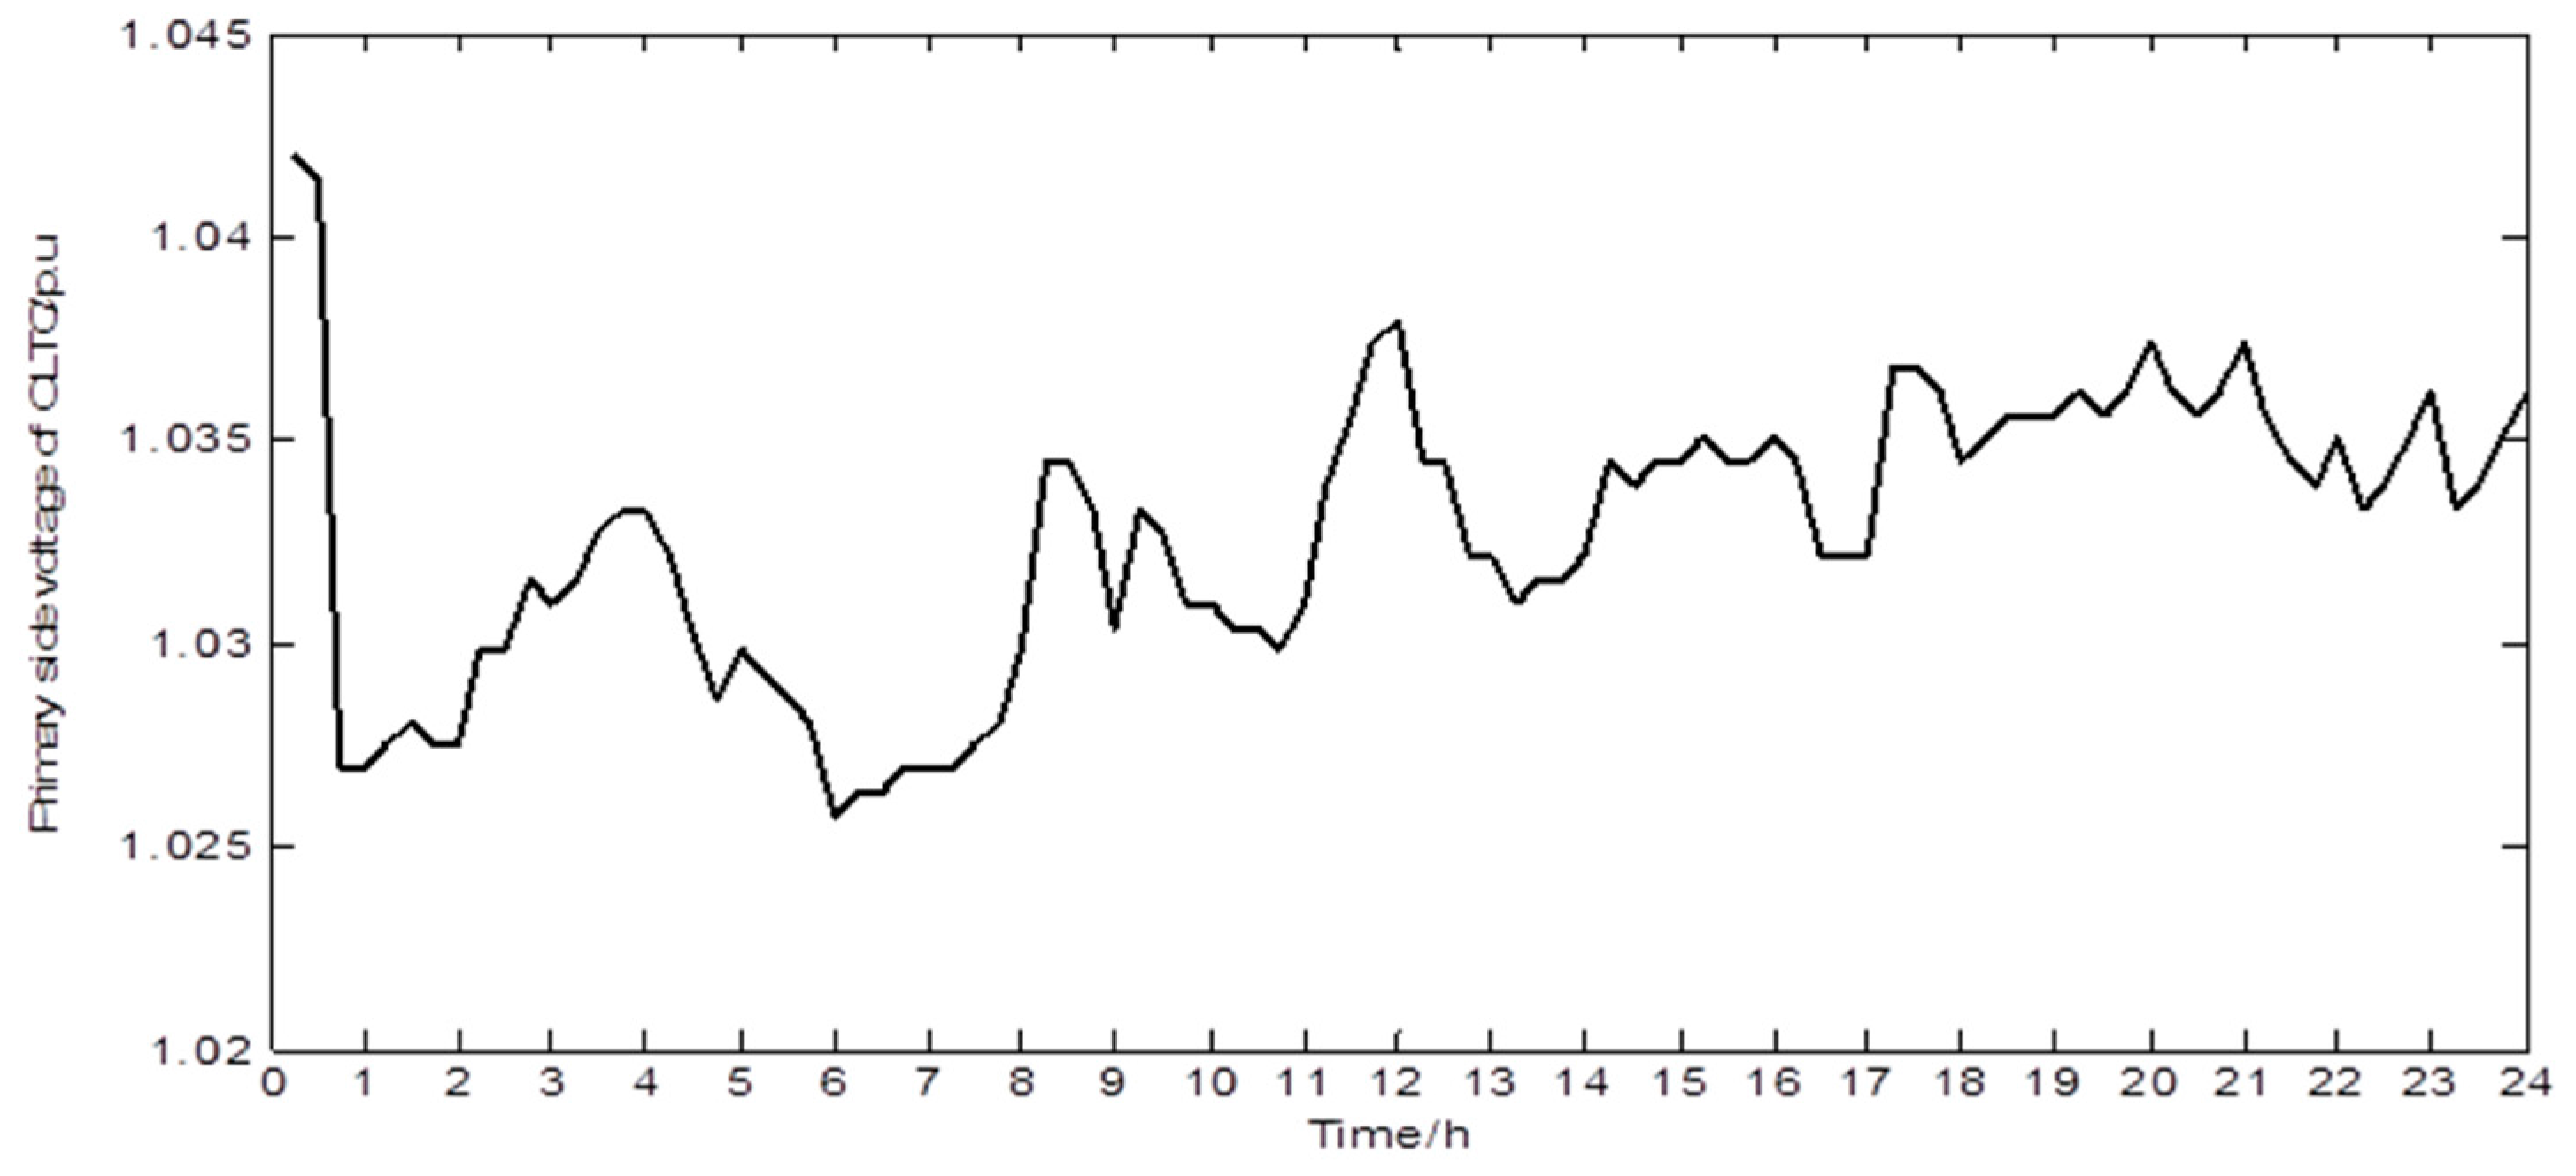
Figure 7.
Solar irradiance and load profiles of 16 July 2014: (a) Forecasted and real-time solar irradiance; (b) Forecasting load demand.
Figure 7.
Solar irradiance and load profiles of 16 July 2014: (a) Forecasted and real-time solar irradiance; (b) Forecasting load demand.
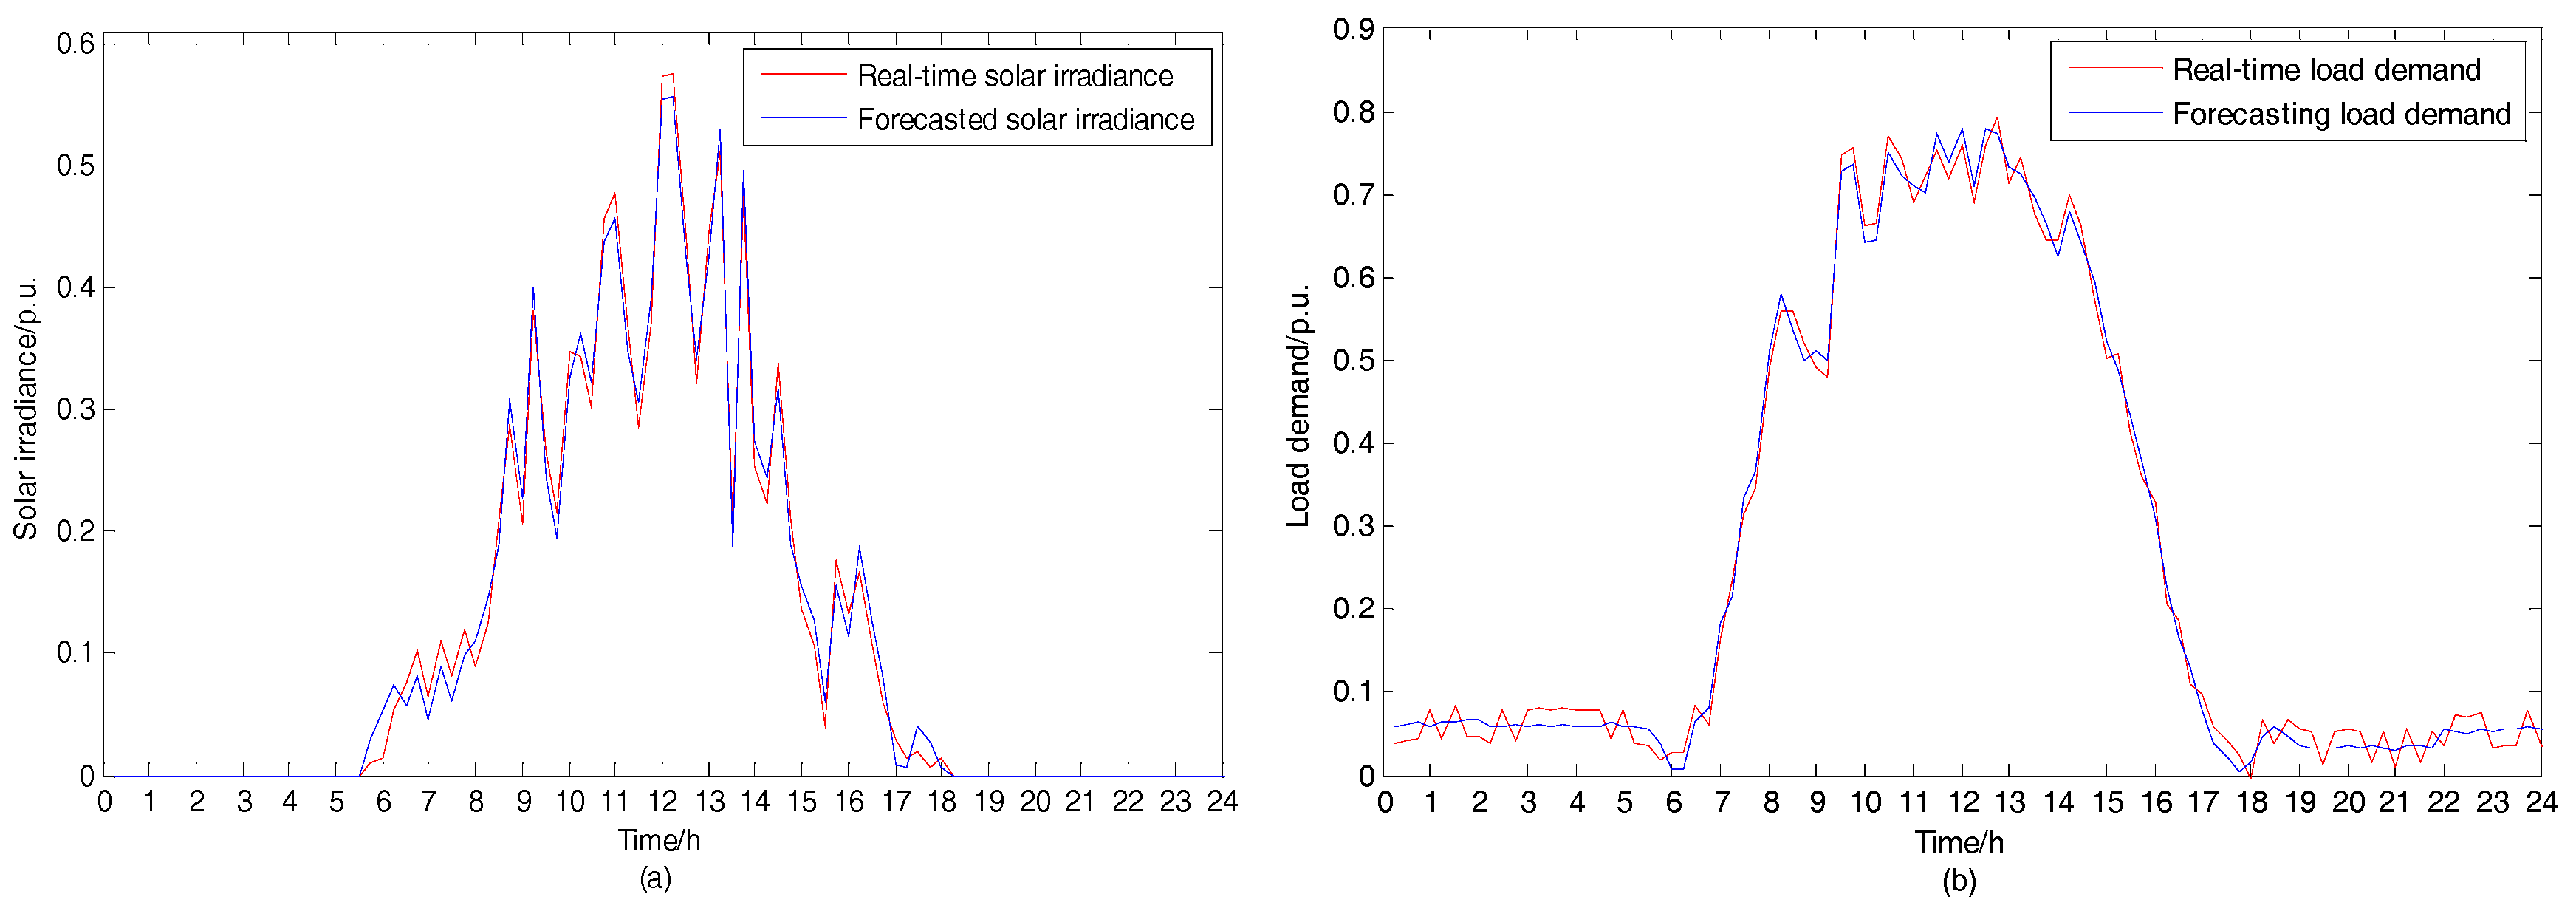
Figure 8.
Improved modularity index ρim versus the number of clusters.

Figure 9.
Optimal OLTC tap position for 16 July 2014.

Figure 10.
Comparison of the proposed scheme and constant set-point control (CSC).

Figure 11.
Optimal reactive power regulation scheduling of the PV.
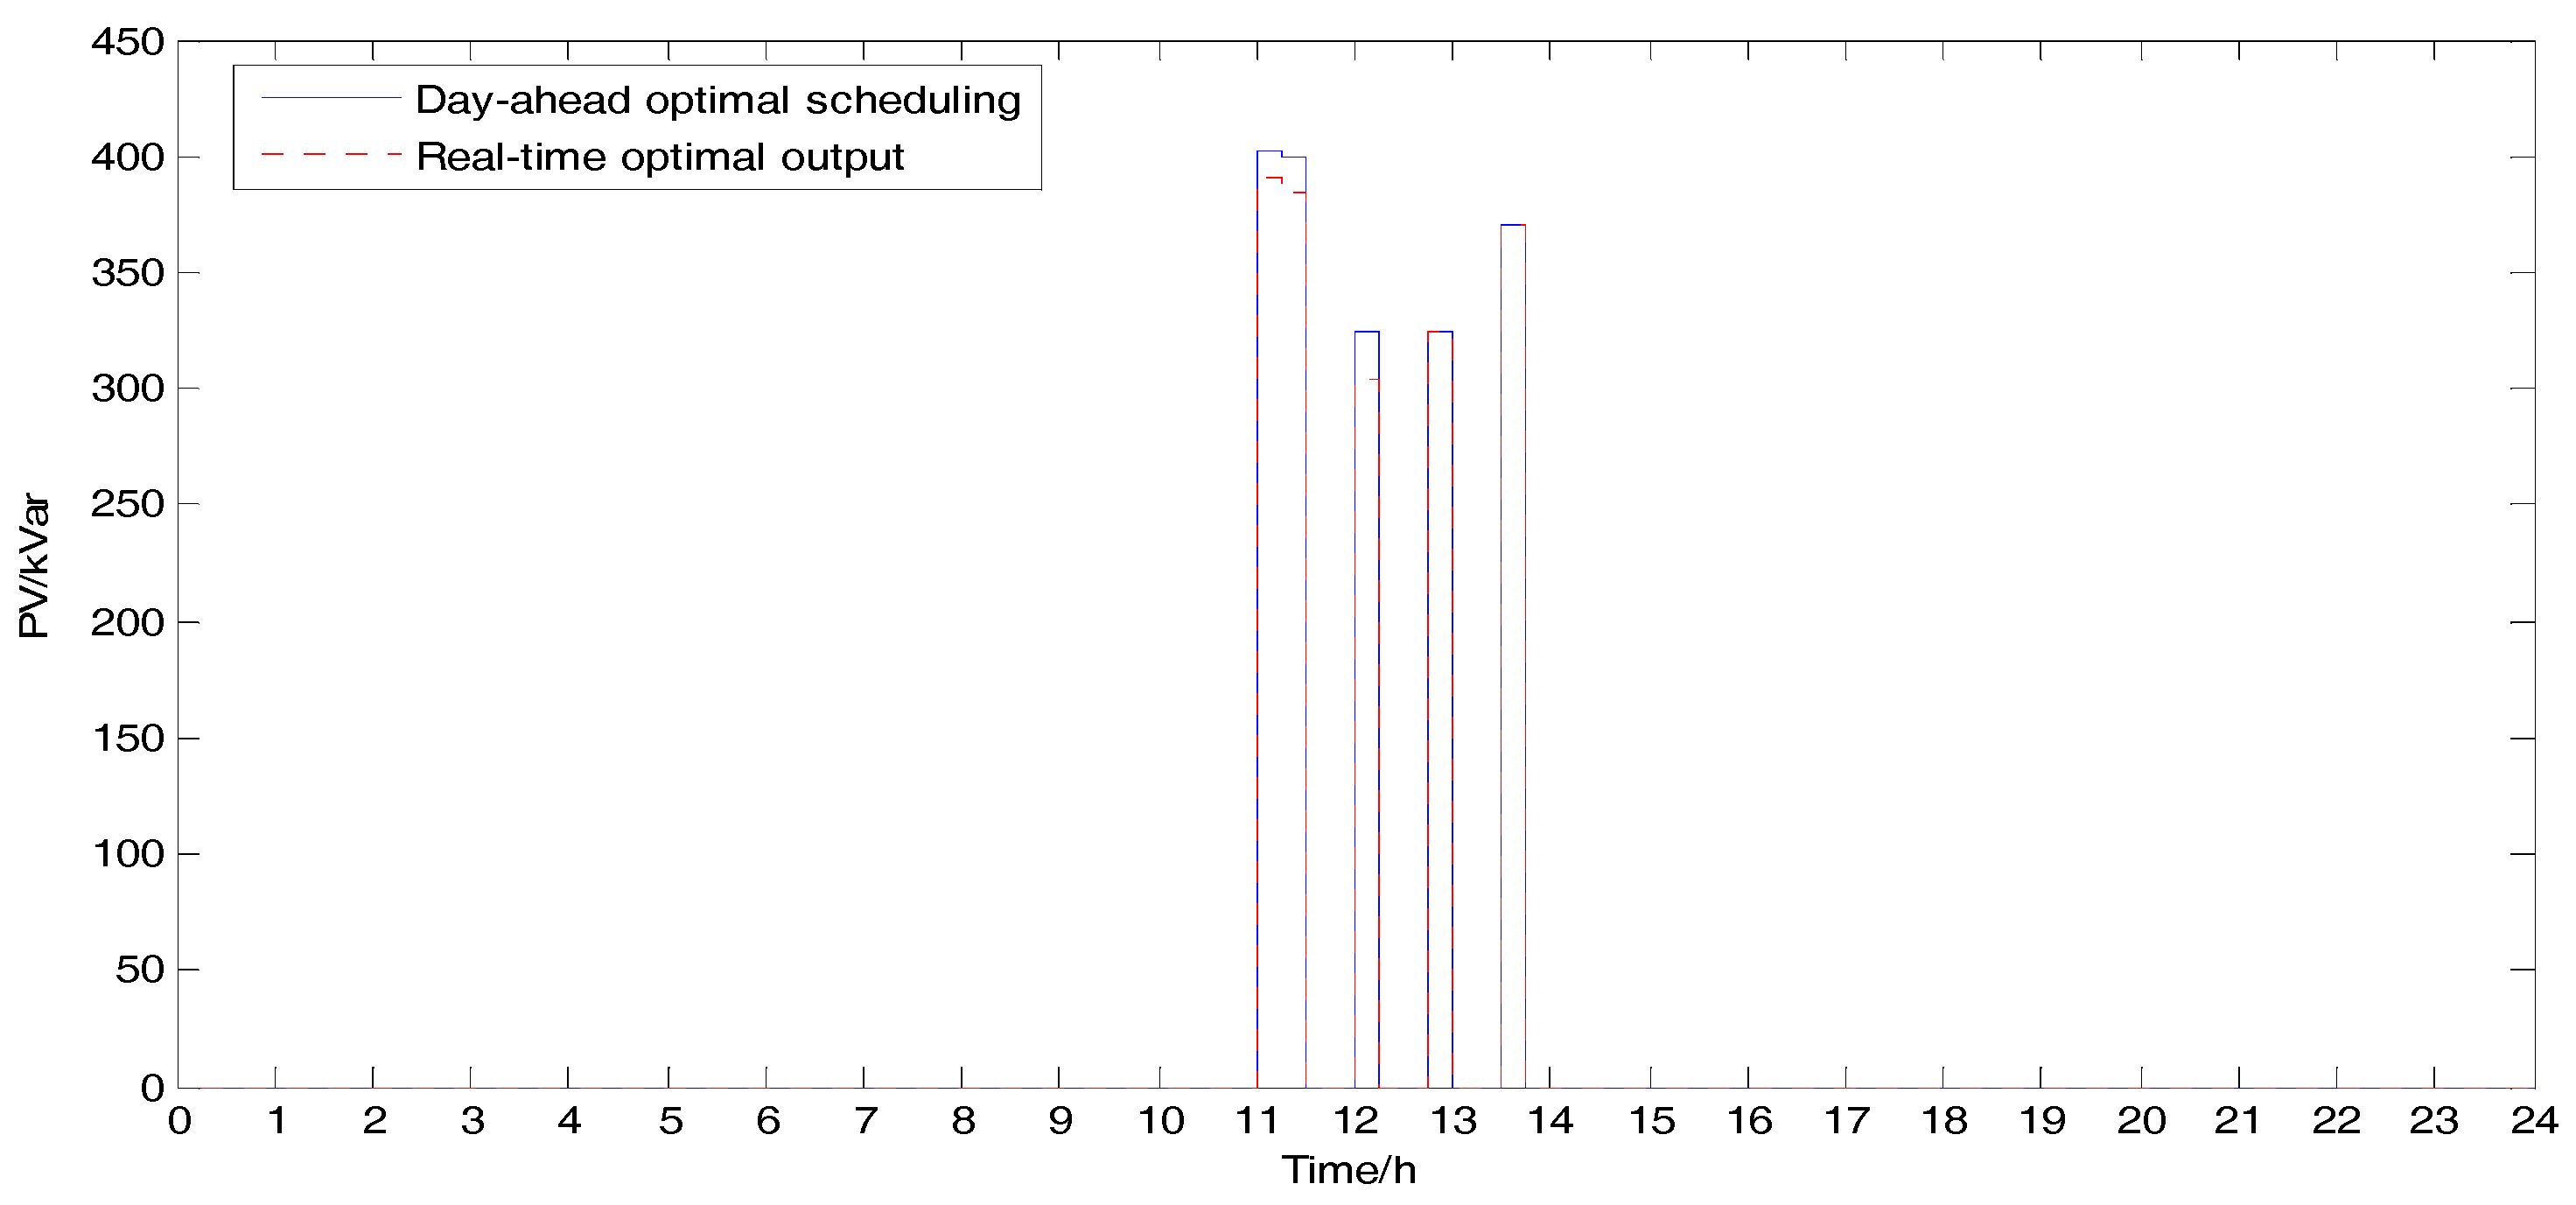
Figure 12.
Optimal regulation scheduling of the distributed shunt capacitors (SCs).
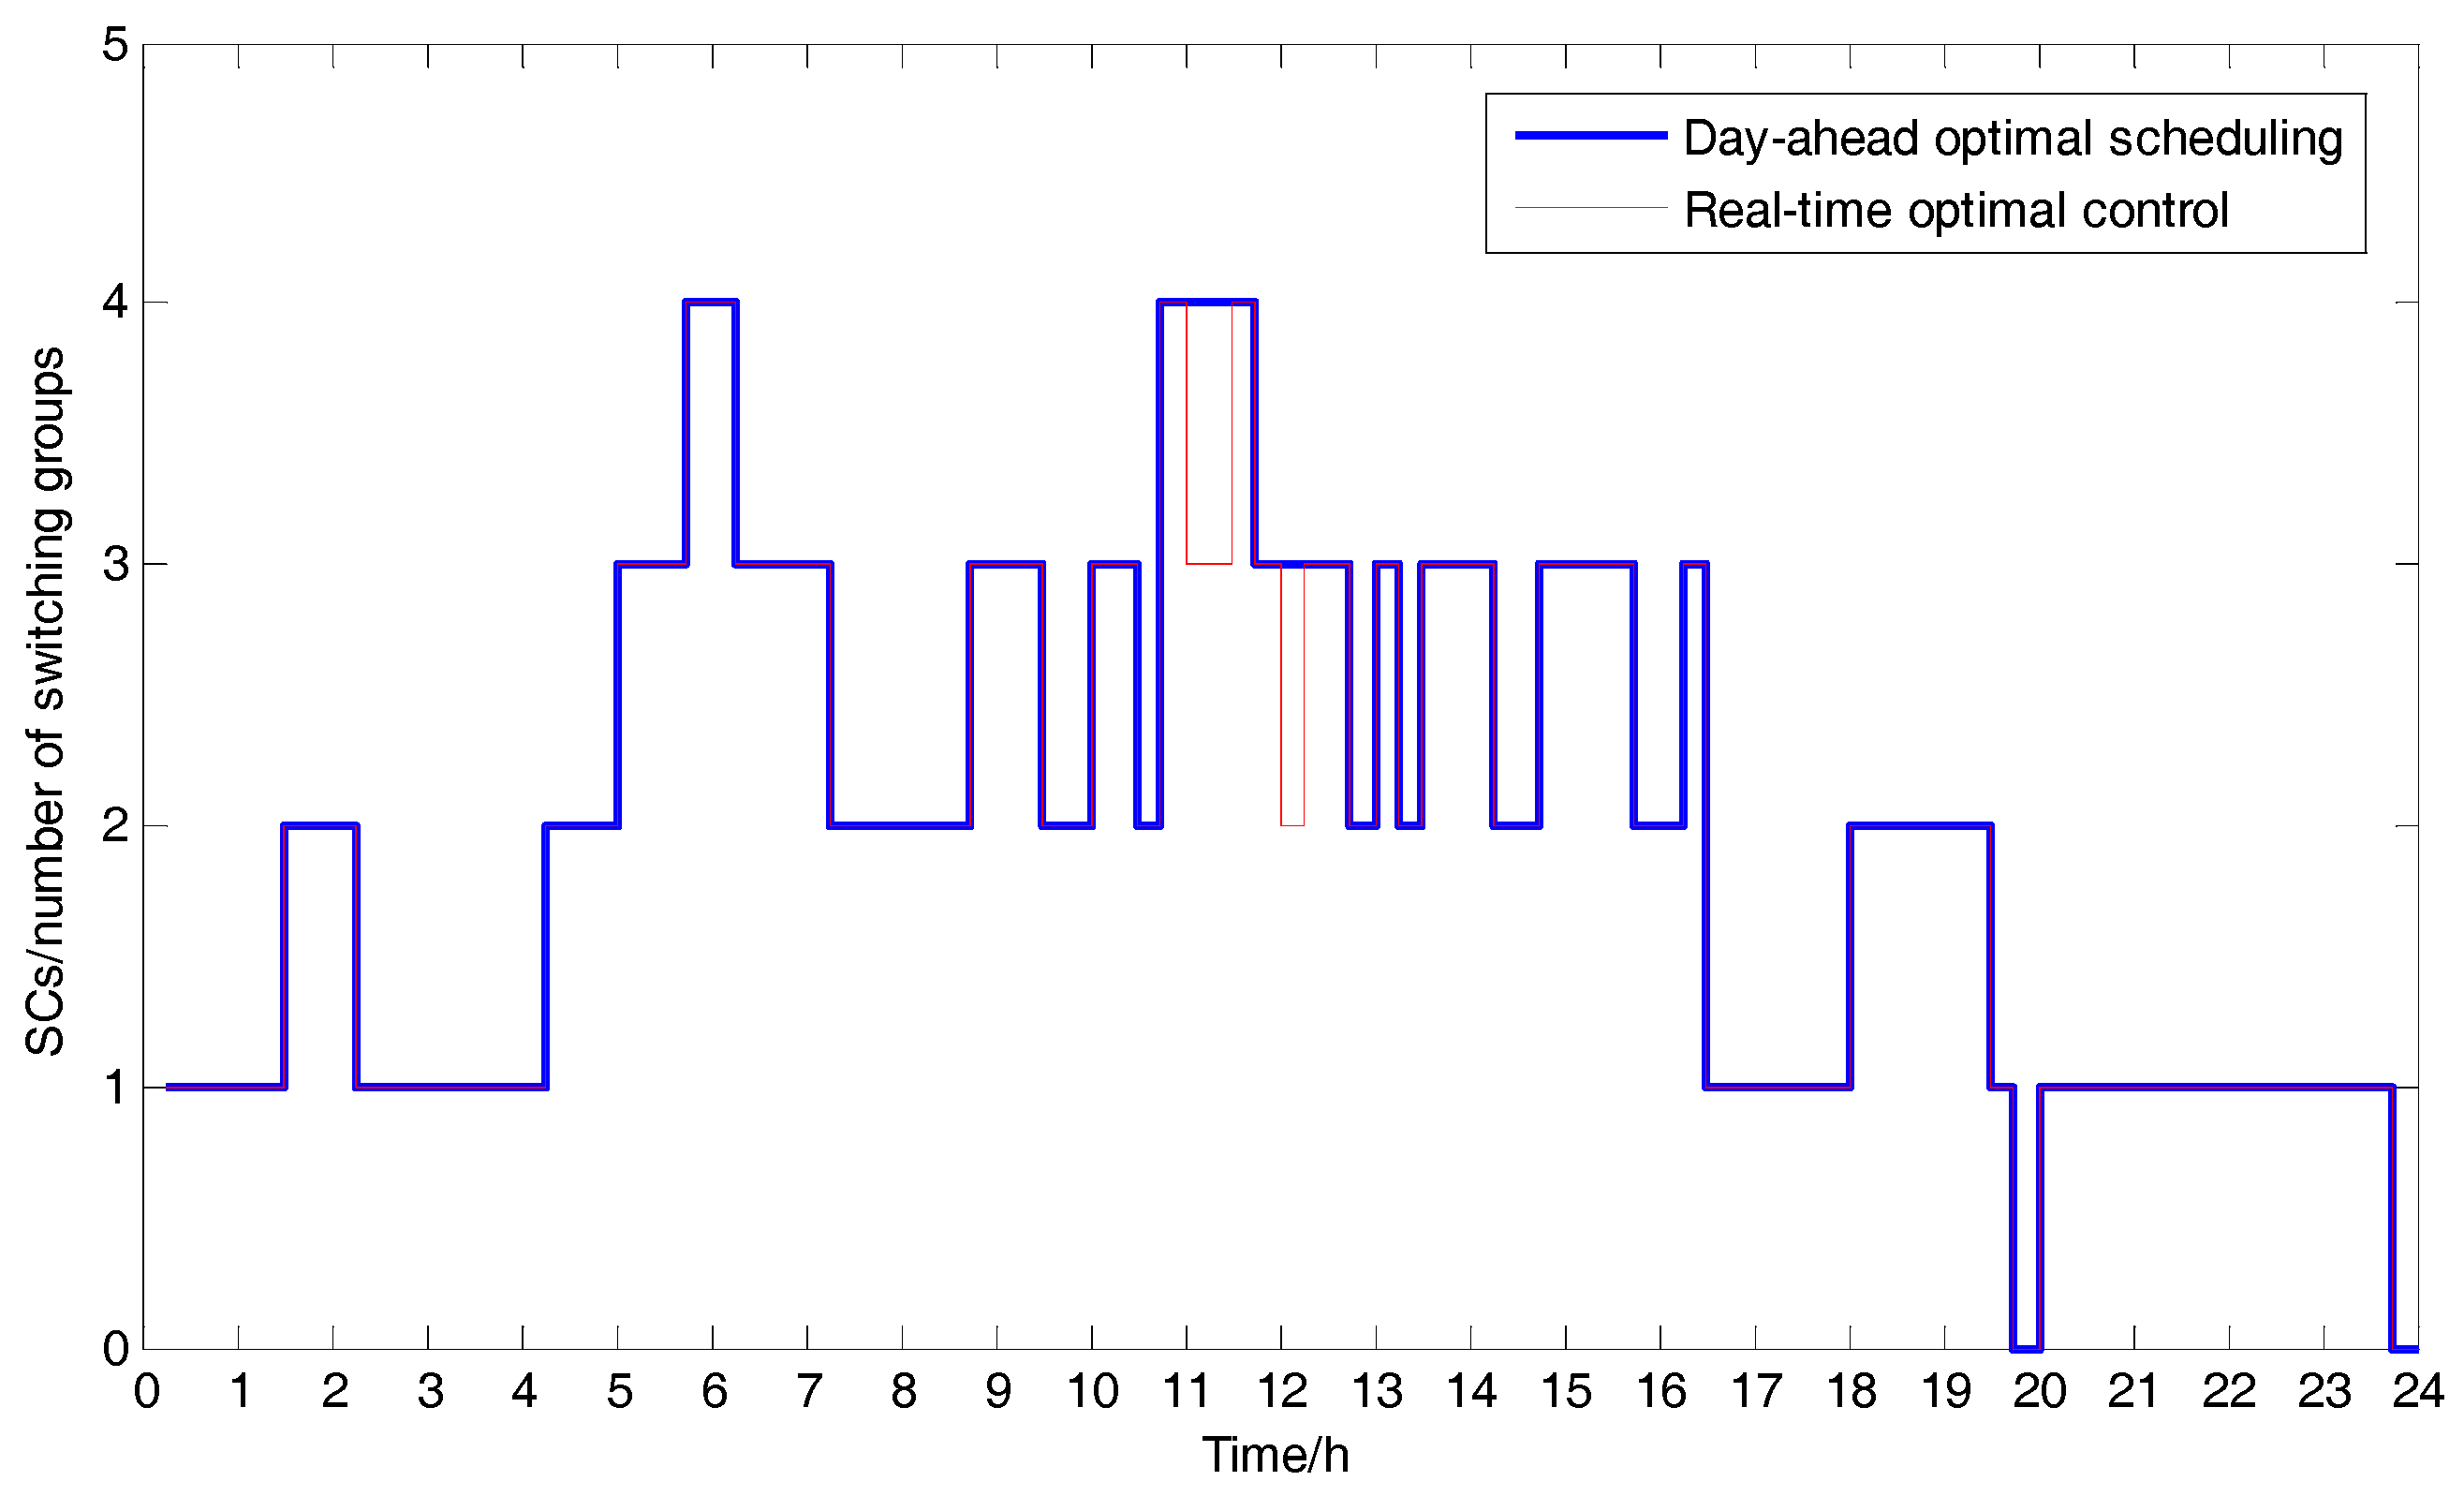
Figure 13.
Node voltage at 12:30.
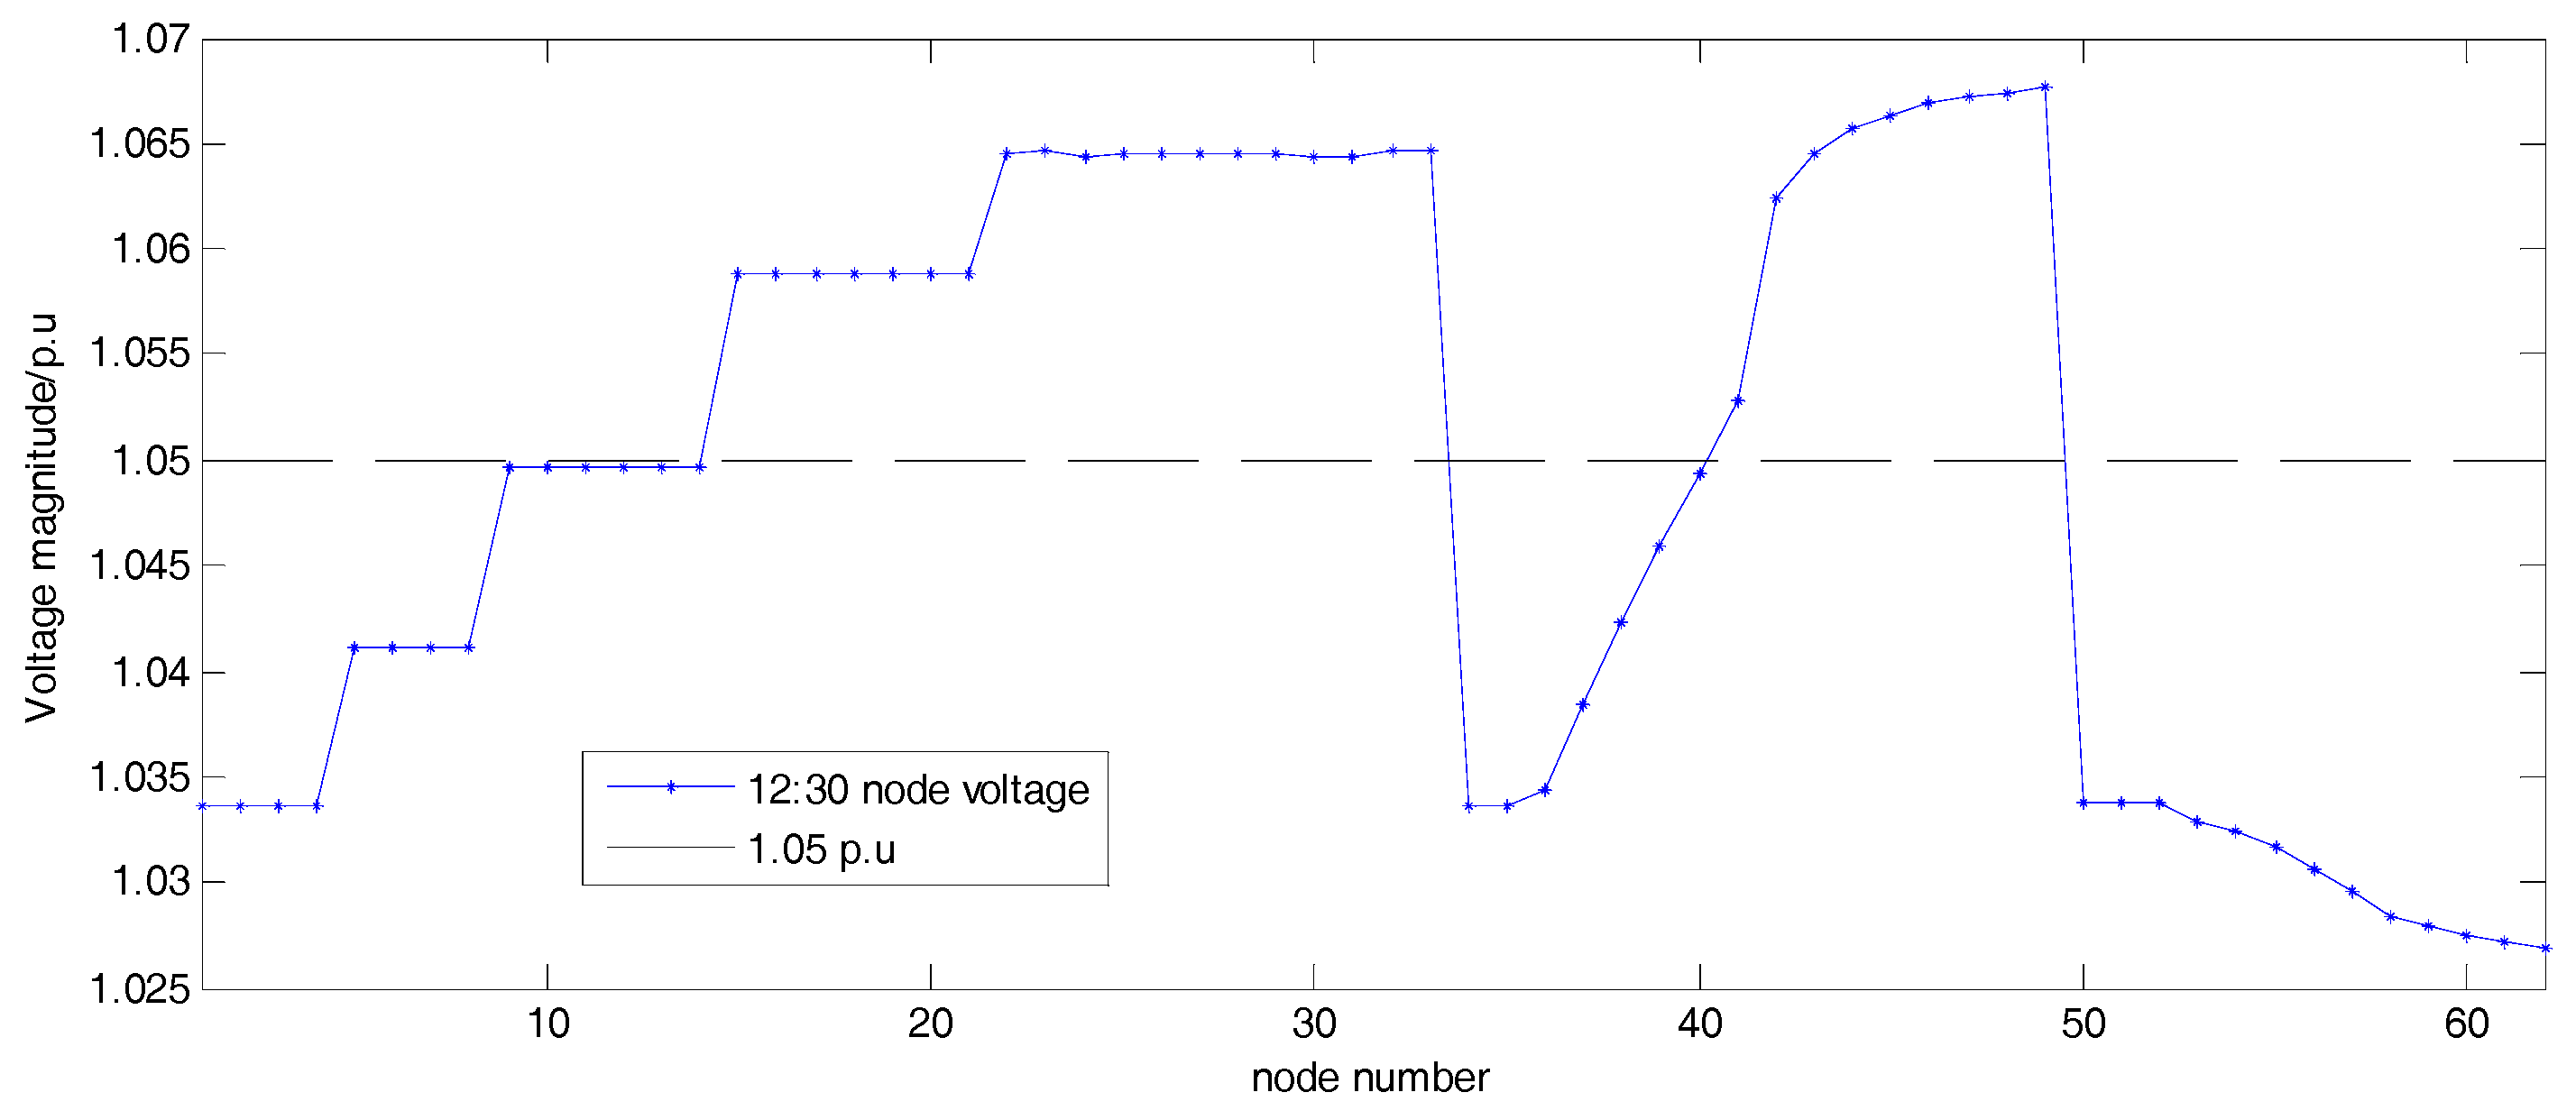
Figure 14.
Reactive power absorbed by PVs and reduction of the reactive power compensation by SCs under the proposed method.
Figure 14.
Reactive power absorbed by PVs and reduction of the reactive power compensation by SCs under the proposed method.

Figure 15.
Voltage profiles under different scenarios.
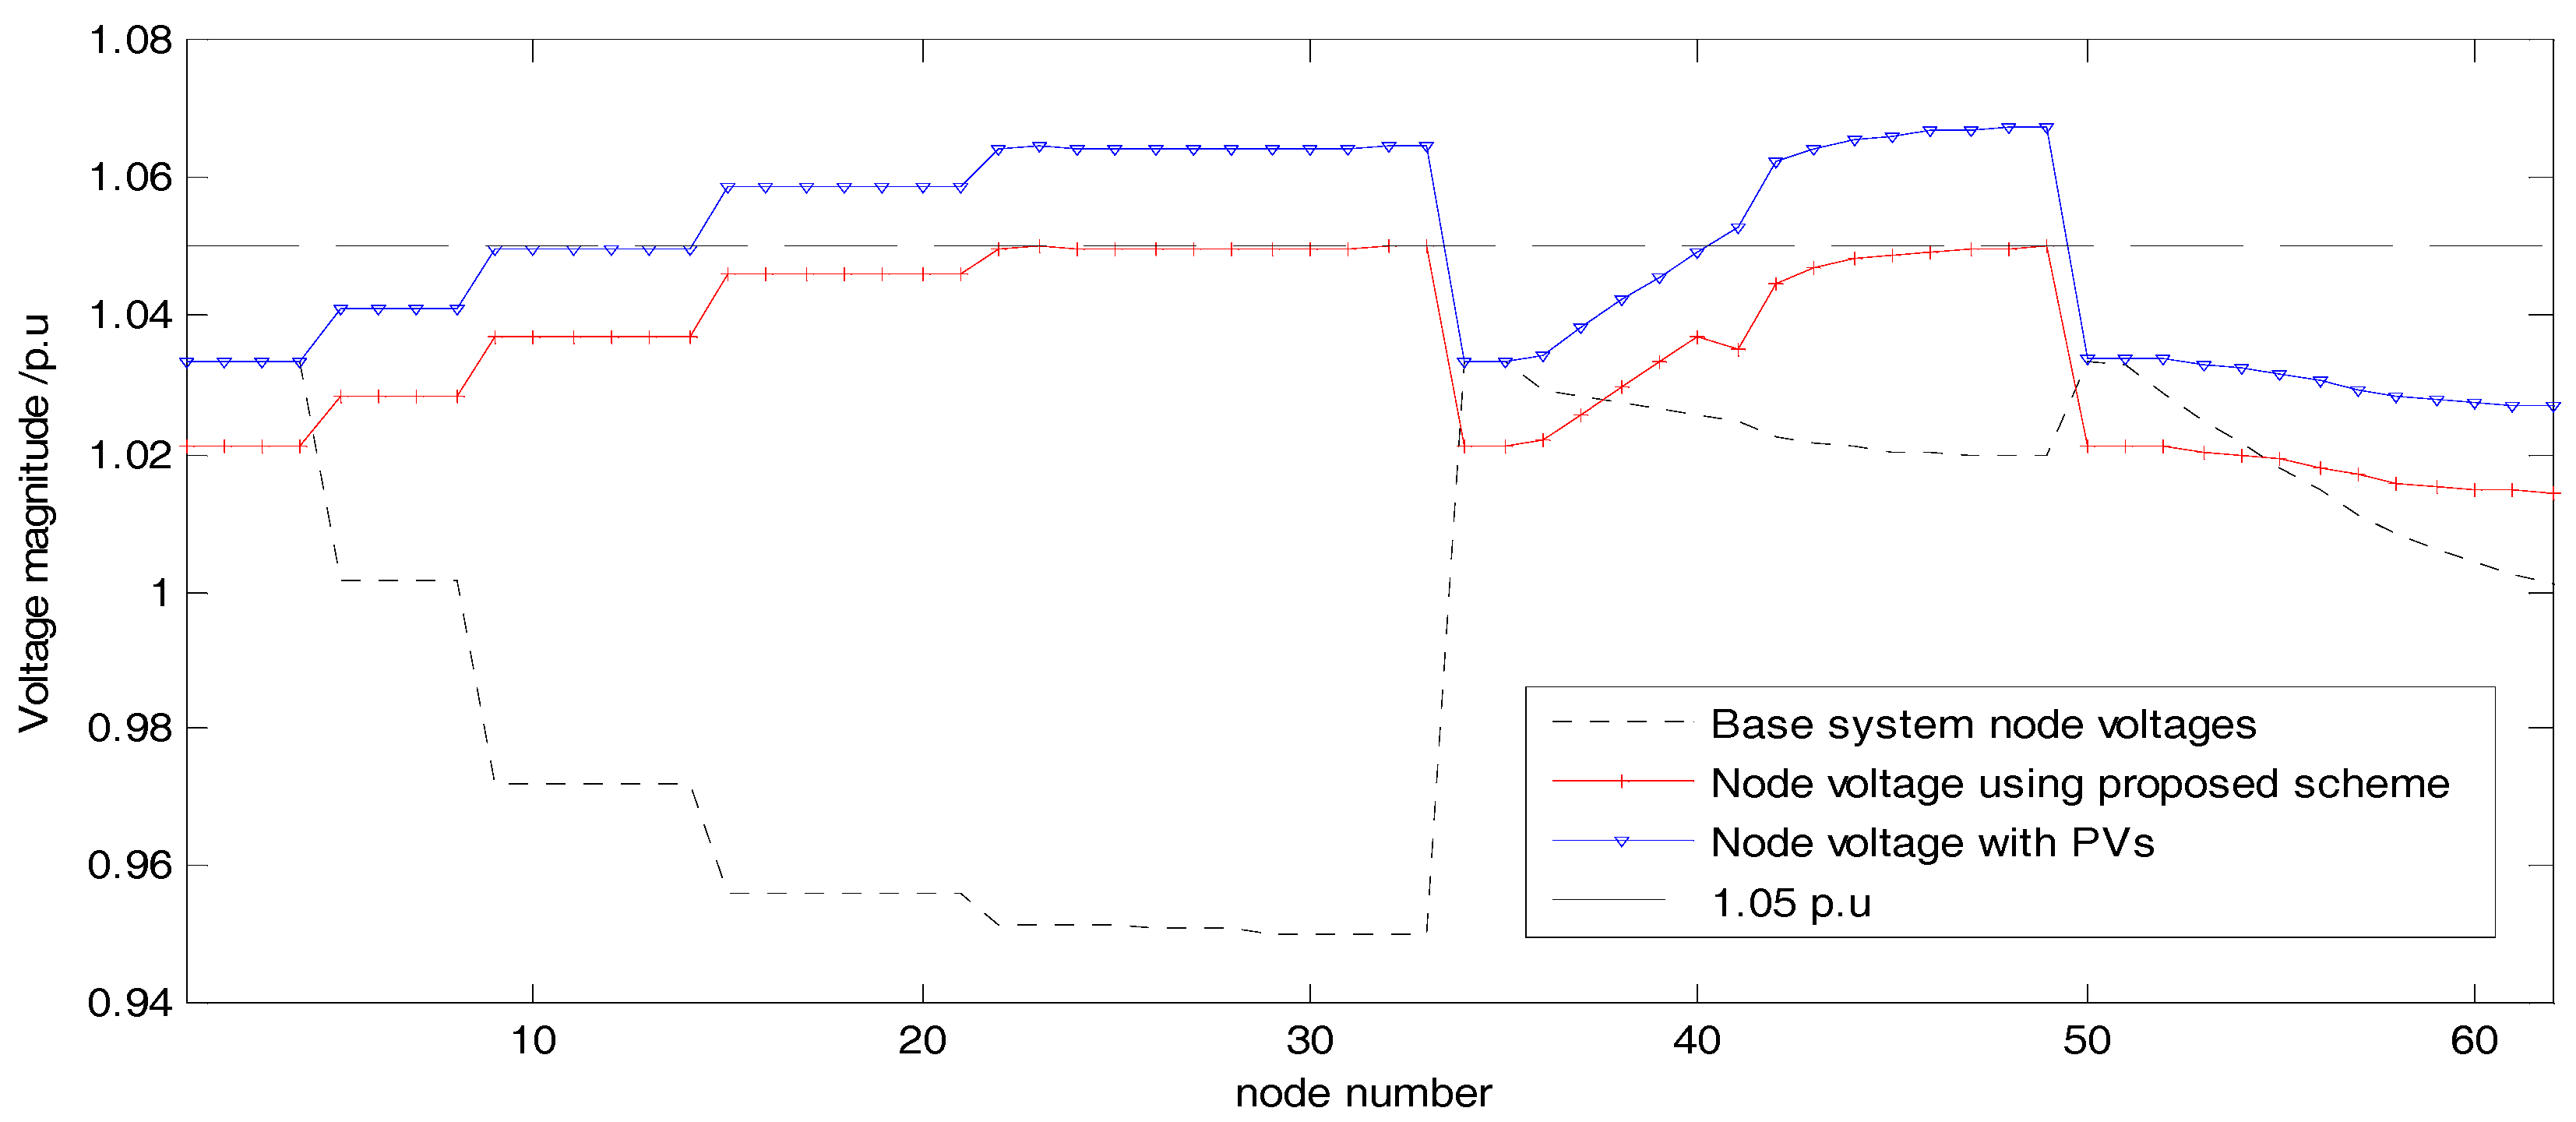
Figure 16.
Voltage profiles under different cases.
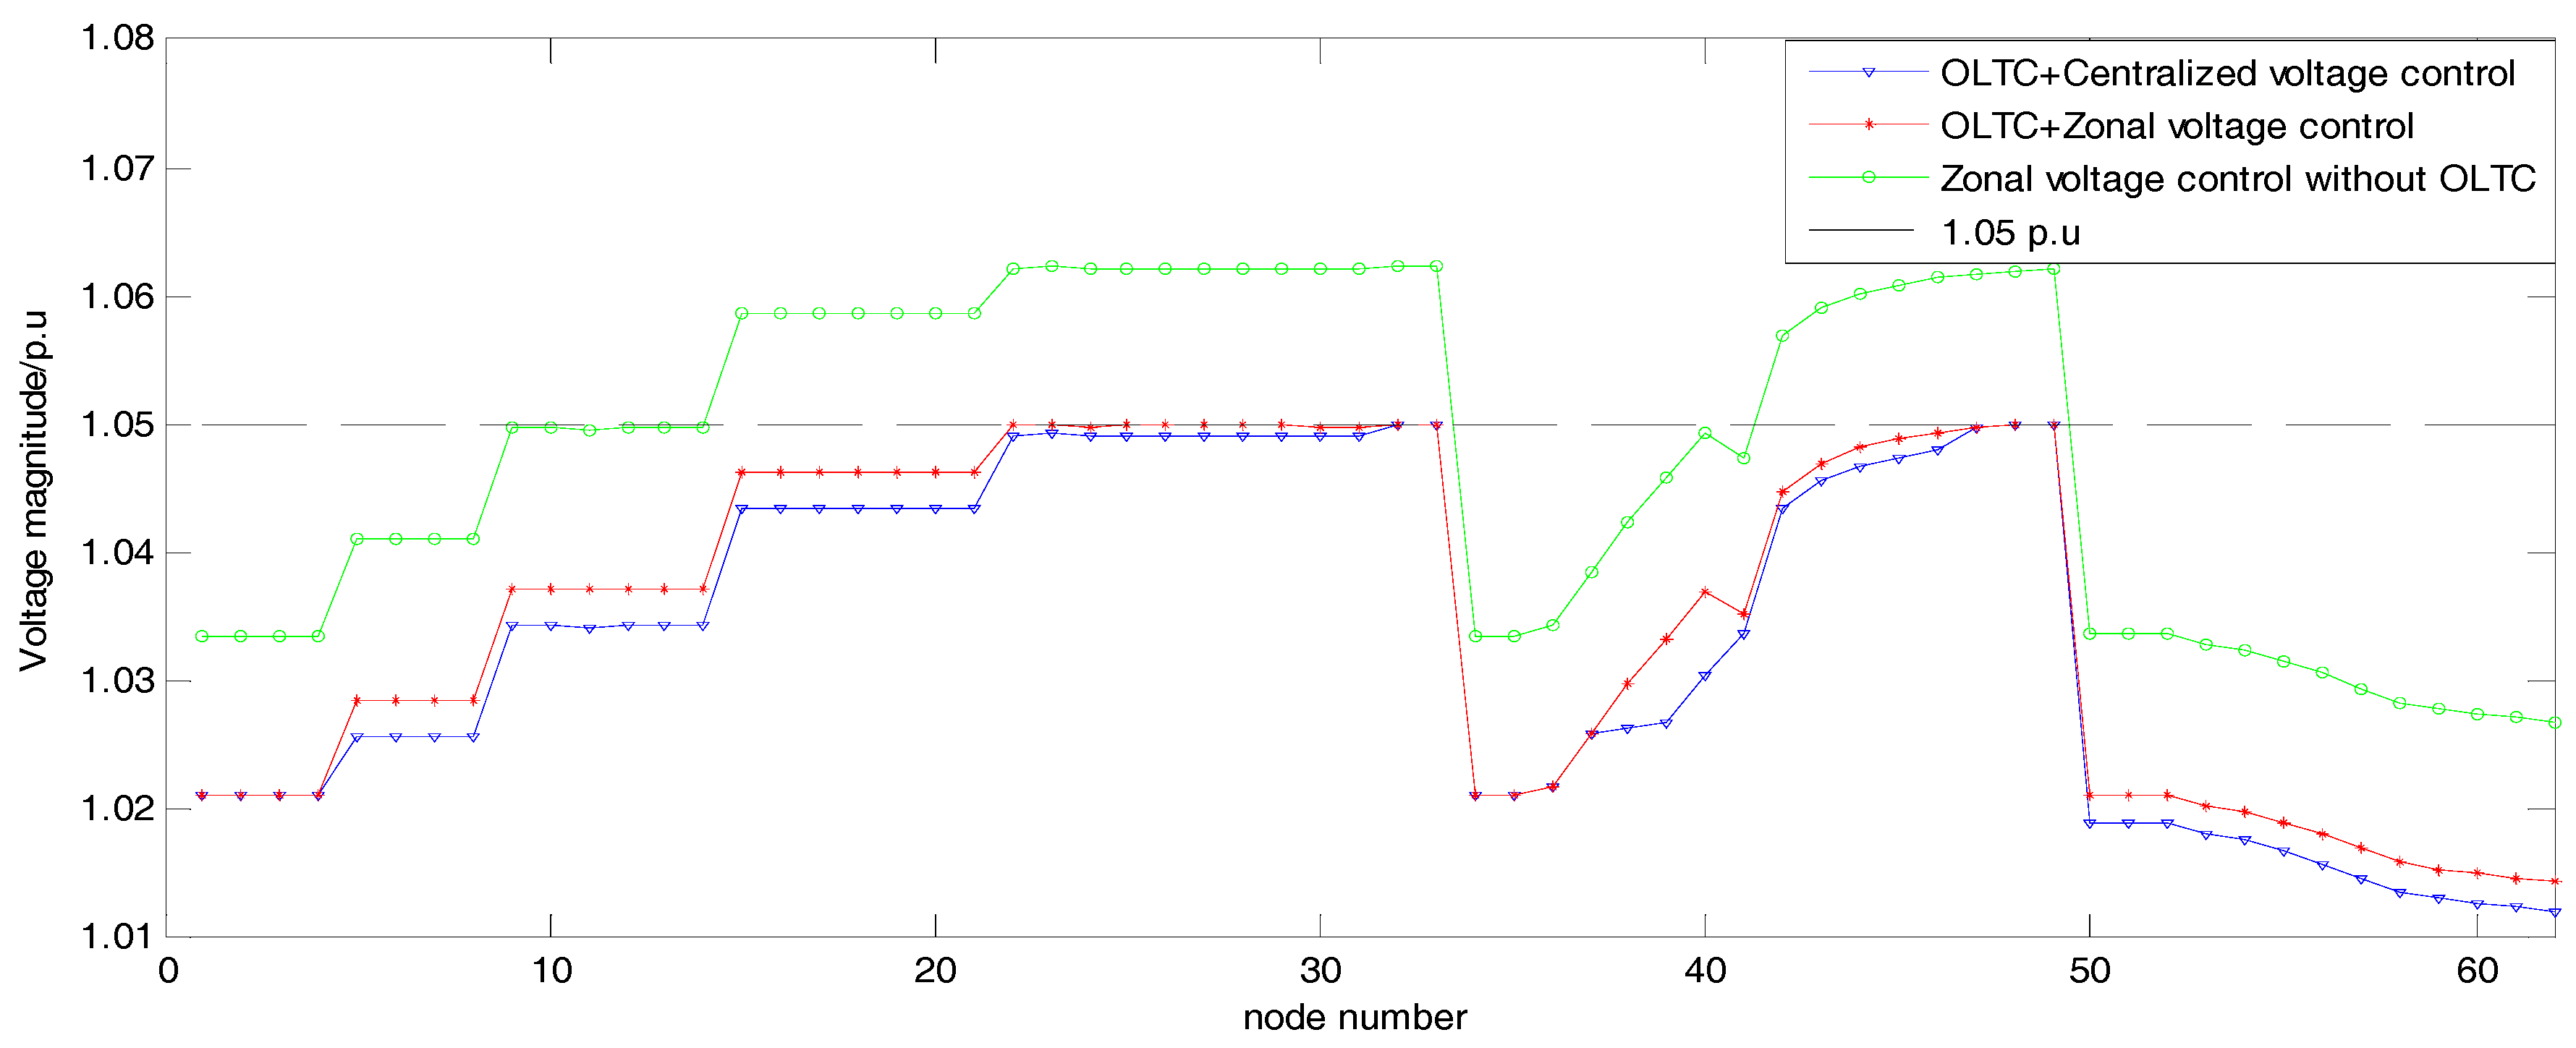
Figure 17.
Reactive power absorbed by the PVs and reduction of the reactive power compensation by SCs/kVar based on centralized control.
Figure 17.
Reactive power absorbed by the PVs and reduction of the reactive power compensation by SCs/kVar based on centralized control.
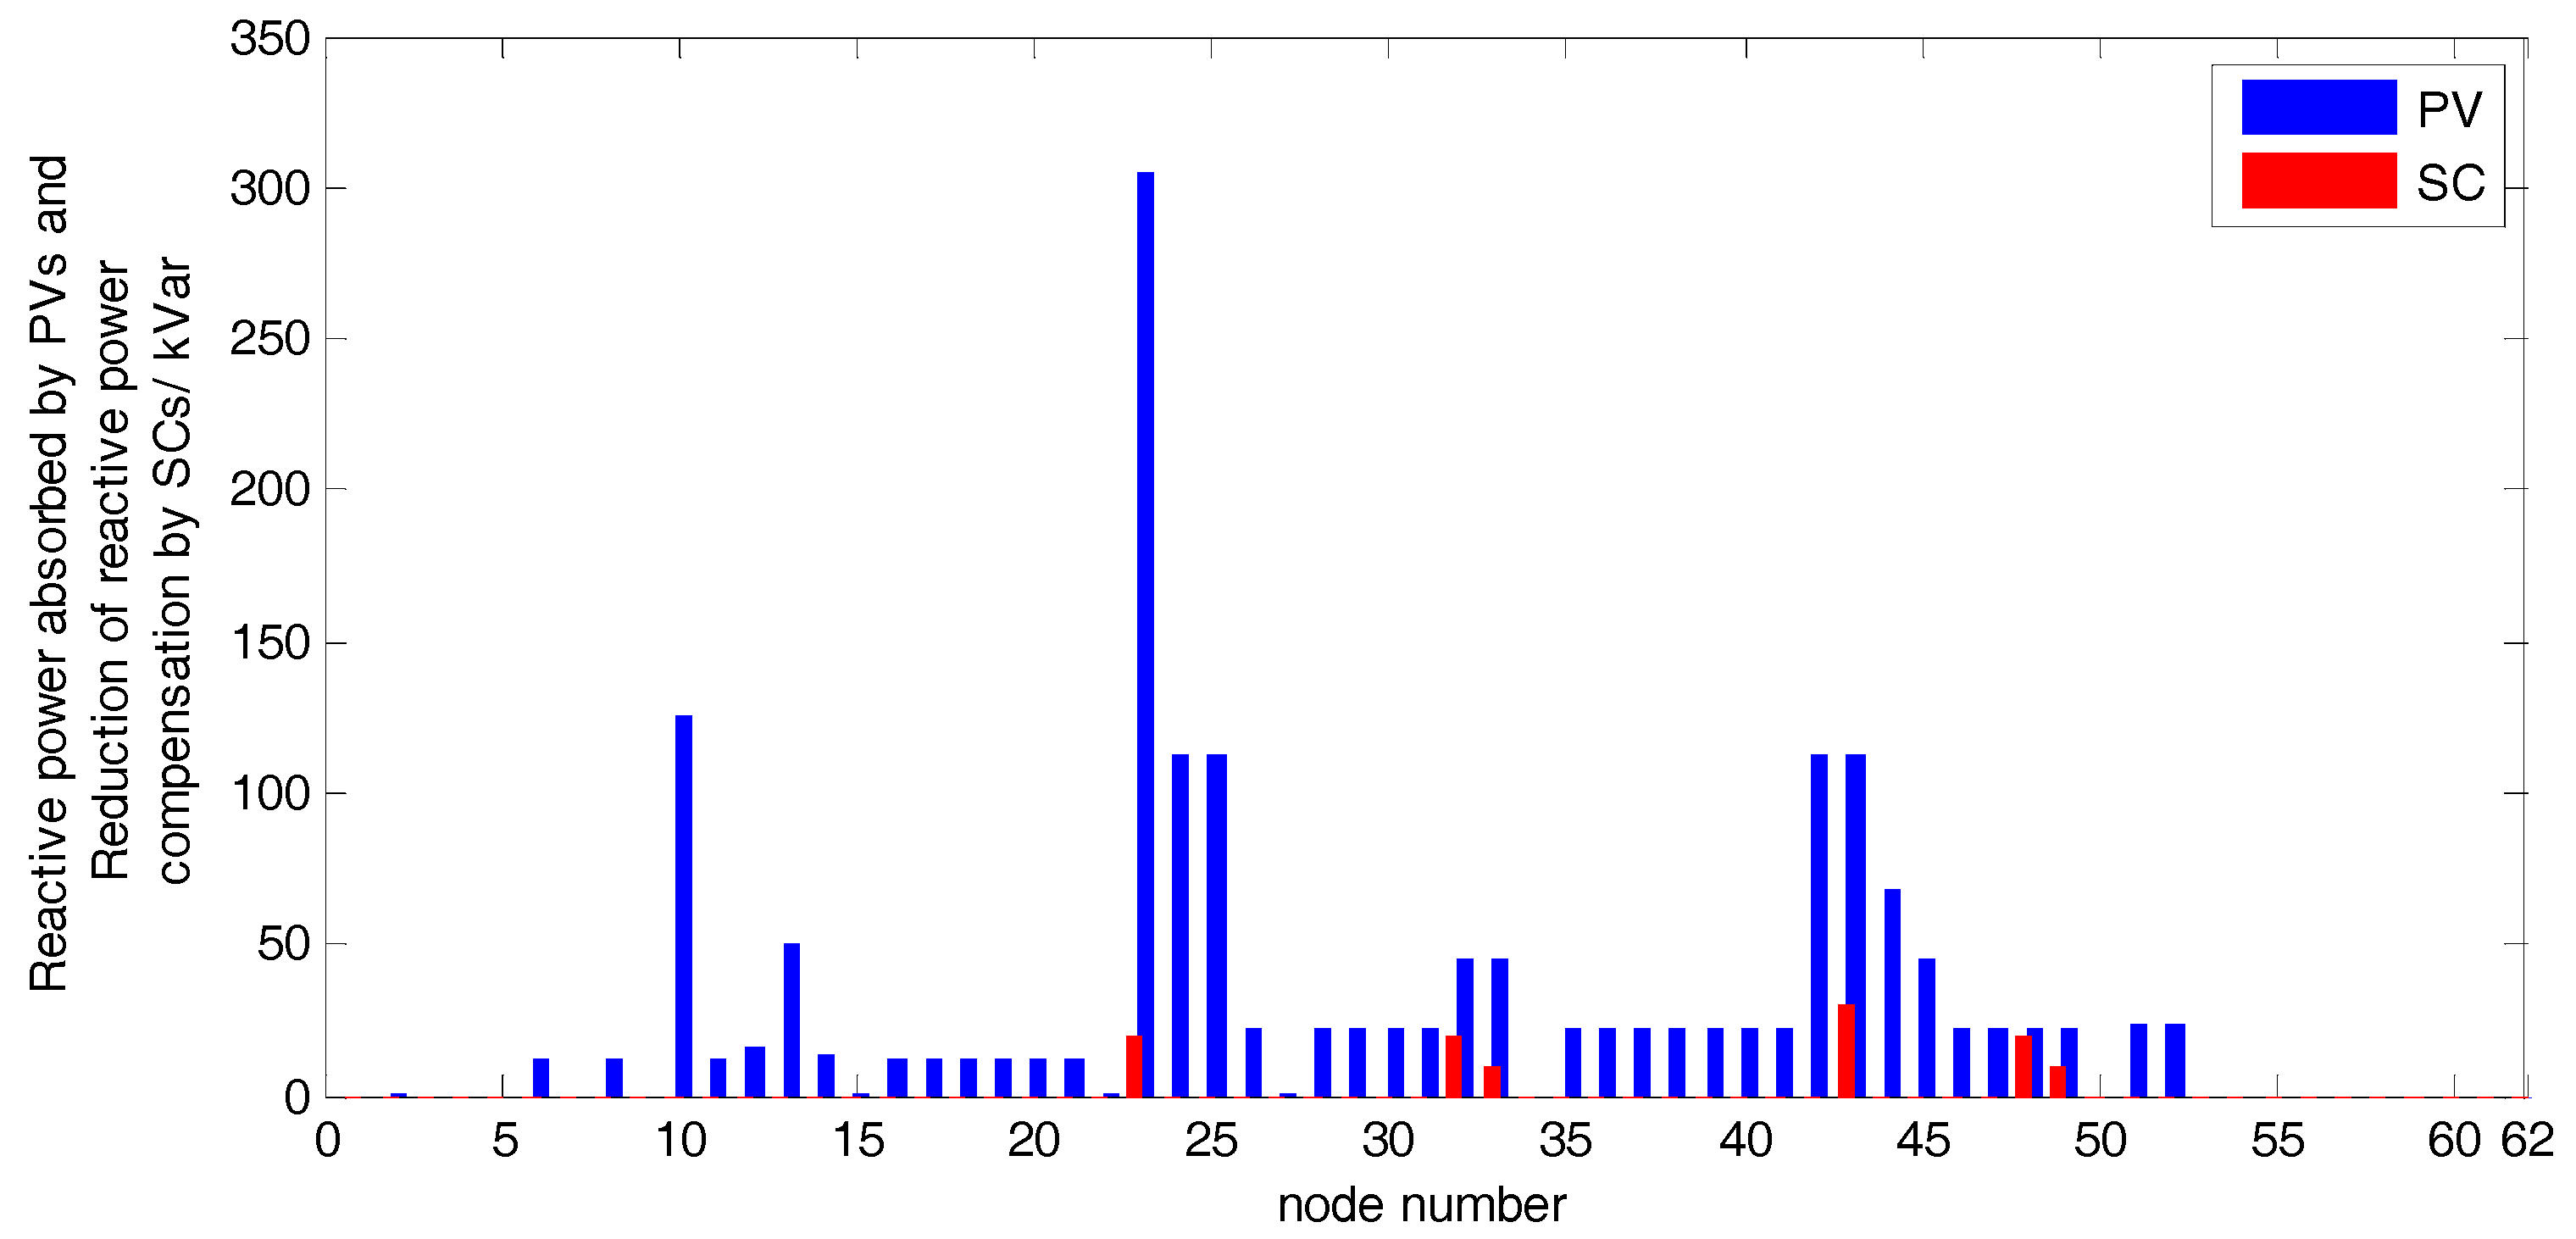
Table 1.
Current PV installed capacity table.
| Node Number | 13 | 21 | 23 | 33 | 43 | 58 |
| Installed Capacity (kW) | 400 | 100 | 1350 | 200 | 500 | 100 |
Table 2.
Comparison case 1.
| Case | PV (kVar) | SC (kVar) | Total Cost (USD) |
|---|---|---|---|
| Zonal voltage control without an OLTC | 1483 | 790 | 300.53/$ |
| OLTC + Zonal voltage control | 1290 | 270 | 176.15/$ |
Table 3.
Comparison case 2.
| Case | PV (kVar) | SC (kVar) | Total Cost (USD) | Time (s) |
|---|---|---|---|---|
| OLTC + Centralized voltage control | 1674 | 110 | 169.41/$ | 30.61 |
| OLTC + Zonal voltage control | 1290 | 270 | 176.15/$ | 4.32 |
© 2017 by the authors. Licensee MDPI, Basel, Switzerland. This article is an open access article distributed under the terms and conditions of the Creative Commons Attribution (CC BY) license (http://creativecommons.org/licenses/by/4.0/).
Share and Cite
MDPI and ACS Style
Xiao, C.; Zhao, B.; Ding, M.; Li, Z.; Ge, X. Zonal Voltage Control Combined Day-Ahead Scheduling and Real-Time Control for Distribution Networks with High Proportion of PVs. Energies 2017, 10, 1464. https://doi.org/10.3390/en10101464
AMA Style
Xiao C, Zhao B, Ding M, Li Z, Ge X. Zonal Voltage Control Combined Day-Ahead Scheduling and Real-Time Control for Distribution Networks with High Proportion of PVs. Energies. 2017; 10(10):1464. https://doi.org/10.3390/en10101464
Chicago/Turabian StyleXiao, Chuanliang, Bo Zhao, Ming Ding, Zhihao Li, and Xiaohui Ge. 2017. "Zonal Voltage Control Combined Day-Ahead Scheduling and Real-Time Control for Distribution Networks with High Proportion of PVs" Energies 10, no. 10: 1464. https://doi.org/10.3390/en10101464
Note that from the first issue of 2016, this journal uses article numbers instead of page numbers. See further details here.