Relationship between Creep Property and Loading-Rate Dependence of Strength of Artificial Methane-Hydrate-Bearing Toyoura Sand under Triaxial Compression

Abstract
:1. Introduction
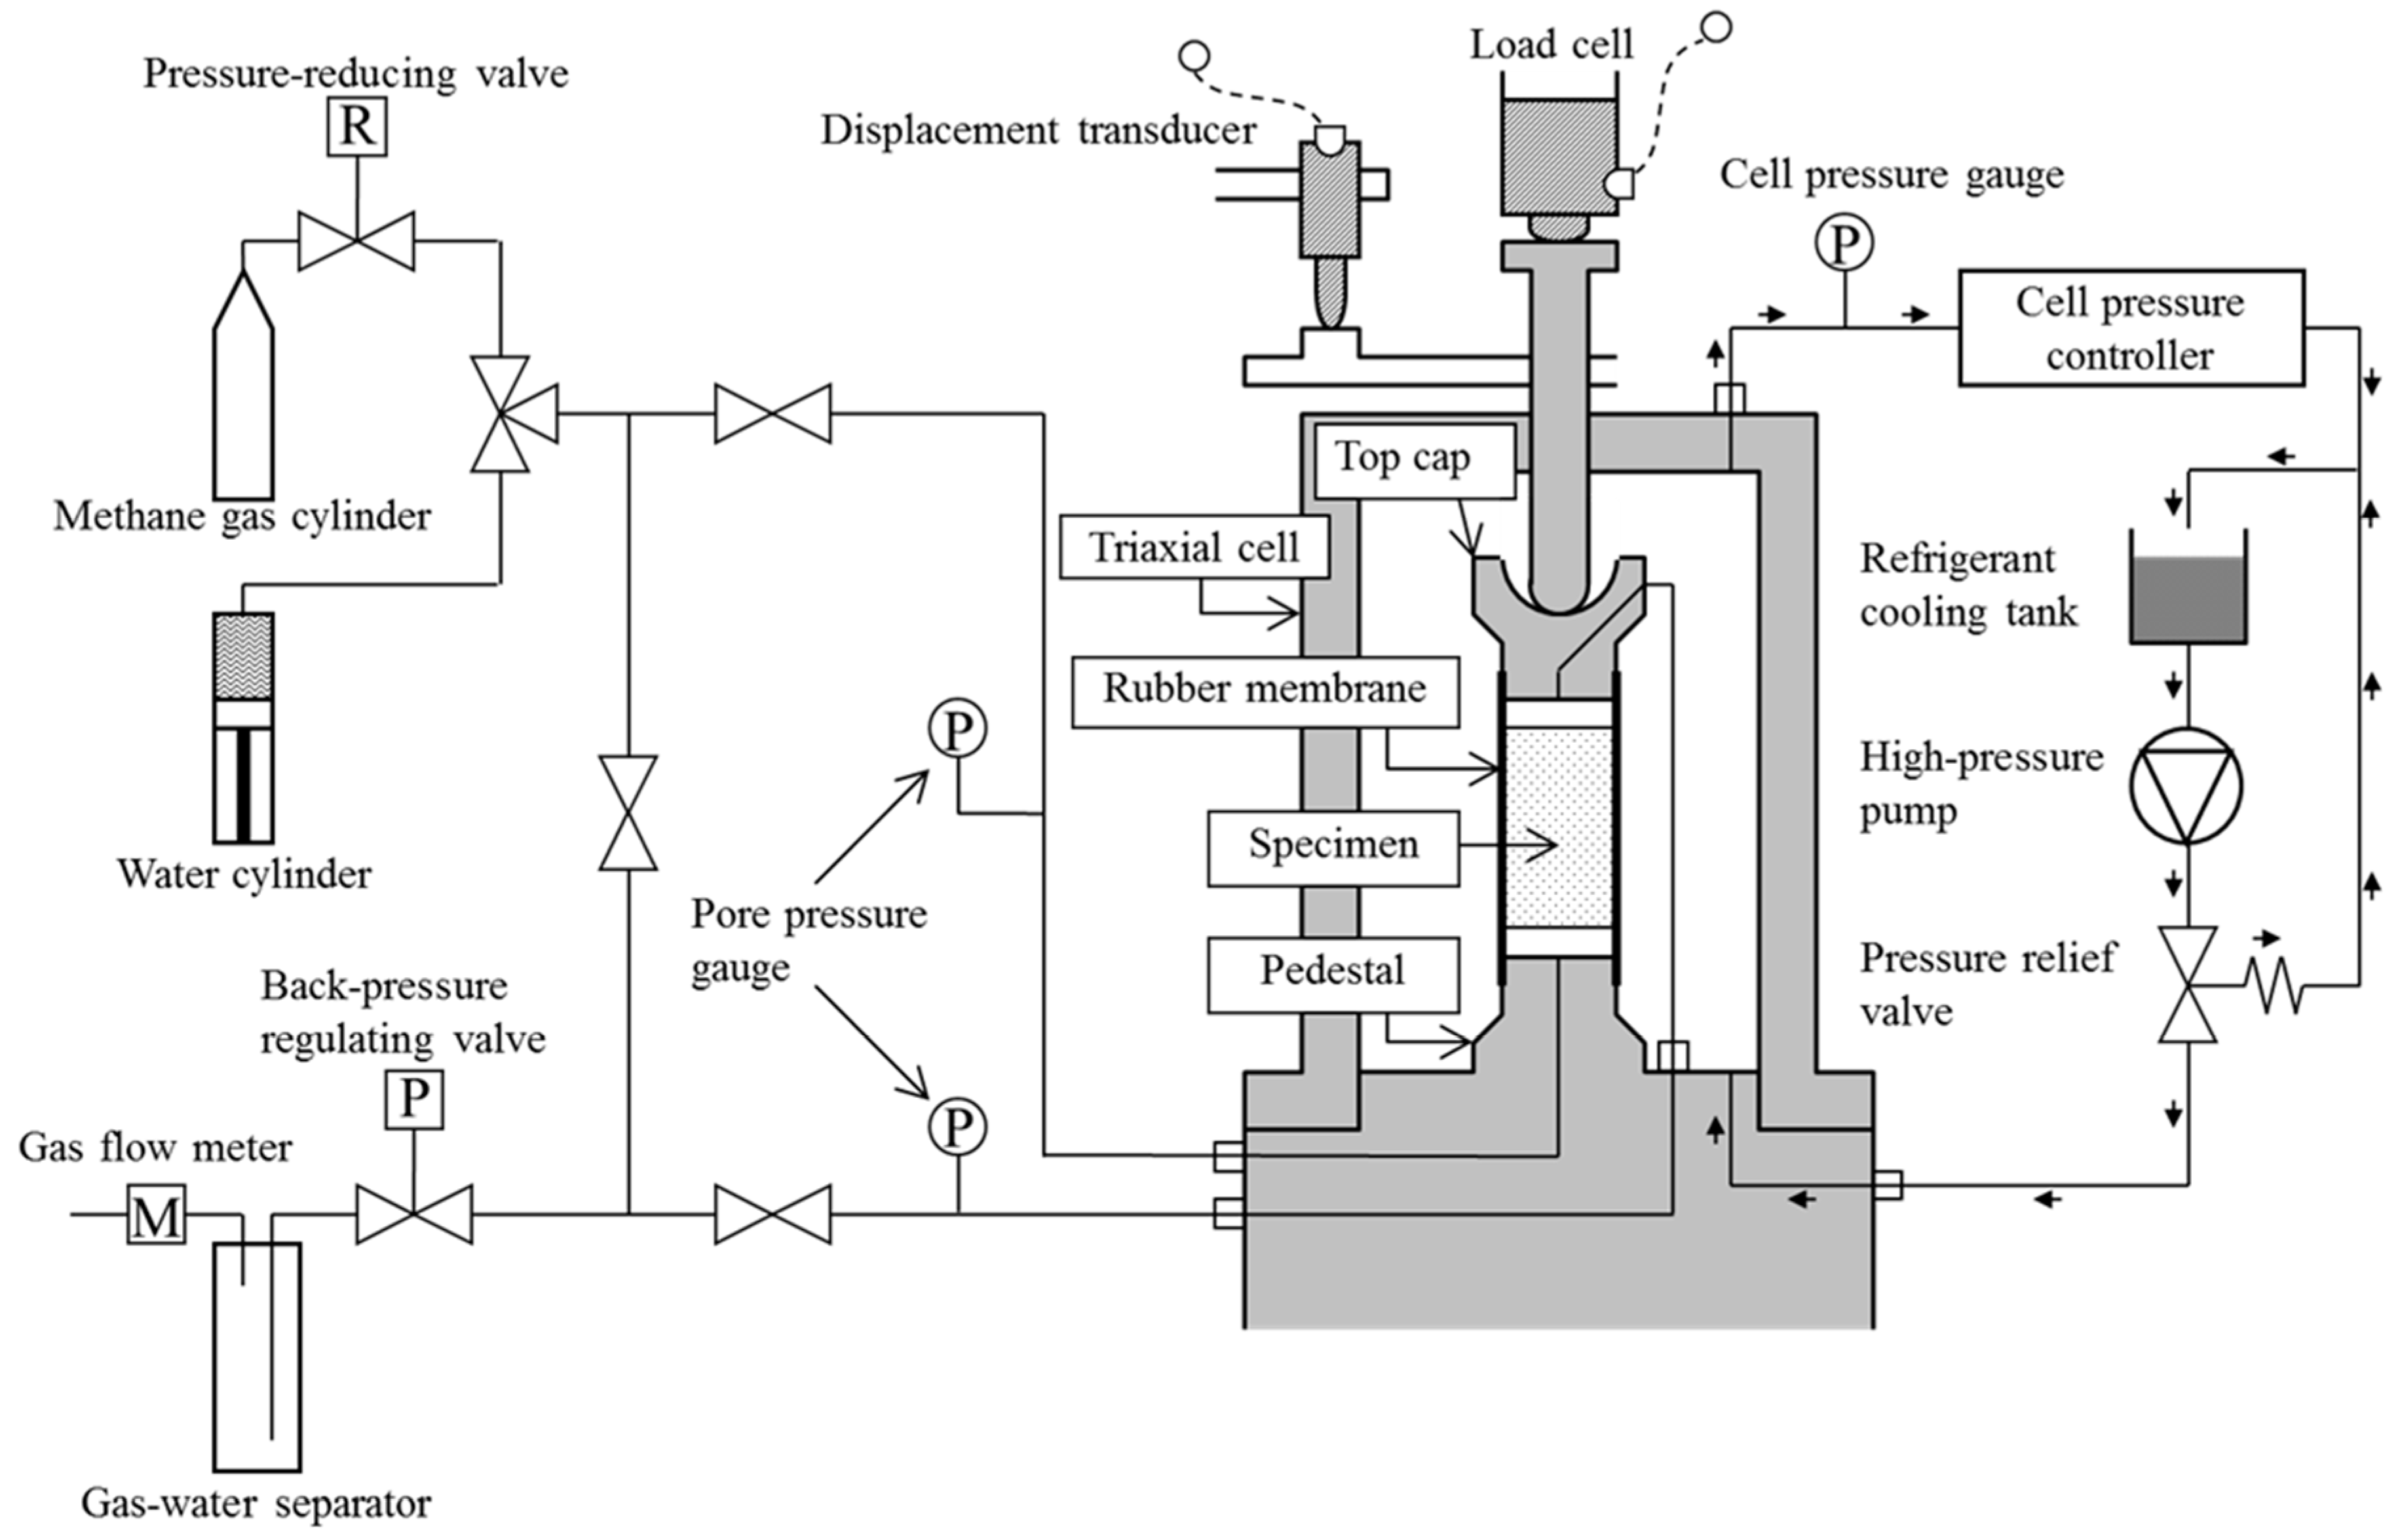
2. Testing Method
2.1. Specimen Preparation
2.2. Axial Loading
3. Review of Test Results
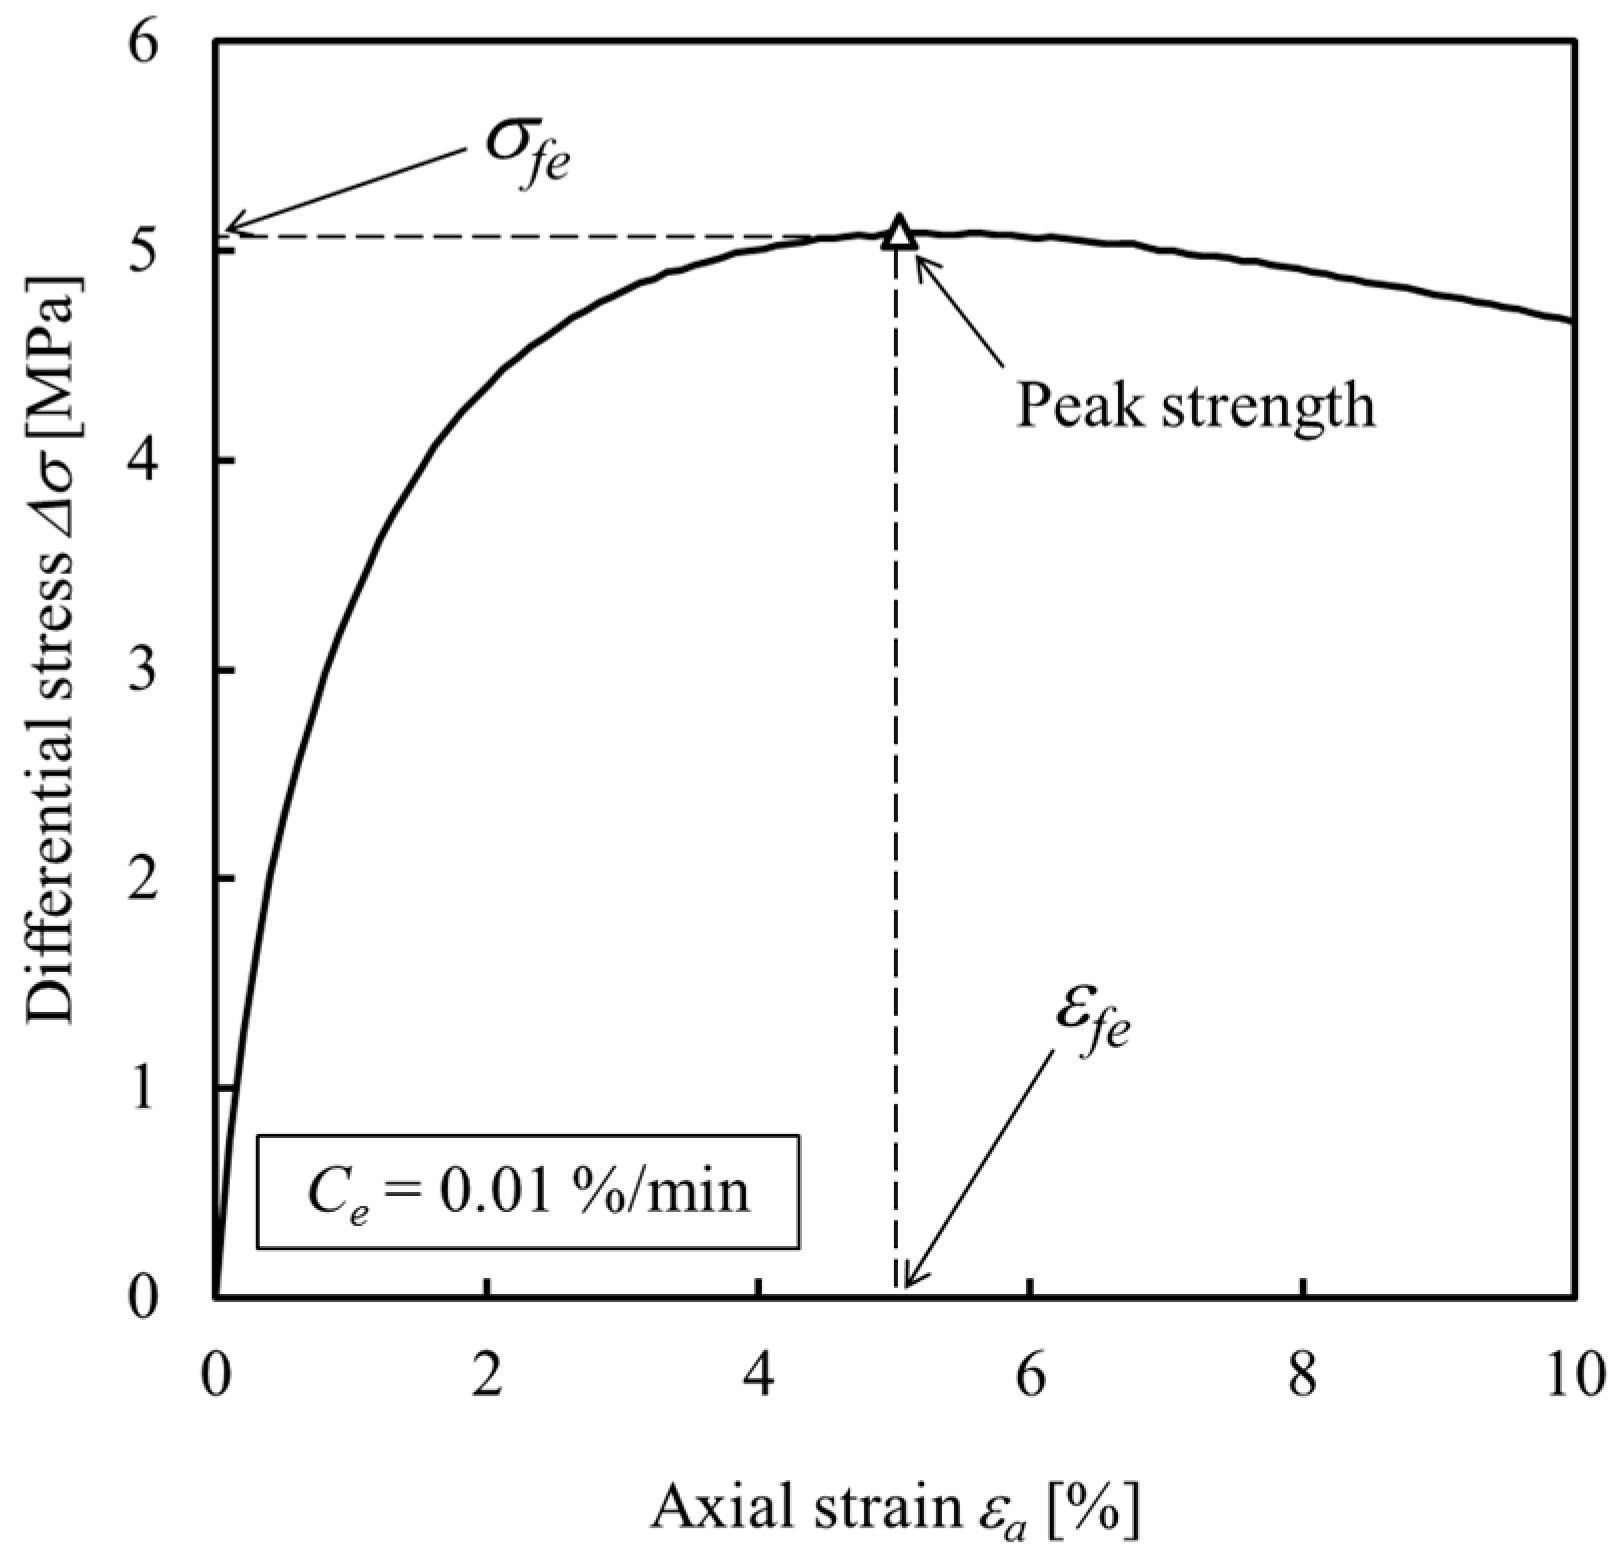
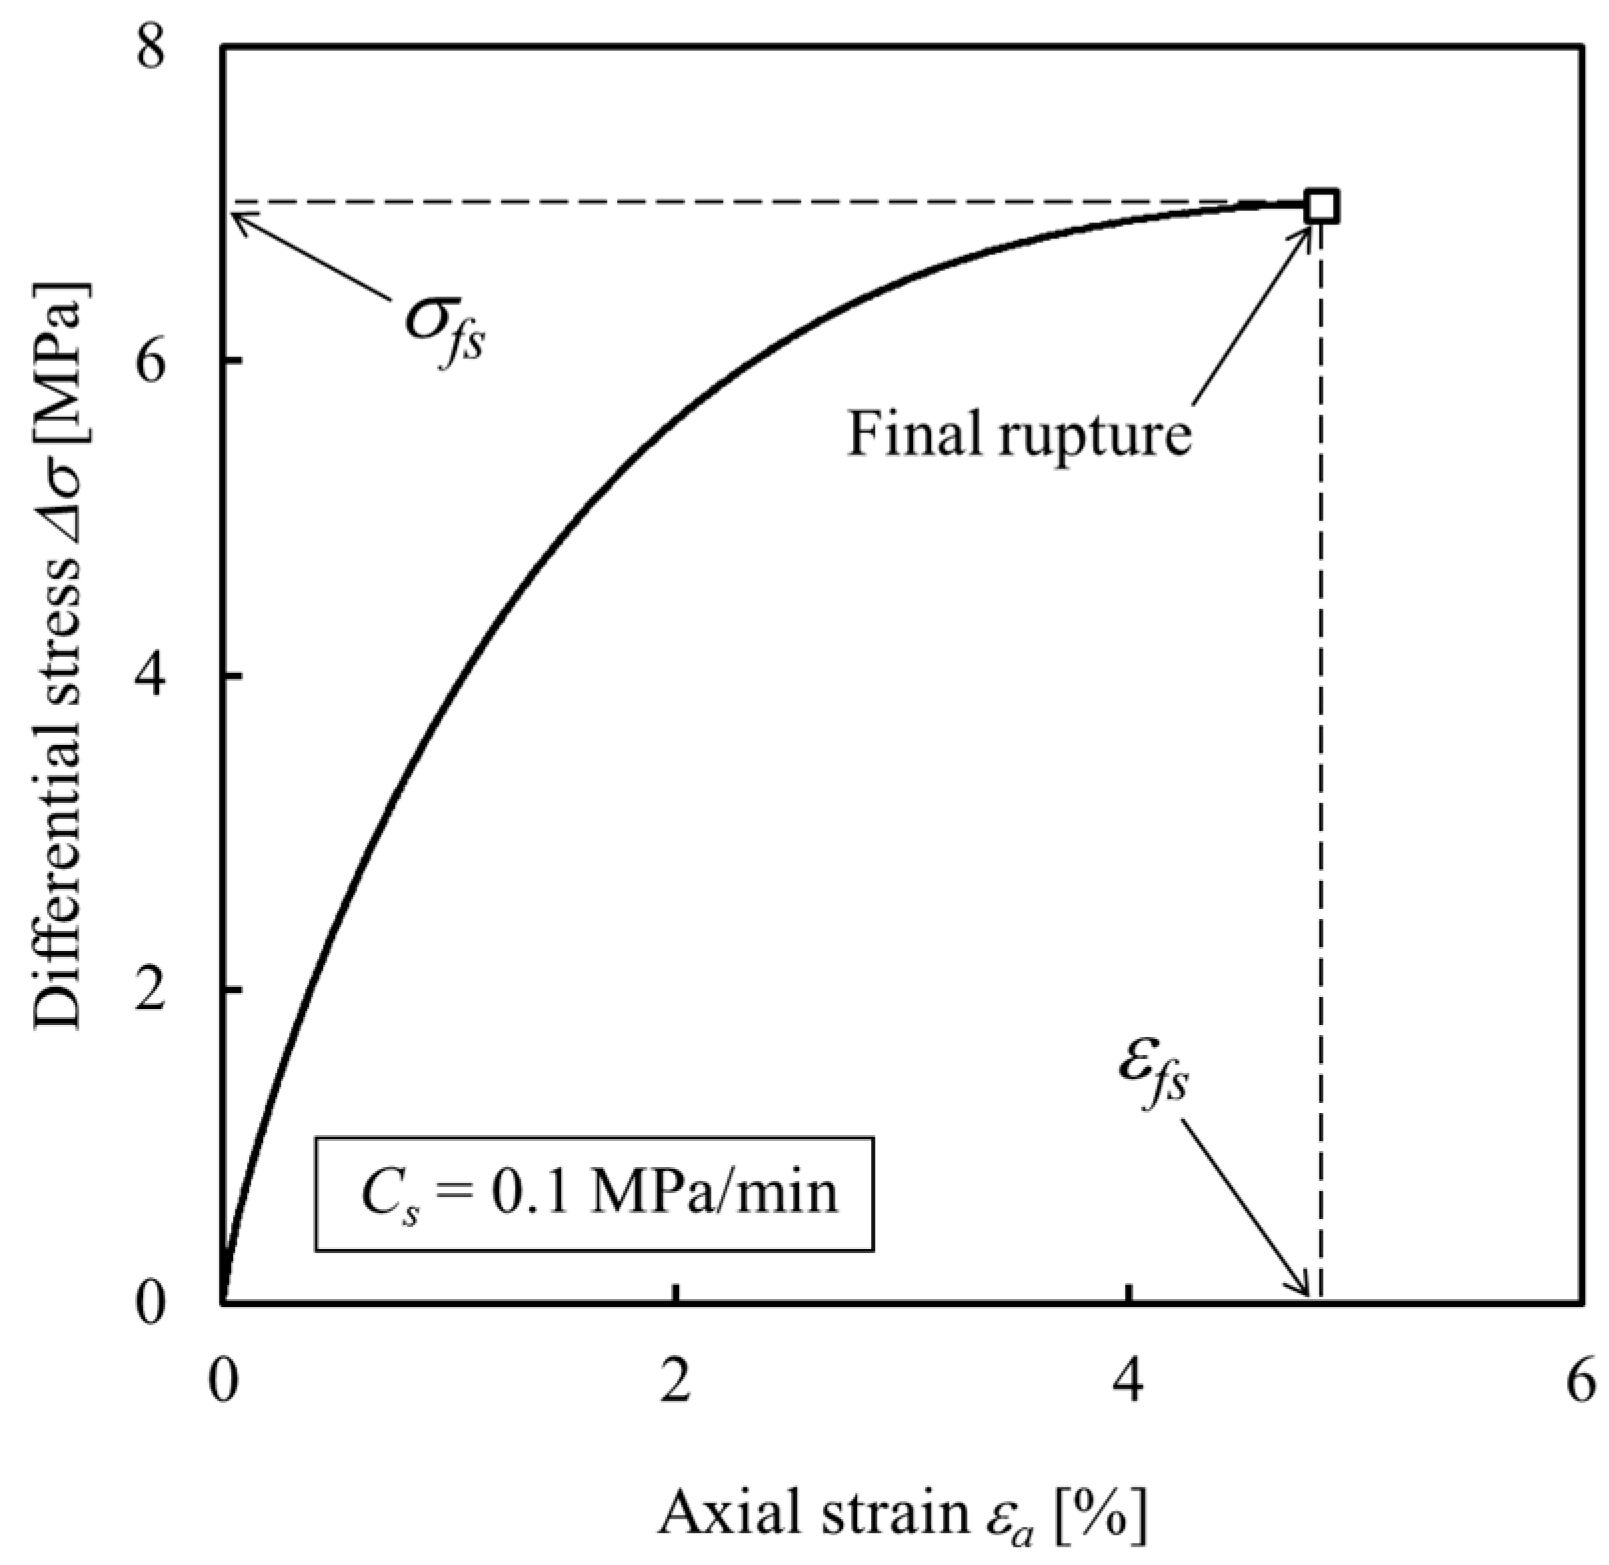
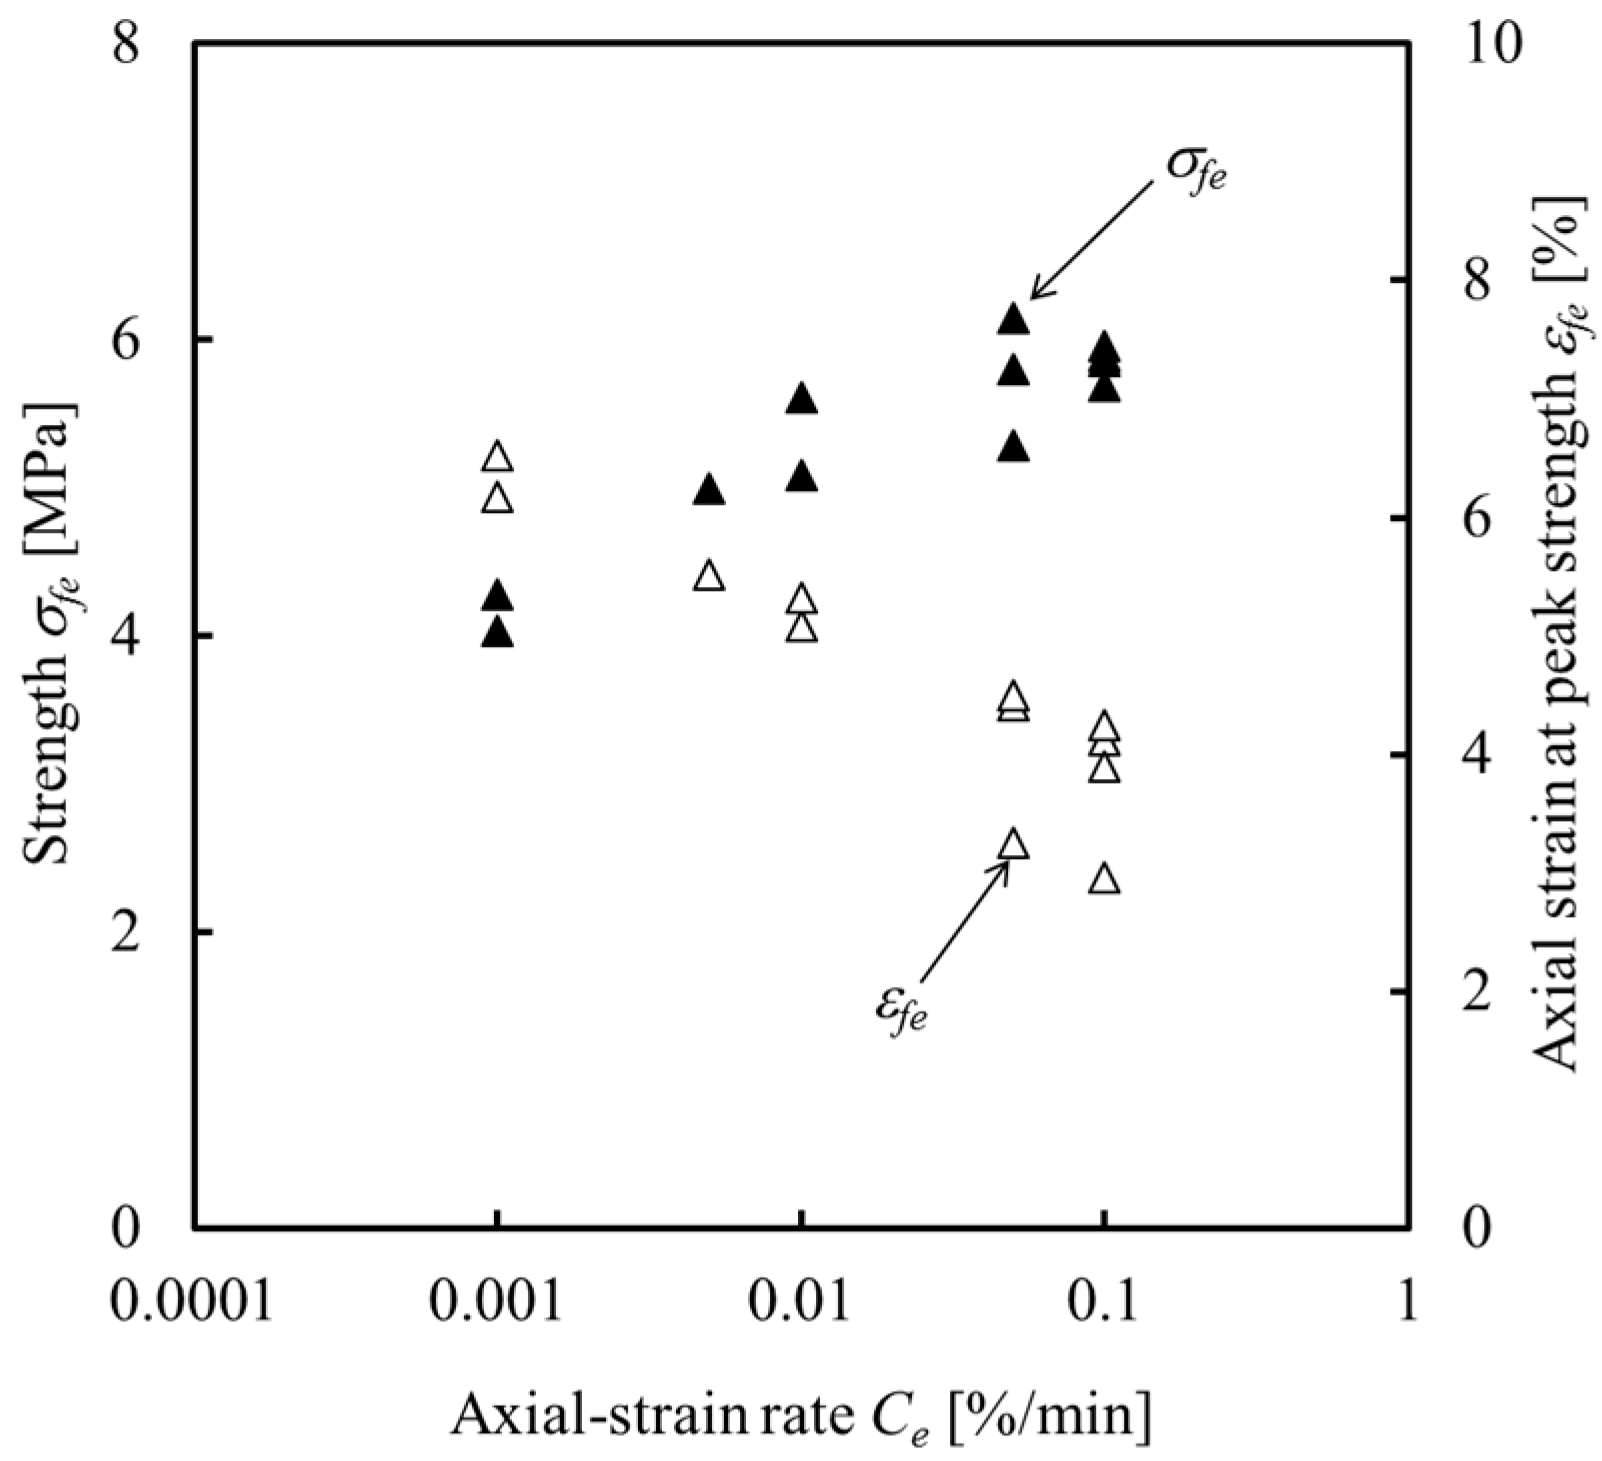
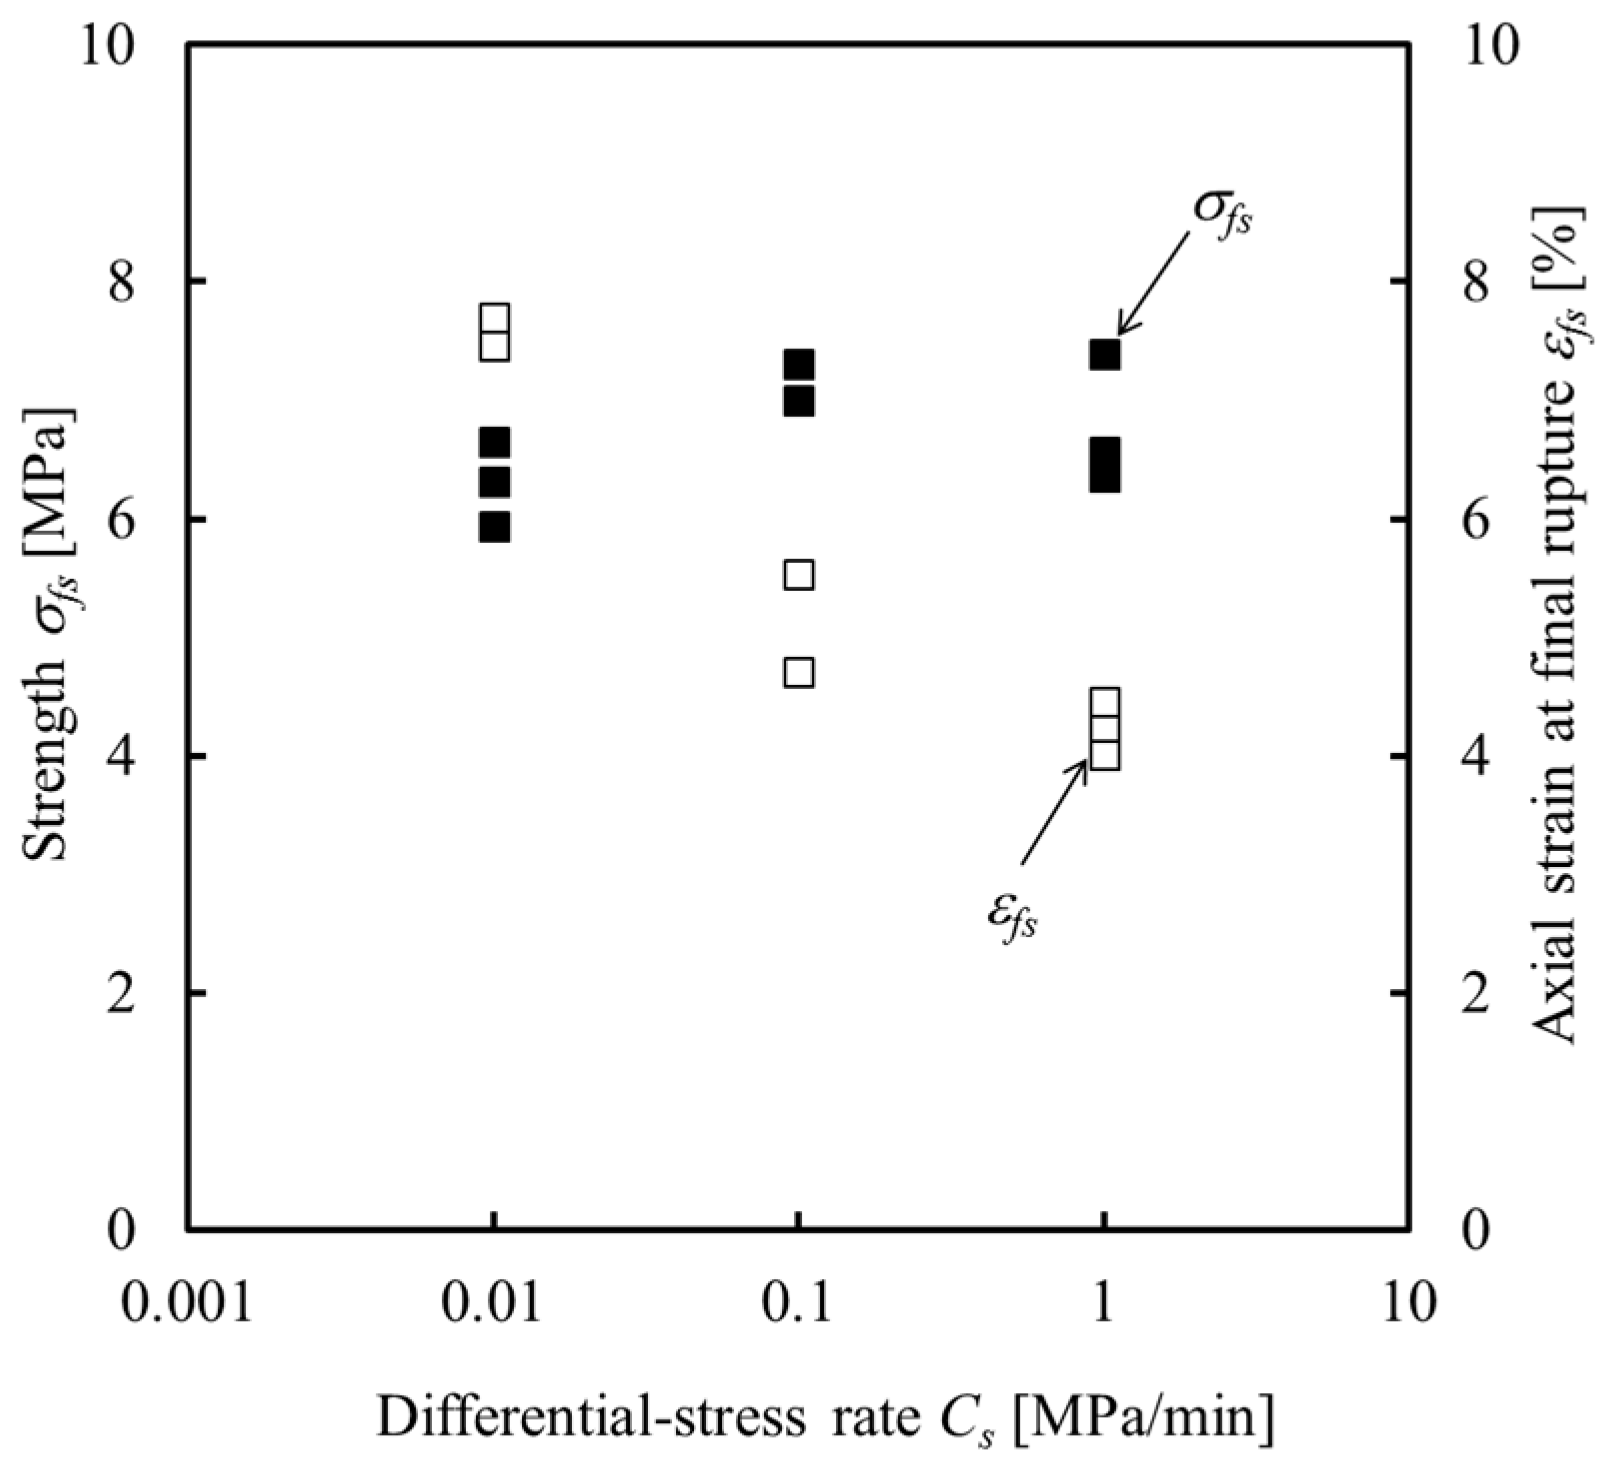
3.1. Constant-Loading-Rate Tests
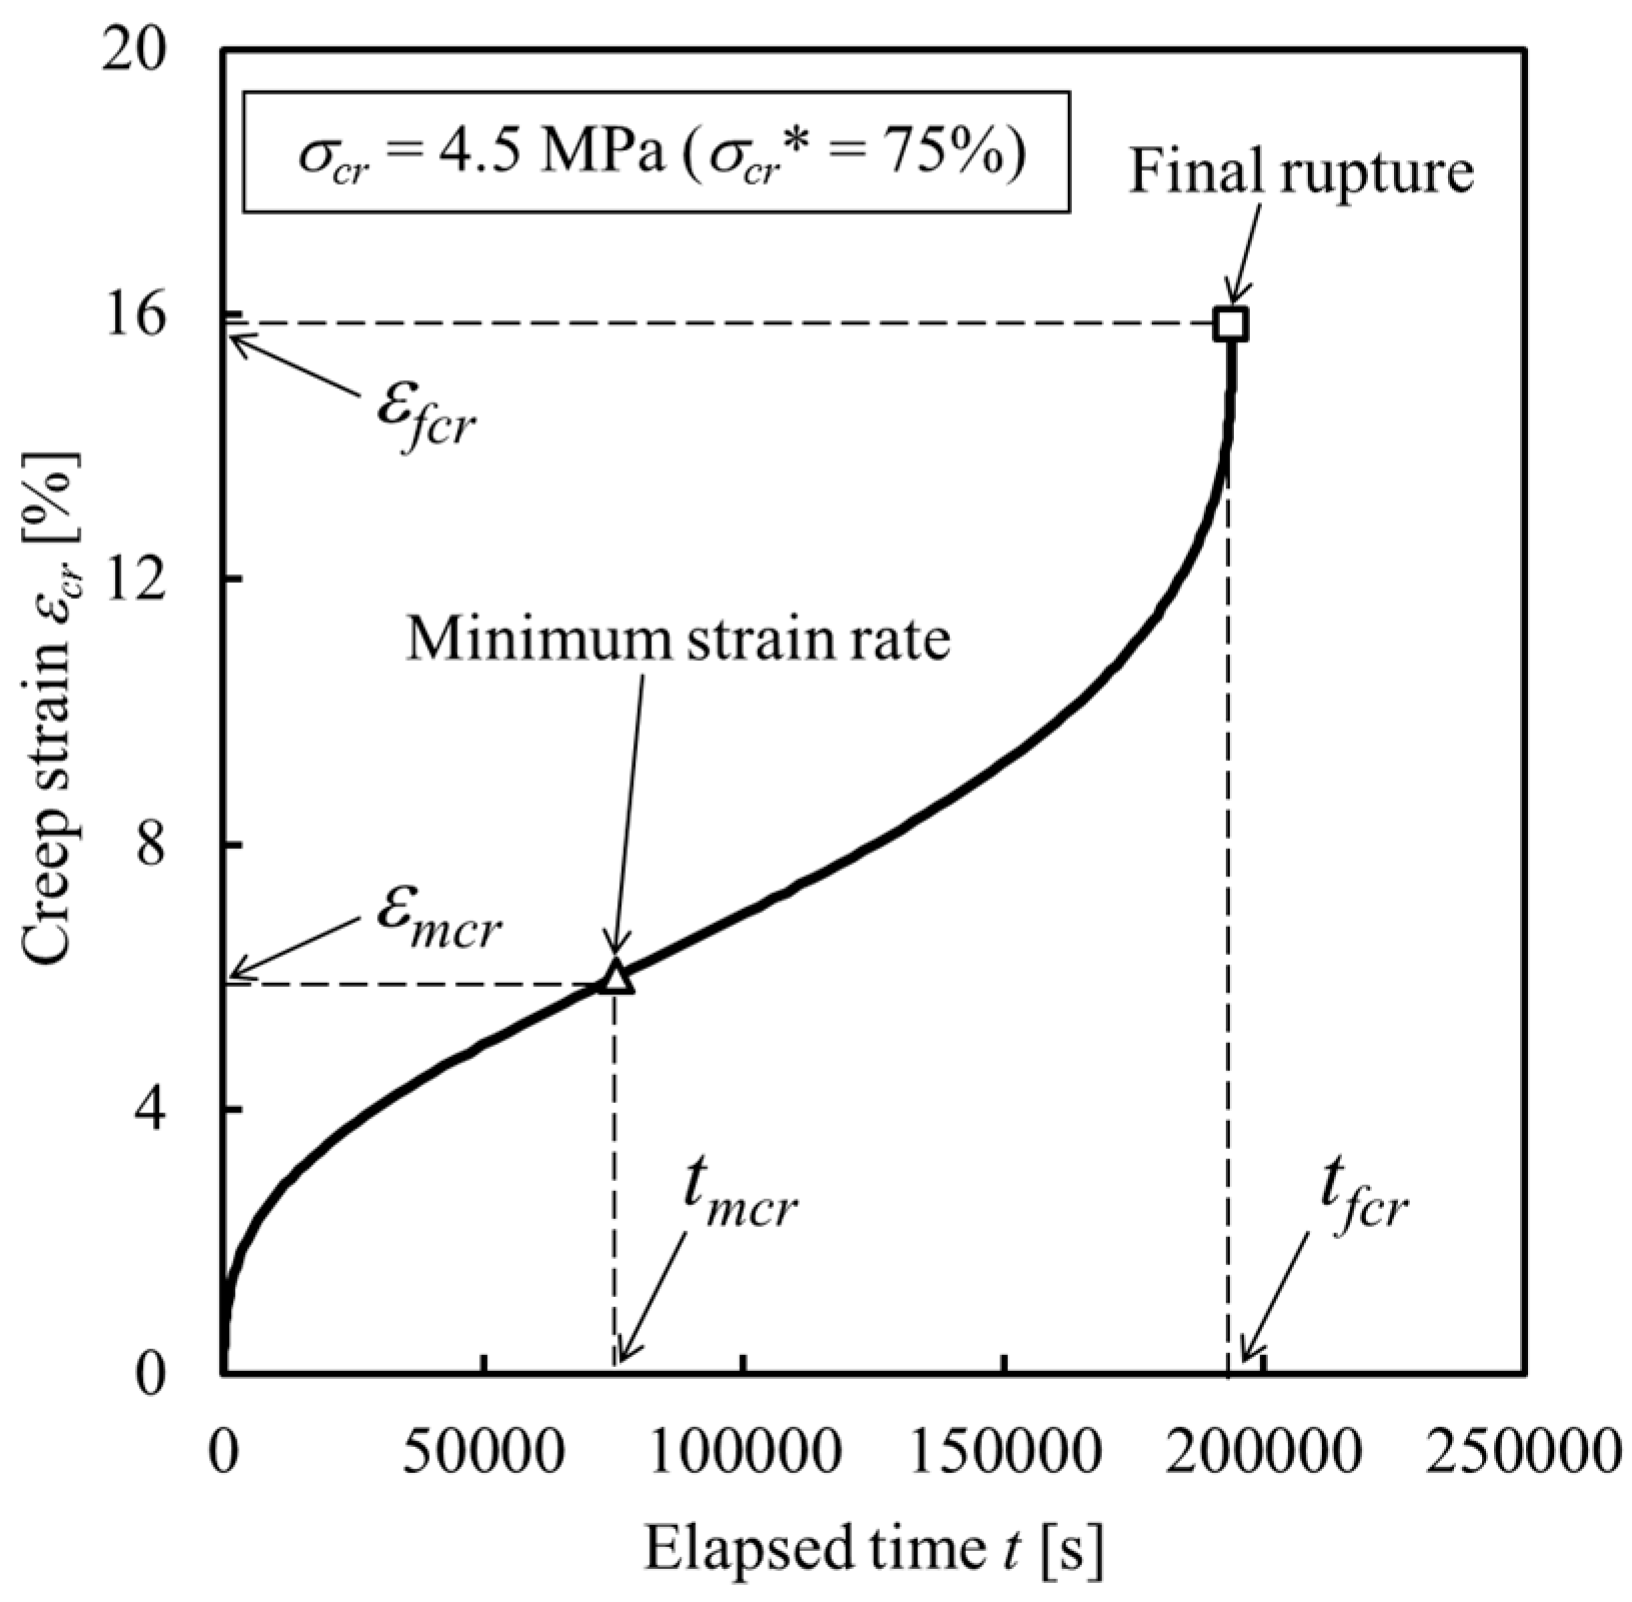
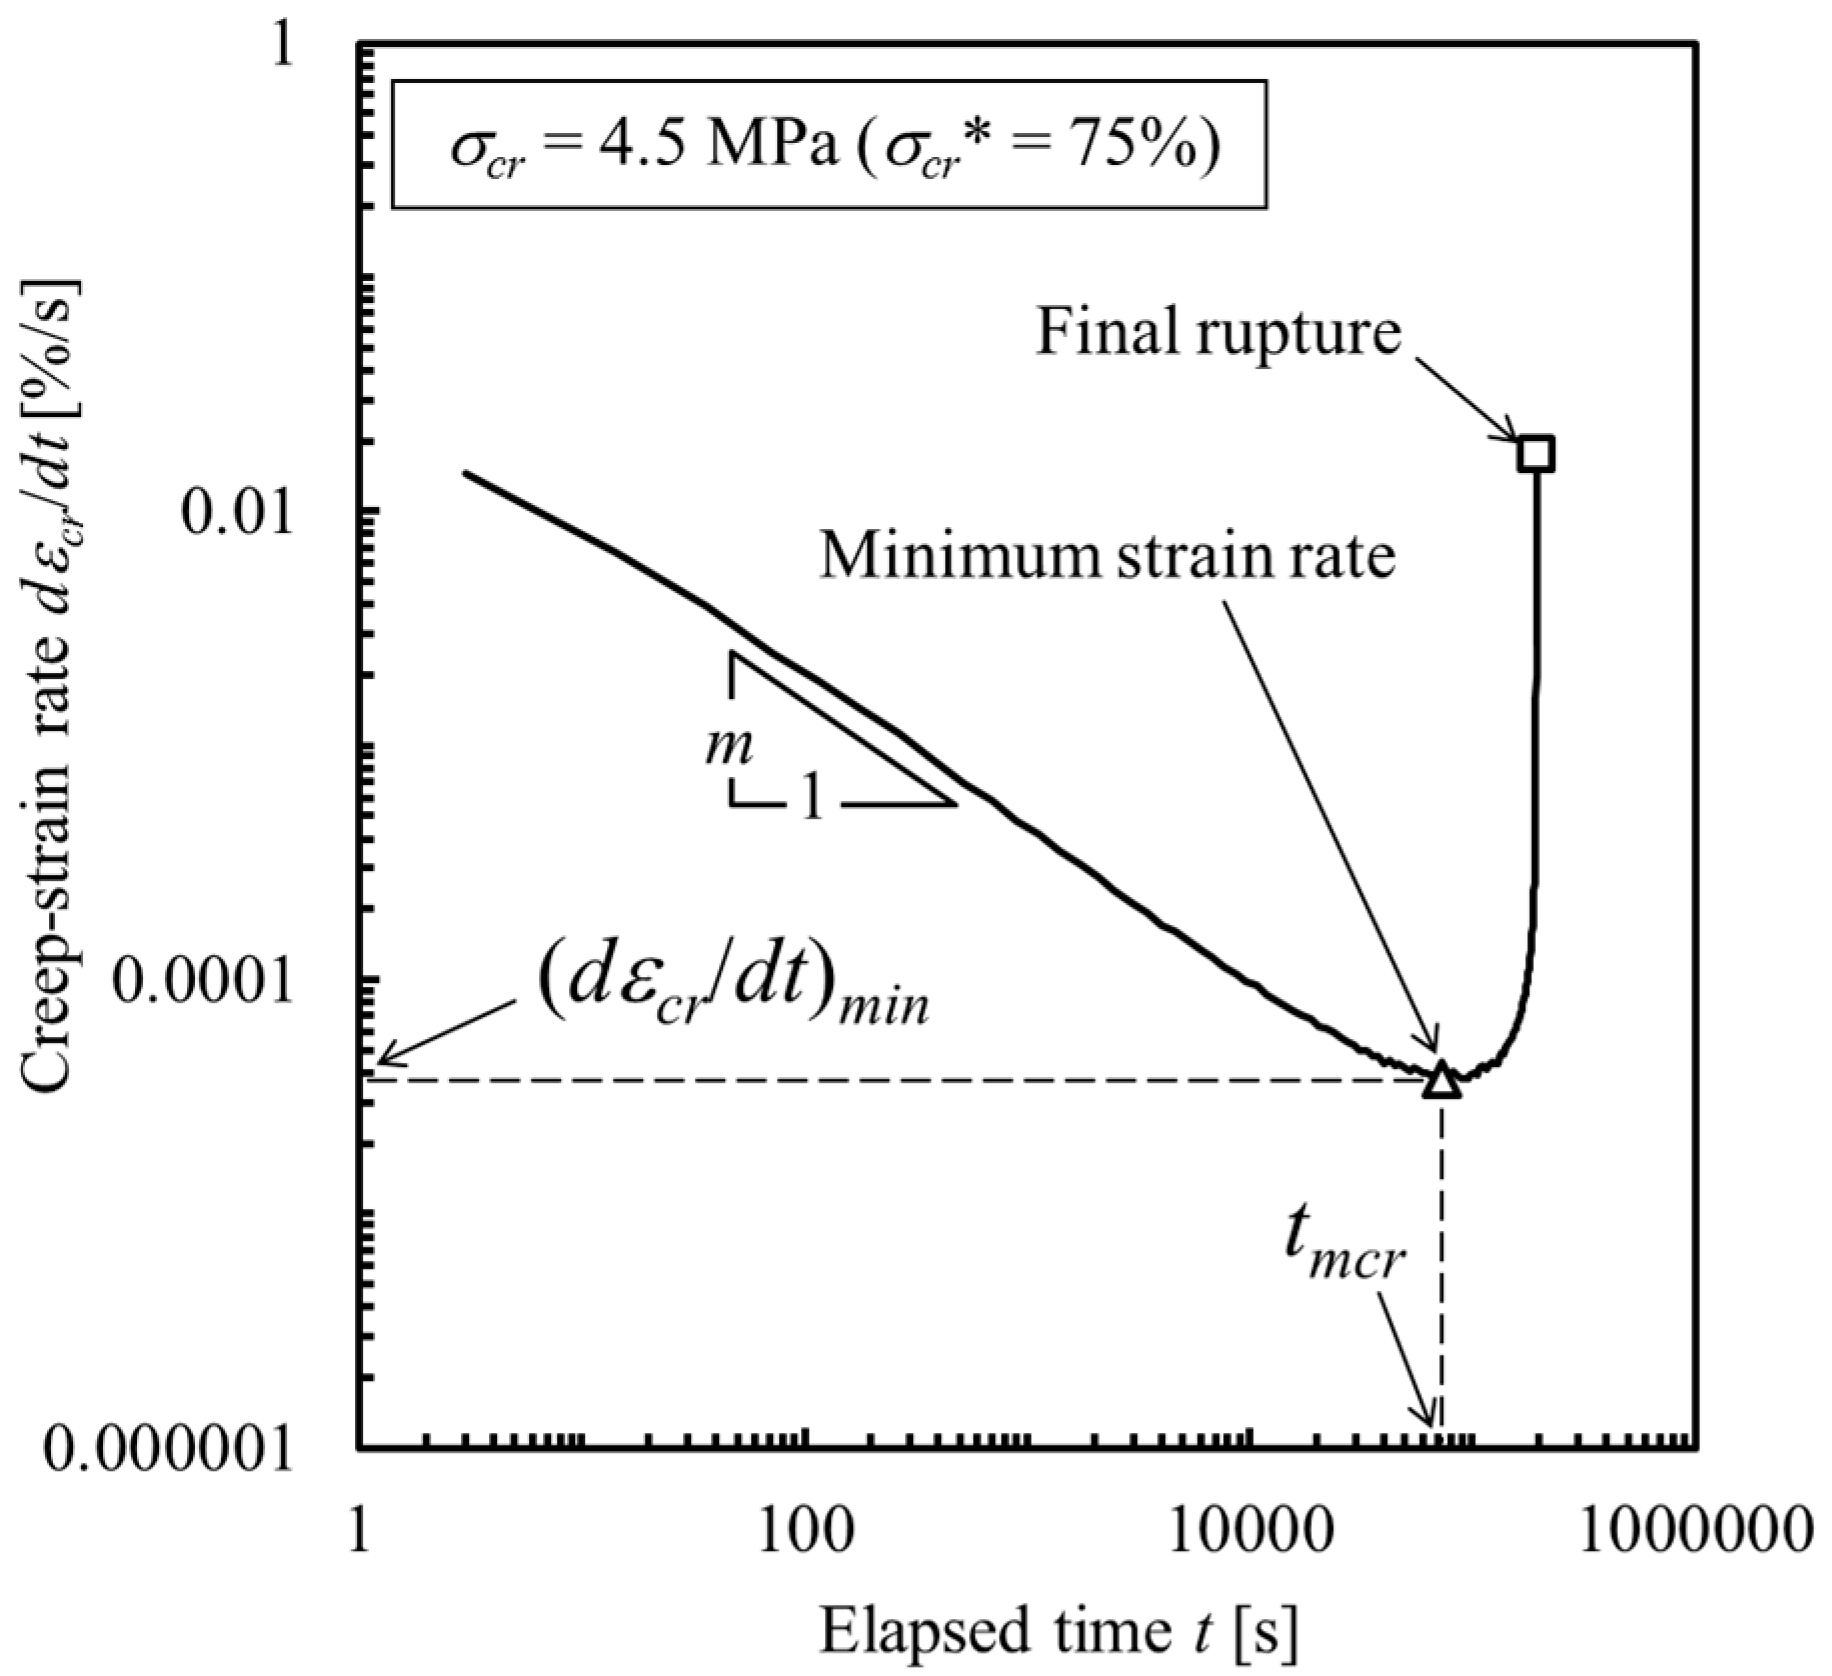
3.2. Creep Tests
4. Discussion
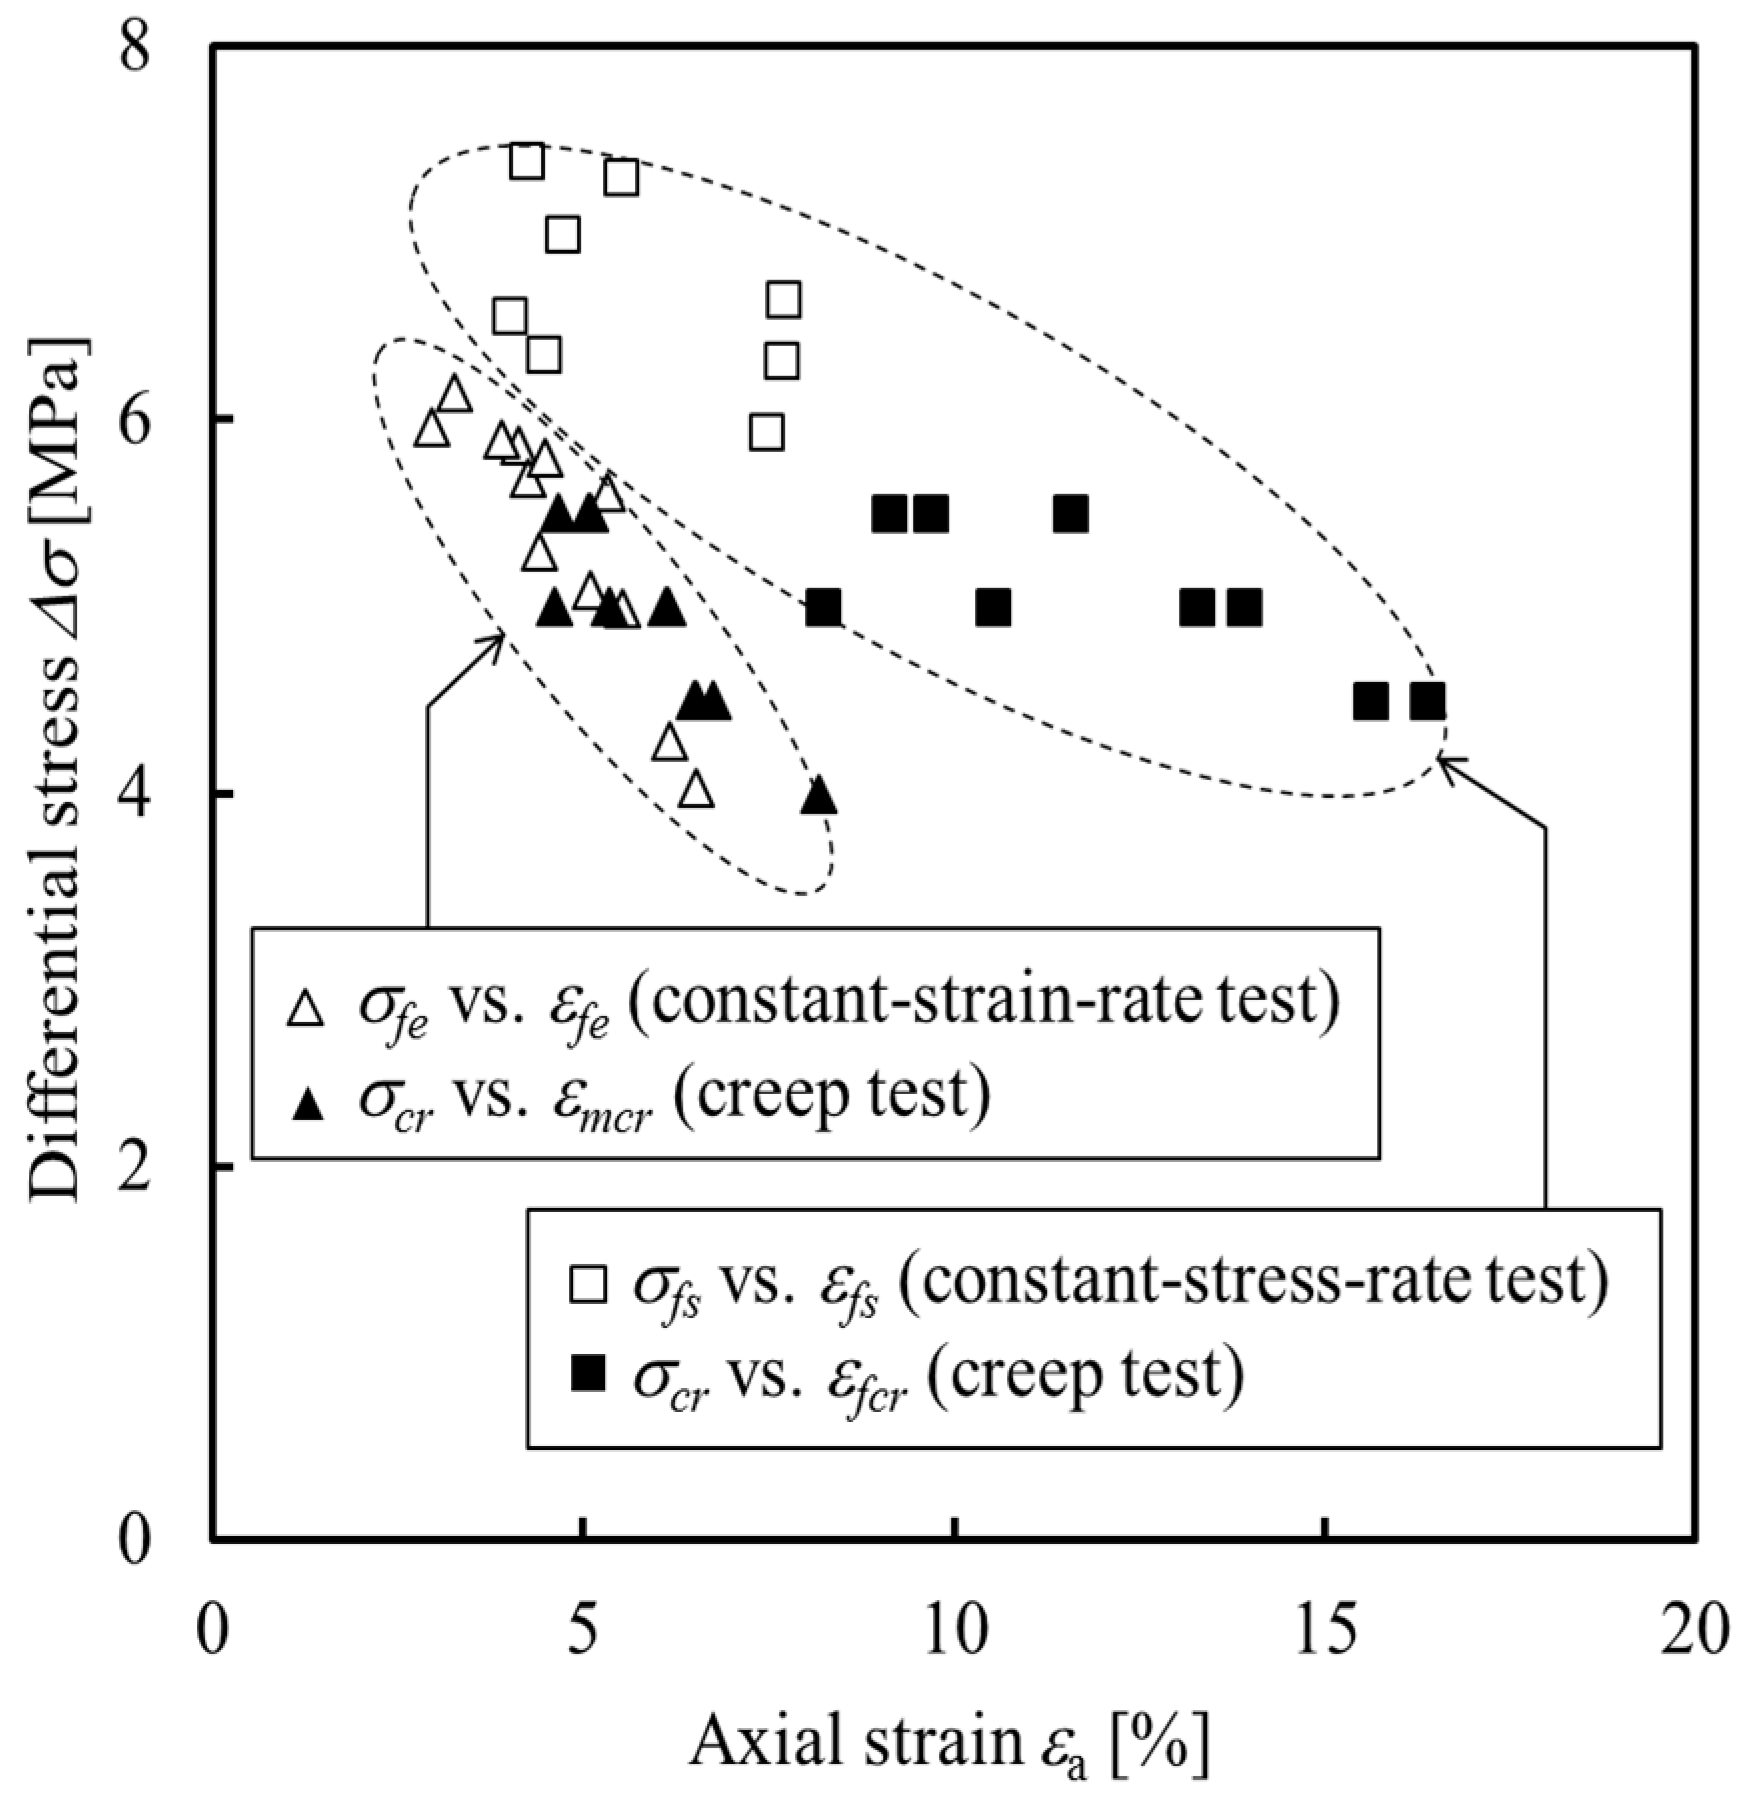
4.1. Differential Stresses Versus Axial Strains in Three Tests
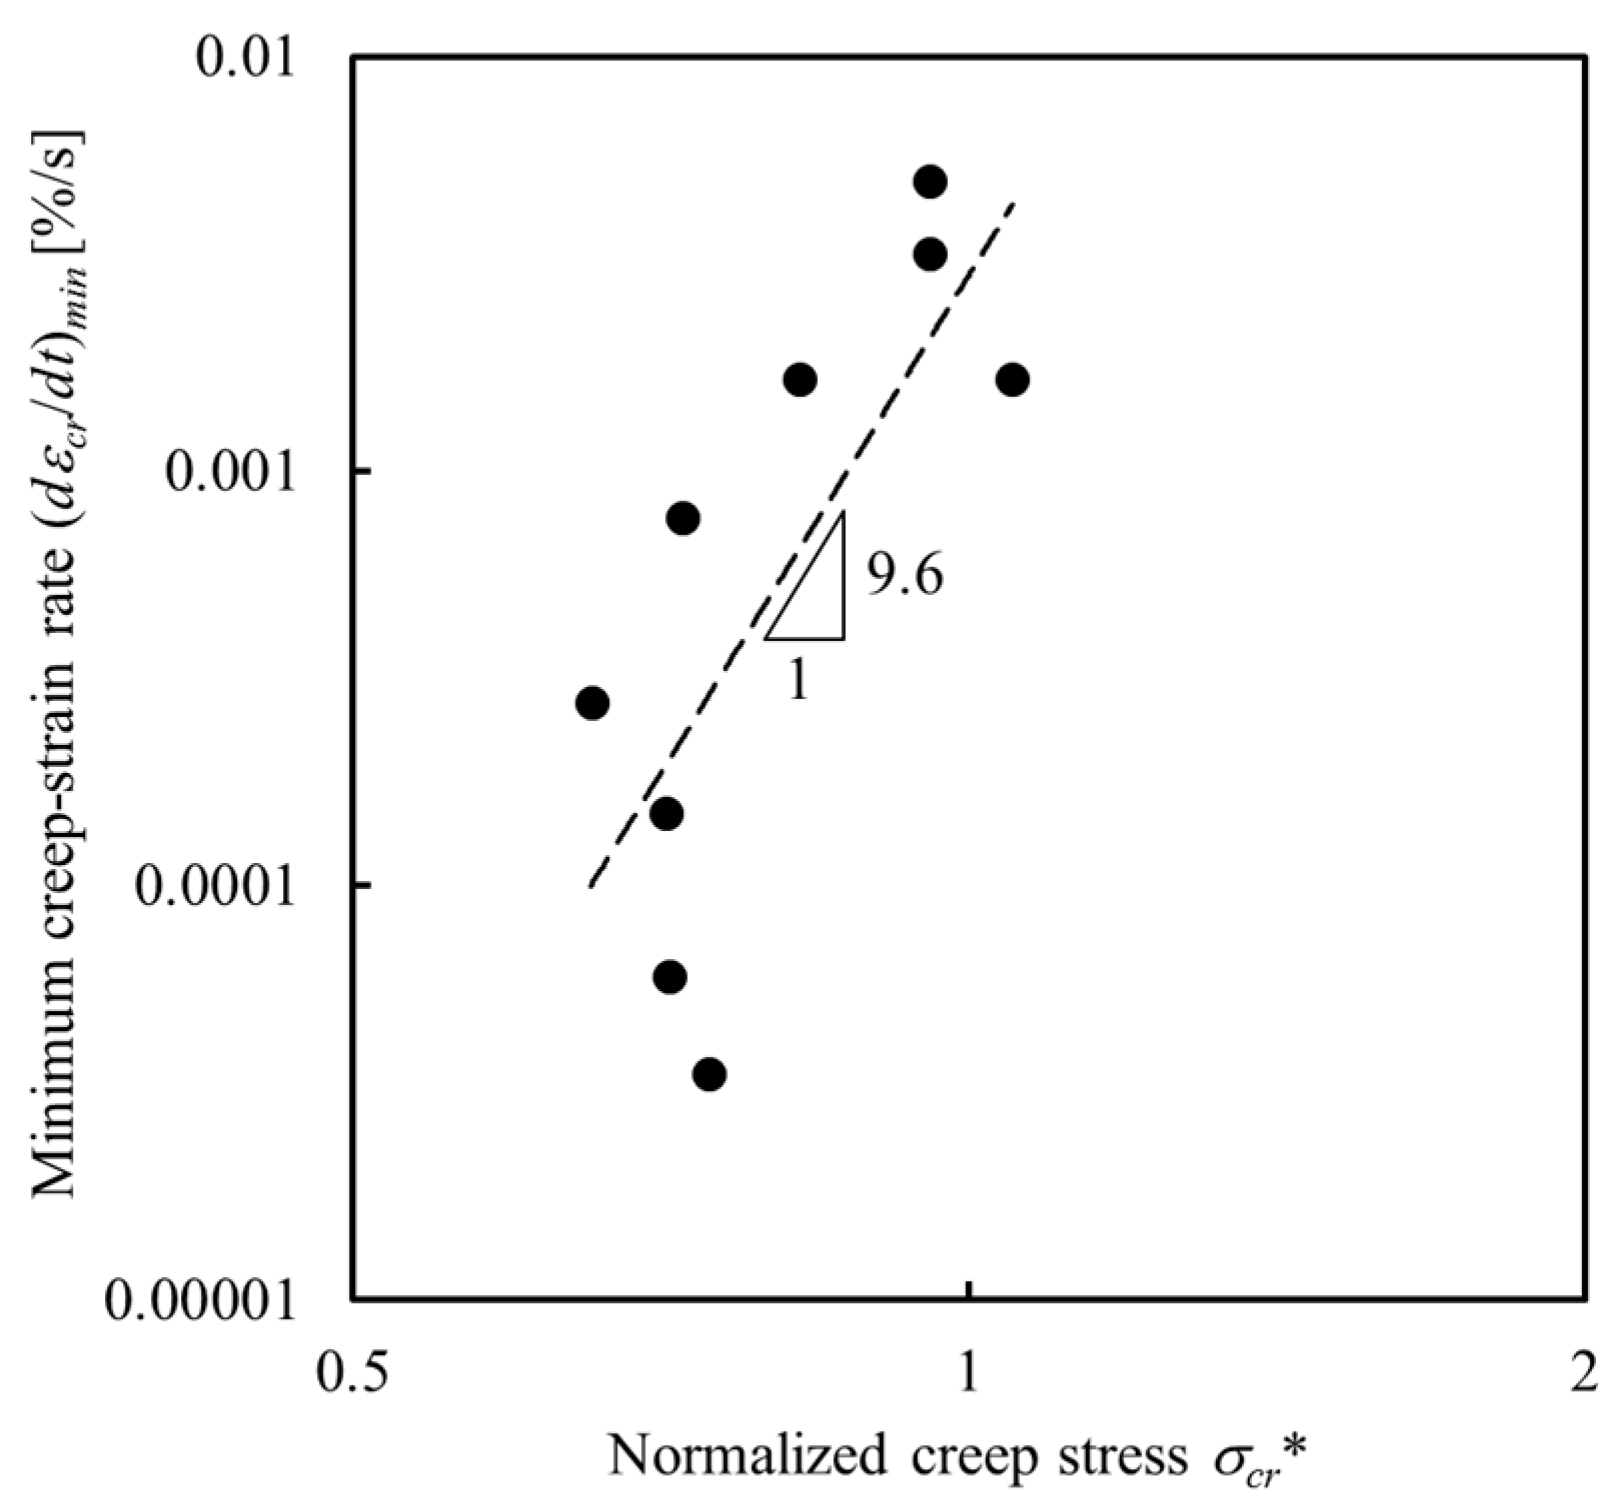
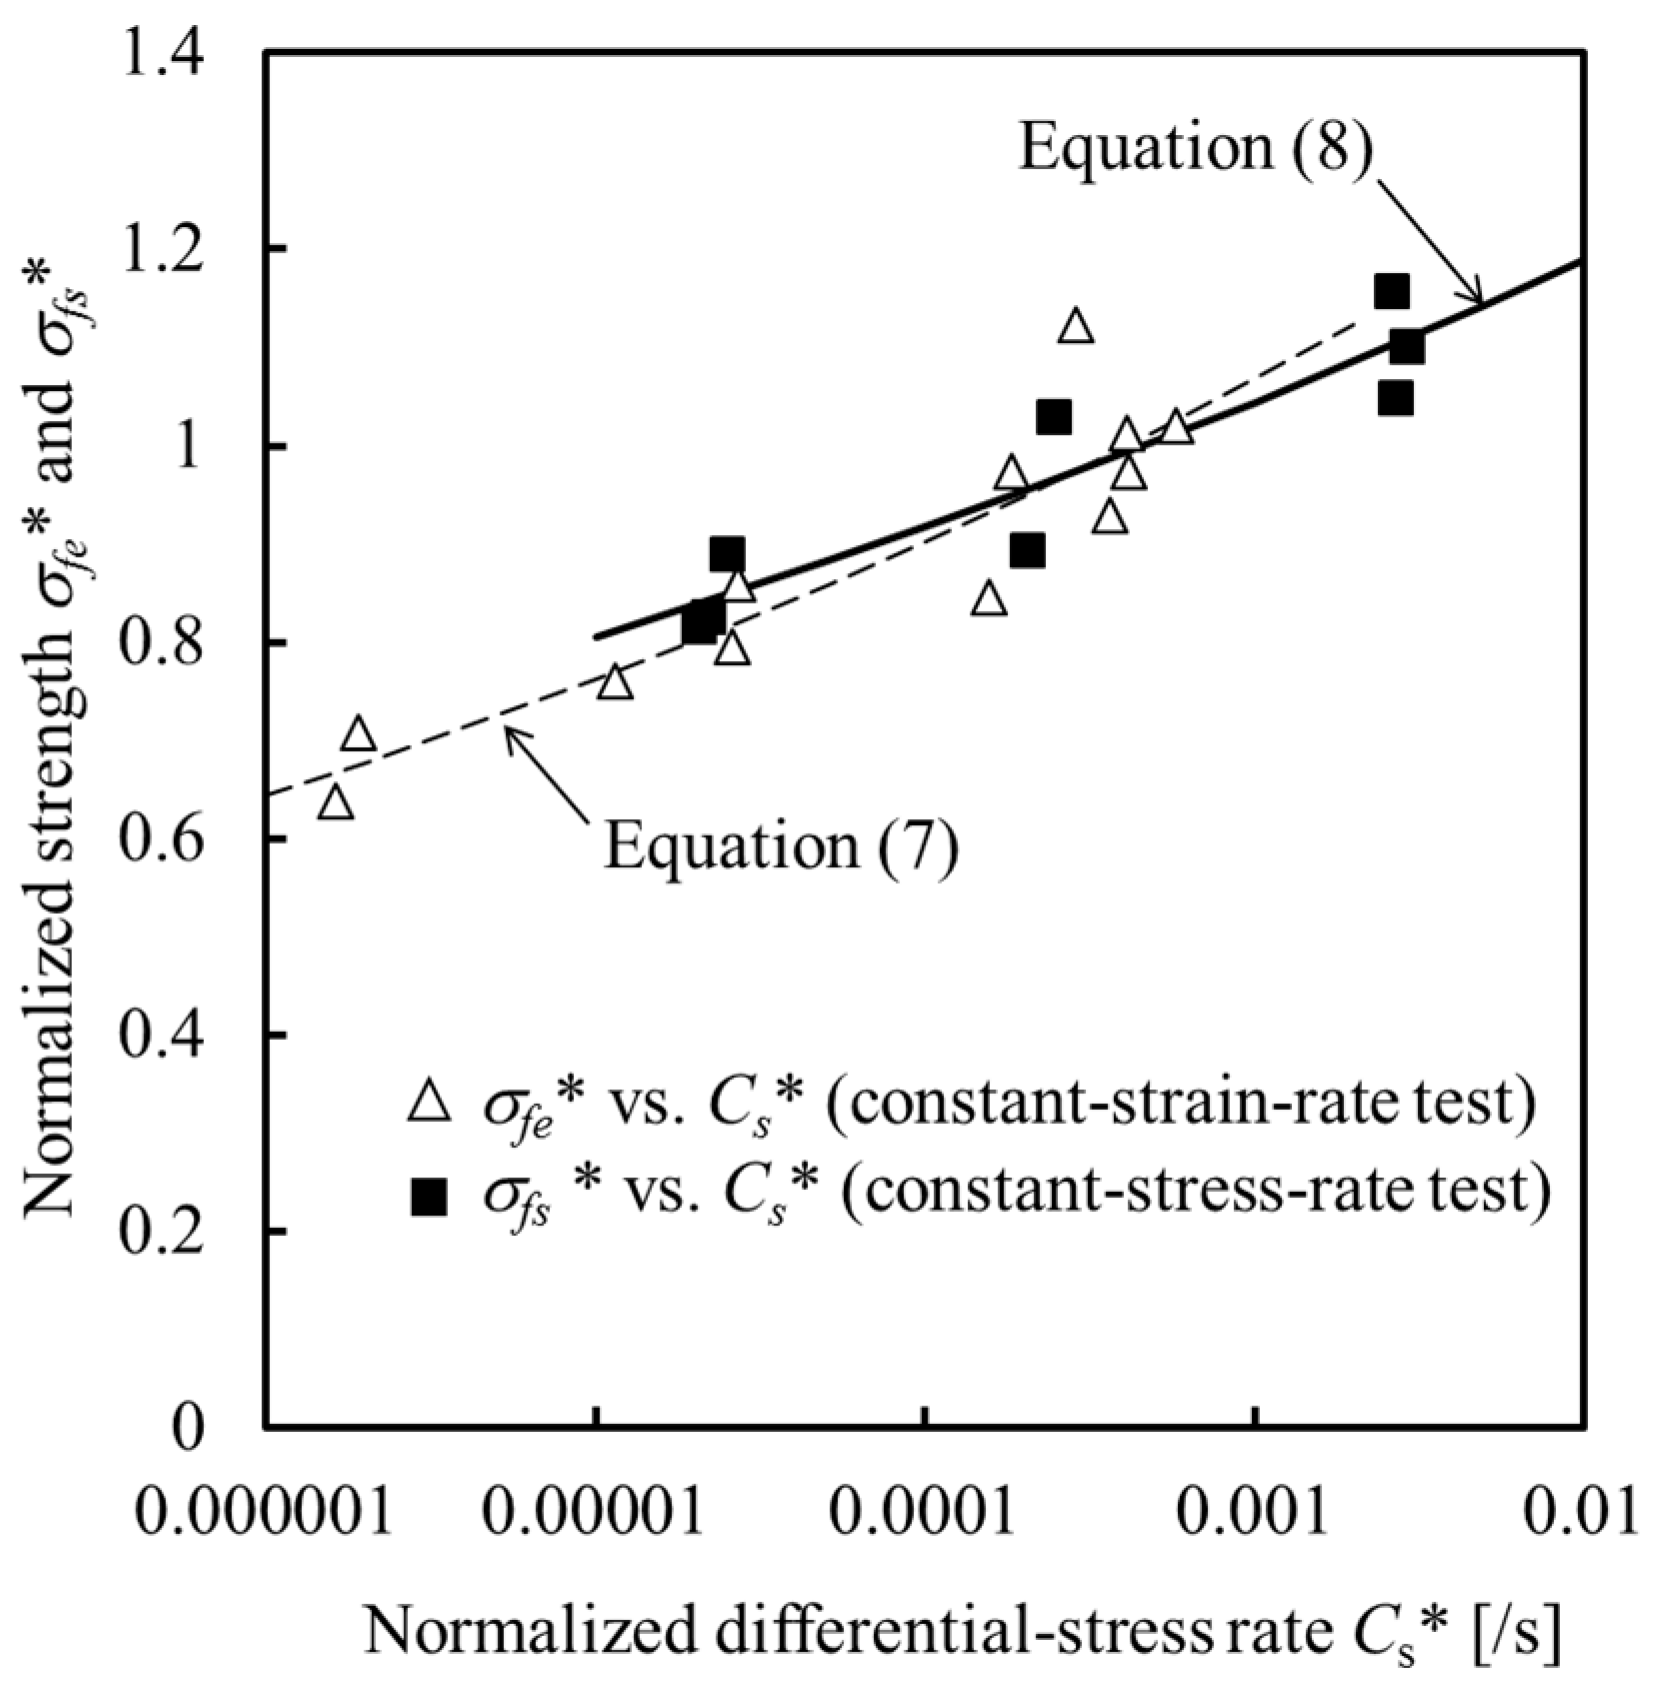
4.2. Loading-Rate Dependence of Strength
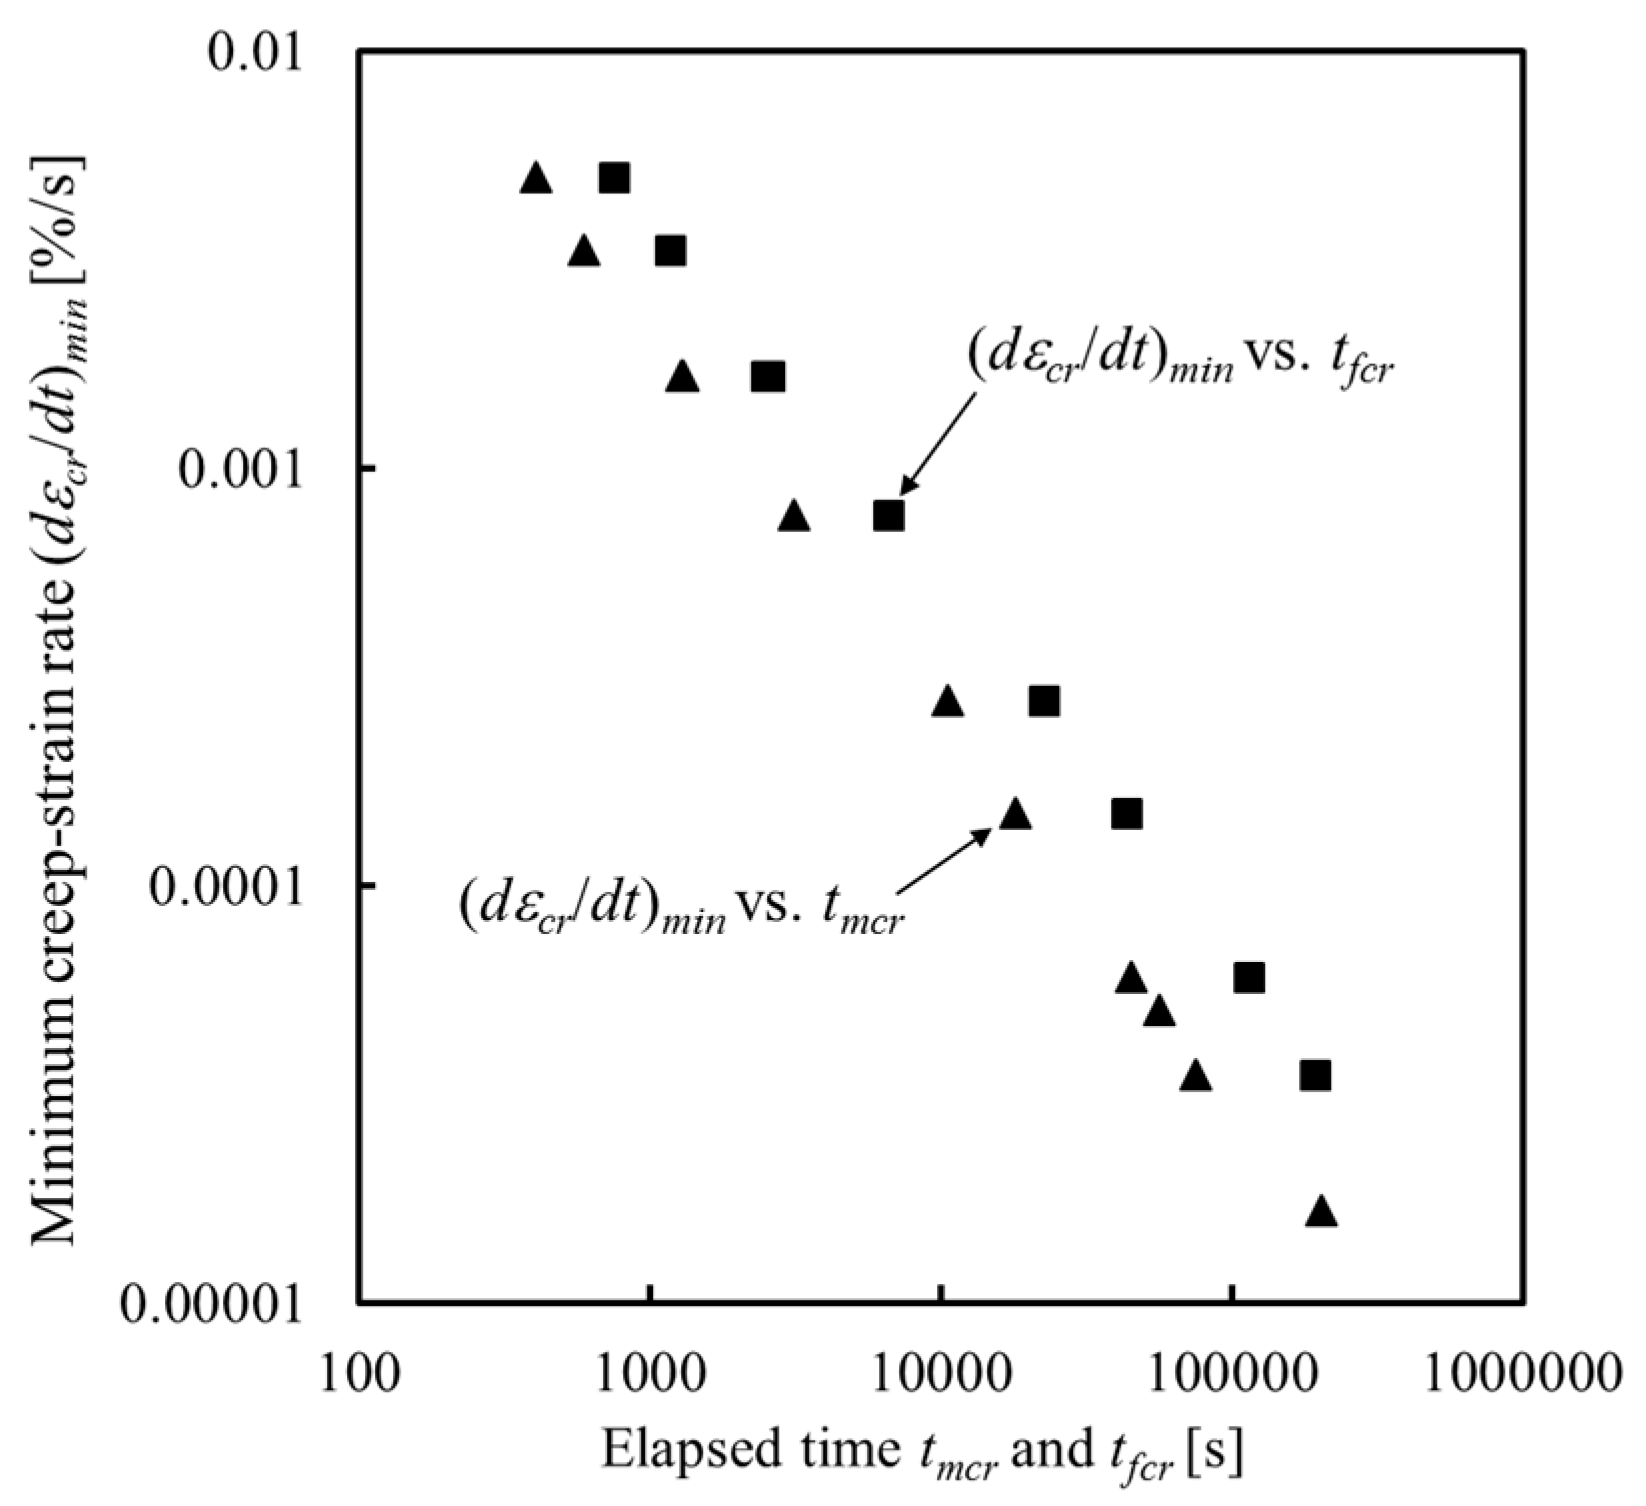
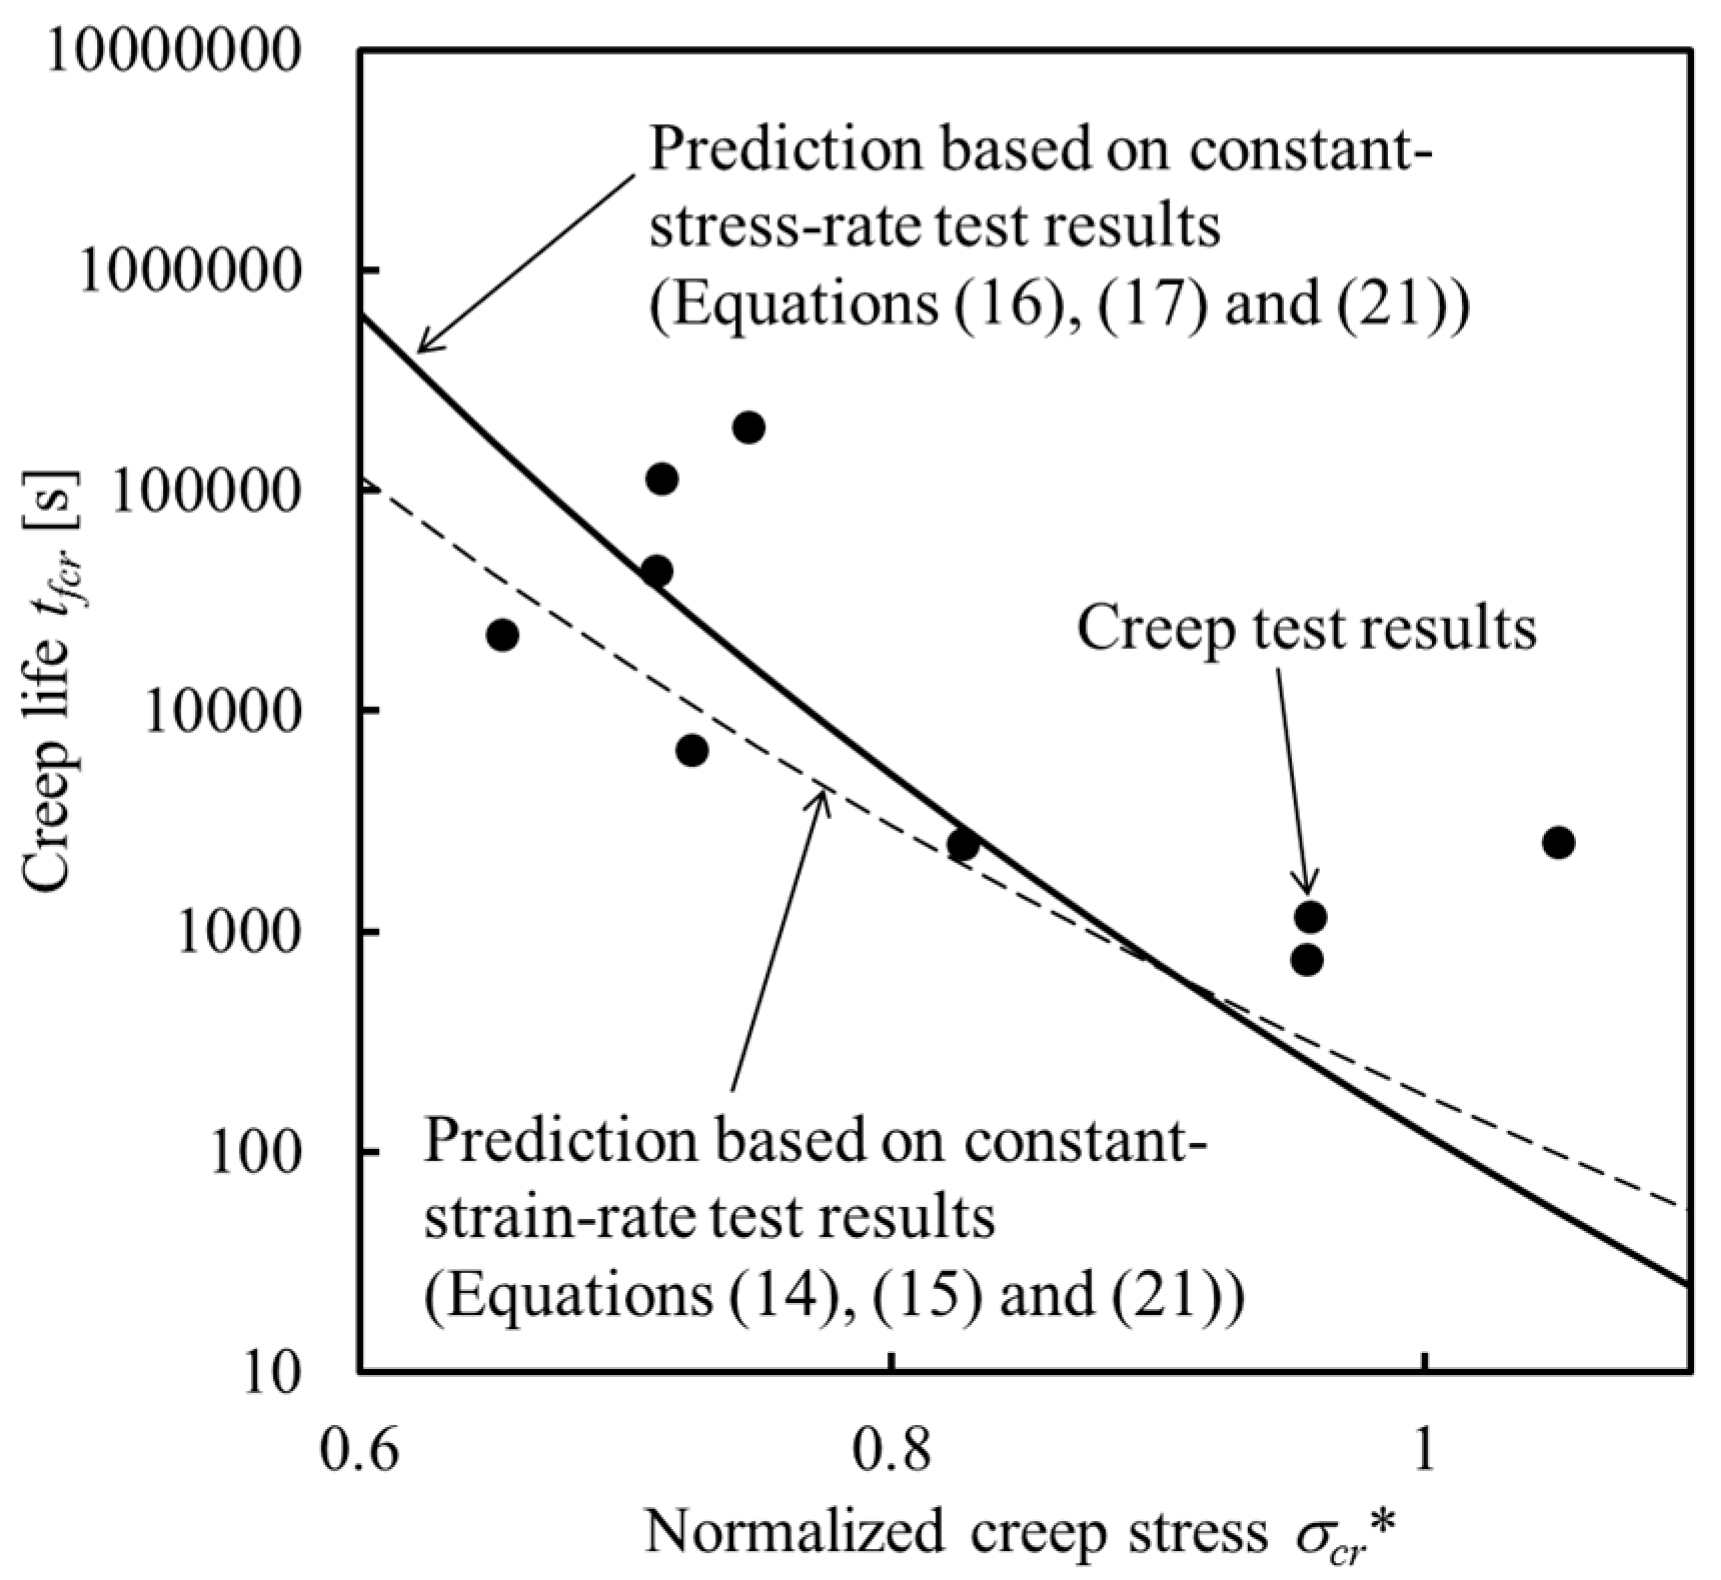
4.3. Creep Life
4.4. Review of Constitutive Models Proposed for Methane-Hydrate-Bearing Sediments
5. Conclusions
Acknowledgments
Author Contributions
Conflicts of Interest
References
- Makogon, Y.F. Hydrates of Natural Gas; Pennwell Publishing Co.: Tulsa, OK, USA, 1981. [Google Scholar]
- Makogon, Y.F. Perspectives for the Development of Gas-Hydrate Deposits. In Proceedings of the 4th Canadian Permafrost Conference, Calgary, AB, Canada, 2–6 March 1982; pp. 299–304. [Google Scholar]
- Kvenvolden, K.A. A Major Reservoir of Carbon in the Shallow Geosphere? Chem. Geol. 1988, 71, 41–51. [Google Scholar] [CrossRef]
- Kvenvolden, K.A.; Ginsburg, G.D.; Soloviev, V.A. Worldwide Distribution of Subaquatic Gas Hydrates. Geo-Mar. Lett. 1993, 13, 32–40. [Google Scholar]
- Collett, T.S.; Dallimore, S.R. Detailed Analysis of Gas Hydrate Induced Drilling and Production Hazards. In Proceedings of the 4th International Conference on Gas Hydrates, Yokohama, Japan, 19–23 May 2002; pp. 47–52. [Google Scholar]
- Bugge, T.; Belderson, R.H.; Kenyon, N.H. The Storegga Slide. Philos. Trans. R. Soc. A 1988, 325, 357–388. [Google Scholar] [CrossRef]
- Kleinberg, R.L. Mechanical Stability of Seafloor Sediments with Application to Gas Hydrate Deposits. In Proceedings of the 5th International Conference on Gas Hydrates, Trondheim, Norway, 13–16 June 2005; pp. 736–748. [Google Scholar]
- Sakamoto, Y.; Shimokawara, M.; Ohga, K.; Miyazaki, K.; Tenma, N.; Komai, T.; Aoki, K.; Yamaguchi, T. Field Scale Simulation for Consolidation and Gas Production Behavior during Depressurization Process of Methane Hydrate in Marine Sediments. In Proceedings of the 2008 Offshore Technology Conference, Houston, TX, USA, 5–8 May 2008. OTC19283. [Google Scholar]
- Rutqvist, J.; Moridis, G.J.; Grover, T.; Collett, T. Geomechanical Response of Permafrost-Associated Hydrate Deposits to Depressurization-Induced Gas Production. J. Petrol. Sci. Eng. 2009, 67, 1–12. [Google Scholar] [CrossRef]
- Kimoto, S.; Oka, F.; Fushita, T. A Chemo-Thermo-Mechanically Coupled Analysis of Ground Deformation Induced by Gas Hydrate Dissociation. Int. J. Mech. Sci. 2010, 52, 365–376. [Google Scholar] [CrossRef]
- Klar, A.; Soga, K.; Ng, M.Y.A. Coupled Deformation-Flow Analysis for Methane Hydrate Extraction. Geotechnique 2010, 60, 765–776. [Google Scholar] [CrossRef]
- Masui, A.; Haneda, H.; Ogata, Y.; Aoki, K. Effects of Methane Hydrate Formation on Shear Strength of Synthetic Methane Hydrate Sediments. In Proceedings of the 15th International Offshore and Polar Engineering Conference, Seoul, Korea, 19–24 June 2005; pp. 364–369. [Google Scholar]
- Winters, W.J.; Waite, W.F.; Mason, D.H.; Gilbert, L.Y.; Pecher, I.A. Effect of Grain Size and Pore Pressure on Acoustic and Strength Behavior of Sediments Containing Methane Gas Hydrate. In Proceedings of the 5th International Conference on Gas Hydrates, Trondheim, Norway, 13–16 June 2005; pp. 507–516. [Google Scholar]
- Hyodo, M.; Nakata, Y.; Yoshimoto, N.; Ebinuma, T. Basic Research on the Mechanical Behavior of Methane Hydrate-Sediments Mixture. Soils Found. 2005, 45, 75–85. [Google Scholar]
- Clayton, C.R.I.; Priest, J.A.; Best, A.I. The Effects of Disseminated Methane Hydrate on the Dynamic Stiffness and Damping of a Sand. Geotechnique 2005, 55, 423–434. [Google Scholar] [CrossRef]
- Clayton, C.R.I.; Priest, J.A.; Rees, E.V.L. The Effects of Hydrate Cement on the Stiffness of Some Sands. Geotechnique 2010, 60, 435–445. [Google Scholar] [CrossRef]
- Miyazaki, K.; Masui, A.; Tenma, N.; Ogata, Y.; Aoki, K.; Yamaguchi, T.; Sakamoto, Y. Study on Mechanical Behavior for Methane Hydrate Sediment Based on Constant Strain-Rate Test and Unloading-Reloading Test Under Triaxial Compression. Int. J. Offshore Polar Eng. 2010, 20, 61–67. [Google Scholar]
- Miyazaki, K.; Masui, A.; Aoki, K.; Sakamoto, Y.; Yamaguchi, T.; Okubo, S. Strain-Rate Dependence of Triaxial Compressive Strength of Artificial Methane-Hydrate-Bearing Sediment. Int. J. Offshore Polar Eng. 2010, 20, 256–264. [Google Scholar]
- Miyazaki, K.; Masui, A.; Sakamoto, Y.; Aoki, K.; Tenma, N.; Yamaguchi, T. Triaxial Compressive Properties of Artificial Methane-Hydrate-Bearing Sediment. J. Geophys. Res. 2011, 116, B06102. [Google Scholar] [CrossRef]
- Miyazaki, K.; Tenma, N.; Aoki, K.; Sakamoto, Y.; Yamaguchi, T. Effects of Confining Pressure on Mechanical Properties of Artificial Methane-Hydrate-Bearing Sediment in Triaxial Compression Test. Int. J. Offshore Polar Eng. 2011, 21, 148–154. [Google Scholar]
- Miyazaki, K.; Yamaguchi, T.; Sakamoto, Y.; Aoki, K. Time-Dependent Behaviors of Methane-Hydrate Bearing Sediments in Triaxial Compression Test. Int. J. JCRM 2011, 7, 43–48. [Google Scholar]
- Miyazaki, K.; Sakamoto, Y.; Aoki, K.; Tenma, N.; Yamaguchi, T.; Okubo, S. Creep Property of Artificial Methane-Hydrate-Bearing Rock. In Proceedings of the 12th ISRM International Congress on Rock Mechanics, Beijing, China, 18–21 October 2011; pp. 747–750. [Google Scholar]
- Miyazaki, K.; Tenma, N.; Sakamoto, Y.; Yamaguchi, T.; Okubo, S. Effects of Methane Hydrate Saturation and Confining Pressure on Strain-Rate Dependence of Artificial Methane-Hydrate-Bearing Sediment in Triaxial Compression Test. Int. J. Offshore Polar Eng. 2012, 22, 90–96. [Google Scholar]
- Miyazaki, K.; Endo, Y.; Tenma, N.; Yamaguchi, T. Effects of Particle Size Distribution on Viscoelasticity of Artificial Methane-Hydrate-Bearing Sand. Int. J. Offshore Polar Eng. 2015, 25, 112–119. [Google Scholar]
- Yoneda, J.; Hyodo, M.; Nakata, Y.; Yoshimoto, N. Time-Dependent Elasto-Plastic Constitutive Equation for Sedimentary Sands Supported by Methane Hydrate. In Proceedings of the 12th Japan Symposium on Rock Mechanics, Ube, Japan, 2–4 September 2008; pp. 431–436. [Google Scholar]
- Miyazaki, K.; Tenma, N.; Endo, Y.; Yamaguchi, T. A Viscoelastic Constitutive Equation for Methane-Hydrate-Bearing Sand. In Proceedings of the 8th Asian Rock Mechanics Symposium (ARMS 8), Sapporo, Japan, 14–16 October 2014. [Google Scholar]
- Miyazaki, K.; Endo, Y.; Tenma, N.; Yamaguchi, T. A Nonlinear Viscoelastic Constitutive Equation for Artificial Methane-Hydrate-Bearing Sand under Triaxial Compression. In Proceedings of the 8th International Conference on Gas Hydrates, Beijing, China, 28 July–1 August 2014. [Google Scholar]
- Hyodo, M.; Nakata, Y.; Orense, R.; Yoshimoto, N.; Yoneda, J. Elastoplastic Constitutive Equation for Methane Hydrate-Supported Sand in Deep Seabed. In Proceedings of the 14th International Symposium on Plasticity and Its Current Applications, Kona, HA, USA, 3–8 January 2008; pp. 349–351. [Google Scholar]
- Uchida, S.; Soga, K.; Yamamoto, K. Critical State Soil Constitutive Model for Methane Hydrate Soil. J. Geophys. Res. 2012, 117, B03209. [Google Scholar] [CrossRef]
- Miyazaki, K.; Tenma, N.; Aoki, K.; Yamaguchi, T. A Nonlinear Elastic Model for Triaxial Compressive Properties of Artificial Methane-Hydrate-Bearing Sediment Samples. Energies 2012, 5, 4057–4075. [Google Scholar] [CrossRef]
- Parameswaran, V.R. Deformation Behaviour and Strength of Frozen Sand. Can. Geotech. J. 1980, 17, 74–88. [Google Scholar] [CrossRef]
- Ting, J.M.; Martin, R.T. Application of the Andrade Equation to Creep Data for Ice and Frozen Soil. Cold Reg. Sci. Technol. 1979, 1, 29–36. [Google Scholar] [CrossRef]
- Ting, J.M. On The Nature of the Minimum Creep Rate—Time Correlation for Soil, Ice, and Frozen Soil. Can. Geotech. J. 1983, 20, 176–182. [Google Scholar] [CrossRef]
- Sales, F.H. Creep of Frozen Sands; CRREL Technical Report 190; Army Cold Regions Research and Engineering Laboratory: Hanover, NH, USA, 1968. [Google Scholar]
- Sales, F.H.; Haines, D. Creep of Frozen Silt and Clay; CRREL Technical Report 252; Army Cold Regions Research and Engineering Laboratory: Hanover, NH, USA, 1974. [Google Scholar]
- Murayama, S.; Michihiro, K.; Sakagami, T. Creep Characteristics of Sands. Soils Found. 1984, 24, 1–15. [Google Scholar] [CrossRef]
- Okubo, S.; Nishimatsu, Y.; Fukui, K. Complete Creep Curves under Uniaxial Compression. Int. J. Rock Mech. Min. Sci. Geomech. Abstr. 1991, 28, 77–82. [Google Scholar] [CrossRef]
- Fukui, K.; Okubo, S.; Nishimatsu, Y. Complete Creep Curve and Its Implication in Long-Term Stability of Underground Structures. In Proceedings of the Korea-Japan Joint Symposium on Rock Engineering, Seoul, Korea, 18–20 July 1996; pp. 81–87. [Google Scholar]
- Zhu, Y.; Carbee, D.L. Creep and Strength Behavior of Frozen Silt in Uniaxial Compression; CRREL Report 87-10; Army Cold Regions Research and Engineering Laboratory: Hanover, NH, USA, 1987. [Google Scholar]
- Ting, J.M. Tertiary Creep Model for Frozen Sands. J. Geotech. Eng. 1983, 109, 932–945. [Google Scholar] [CrossRef]
- Fujii, Y.; Kiyama, T.; Ishijima, Y.; Kodama, J. Circumferential Strain Behavior during Creep Tests of Brittle Rocks. Int. J. Rock Mech. Min. Sci. 1999, 36, 323–337. [Google Scholar] [CrossRef]
- Roscoe, K.H.; Burland, J.B. On the Generalised Stress-Strain Behaviour of ‘Wet’ Clay. In Engineering Plasticity; Cambridge University Press: Cambridge, UK, 1968; pp. 535–609. [Google Scholar]
- Okubo, S.; Fukui, K. An Analytical Investigation of a Variable-Compliance-Type Constitutive Equation. Rock Mech. Rock Eng. 2006, 39, 233–253. [Google Scholar] [CrossRef]


| Axial-Strain Rate Ce | Methane Hydrate Saturation Sh |
|---|---|
| 0.1%/min | 39%, 40%, 41%, 41% (15%, 16%, 21%, 31%, 34%, 35%, 48%) * |
| 0.05%/min | 37%, 37%, 45% |
| 0.01%/min | 43%, 43% |
| 0.005%/min | 43% |
| 0.001%/min | 42%, 41% |
| Differential-Stress Rate Cs | Methane Hydrate Saturation Sh |
|---|---|
| 1 MPa/min | 39%, 42%, 42% |
| 0.1 MPa/min | 44%, 50% |
| 0.01 MPa/min | 44%, 48%, 50% |
| Creep Stress σcr | Methane Hydrate Saturation Sh |
|---|---|
| 1 MPa | 42% *, 42% * |
| 2 MPa | 48% *, 48% * |
| 3 MPa | 40% *, 45% *, 47% * |
| 4 MPa | 39% *, 50% * |
| 4.5 MPa | 41%, 42%, 42% * |
| 5 MPa | 36%, 41%, 45%, 48% |
| 5.5 MPa | 36%, 39%, 48% |
© 2017 by the authors. Licensee MDPI, Basel, Switzerland. This article is an open access article distributed under the terms and conditions of the Creative Commons Attribution (CC BY) license (http://creativecommons.org/licenses/by/4.0/).
Share and Cite
Miyazaki, K.; Tenma, N.; Yamaguchi, T. Relationship between Creep Property and Loading-Rate Dependence of Strength of Artificial Methane-Hydrate-Bearing Toyoura Sand under Triaxial Compression. Energies 2017, 10, 1466. https://doi.org/10.3390/en10101466
Miyazaki K, Tenma N, Yamaguchi T. Relationship between Creep Property and Loading-Rate Dependence of Strength of Artificial Methane-Hydrate-Bearing Toyoura Sand under Triaxial Compression. Energies. 2017; 10(10):1466. https://doi.org/10.3390/en10101466
Chicago/Turabian StyleMiyazaki, Kuniyuki, Norio Tenma, and Tsutomu Yamaguchi. 2017. "Relationship between Creep Property and Loading-Rate Dependence of Strength of Artificial Methane-Hydrate-Bearing Toyoura Sand under Triaxial Compression" Energies 10, no. 10: 1466. https://doi.org/10.3390/en10101466