Improved State of Charge Estimation for High Power Lithium Ion Batteries Considering Current Dependence of Internal Resistance


1
College of Automotive Engineering, Chongqing University, Chongqing 40044, China
2
China Chang’an Automotive Engineering Institute, Chongqing 401120, China
3
A123 Systems, LLC., Livonia, MI 48377, USA
*
Author to whom correspondence should be addressed.
Energies 2017, 10(10), 1486; https://doi.org/10.3390/en10101486
Submission received: 6 August 2017
/
Revised: 13 September 2017
/
Accepted: 19 September 2017
/
Published: 25 September 2017
(This article belongs to the Section D: Energy Storage and Application)
Abstract
:For high power Li-ion batteries, an important approach to improve the accuracy of modeling and algorithm development is to consider the current dependence of internal resistance, especially for large current applications in mild/median hybrid electric vehicles (MHEV). For the first time, the work has experimentally captured the decrease of internal resistance at an increasing current of up to the C-rate of 25 and developed an equivalent circuit model (ECM) with current dependent parameters. The model is integrated to extended Kalman filter (EKF) to improve SOC estimation, which is validated by experimental data collected in dynamic stress testing (DST). Results show that EKF with current dependent parameters is capable of estimating SOC with a higher accuracy when it is compared to EKF without current dependent parameters.
1. Introduction
1.1. Current Dependence of Li-ion Batteries
Hybrid electric vehicles (HEV) are efficient in improving fuel economy and reducing emissions. When compared to full or plug-in HEVs, mild/median HEVs (MHEV) can provide such benefits with a downsized Li-ion battery for less cost and weight penalty. Li-ion batteries in MHEV not only support start/stop load in 3 to 5 kW, but also to recuperate and deliver high power of up to 15 kW in regenerative braking and engine boosting [1,2,3,4]. On the other hand, the usable energy of these batteries can be as small as 200 Wh because MHEVs do not have pure electric drive mode and the energy stored from braking can be immediately used for boosting acceleration [3]. Due to the high power-to-energy ratio, Li-ion batteries for MHEV need to not only sustain small continuous loads, but to also deliver large short pulses of up to 30 C (for a 14 Ah cell, 1 C is equivalent to 14 A).
When a Li-ion battery is operated at an increased C-rate of charge or discharge, the internal resistance is found to be smaller than usual, according to recent studies [5,6,7,8,9,10,11,12]. Waag et al. has measured the internal resistance, which is also known as direct current resistance (DCR) of a Li-ion battery from 0.5 C to 4 C and found a clear trend of a decreasing DCR as C-rate increases [5,6]. Xu et al. has reported the test data of 10-second DCR as a function of current and showed that DCR decreases when the charging rate increases from 1 C to 6 C [7]. Maheshwari also found that the diffusion process becomes significantly faster when current increases from 0.5 C to 6 C, indicating a decreasing of DCR with an increasing current [8]. All of these findings suggest that the current dependence of DCR can no longer be neglected when the current has large variations, especially for Li-ion batteries in MHEVs.
The mechanism of current dependence of DCR is mainly attributed to the nonlinear behavior of charge transfer reaction, which is described by the Butler-Volmer equation [5,6,9,10,11]. The equation shows that charge transfer resistance can be approximated as constant when current is relatively small, but it tends to decrease when the current becomes large. Some researchers also believe that the various sizes of electrode particles can contribute to the dependence of DCR on current [8]. Battery with LiFePO4 cathodes (LFP) is regarded as an excellent candidate for large current applications, such as MHEV, due to its high power performance and low cost, however its current dependence of DCR is more significant since the olivine structure of LFP undergoes phase change during charge or discharge [8,13,14].
1.2. Existed Algorithms of State of Charge (SOC) Estimations
In Battery Management Systems (BMS), the most straightforward algorithm to estimate SOC is coulomb counting. It is an open loop method that induces an accumulated error given disturbances, such as an poor initial guess of SOC or a biased current measurement. To ensure a more robust SOC estimation, numerous studies have proven that model-based closed loop algorithms are superior to open loop methods. Under certain disturbances, closed loop algorithms can find the error of terminal voltage calculated from the model by comparing it to the measured terminal voltage. After applying certain filters, the error is used to compensate the model for a better SOC estimation. Therefore, the accuracy of closed loop SOC estimation heavily relies on the accuracy of the battery model.
Most battery models incorporated in closed loop algorithms are equivalent circuit models (ECM) that use resistance-capacitance (RC) network as basic components to represent the voltage response under the current inputs. The models include first order RC [15,16,17], second order RC [18,19,20,21,22,23], and third order RC [24]. However, none of them have implemented current dependent parameters, according to a recent comprehensive review of ECM [25]. Although existed electrochemical models are more sophisticated than ECMs, current dependence is still not considered in most of the work due to assumptions, such as the linearized Butler-Volmer equation. As elaborated in Section 1.1, when it comes to MHEV applications where the current has larger variations (1 C–30 C), the dependence of DCR on current becomes obvious. Therefore, such models that are generated without considering current dependent parameters will predict inaccurate terminal voltage in MHEV applications and lead to poor SOC estimation.
In addition to models, there are different types of closed loop methods for SOC estimations, such as direct feedback [6,26], extended Kalman Filters (EKF) [27,28,29,30,31], unscented Kalman Filters (UKF) [32], and neural network [33]. Among the work, only Waag et al. considered the current dependence of DCR [6]. They developed a first order ECM with current dependent charge transfer resistance, which is implemented it to an on-line parameter identification algorithm, a relatively simple feedback strategy. In contrast, EKF is used in this work to further improve the accuracy since it can recursively estimate the uncertainty of existed system state estimations and adapt Kalman gain to achieve optimal estimation in the next time step. To the best of our knowledge, no work can be found in the literature that has integrated a battery model with current dependent parameters into advanced filtering algorithms, such as EKF.
1.3. Advances of Current Work
Considering the growing prospect of MHEV and the existed technical gap, this work has developed a Li-ion battery model considering both the current and SOC dependences of DCR and integrated it into EKF for accurate SOC estimation at large current applications. For the first time, both simulation and testing have covered a wide range of currents, from 1 C to 25 C, which has not been addressed in the literature [5,6,9,10,11,12] because the highest current ever investigated is 4 C [6]. In this work, current dependence is not only considered for both charge transfer [6], but also for solid phase diffusion, which should not be neglected [8]. Results show that the model with current dependent parameters predicts more accurate terminal voltages under the dynamic stress test (DST) profile. The mathematical derivation is provided when the current dependent model is integrated to EKF. As a result, more accurate SOC estimation is achieved based on the simulation of DST profile, which is validated by experimental data.
2. The Battery Model
2.1. The Overall Scheme
The Li-ion battery studied in this work is A123® pouch type high power cell with 14 Ah capacity. The active material of anode and cathode are graphite and LFP, respectively. Its electrochemical property is modeled by using an equivalent electrical circuit, as shown in Figure 1a. In a steady state, the battery terminal voltage, VT, is equal to open circuit voltage (OCV, or Voc). Voc is a function of SOC and hysteresis voltage, which will be described in Section 2.2.
The internal resistance of a battery, or DCR, is modeled by a resistor (R0) and two RC circuits consisting of resistors and capacitors (R1, R2, C1, and C2). R0 is used to describe the ohmic resistance of the electrolyte, separator and electrode of the battery. R1 and C1 are used to model the fast dynamic response, which is dominated by charge transfer processes. R2 and C2 are used to model the slow dynamic process, which is governed by the diffusion of lithium ions in electrodes. When the battery is charged or discharged by a current I, the voltage drops on these components can be calculated as IR0, V1, and V2. Therefore, VT can be expressed as:
2.2. OCV and Hysteresis
SOC is an indicator of the amount of charges remaining in the battery. It can be calculated as:
where z indicates SOC. When the battery is fully charged, SOC is equal to 1 and Voc is equal to 3.45 V. When the battery is completely discharged, SOC is equal to 0 and Voc is equal to 2.5 V. Cap is the rated capacity, or maximum capacity, of the battery cell. It is equal to the integration of current over time when the cell is discharged from 100% to 0% SOC. Since this work has not considered capacity degradation caused by aging and the variation of cell temperature is relatively small (<3 °C), Cap is considered as a constant value of 14 Ah.
The detailed relation between OCV and SOC can be obtained by conducting a standard OCV test procedure. The first step is to fully charge the battery to 100% SOC. Then, discharge the battery by 2% of SOC, rest it for 5 h, and record the voltage as Voc,dis. By repeating the process for 50 times, SOC will decrease to 0% and the curve of Voc,dis versus SOC is obtained. After that, charge the battery by 2% of SOC, rest it for 5 h and then record the voltage as Voc,ch. By repeating the process 50 times, SOC goes back to 100% and the curve of Voc,ch versus SOC is obtained as well. The OCV measurements from three cells are plotted as symbols in Figure 1b, showing good statistical repeatability.
In general, OCV increases with an increasing SOC, but Voc,ch measured in the charging process is always higher than Voc,dis measured in the discharging process because of the hysteresis effect [34,35]. Therefore, OCV is modeled as the summation of averaged OCV and hysteresis voltage.
where Vh is hyeteresis voltage and Voc,avg is obtained by taking an average of Voc,ch and Voc,dis at each SOC.
With the input of SOC, the values of Voc,ch and Voc,dis are calculated using linear interpolation from look-up tables whose data are plotted in Figure 1b. Unlike finding a polynomial function of SOC to OCV [36], linear interpolation is more efficient as long as the resolution of SOC-OCV data is high enough (for example, 2% SOC in this work).
The hysteresis voltage, Vh, is modeled using a differential equation [26,27,29,31]:
where β is the hysteresis coefficient and sign (I) is equal to 1, 0 and −1 for I > 0, I = 0 and I < 0, respectively. Vh,max(z) is the maximum hysteresis voltage obtained by subtracting Voc,ch by Voc,dis at each SOC and taking a half.
which is also indicated in Figure 1b. In Equation (5), β is a coefficient that determines how fast Vh follows Vh,max and is assumed as:
In the actual duty cycles, the direction of current changes frequently and Voc will vary accordingly between the two curves of Voc,ch and Voc,dis. In other words, Vh changes at charge or discharge but its absolute value never exceeds Vh,max.
2.3. RC Circuits
The voltage drops on the RC circuits, V1 and V2, are described by two differential equations:
where τ1 and τ2 are time constants of dynamic processes and they can be calculated by:
3. Identification of Model Parameters
The model has 10 parameters to be identified:
where θ indicate parameter sets. In general, each parameter can be considered as a function of SOC, current and temperature if the model needs to be applicable to a wide range of operating conditions. However, since the scope of this work is to investigate current dependence, certain simplifications and assumptions are made. First, the temperature dependence of all parameters is not considered because in this work the battery cell is tested in an environmental chamber where ambient temperature is always controlled at 23 °C. The air convection is good enough so that cell temperature does not exceed 26 °C during the test. According to Figure A1 in Appendix A, such temperature variation leads to very small changes in each parameter, therefore temperature dependence of each parameter is neglected in this work for simplification. Second, R0,dis and R0,ch are assumed as independent of SOC and current because they are dominated by the resistance of electrolyte and current collectors. Test data also shows little variance of R0,dis and R0,ch at different SOC and current. Third, unlike cells with Li[MnNiCo]O2 cathodes (NMC), the DCR of LFP cells does not change much in the SOC window of 20–80%, so SOC dependence is only considered in the parameters of R1,dis, R2,dis, R1,ch, and R2,ch, while τ1,dis, τ2,dis, τ1,ch, and τ2,ch are assumed as constant at different SOC. Such simplification can save computational time and reduce the size of parameter sets with little tolerance in model accuracy. In summary, there are eight parameters to be identified by fitting the model to the experimental data:
To ensure modeling accuracy, look-up tables are used for parameterization [22] with considerations of SOC and current dependencies, which are studied in Section 3.1 and Section 3.2, respectively. In contrast, R0,dis and R0,ch have been assumed as constants at different SOC and current, so they can be simply found by using the voltage drop at the beginning of a pulse.
3.1. SOC Dependence of Parameters
A Hybrid Pulse Power Characterization (HPPC) test is conducted to identify the parameters at different SOCs, as shown in Figure 2 and Figure 3. At a certain SOC, the test applies a 100 A/20 s discharge pulse, rest and a 75 A/20 s charge pulse. Then, a 1 C continuous discharge current is used to set SOC to a lower value. Such a procedure is repeated until SOC decreases from 85% to 15%. The test is conducted to three battery cells to assess statistical repeatability. Note that the currents of discharge and charge pulses are always 100 A and 75 A, respectively. They are considered as the baseline current so that the current dependence of parameters can be excluded when SOC dependence is investigated in this section.
The data of discharge pulses and charge pulses in HPPC are used for fitting. It is assumed that the battery is in the steady state before a pulse starts. Since the current is constant during a pulse, V1 and V2 can be solved analytically:
and terminal voltage during a pulse can be found as:
Voc can be calculated in advance according to Equations (4) and (5). R0 is simply found by dividing the initial voltage drop of a pulse by current. The averaged values of R0,dis and R0,ch are identified as 0.58 mΩ and 0.61 mΩ, respectively.
The parameters of R1, R2, τ1, and τ2 can be estimated by fitting the simulated terminal voltage to experimental data during a pulse at discharge or charge. Nonlinear least square fitting is used to minimize the error and optimize the parameters. An example of fitting is shown in Figure 4, where the fitting at other currents will be explained in the next section. It shows that simulation fits the experimental data well for both charge and discharge pulses. In particular, DCR during a pulse is calculated by subtracting VT by Voc, and then dividing it by I.
Figure 4a,b show that DCR starts from R0 and gradually increases with time under discharge or charge.
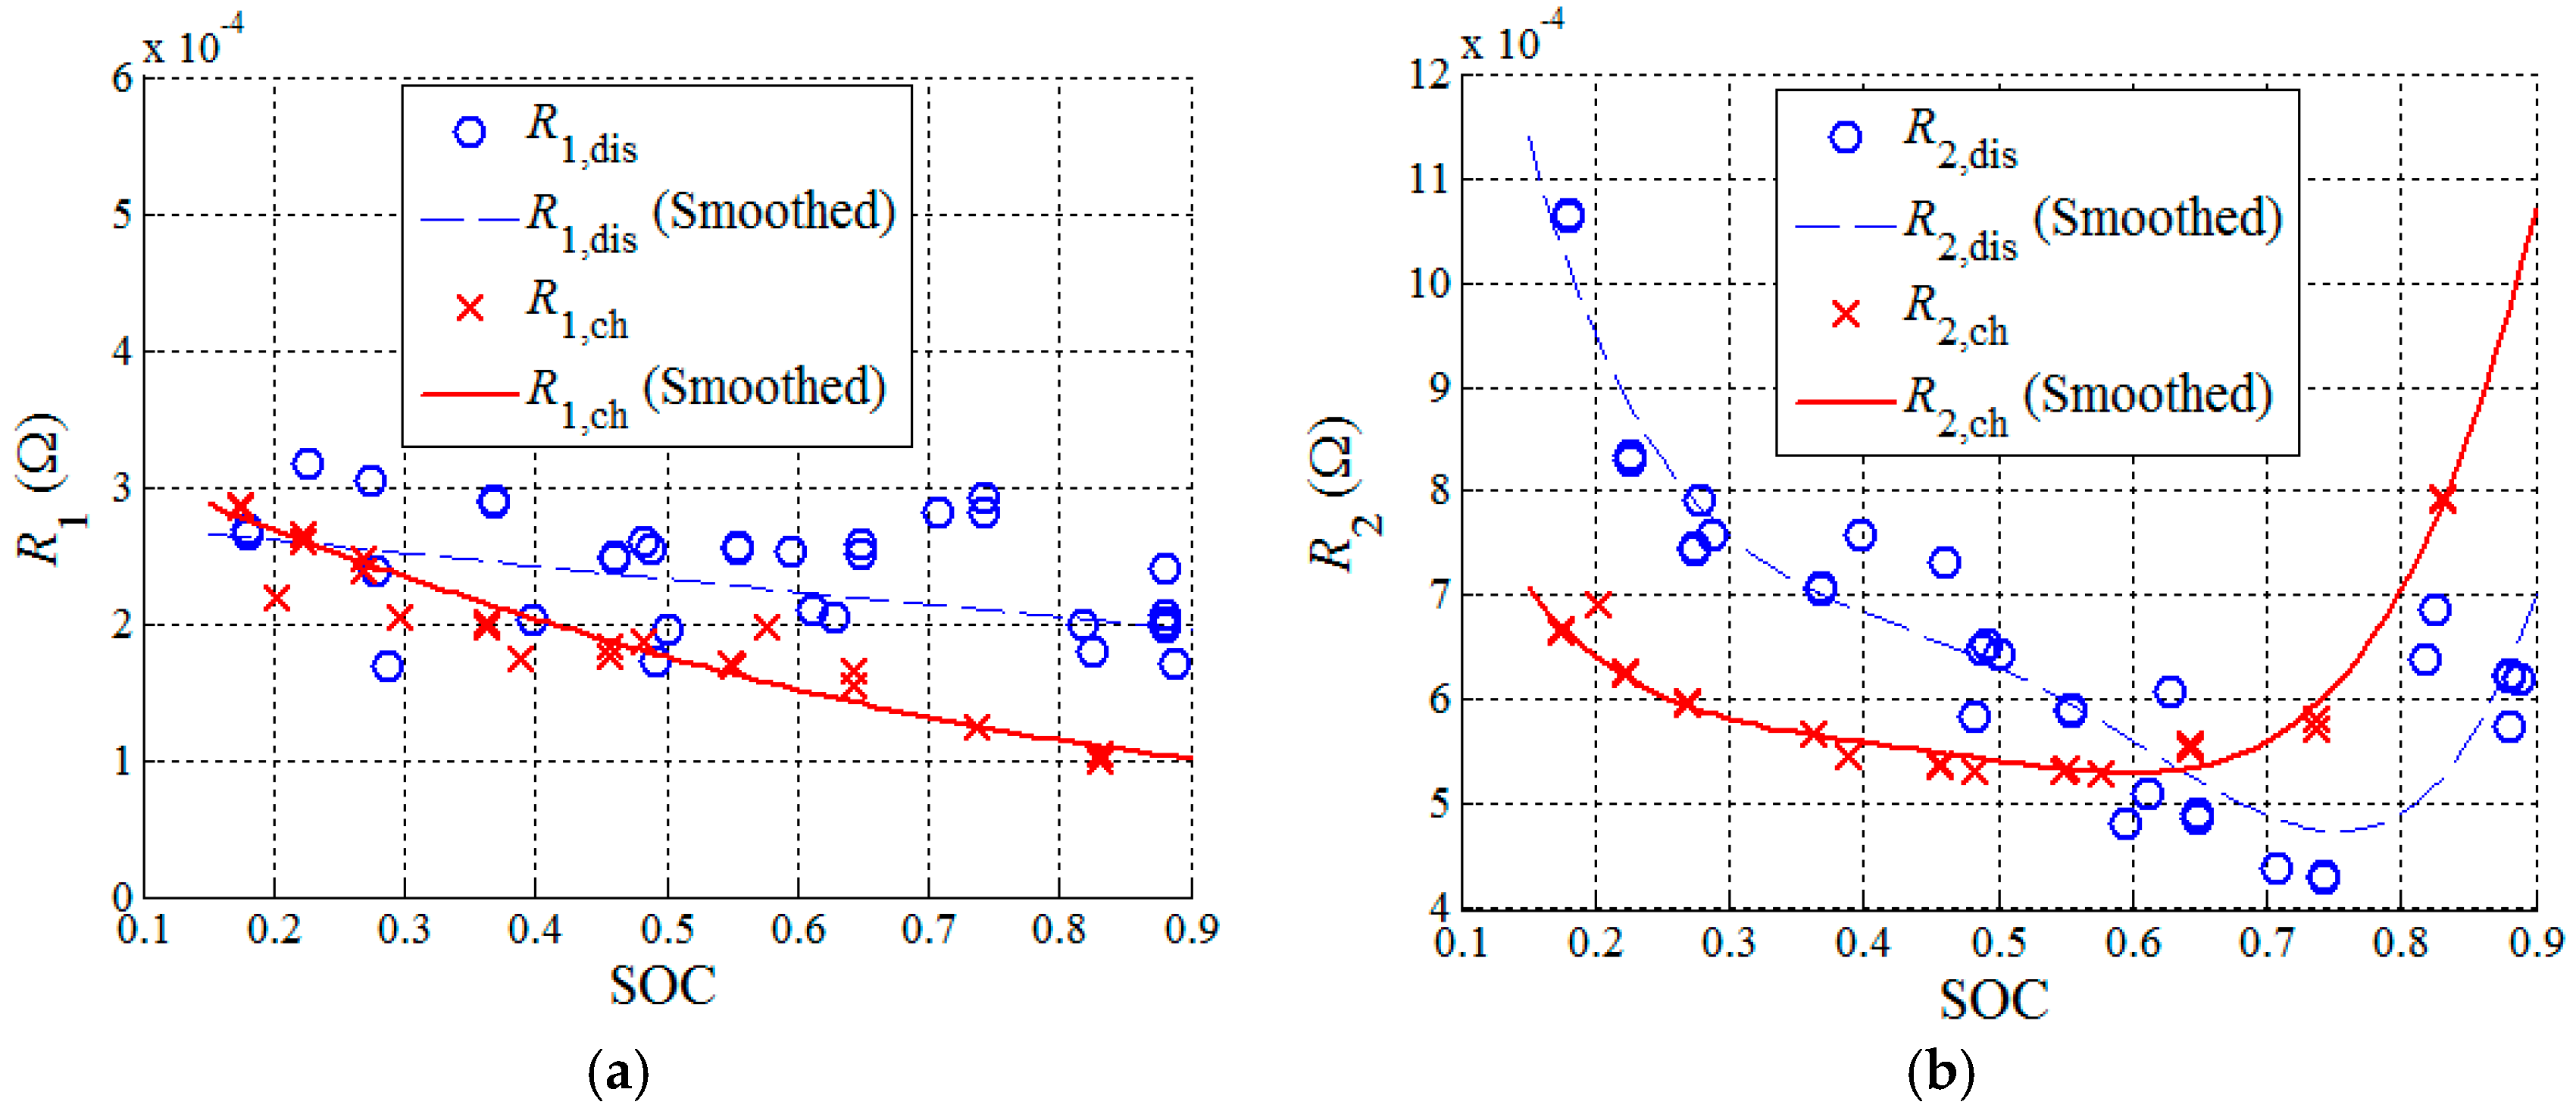
The fitting process is repeated at different SOCs tested in HPPC (Figure 2). Estimated R1,dis, R2,dis, R1,ch, and R2,ch are plotted in Figure 3 versus SOC. The markers in Figure 3 indicate the value of parameters estimated by fitting. As shown, R1,dis and R1,ch tend to decrease slowly with an increasing SOC. Both R2,dis and R2,ch are smaller in the middle region of SOC and become larger at two ends. R2,dis increases significantly when SOC is smaller than 20%, while R1,ch increases significantly when SOC is larger than 80%. Since the data are noisy especially for discharge, 2nd order polynomial is used to smooth R1 and 4th order polynomial is used to smooth R2. The smoothed values are as plotted as curves in Figure 3.
In the fitting process, the time constants, τ1,dis, τ2,dis, τ1,ch, and τ2,ch, are identified as 1.05 s, 8.76 s, 0.78 s, and 8.78 s, respectively. Note that they are treated as SOC independent. For both discharge and charge, τ1 is about one order of magnitude smaller than τ2 because the first RC circuit is responsible for the fast dynamic response while and second RC circuit is responsible for the slow dynamic response.
3.2. Current Dependence of Parameters
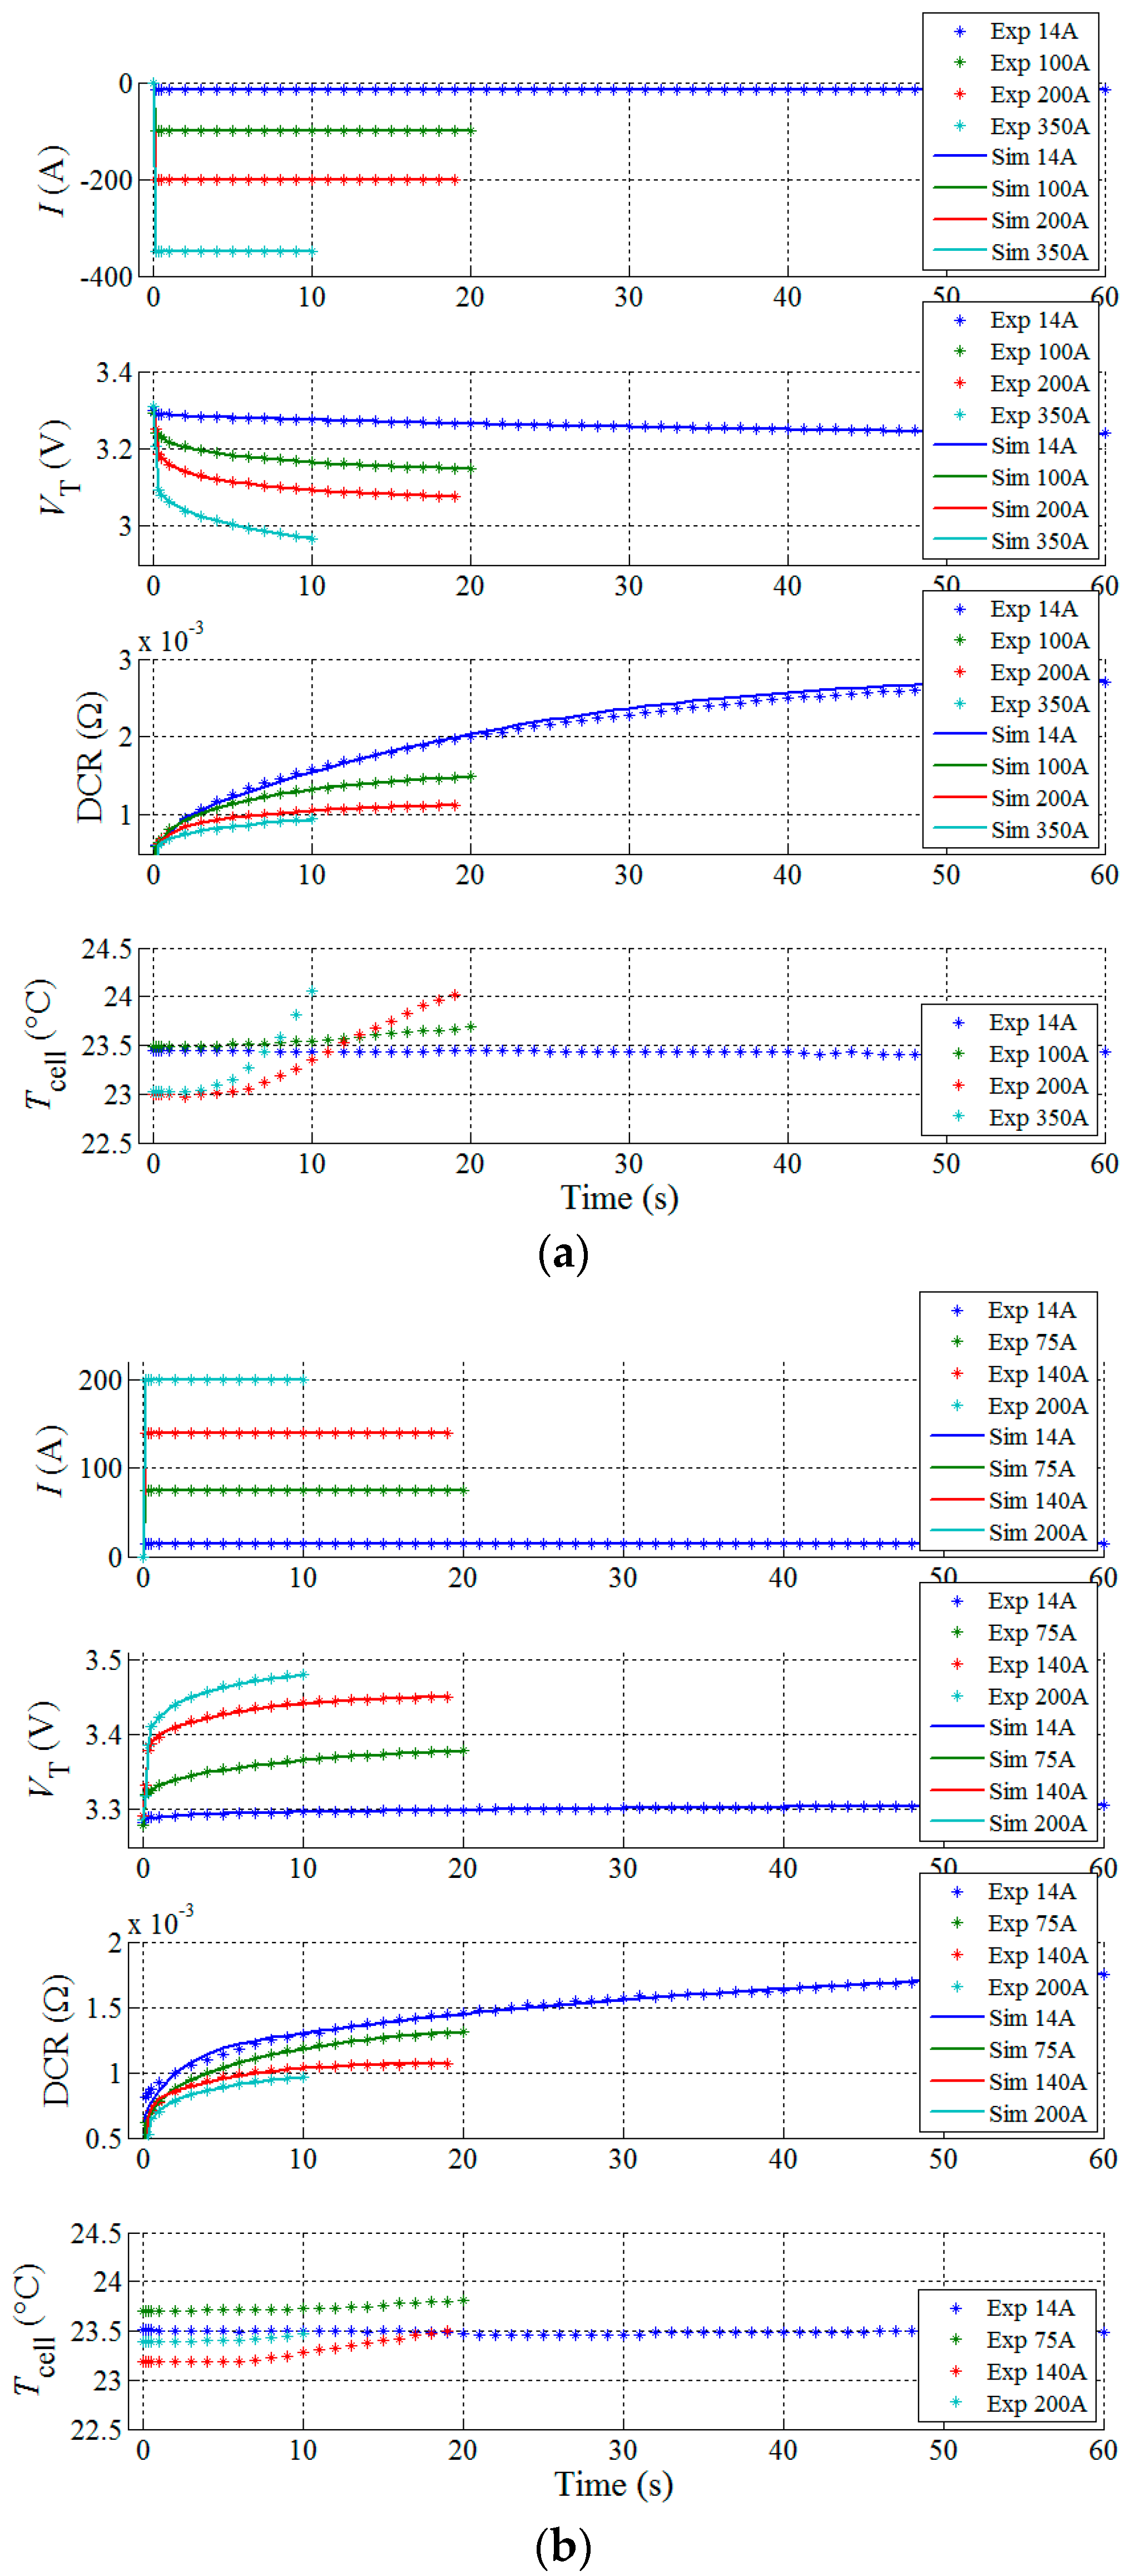
The previous section has identified the parameters and their SOC dependence at baseline a current, which is 100 A for discharge and 75 A for charge. In this section, tests are conducted to investigate how parameters change at different currents. Pulses with four different currents are tested for charge and discharge, as summarized in Table 1. Charge currents are smaller than discharge currents to ensure cell the voltage does not go too high at charging, which may lead to lithium plating. For small current (14 A), the pulse duration is extended to 60 s because small current loadings from auxiliary load usually have longer durations in MHEV applications. For large current (350 A discharge and 200 A charge), the pulse duration is shortened to 10 s because peak power from engine boosting and regenerative braking usually lasts less than 10 s. Also, large currents with long durations will induce large variations in SOC and heat generation, which will adversely affect the fitting quality and should be avoided. 100 A discharge and 75 A charge are considered as baseline currents because they have the power level of 3 to 5 kW, which meets the key funcions of 48 V battery pack such as start-stop [1,2,3,4].
To exclude the dependence of parameters on SOC, all of the currents are tested at 50% SOC only. This is done by setting SOC back to 50% every time before a pulse is applied. The test is conducted to three battery cells to assess for statistical repeatability. The experimental data of each pulse are plotted in Figure 4, where (a) shows discharge pulses under currents of 14 A, 100 A, 200 A, and 350 A, and (b) shows charge pulses under currents of 14 A, 75 A, 140 A, and 200 A. As indicated, when a cell is discharged using a larger current, the terminal voltage becomes lower due to the increased voltage drop on internal resistance. However, DCR turns out to be smaller if a larger current is used. Similar trends can be found for charge pulses as well.
Fitting is conducted to identify current dependence of parameter sets (θdis,fit and θch,fit). Similarly, terminal voltage and DCR are calculated using Equations (18) and (19). By optimizing parameters at different currents, simulation agrees well with experimental data, as shown in Figure 4.
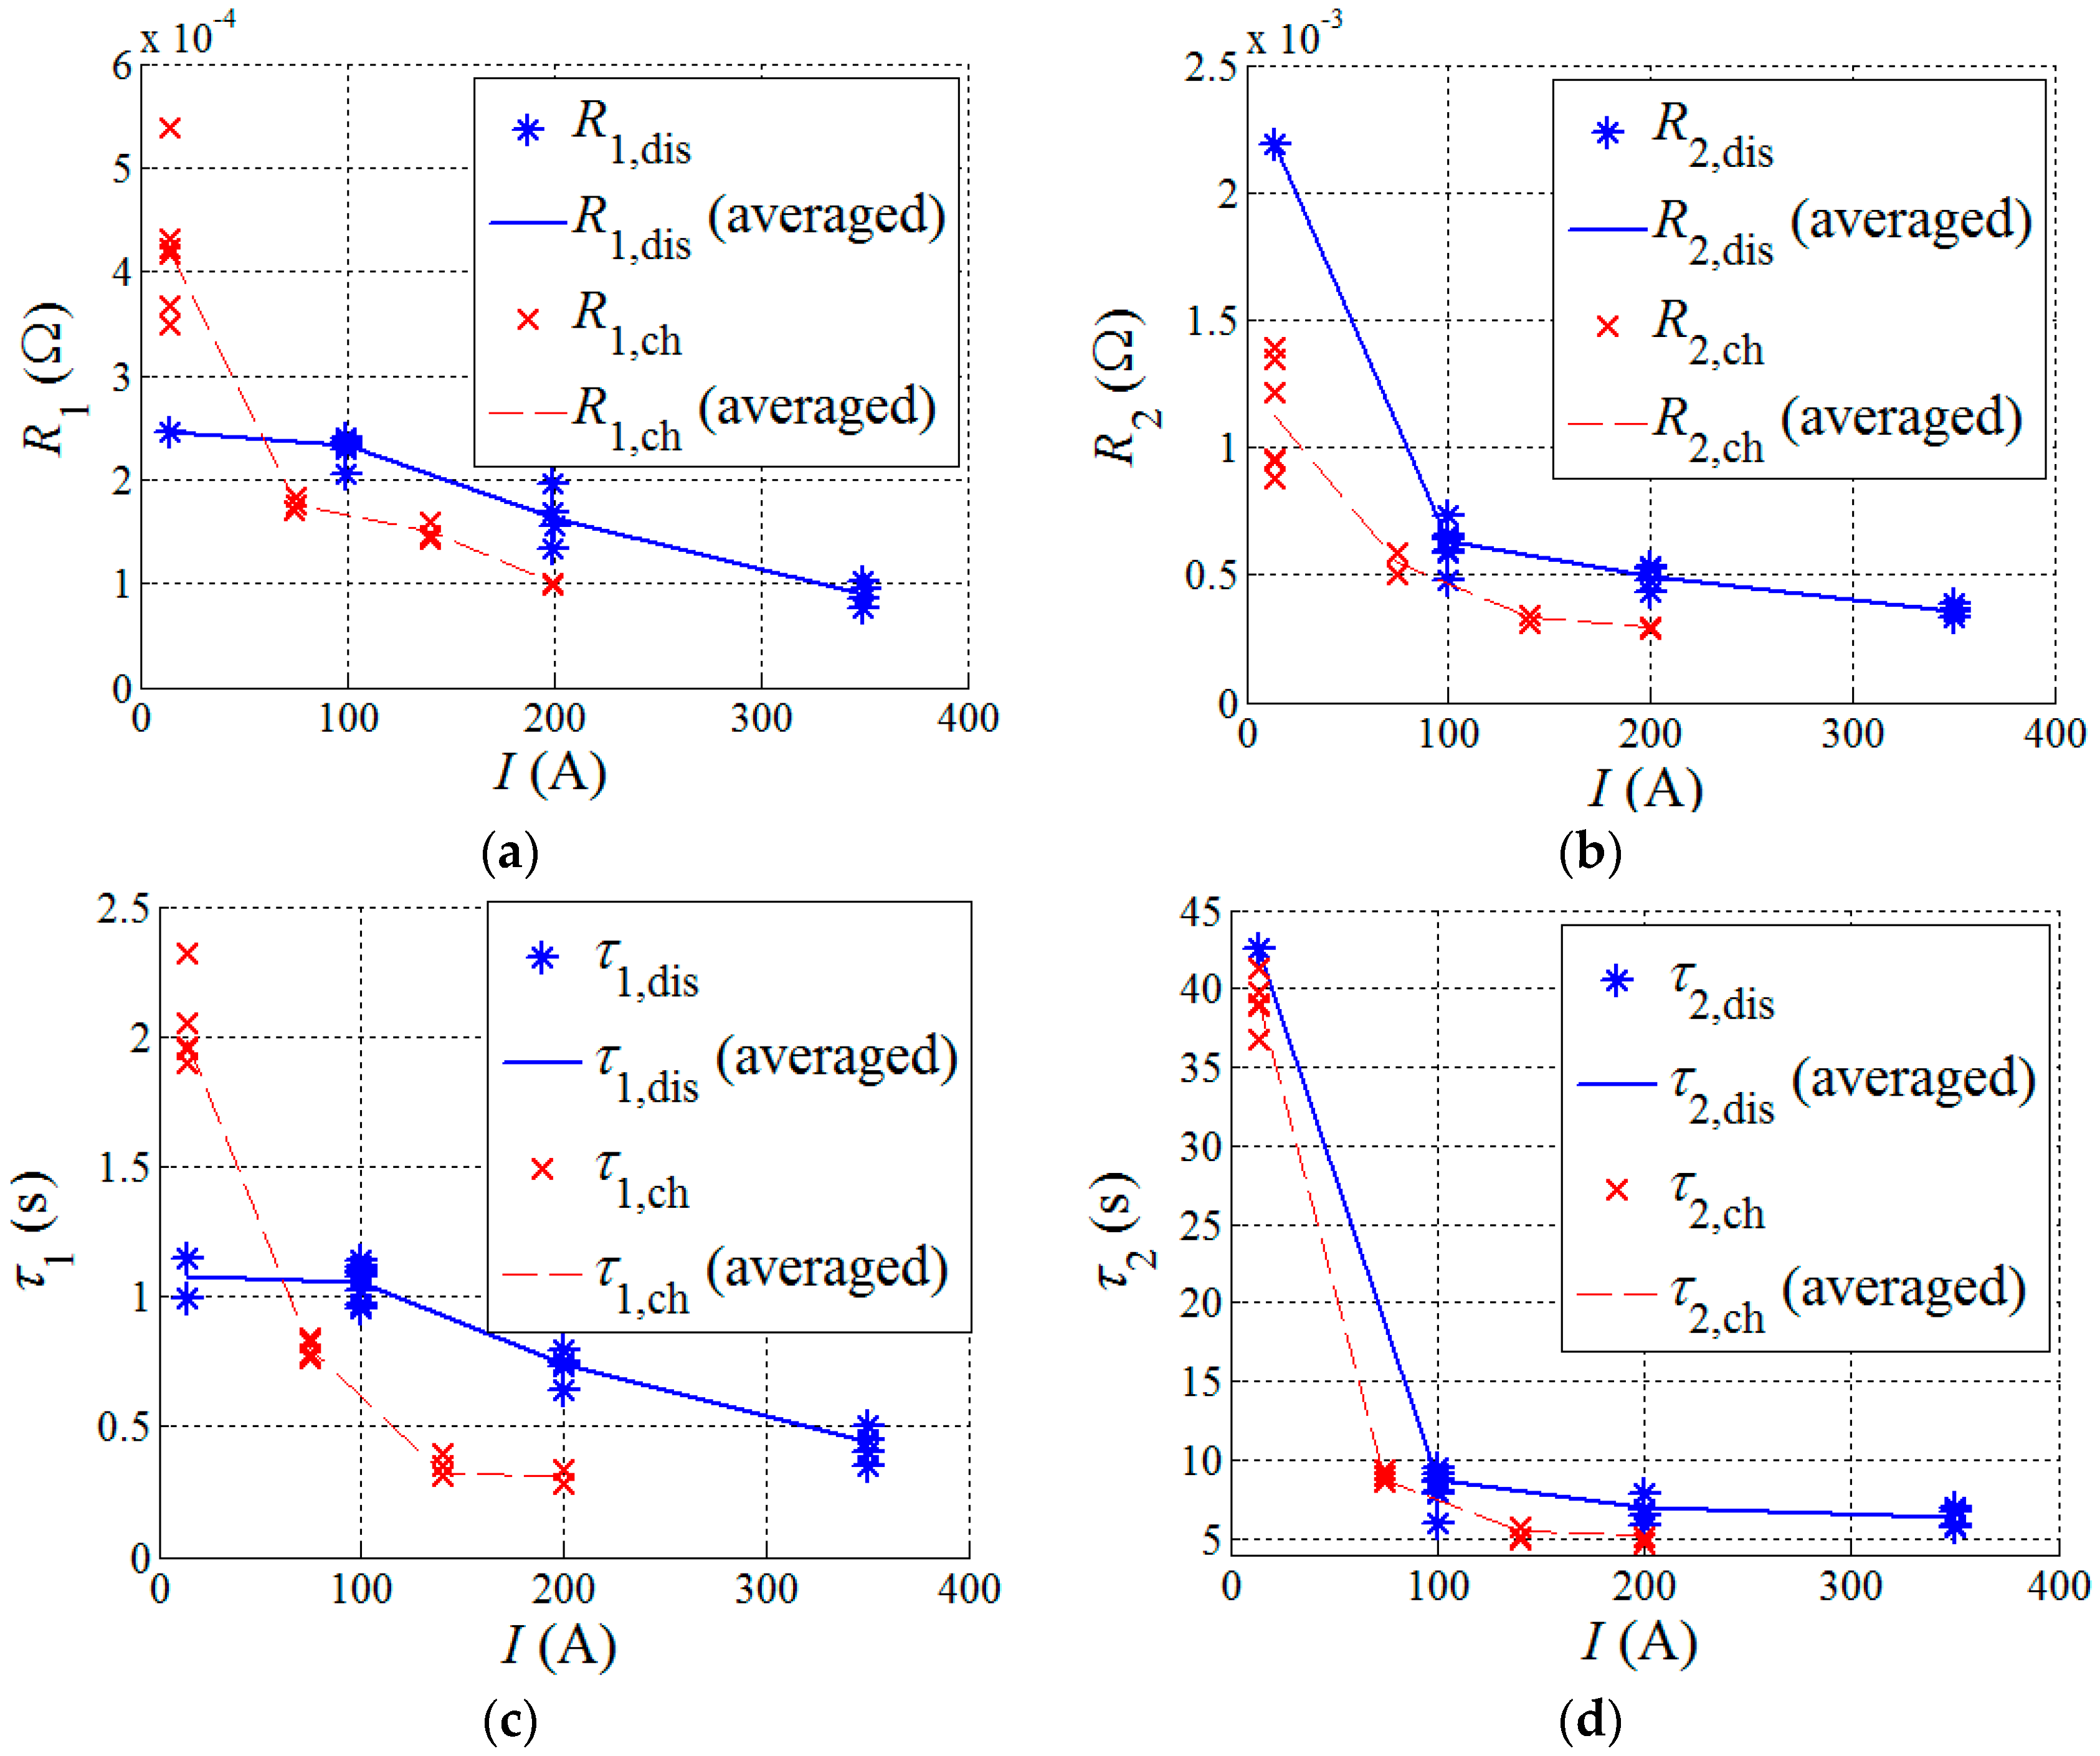
The identified parameters at different currents are plotted versus currents in Figure 5. In general, R1,dis, R2,dis, R1,ch, and R2,ch decrease when the current increases, indicating smaller DCR at larger currents. It is interesting to find that τ1,dis, τ2,dis, τ1,ch, and τ2,ch also decreases when the current increases, which implies that the battery gets to a steady state faster if a larger current is used. Except for R1,dis and τ1,dis, all of the other parameters decrease significantly when the current increases from 14 A to 100 A. After the current exceeds 100 A, the change of parameters becomes insignificant.
By comparing Figure 5 and Figure 3, one can find that the change of parameters at different currents is more obvious than the change of parameters at different SOC. This is particularly true for LFP cells in MHEV applications where SOC operating window is small (30–80%) and current variation is large (1 C–30 C). The trend is also observable in Figure 6.
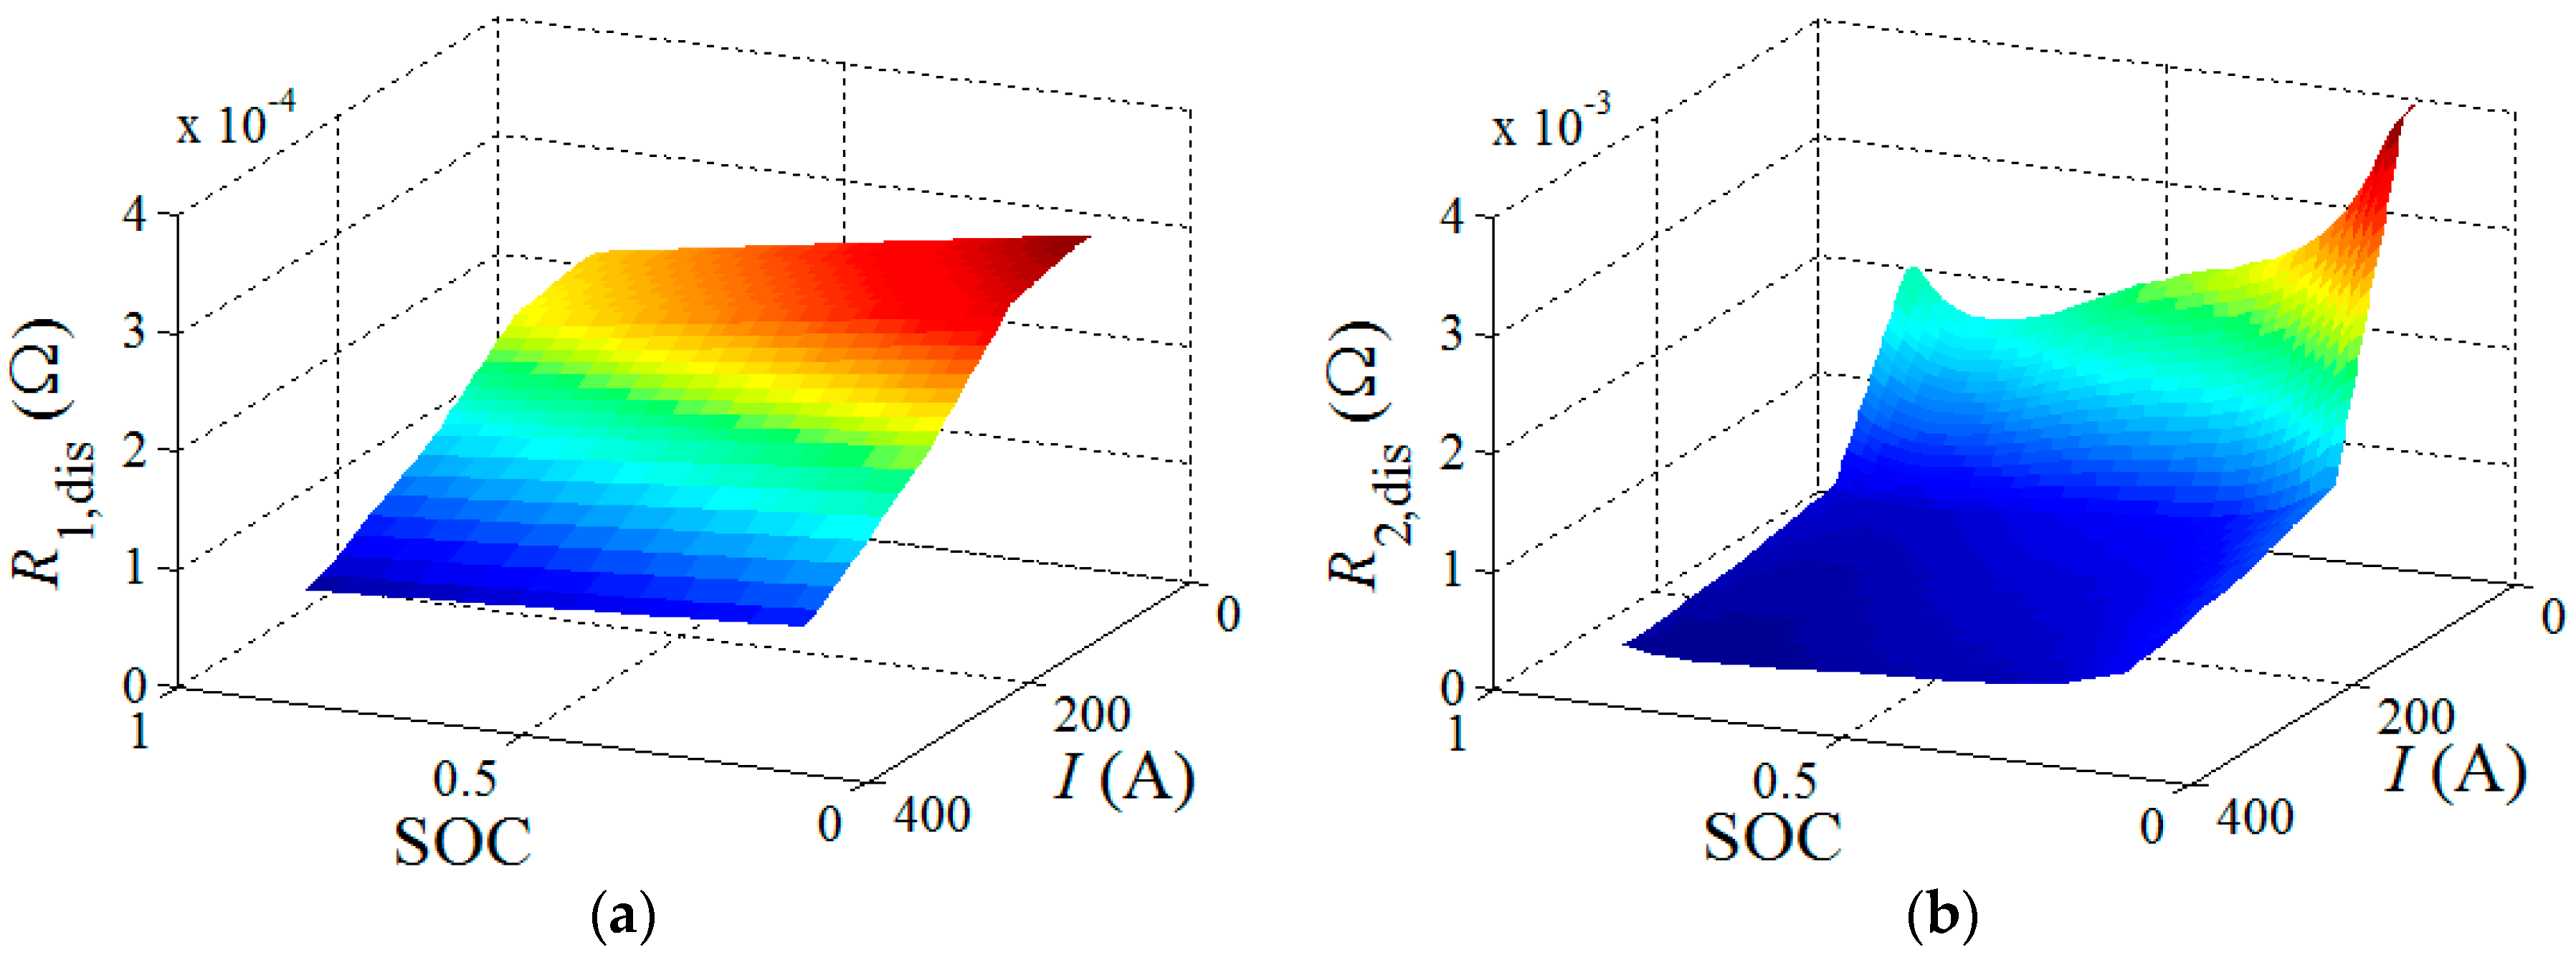
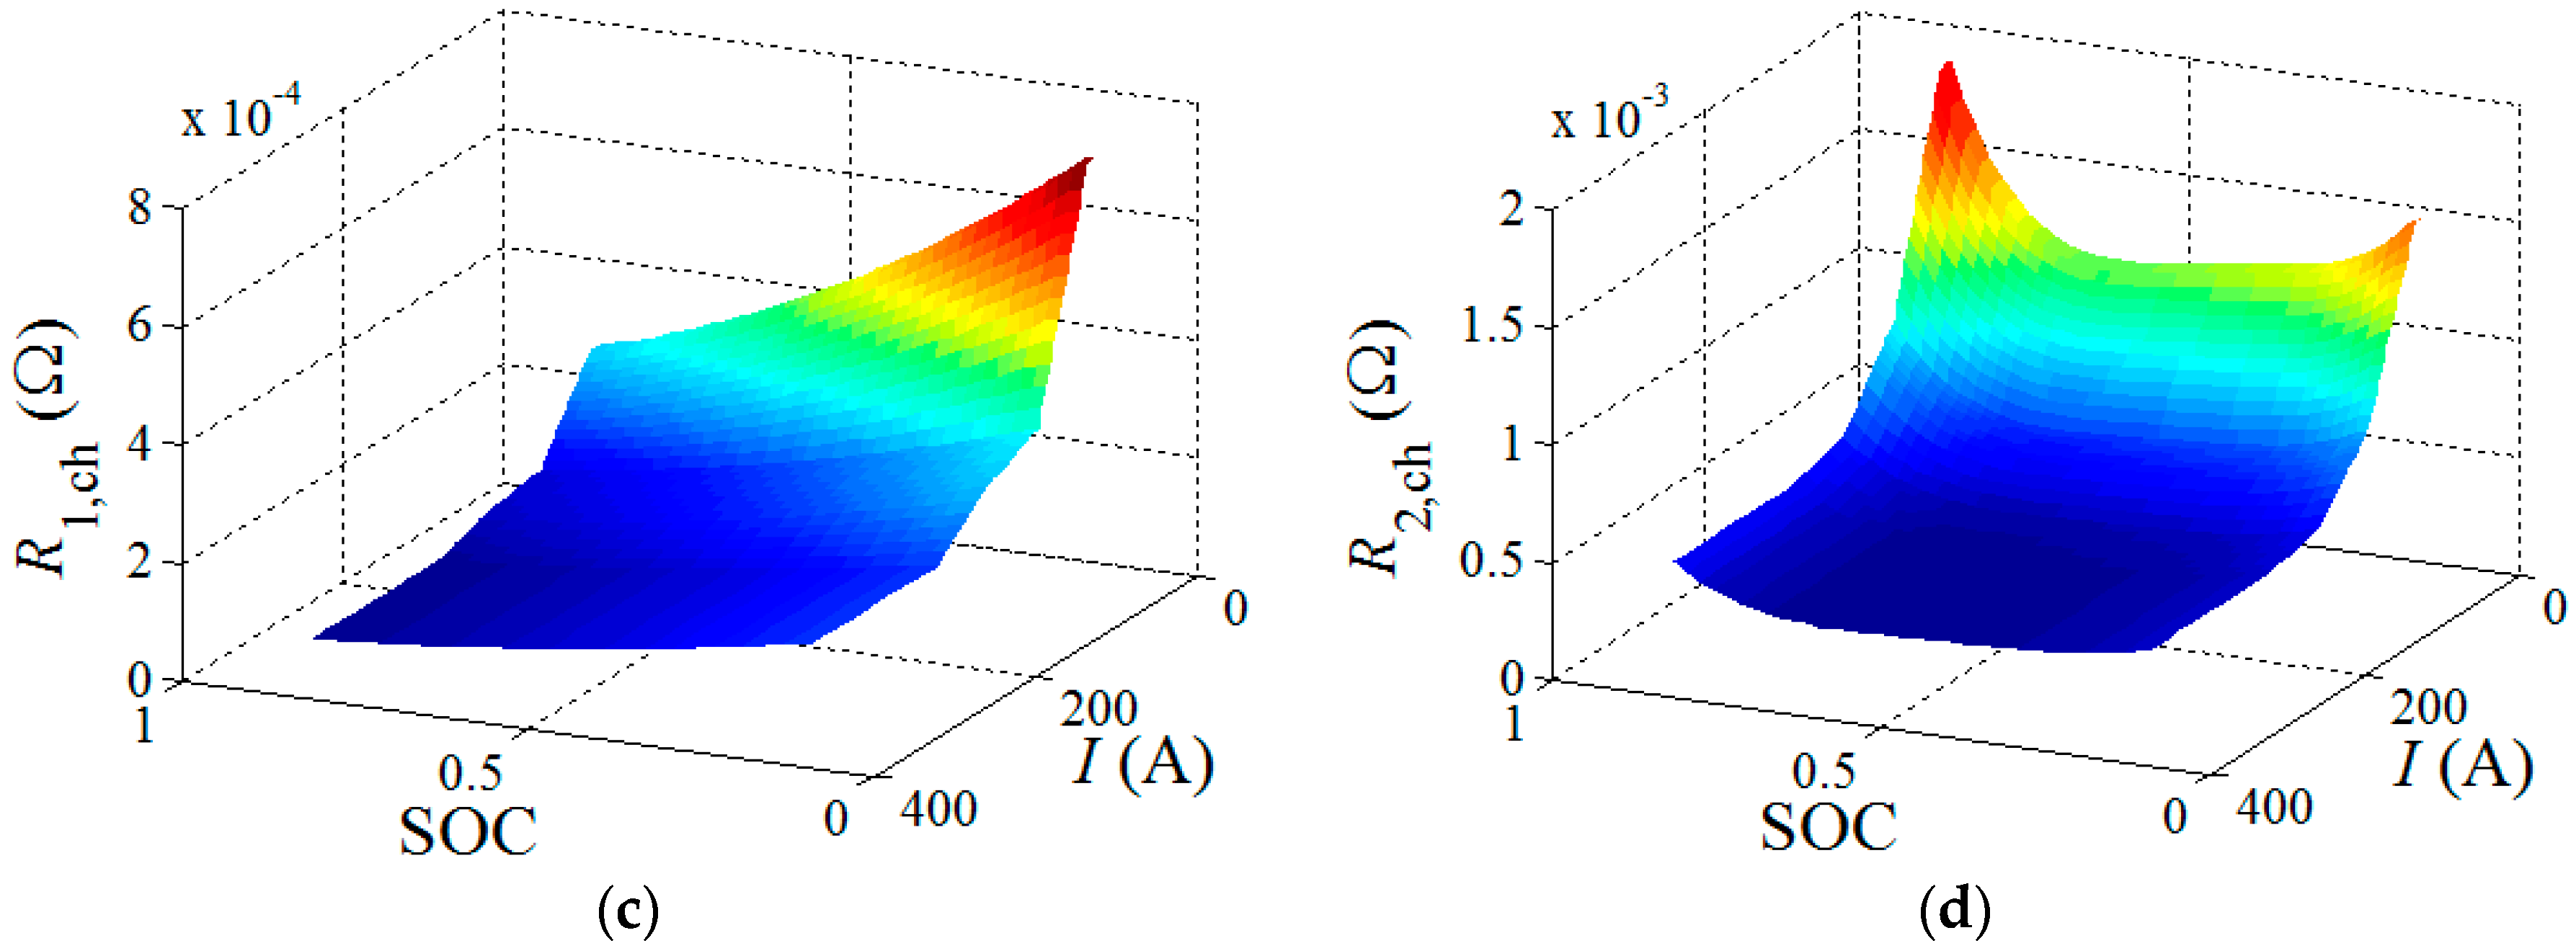
As explained previously, R1,dis, R2,dis, R1,ch, and R2,ch are dependent on both SOC and current. In Section 3.1, parameters at different SOCs are identified at a baseline current (100 A as discharge and 75 A as charge). In Section 3.2, parameters at different currents are obtained at baseline SOC (50%). To complete the model, we need to build a two-dimensional (2-D) look-up table for each parameter that covers the entire SOC range (15–85%) and current range (14 A–350 A for discharge and 14 A–200 A for charge). In this work, we assumed the same SOC dependence at different currents. This is done by scaling the one-dimentional (1-D) table versus SOC obtained from Section 3.1 for different currents, where the scaling factor at each current is determined by the current dependence obtained from Section 3.2. The resultant 2D look-up tables are presented as the contour plots in Figure 6, where R1,dis, R2,dis, R1,ch, and R2,ch change with SOC and current.
4. Simulation and Validation
4.1. Validation of the Li-ion Model
This section investigates the accuracy of Li-ion model with and without considering current dependence of model parameters. A dynamic stress test (DST) that mimics the drive cycle of MHEV is conducted to the battery cell. As shown in Figure 7, the test profile consists of small pulses, such as 20 A for 36 s, and large pulses, such as 223 A for 5 s.
In Figure 7a, simulation is conducted by the model without considering current dependence of parameters. Note that the model uses the SOC dependent but current independent parameters that are solely identified at baseline current in Section 3.1, as shown in Equations (20) and (21):
In Figure 7a, there are certain discrepancies between simulated terminal voltage, Vsim and measured terminal voltage, Vexp. Particularly, Vsim is larger than Vexp at 223 A charge pulse and smaller than Vexp at 223 A discharge pulse because the model has ignored the fact that DCR decreases with an increasing current. The error between Vsim and Vexp is plotted as well and the root-mean-square (RMS) error is 16.4 mV.
If the model uses SOC and current dependent parameters that were identified in Section 3.2 and shown in Equations (22) and (23),
then a more accurate prediction of terminal voltage is achieved, as shown in Figure 7b. The RMS error has decreased to 11.1 mV, as compared to 16.4 mV in Figure 7a.
4.2. SOC Estimation with EKF
EKF is an algorithm that effectively estimates the unknown state, such as SOC, of a nonlinear system based on system model and measurement of system output. To implement EKF, the battery model, Equations (2), (5), (8), and (9), are discretized in state space representation:
where [V1,k V2,k Vh,k zk]T is a vector of system state that includes SOC. [Ik Vh,max(zk)]T is system input, VT,k is system output, w is system state noise, v is measurement noise, and k is the index of time step. In each time step, EKF can find the error of the model by comparing the model predicted VT with the measured VT. The error is then used to compensate the model for better SOC estimation. Details of the theory and implementation of EKF can be found in the literature [4,29,30,37].
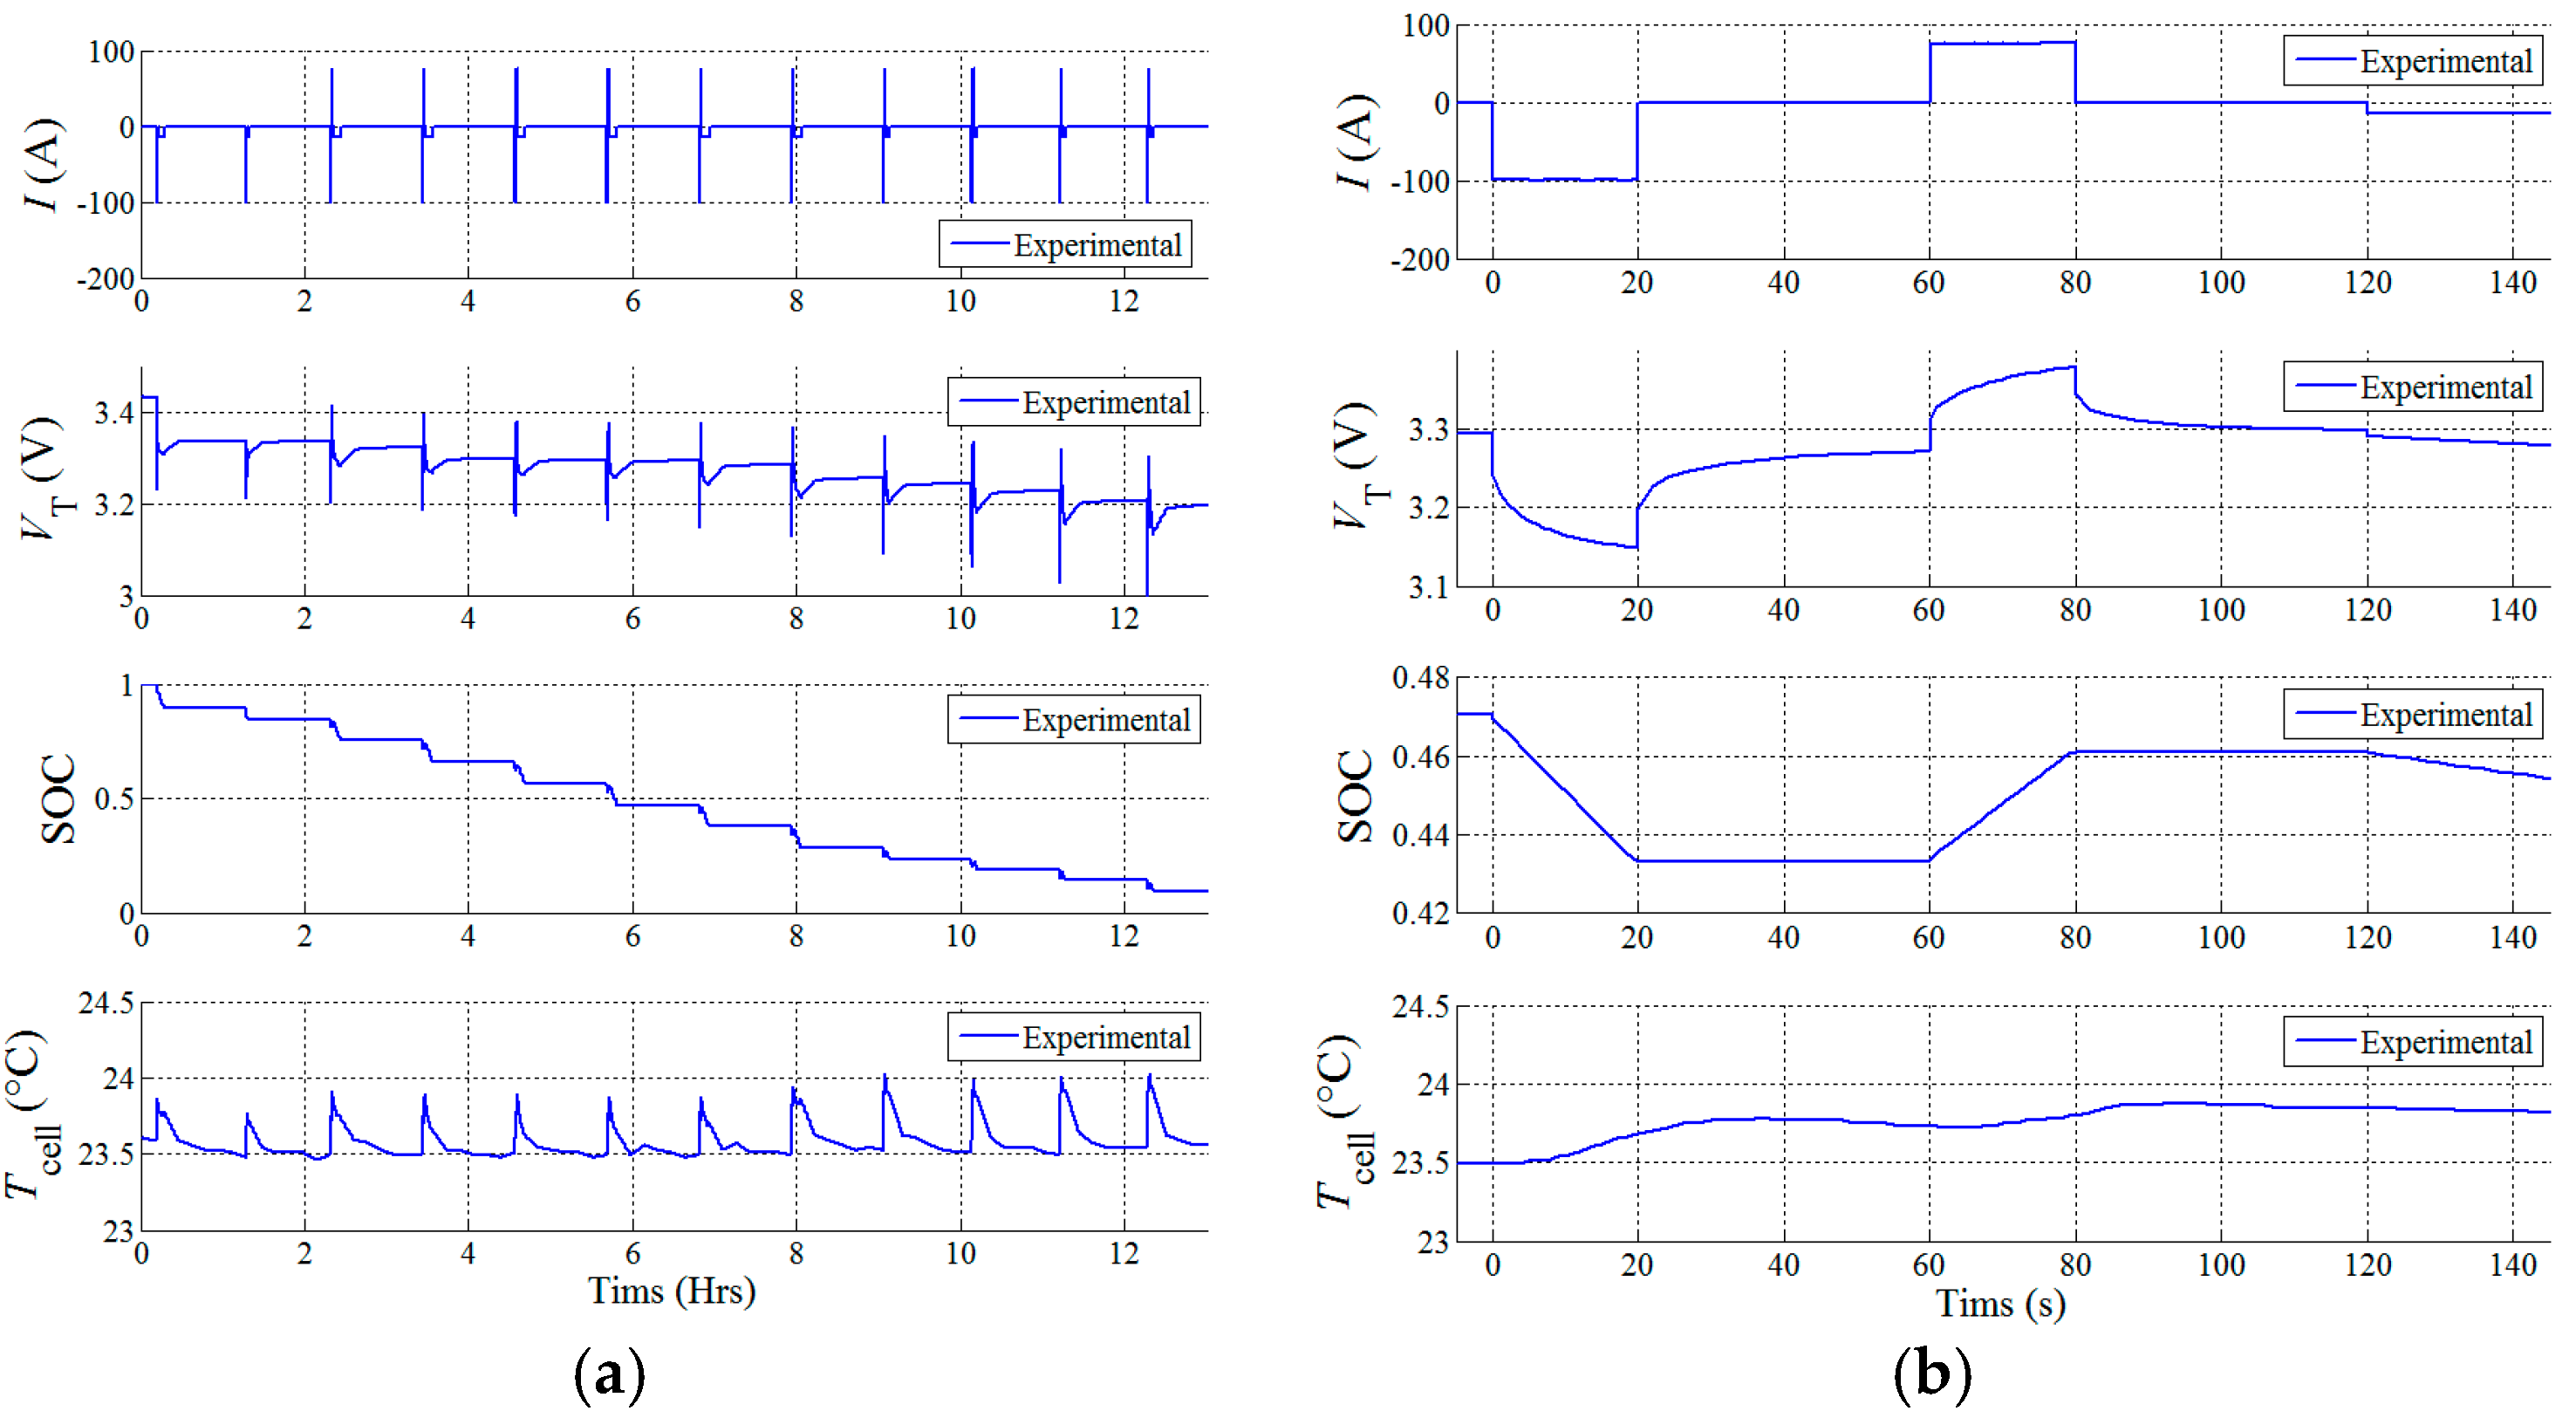
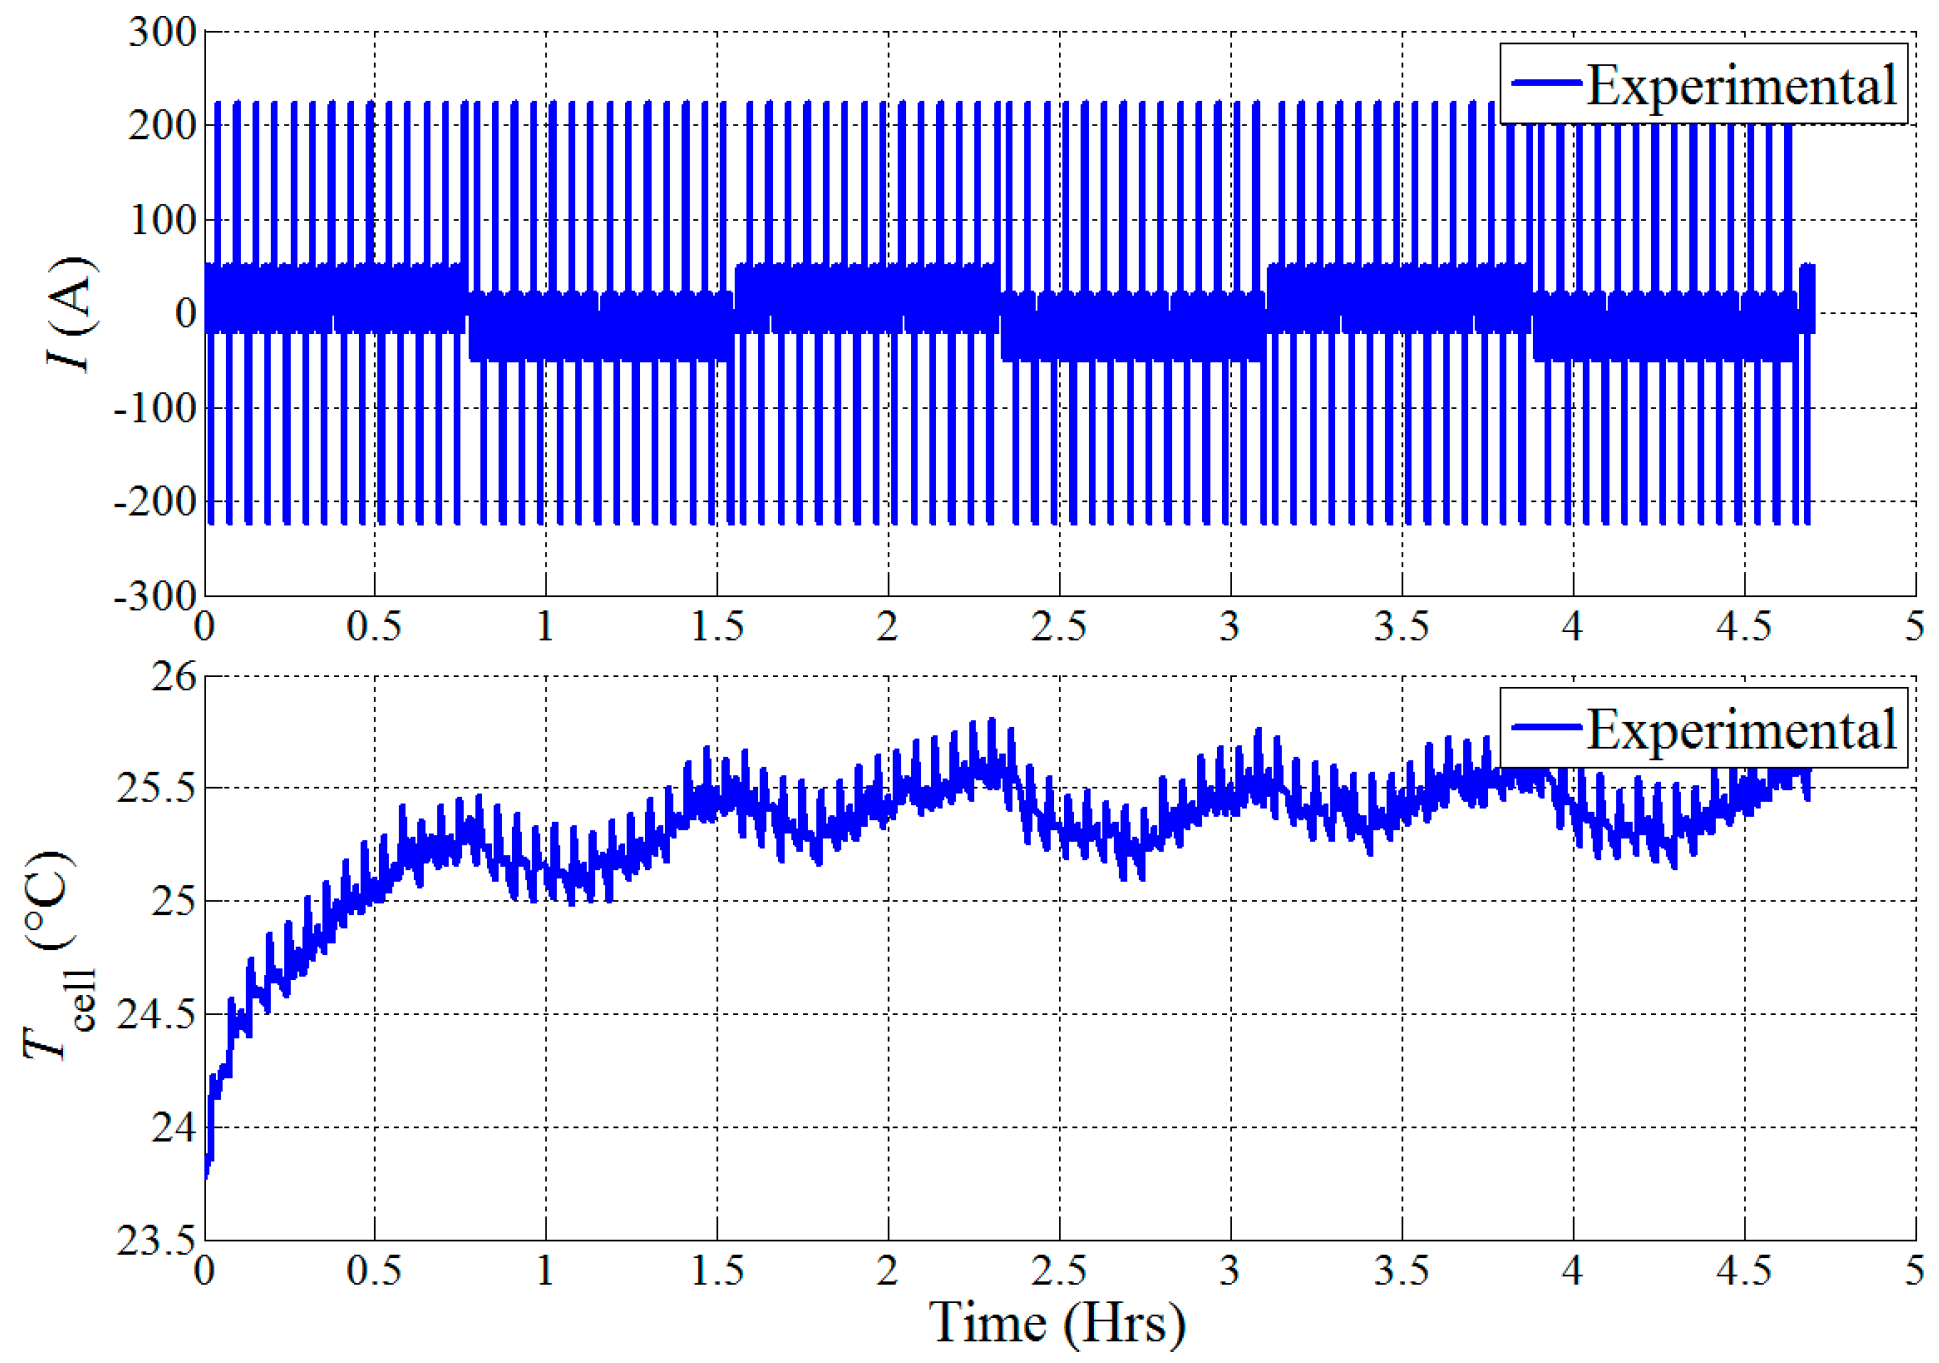
An extended DST profile that lasts for 4.7 h is applied to the battery, as shown in Figure 8. The overall DST is composed of a charge-increasing DST and a charge-depleting DST. Starting at 16% SOC, the battery is operated in charge-increasing DST where the amount of charge is slightly larger than that of discharge so that SOC tends to increase. When SOC reaches 72%, the battery is operated in charge-depleting DST where the amount of charge is slightly smaller than that of discharge so that SOC tends to decrease. This process is repeated three times and the test data is used to validate the SOC estimation algorithm. In addition, Figure 8 shows that the cell temperature increases from 23.5 °C to 25.7 °C during DST profile. Such a small change is considered to have a minimal effect on cell parameters, based on Figure A1.
4.2.1. Simulation with Initial SOC Error
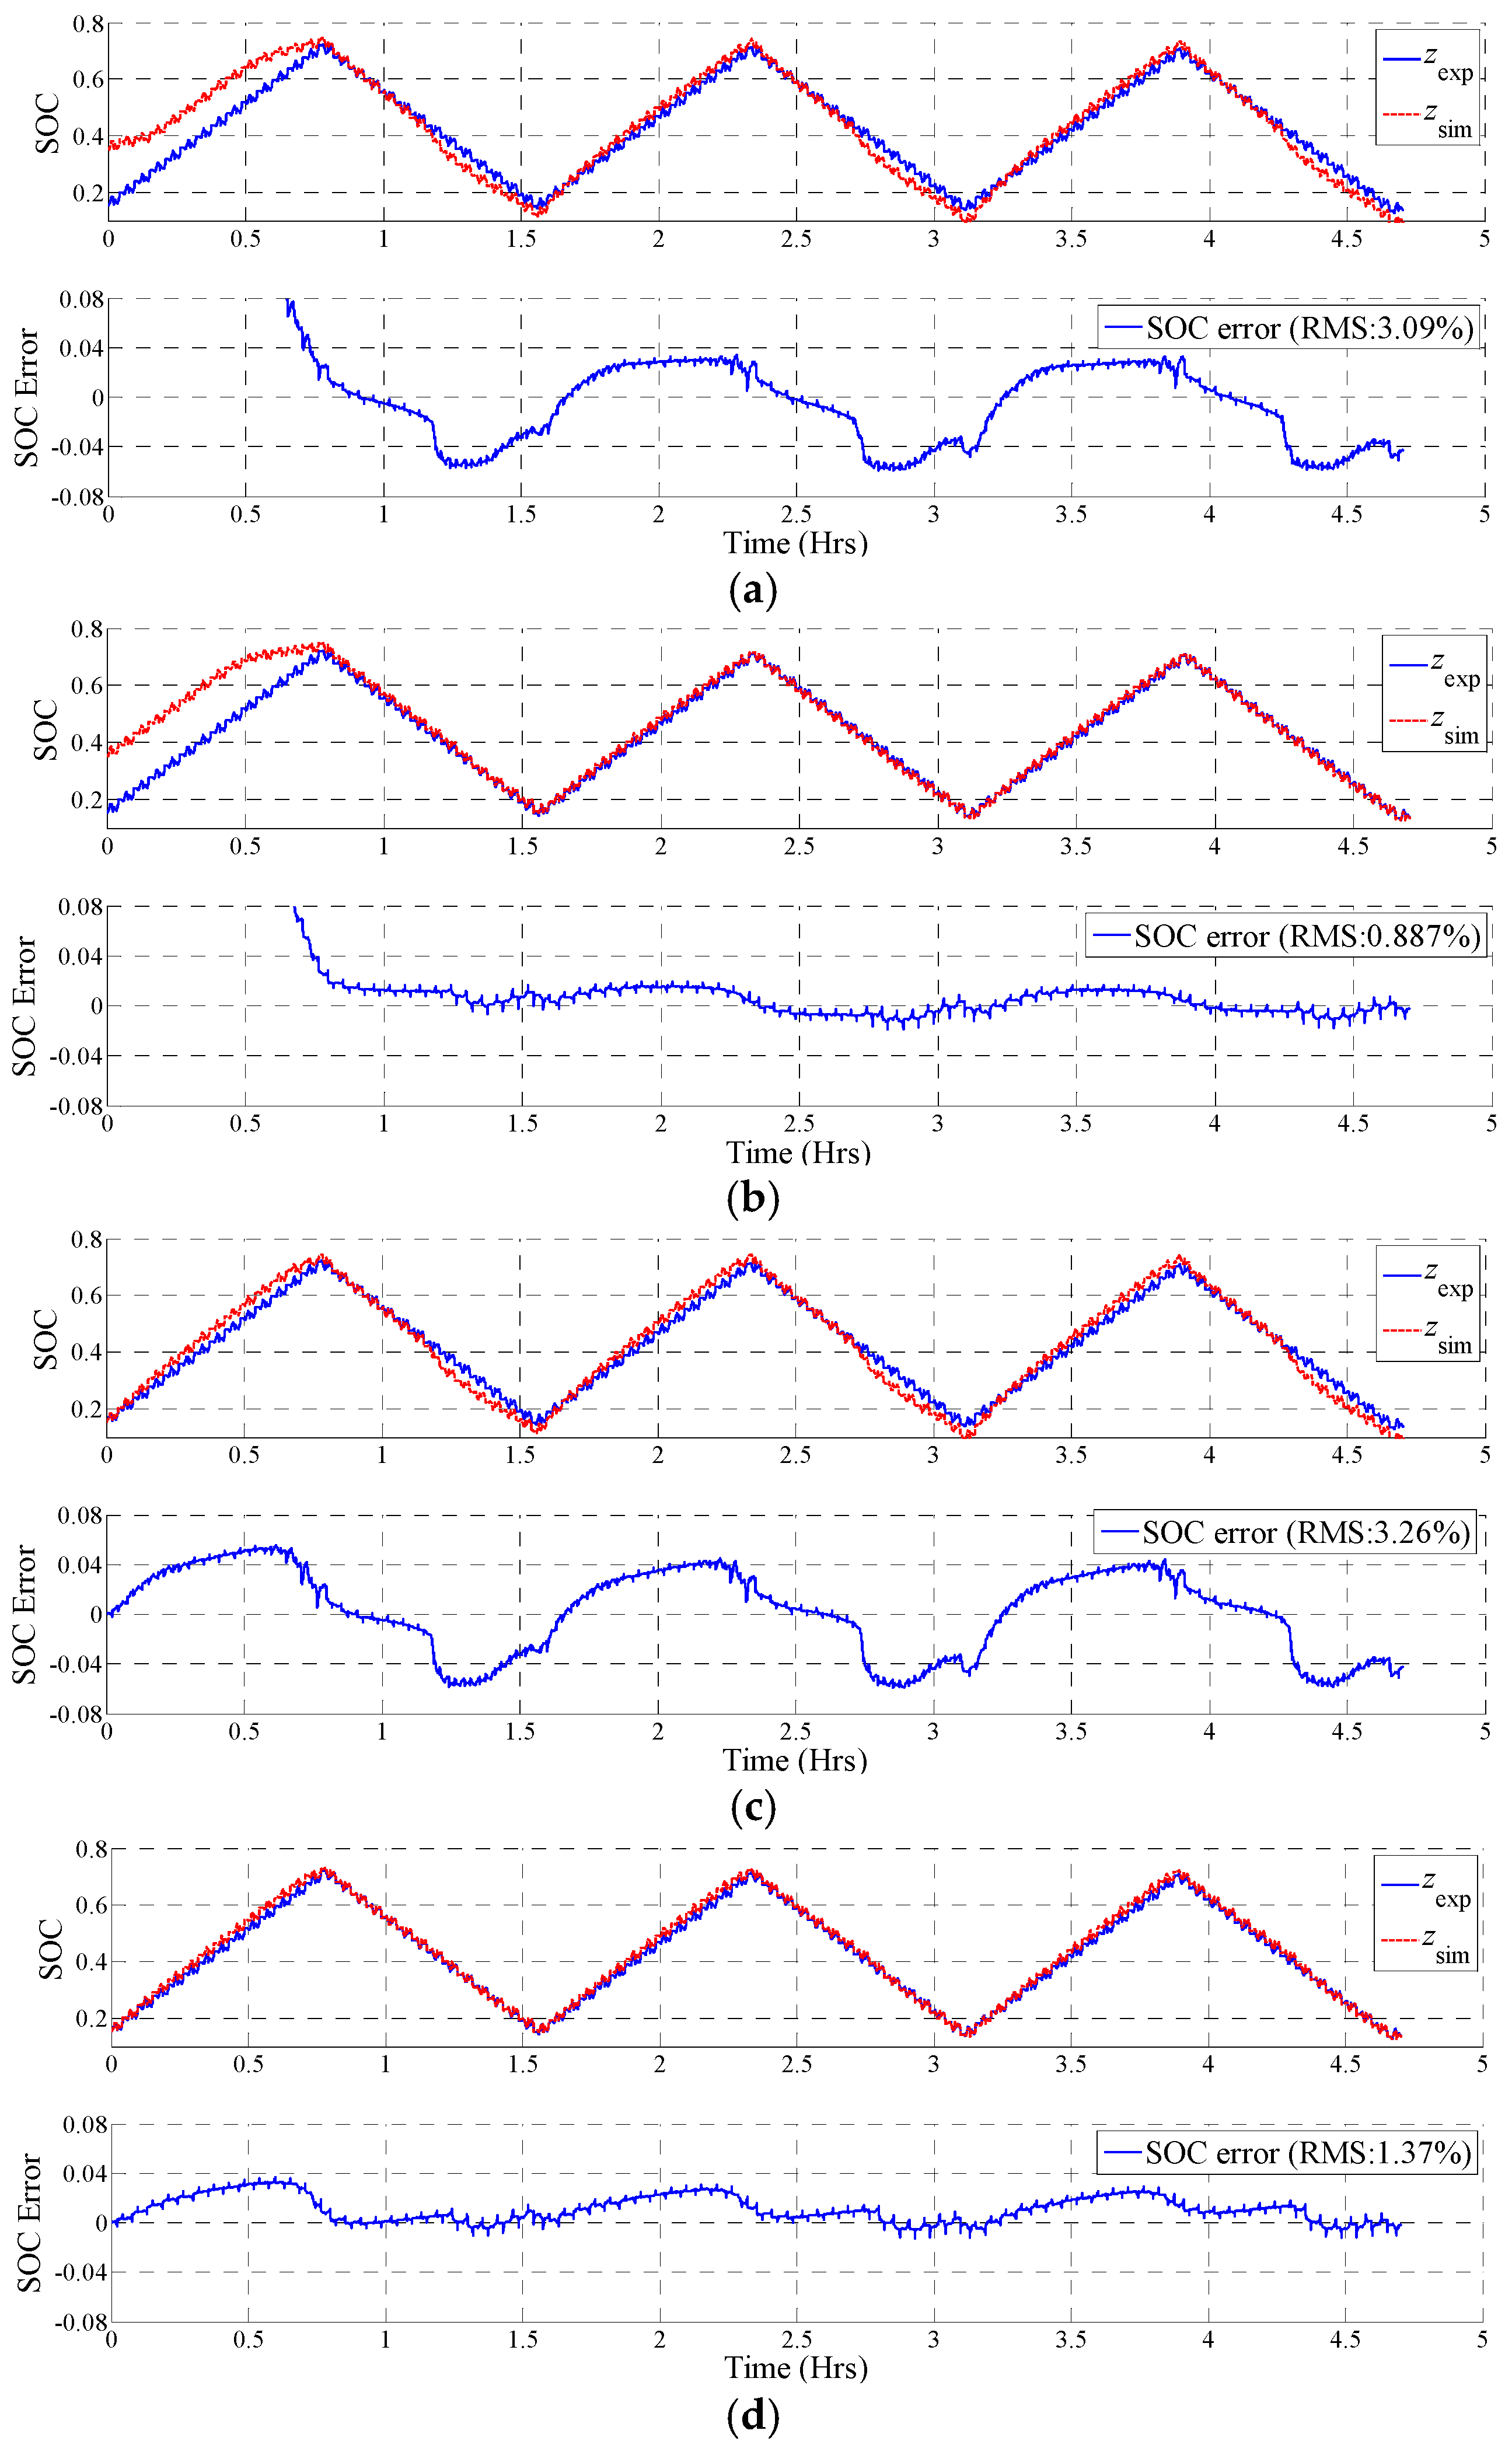
The same DST profile shown in Figure 8 is used for simulation. The initial SOC used in EKF is deliberately set as 20% larger than the actual initial SOC. EKF is first simulated with current independent parameters (Equations (20) and (21)) and the results are plotted in Figure 9a. It shows that EKF can effectively correct the biased initial SOC and the estimated SOC, zsim converges to actual SOC, zexp, in approximately 0.8 h. After that, zsim is able to follow zexp but there are certain discrepancies. The error of SOC estimation is controlled within −6% to +4% and the RMS error of SOC estimation is 3.09%.
If current dependent parameters are used (Equations (22) and (23)), EKF has improved the accuracy of SOC estimation. As shown in Figure 9b, after zsim has converged to zexp at 0.8 h, zsim precisely matches zexp until the test finishes. The error of SOC estimation is controlled within −2% to +2% and the RMS error of SOC estimation is 0.89%, when compared to 3.09% in Figure 9a. Such enhancement is attributed to the model with current dependent parameters that can predict terminal voltage with higher accuracy.
4.2.2. Simulation with Biased Current Measurement
The Li-ion battery pack used in HEVs usually uses inexpensive current sensors whose accuracy may not be as high as those used in the lab. Assuming the current sensor has 0.5 A biased measurement, the SOC solely based on Ah counting (no EKF) will deviate from the actual value over time. The error of SOC estimation could be as large as 20% at the end of the DST profile because of the accumulated error from biased current measurement.
In Figure 9c, EKF is simulated under the same DST profile using current independent parameters (Equations (20) and (21)). It shows that the accumulated error of SOC estimation induced by biased current measurement (0.5 A) has been eliminated. The error of SOC estimation is controlled within −7% to +4% and RMS error of SOC estimation is 3.26%.
Simulation is repeated using current dependent parameters (Equations (22) and (23)). As shown in Figure 9d, EKF not only eliminates the accumulated error caused by a biased current measurement but also maintains an accurate SOC estimation. The SOC error is controlled within −1% to 3% and RMS error is 1.37%. Comparisons between Figure 9a,b, as well as Figure 9c,d, have revealed the advantage of using current dependent parameters in EKF for SOC estimations.
5. Conclusions and Discussion
This work has verified the significance of current dependent parameters in Li-ion battery models and the advancement of its application in EKF-based SOC estimations. First, experimental data has revealed the trend of decreasing DCR at an increasing current of up to 25 C (Figure 5) and a Li-ion battery model is developed considering both current and SOC dependence of parameters. Results show that the model can predict a more accurate terminal voltage under DST profile, as shown in Figure 7 and summarized in Table 2. Furthermore, the model is implemented in EKF to improve the accuracy of SOC estimation. EKF is capable of compensating the error induced by a poor initial guess of SOC and a biased current measurement. Particularly, EKF, using current dependent parameters, is proven to have a more accurate SOC estimation than EKF using current independent parameters, as shown in Figure 9 and summarized in Table 2. The error of SOC estimation can be reduced by more than 50% if current dependence is considered, according to simulation using DST profile.
In conclusion, an important approach to improve the accuracy of Li-ion battery simulation and SOC estimation is to identify the current dependence of DCR. This is essential for LFP batteries used in MHEV where large pulses are present.
Future work will extend the work to state of power (SOP) algorithms. Considering the current dependent parameters can make huge enhancement in SOP estimations because the calculation of maximum power heavily relies on accurate DCR at large current.
Author Contributions
C.W. and R.F. developed the models and algorithms; C.W. conducted simulations; R.F collected and analyzed the experimental data; Z.X. conceived the work; Y.C. conducted literature review; R.F. wrote the paper.
Conflicts of Interest
The authors declare no conflict of interest.
Appendix A. Temperature Dependence of Model Parameters
The scope of this work is to investigate the current dependence of batteries in large current applications. To keep the main text concise, temperature dependence was not discussed.
In this Appendix, model parameters at different temperatures are provided in Figure A1. Based on that, we can tell the temperature variations in the main study (Figure 2, Figure 4 and Figure 8) only lead to a small change in each parameter. Therefore, not considering temperature dependence in this work only induces a small amount of error.
Figure A1.
Model Parameters at different cell temperatures including (a) R1; (b) R2; (c) τ1 and (d) τ2.
Figure A1.
Model Parameters at different cell temperatures including (a) R1; (b) R2; (c) τ1 and (d) τ2.
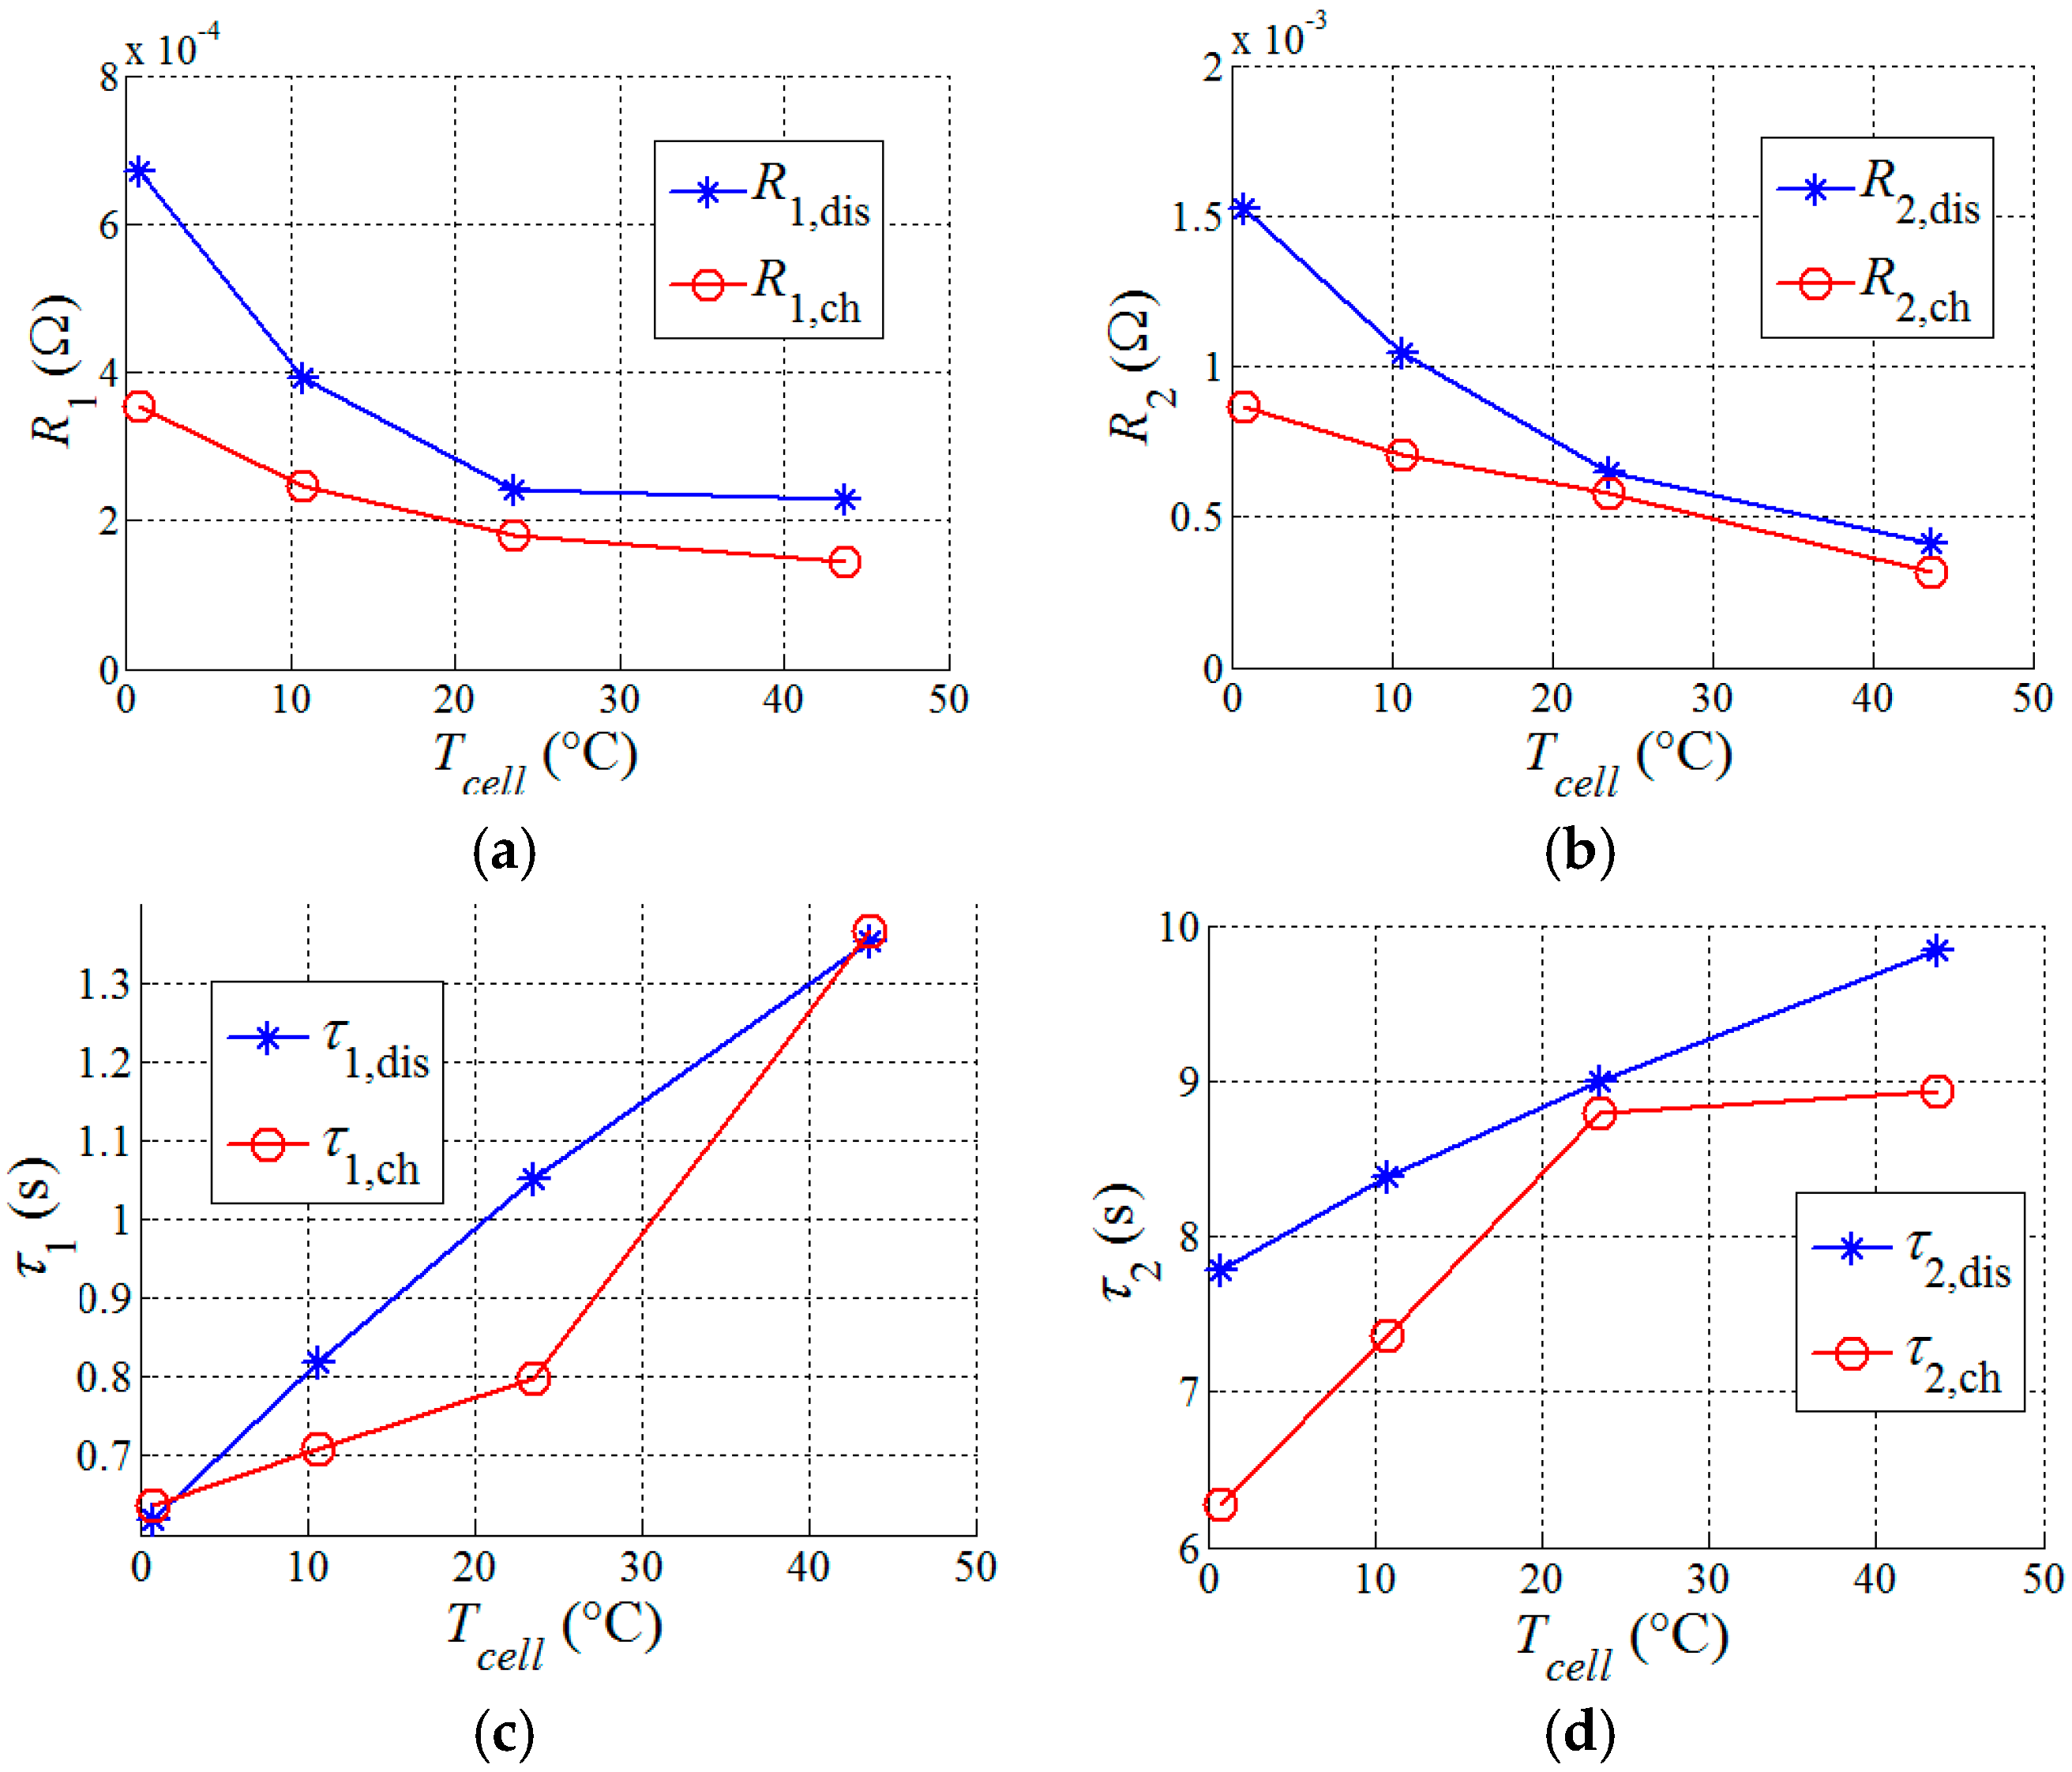
In real world applications, however, cell temperature will have much larger variations so temperature dependence will have to be considered. In this case, the two-dimensional parameter sets need to be extended to three-dimensional, i.e., θ (z, I and Tcell). Also, Equation (24) needs to be updated accordingly by finding each parameter value based on the cell temperature measured at the current time step. Last but not least, temperature dependence of OCV should be considered as well to ensure accurate SOC estimations [32].
References
- Kuypers, M. Application of 48 Volt for Mild Hybrid Vehicles and High Power Loads; SAE Technical Paper 2014-01-1790; SAE International: Warrendale, PA, USA, 2014. [Google Scholar] [CrossRef]
- Pesaran, A. Choices and Requirements of Batteries for EVs, HEVs, PHEVs a CALSTART Webinar; National Renewable Energy Laboratory: Golden, CO, USA, 2011.
- European Automobile Manufacturers Association. A Review of Battery Technologies for Automotive Applications; European Automobile Manufacturers Association: Brussels, Belgium, 2014. [Google Scholar]
- Plett, G. Extended Kalman filtering for battery management systems of LiPB-based HEV battery packs Part 1: Background. J. Power Sources 2004, 134, 252–261. [Google Scholar] [CrossRef]
- Waag, W.; Kabitz, S.; Sauer, D. Experimental investigation of the lithium-ion battery impedance characteristic at various conditions and aging states and its influence on the application. Appl. Energy 2013, 102, 885–897. [Google Scholar] [CrossRef]
- Waag, W.; Fleischer, C.; Sauer, D. On-line estimation of lithium-ion battery impedance parameters using a novel varied-parameters approach. J. Power Sources 2013, 237, 260–269. [Google Scholar] [CrossRef]
- Xu, X.; Shui, M.; Zheng, W.; Shu, J.; Hui, L.; Xu, L.; Cheng, L.; Feng, L.; Ren, Y. Time-domain simulations of transient response in LiFePO4 cathode lithium ion batteries. Curr. Appl. Phys. 2014, 14, 702–707. [Google Scholar] [CrossRef]
- Maheshwari, A.; Dumitrescu, M.; Destro, M.; Santarelli, M. Inverse parameter determination in the development of an optimized lithium iron phosphate e Graphite battery discharge model. J. Power Sources 2016, 307, 160–172. [Google Scholar] [CrossRef]
- Noren, D.; Hoffman, M. Clarifying the Butler-Volmer equation and related approximations for calculating activation losses in solid oxide fuel cell models. J. Power Sources 2005, 152, 175–181. [Google Scholar] [CrossRef]
- Ratnakumar, B.; Smart, M.; Whitcanack, L.; Ewell, R. The impedance characteristics of Mars Exploration Rover Li-ion batteries. J. Power Sources 2006, 159, 1428–1439. [Google Scholar] [CrossRef]
- Waag, W.; Fleischer, C.; Sauer, D. Adaptive on-line prediction of the available power of lithium-ion batteries. J. Power Sources 2013, 242, 548–559. [Google Scholar] [CrossRef]
- Huang, J.; Zhang, J.; Li, Z.; Song, S.; Wu, N. Exploring Differences between charge and discharge of LiMn2O4/Li half-cell with dynamic electrochemical impedance spectroscopy. Electrochim. Acta 2014, 131, 228–235. [Google Scholar] [CrossRef]
- Srinivasan, V.; Newman, J. Discharge model for the lithium iron-phosphate electrode. J. Electrochem. Soc. 2004, 151, A1517–A1529. [Google Scholar] [CrossRef]
- Wang, C.; Kasavajjula, U.S.; Arce, P.E. A discharge model for phase transformation electrodes: Formulation, experimental validation, and analysis. J. Phys. Chem. C 2007, 111, 16656–16663. [Google Scholar] [CrossRef]
- Dubarry, M.; Vuillaume, N.; Liaw, B.Y. From single cell model to battery pack simulation for Li-ion batteries. J. Power Sources 2009, 186, 500–507. [Google Scholar] [CrossRef]
- Chiang, Y.H.; Sean, W.Y.; Ke, J.C. Online estimation of internal resistance and open-circuit voltage of lithium-ion batteries in electric vehicles. J. Power Sources 2011, 196, 3921–3932. [Google Scholar] [CrossRef]
- Liaw, B.Y.; Nagasubramanian, G.; Jungst, R.G.; Doughty, D.H. Modeling of lithium ion cells—A simple equivalent-circuit model approach. Solid State Ion. 2004, 175, 835–839. [Google Scholar]
- Dubarry, M.; Liaw, B.Y. Development of a universal modeling tool for rechargeable lithium batteries. J. Power Sources 2007, 174, 856–860. [Google Scholar] [CrossRef]
- Hu, Y.; Yurkovich, S.; Guezennec, Y.; Yurkovich, B.J. A technique for dynamic battery model identification in automotive applications using linear parameter varying structures. Control Eng. Pract. 2009, 17, 1190–1201. [Google Scholar] [CrossRef]
- Hu, Y.; Yurkovich, S. Linear parameter varying battery model identification using subspace methods. J. Power Sources 2011, 196, 2913–2923. [Google Scholar] [CrossRef]
- Chen, M.; Rincon-Mora, G. Accurate electrical battery model capable of predicting runtime and IV performance. IEEE Trans. Energy Convers. 2006, 21, 504–511. [Google Scholar] [CrossRef]
- Einhorn, M.; Conte, F.; Kral, C.; Fleig, J. Comparison, selection, and parameterization of electrical battery models for automotive applications. IEEE Trans. Power Electron. 2013, 28, 1429–1437. [Google Scholar] [CrossRef]
- Saxena, S.; Raman, S.R.; Saritha, B.; John, V. A novel approach for electrical circuit modeling of Li-ion battery for predicting the steady-state and dynamic I–V characteristics. Sādhanā 2016, 41, 479–487. [Google Scholar]
- Andre, D.; Meiler, M.; Steiner, K.; Walz, H.; Soczka-Guth, T.; Sauer, D.U. Characterization of high-power lithium-ion batteries by electrochemical impedance spectroscopy. II: Modelling. J. Power Sources 2011, 196, 5349–5356. [Google Scholar] [CrossRef]
- Hu, X.; Li, S.; Peng, H. A comparative study of equivalent circuit models for Li-ion batteries. J. Power Sources 2012, 198, 359–367. [Google Scholar] [CrossRef]
- Verbrugge, M.; Tate, E. Adaptive state of charge algorithm for nickel metal hydride batteries including hysteresis phenomena. J. Power Sources 2004, 126, 236–2449. [Google Scholar] [CrossRef]
- Huria, T.; Ludovici, G.; Lutzemberger, G. State of charge estimation of high power lithium iron phosphate cells. J. Power Sources 2014, 249, 92–102. [Google Scholar] [CrossRef]
- Lee, S.; Kim, J.; Lee, J.; Cho, B. State-of-charge and capacity estimation of lithium-ion battery using a new open-circuit voltage versus state-of-charge. J. Power Sources 2008, 185, 1367–1373. [Google Scholar] [CrossRef]
- Plett, G. Extended Kalman filtering for battery management systems of LiPB-based HEV battery packs Part 2. Modeling and identification. J. Power Sources 2004, 134, 262–276. [Google Scholar] [CrossRef]
- Plett, G. Extended Kalman filtering for battery management systems of LiPB-based HEV battery packs Part 3. State and parameter estimation. J. Power Sources 2004, 134, 277–292. [Google Scholar] [CrossRef]
- Hu, X.; Li, S.; Peng, H.; Sun, F. Robustness analysis of State-of-Charge estimation methods for two types of Li-ion batteries. J. Power Sources 2012, 217, 209–219. [Google Scholar] [CrossRef]
- Xing, Y.; He, W.; Pecht, M.; Tsui, K. State of charge estimation of lithium-ion batteries using the open-circuit voltage at various ambient temperatures. Appl. Energy 2014, 113, 106–115. [Google Scholar] [CrossRef]
- He, W.; Williard, N.; Chen, C.; Pecht, M. State of charge estimation for Li-ion batteries using neural network modeling and unscented Kalman filter-based error cancellation. Int. J. Electr. Power Energy Syst. 2014, 62, 783–791. [Google Scholar] [CrossRef]
- Marongiu, A.; Nubbaum, F.; Waag, W.; Garmendia, M.; Sauer, D. Comprehensive study of the influence of aging on the hysteresis behavior of a lithium iron phosphate cathode-based lithium ion battery—An experimental investigation of the hysteresis. Appl. Energy 2016, 171, 629–645. [Google Scholar] [CrossRef]
- Dreyer, W.; Jamnik, J.; Guhlke, C.; Huth, R.; Moskon, J.; Gaberscek, M. The thermodynamic origin of hysteresis in insertion batteries. Nat. Mater. 2010, 9, 448–453. [Google Scholar] [CrossRef] [PubMed]
- Hoque, M.; Hannan, M.; Mohamed, A. Charging and discharging model of lithium-ion battery for charge equalization control using particle swarm optimization algorithm. J. Renew. Sustain. Energy 2016, 8. [Google Scholar] [CrossRef]
- Kalman, R.E. A new approach to linear filtering and prediction problems. J. Basic Eng. 1960, 82, 35–45. [Google Scholar] [CrossRef]
Figure 1.
(a) The Overall Scheme of equivalent circuit model (ECM) and (b) open circuit voltage (OCV), versus state of charge (SOC).
Figure 1.
(a) The Overall Scheme of equivalent circuit model (ECM) and (b) open circuit voltage (OCV), versus state of charge (SOC).
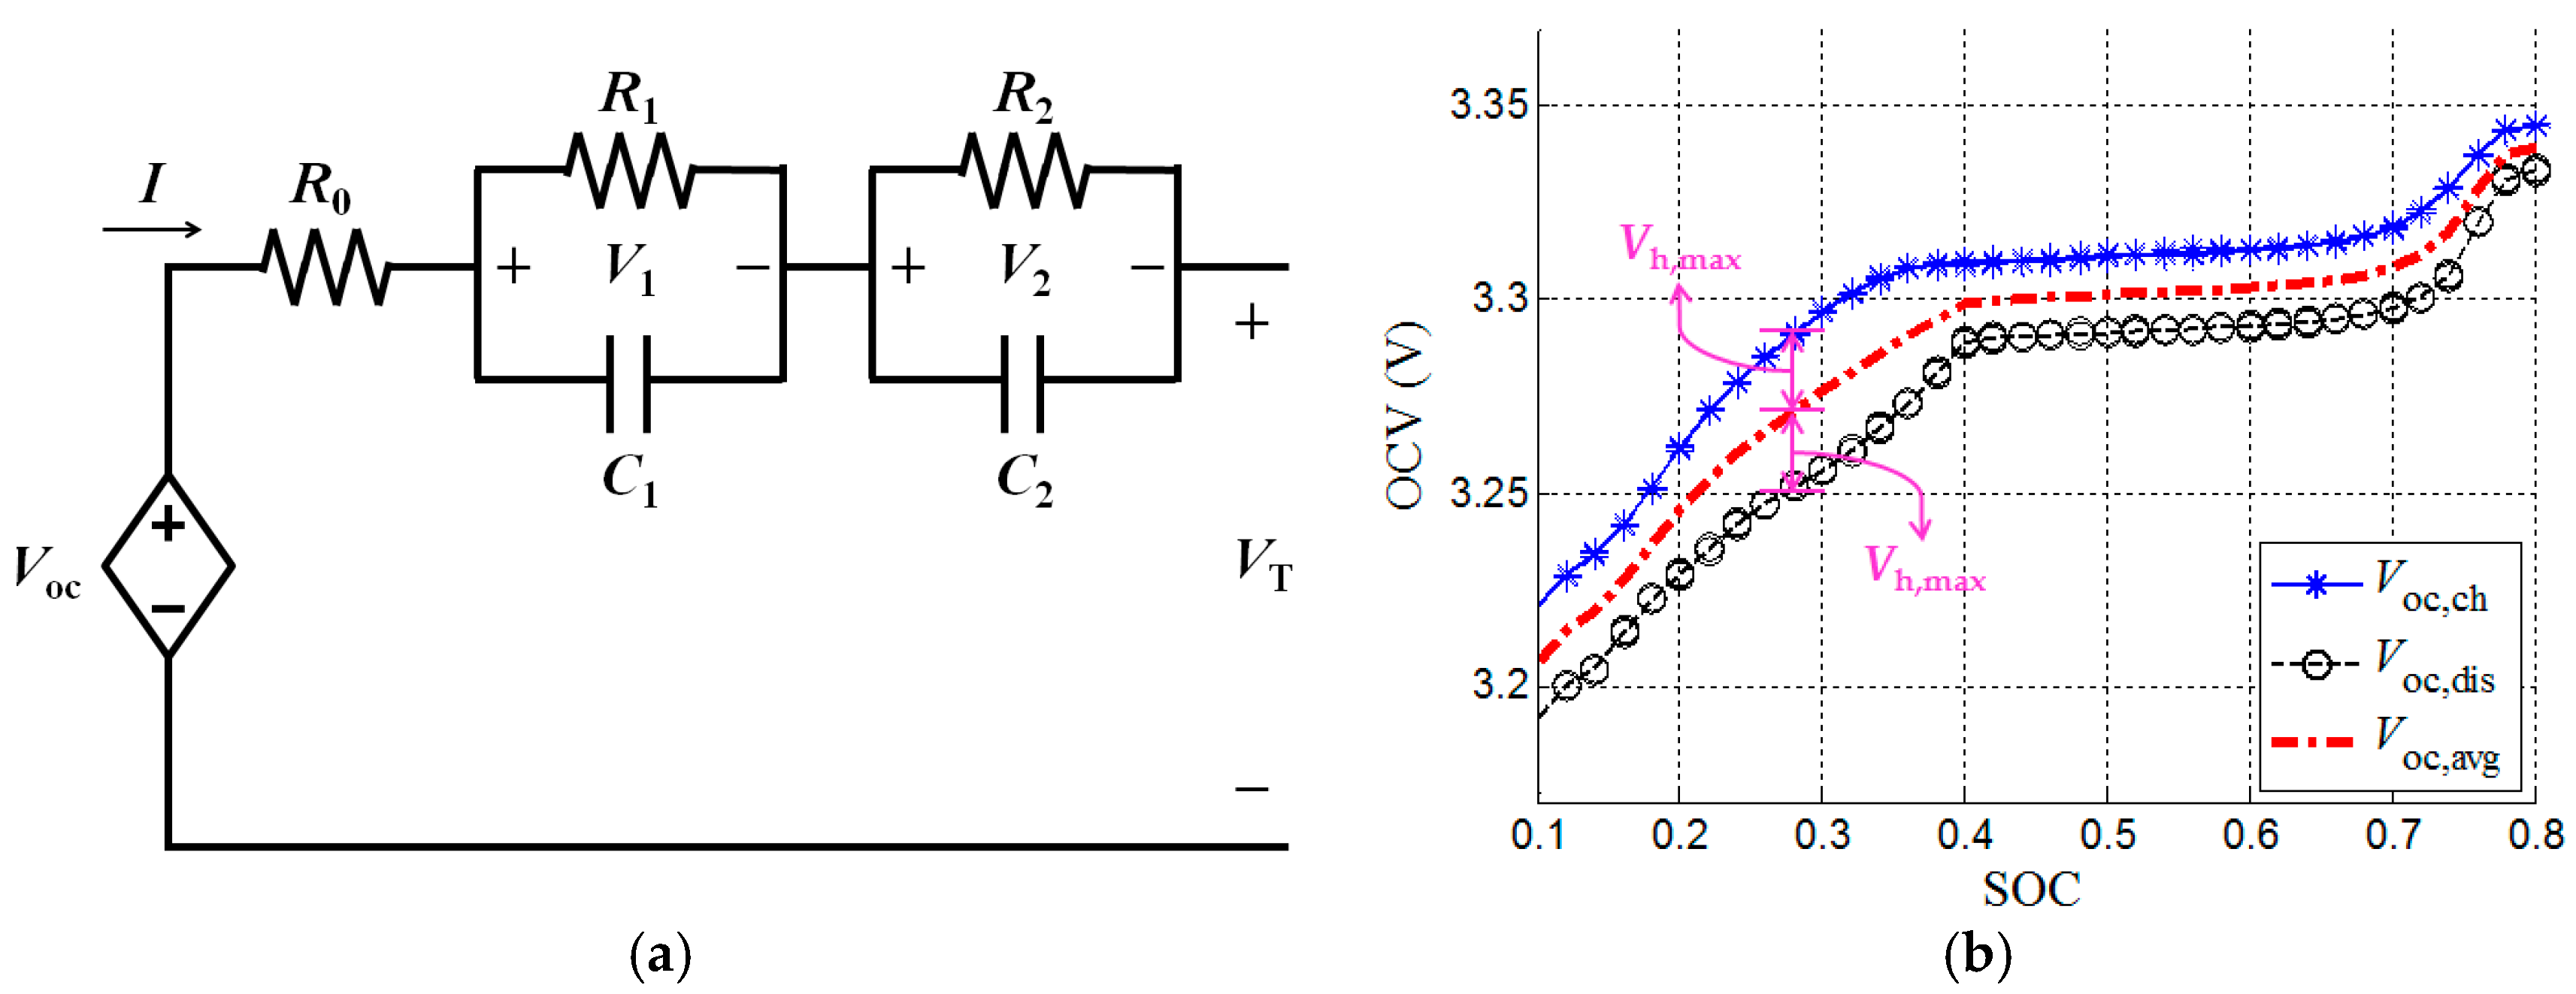
Figure 2.
(Hybrid Pulse Power Characterization) HPPC test conducted to identify parameters at different SOC with (a) the entire process and (b) a zoomed-in profile at 47%.
Figure 2.
(Hybrid Pulse Power Characterization) HPPC test conducted to identify parameters at different SOC with (a) the entire process and (b) a zoomed-in profile at 47%.

Figure 3.
Identified parameters versus SOC at baseline currents including (a) R1 and (b) R2.

Figure 4.
Pulses tested at (a) 4 discharge currents and (b) 4 charge currents at 50% SOC. Dots represent experimental data and the curves represent simulation. The root-mean-square (RMS) errors between simulated and experimental voltage are below 1.5 mV, showing good fitting quality.
Figure 4.
Pulses tested at (a) 4 discharge currents and (b) 4 charge currents at 50% SOC. Dots represent experimental data and the curves represent simulation. The root-mean-square (RMS) errors between simulated and experimental voltage are below 1.5 mV, showing good fitting quality.

Figure 5.
Identified parameters versus current at 50% SOC including (a) R1; (b) R2; (c) τ1, and (d) τ2.
Figure 5.
Identified parameters versus current at 50% SOC including (a) R1; (b) R2; (c) τ1, and (d) τ2.

Figure 6.
Contour plots of 2D look-up tables for each parameter at different SOC and current including (a) R1,dis; (b) R2,dis; (c) R1,ch, and (d) R2,ch.
Figure 6.
Contour plots of 2D look-up tables for each parameter at different SOC and current including (a) R1,dis; (b) R2,dis; (c) R1,ch, and (d) R2,ch.


Figure 7.
(a) Simulation of dynamic stress testing (DST) without considering current dependence of parameters and (b) Simulation of DST considering current dependence of parameters.
Figure 7.
(a) Simulation of dynamic stress testing (DST) without considering current dependence of parameters and (b) Simulation of DST considering current dependence of parameters.
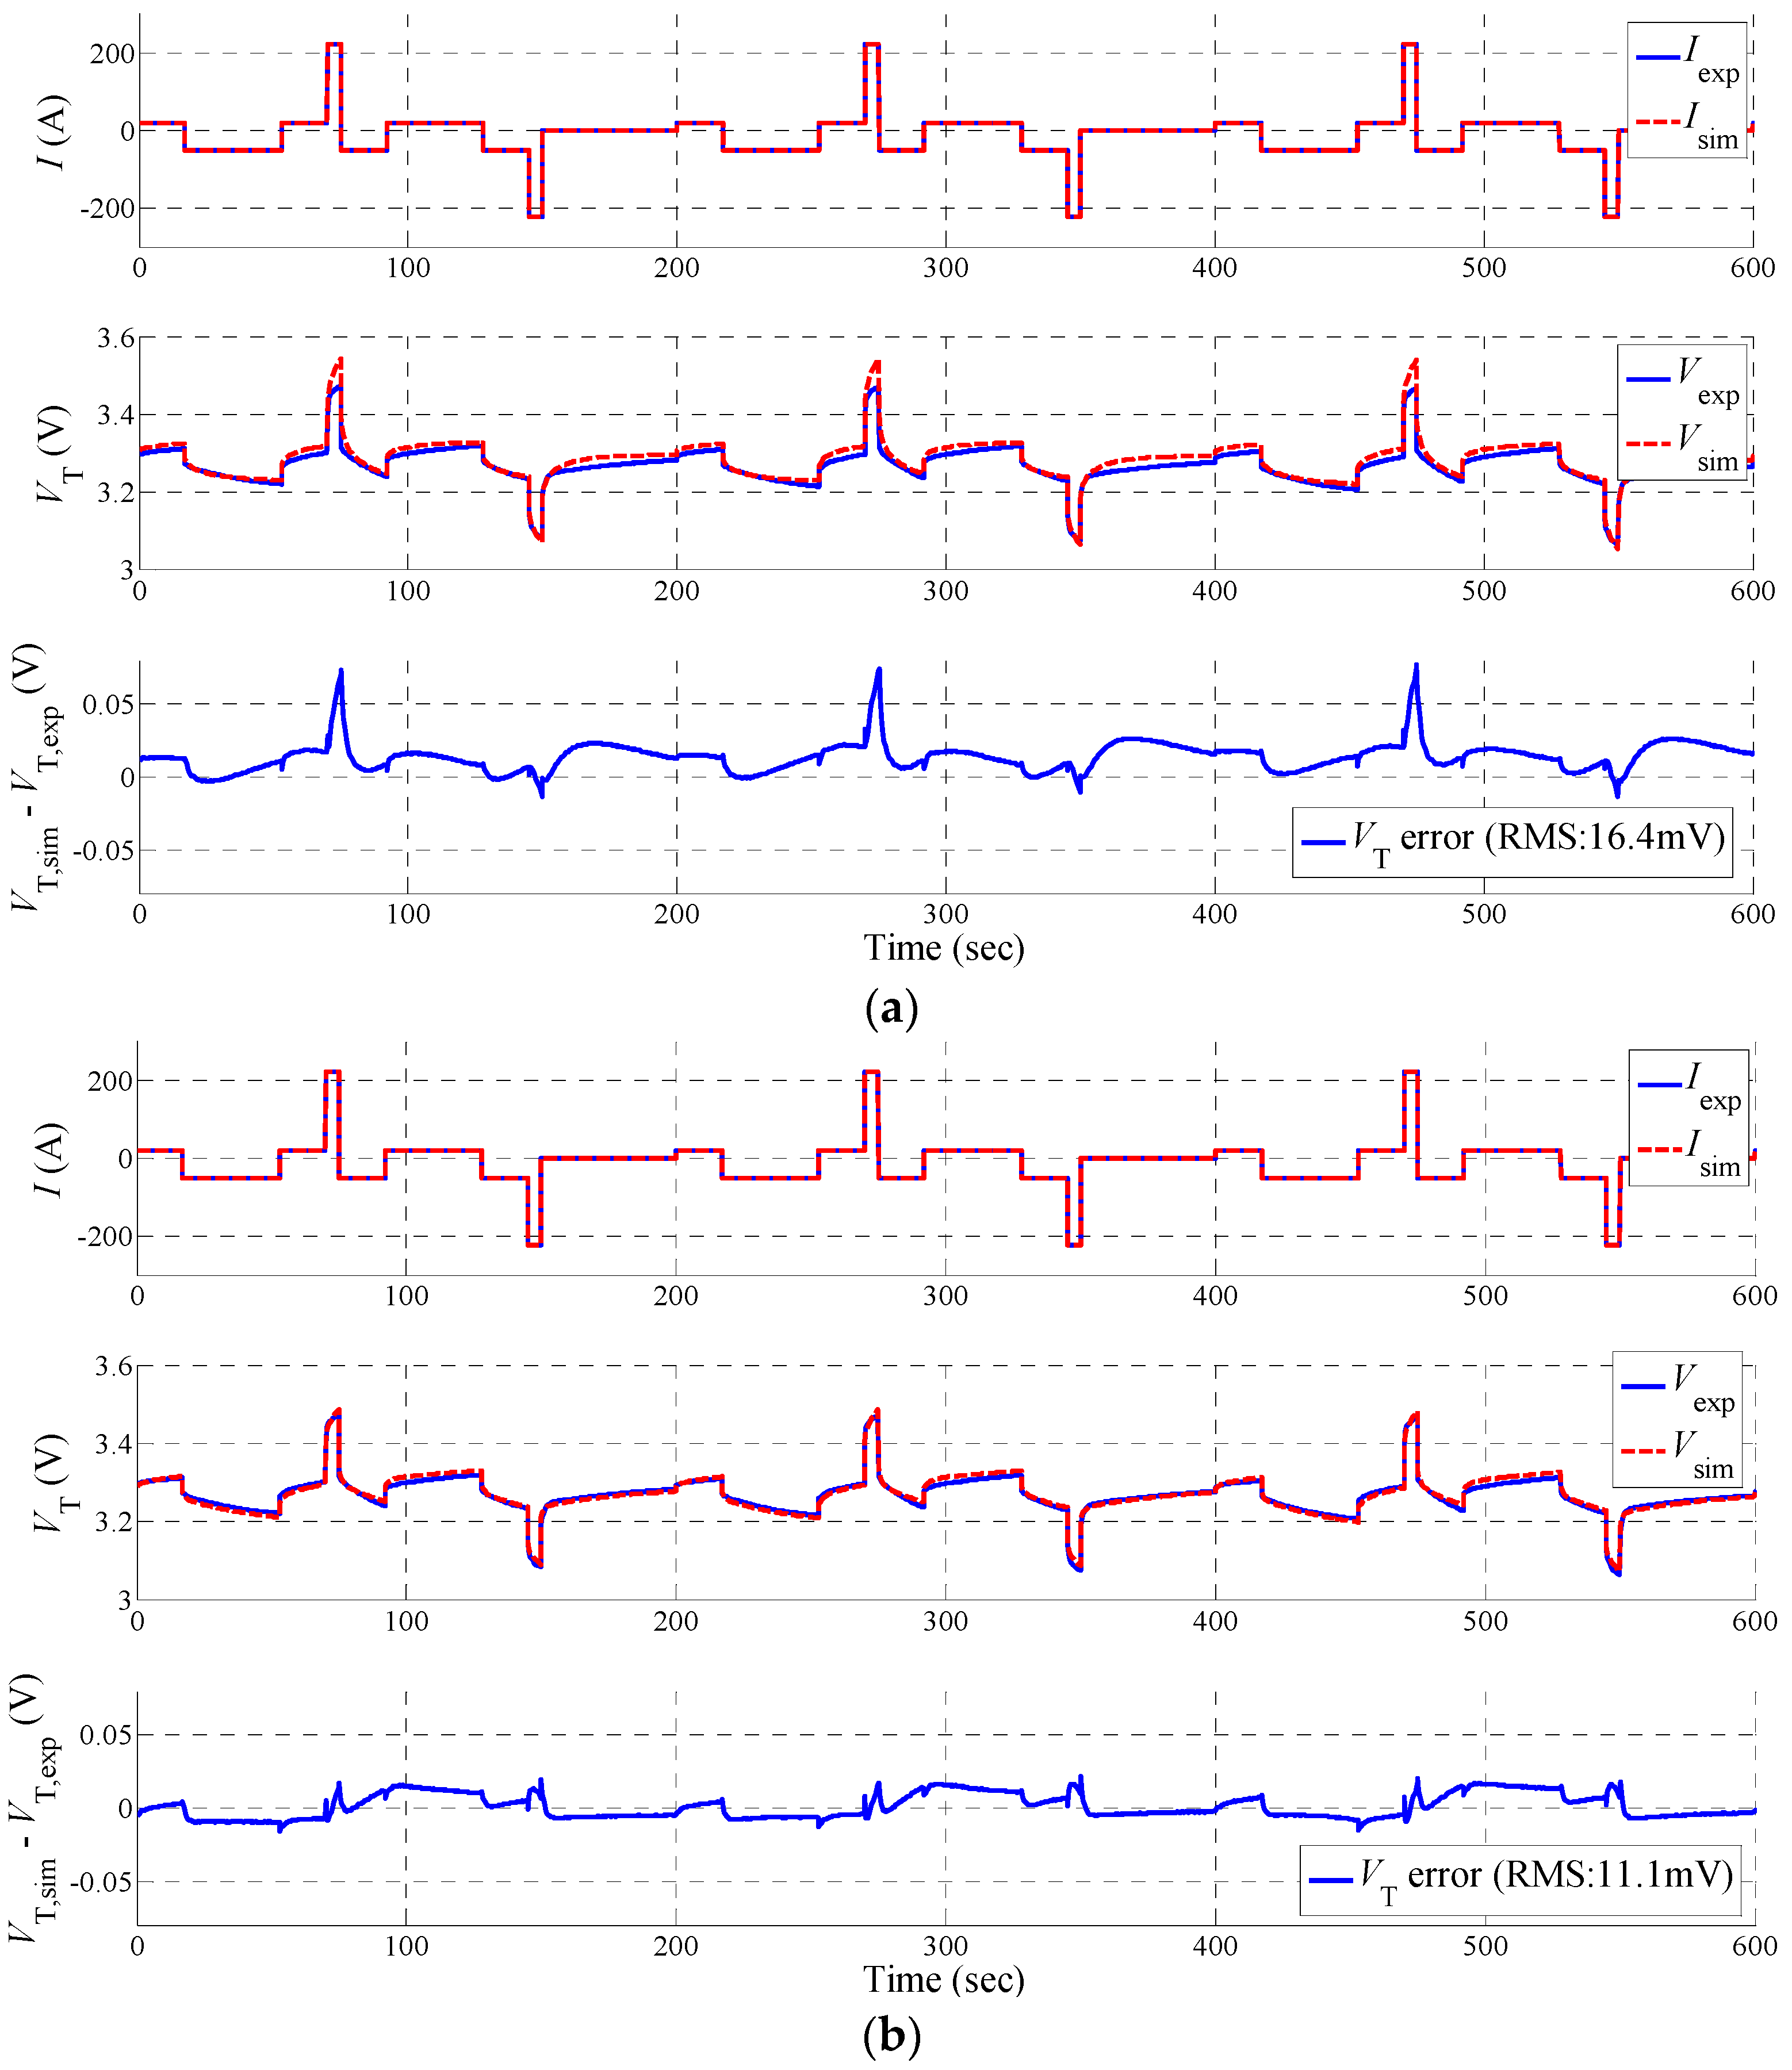
Figure 8.
Test data of current and cell temperature under DST profile.

Figure 9.
SOC estimation using extended Kalman Filters (EKF) with (a) current independent parameters given 20% initial SOC error; (b) current dependent parameters given 20% initial SOC error; (c) current independent parameters given 0.5 A biased current measurement; and (d) current dependent parameters given 0.5 A biased current measurement.


Table 1.
Pulses used to identify current dependence of parameters (at 50% SOC).
| Discharge | Charge |
|---|---|
| 14 A/60 s | 14 A/60 s |
| 100 A/20 s (Baseline) | 75 A/20 s (Baseline) |
| 200 A/20 s | 140 A/20 s |
| 350 A/10 s | 200 A/10 s |
Table 2.
Summary of improvements by using current dependent parameters.
| Simulation Cases | Errors | With Current Independent Parameters | With Current Dependent Parameters |
|---|---|---|---|
| Simulation of the Li-ion Model | RMS error of VT | 16.4 mV | 11.1 mV |
| SOC estimation using EKF given 20% initial SOC error | Bounds of SOC error | −6%–4% | −2%–2% |
| RMS error of SOC | 3.09% | 0.89% | |
| SOC estimation using EKF given 0.5 A biased current measurement | Bounds of SOC error | −7%–4% | −1%–3% |
| RMS error of SOC | 3.26% | 1.37% |
© 2017 by the authors. Licensee MDPI, Basel, Switzerland. This article is an open access article distributed under the terms and conditions of the Creative Commons Attribution (CC BY) license (http://creativecommons.org/licenses/by/4.0/).
Share and Cite
MDPI and ACS Style
Wu, C.; Fu, R.; Xu, Z.; Chen, Y. Improved State of Charge Estimation for High Power Lithium Ion Batteries Considering Current Dependence of Internal Resistance. Energies 2017, 10, 1486. https://doi.org/10.3390/en10101486
AMA Style
Wu C, Fu R, Xu Z, Chen Y. Improved State of Charge Estimation for High Power Lithium Ion Batteries Considering Current Dependence of Internal Resistance. Energies. 2017; 10(10):1486. https://doi.org/10.3390/en10101486
Chicago/Turabian StyleWu, Cunxue, Rujian Fu, Zhongming Xu, and Yang Chen. 2017. "Improved State of Charge Estimation for High Power Lithium Ion Batteries Considering Current Dependence of Internal Resistance" Energies 10, no. 10: 1486. https://doi.org/10.3390/en10101486
Note that from the first issue of 2016, this journal uses article numbers instead of page numbers. See further details here.