Analysis of the Potential for Use of Floating PV Power Plant on the Skadar Lake for Electricity Supply of Aluminium Plant in Montenegro


1
Faculty of Electrical Engineering, University of Montenegro, 81000 Podgorica, Montenegro
2
School of Electrical Engineering, University of Belgrade, 11000 Belgrade, Serbia
*
Author to whom correspondence should be addressed.
Energies 2017, 10(10), 1505; https://doi.org/10.3390/en10101505
Submission received: 6 July 2017
/
Revised: 9 September 2017
/
Accepted: 21 September 2017
/
Published: 29 September 2017
(This article belongs to the Section L: Energy Sources)
Abstract
:This paper deals with a conceptual solution for the supply of a part of electrical energy for the needs of Aluminium Plant Podgorica (KAP) in Montenegro from a large Floating Photovoltaic Power Plant (FPPP), that would be installed on the nearby lake. The recommended FPPP, with an innovative azimuth angle control method and total installed power of 90 MWp, would consist of 18 power plants having an installed power of 5 MWp each. An analysis using the NREL solar insolation database ascertained that the recommended FPPP power plant can achieve a significantly higher production in comparison with previous solutions. An economic analysis has shown that the recommended power plant would yield positive economic indicators. Additionally, such a power plant would significantly contribute to the reduction of CO2 emissions.
1. Introduction
Montenegro is a relatively small country located in the Balkans in the southeast part of Europe. The total area of the country is 13,812 km2, and it has 620,029 inhabitants. Montenegro is a tourism—oriented country, with a drive to achieve as high standards as possible in the sense of the protection of the environment. Considering these facts, Montenegro declared itself to be an ecological state. The ecological state declaration of Montenegro was adopted at a session of the Montenegrin Parliament held on 20 September 1991. The strategic focus of the country was defined within the declaration of the adopting and applying the highest standards and norms in the areas of environmental protection, the preservation of Nature and economic development based on the principles of an ecologically sustainable system [1].
One of the main problems in the realization of this ecological policy is related to the structure of the production and consumption of electrical energy. The total consumption of electrical energy in Montenegro amounts to 3563 GWh/year [2]. About 89.75% of this electrical energy is provided by domestic production, while the remaining 10.25% of the electrical energy is imported [2]. The electrical energy generating capacity in Montenegro consists of a thermal power plant (TE Pljevlja) and several hydropower plants, and the goal is that the share of electrical energy generated from renewable sources will represent 33% of the total produced electrical energy by 2020 [3]. The annual production of TE Pljevlja, which burns about 1635 kt of coal annually resulting in CO2 emissions of about 1500 kt/year, amounts to 1406 GWh [2]. Considering the obsolescence and shortage of equipment for flue gas treatment and the geographical position of the power plant, TE Pljevlja and its cooling tower are recognized as the main ecological problem in the target region due to the formation of acid deposition and the problem of ash disposal. From these reasons, the production of this plant is one of the main current ecological problems in Montenegro.
The main consumer of electrical energy in Montenegro is a factory for the production of aluminium (KAP), situated in the immediate vicinity of Podgorica, the capital of Montenegro. This factory accounts for more than 25% in the total electrical energy consumption in Montenegro, namely about 63.7% of the energy produced at TE Pljevlja. If the consumption of electrical energy in the aluminium factory were provided from renewable sources, the conditions for a gradual substitution of the TE Pljevlja would be accomplished, and this would improve the ecological image of Montenegro to a great extent. The KAP is located on terrain having a significant solar energy potential, with a solar insolation of about 1600 kWh/m2/year. From this reason, the building of a photovoltaic (PV) power plant to supply the power consumed by the KAP seems to be a potential solution.
FPPP systems are being considered more and more as electricity supply solutions all over the world, as well as for solving other problems like water evaporation from various reservoirs and lakes [4]. Recently, many floating PV systems with varying degrees of utilization have been developed in ponds, reservoirs, canals, rivers and oceans. Trapani and Redón Santafé [5] reviewed the various floating PV projects that have recently been built. The effects of installing a floating PV system on the surface of a pit lake were estimated for the case of an open-pit limestone mine in Korea currently in the process of closure are described in [6]. Considering the environmental and economic gains from the greenhouse gas reduction and electricity sales, a floating PV system on a pit lake of an abandoned mine site is considered to be an efficient reuse option for abandoned mines. The assessments of the feasibility of a floating PV power plants integrated with an existing fossil plant in Malta, were analyzed by Trapani and Millar in [7].
A FPPP plant may use standard PV silicon modules. However, the opportunities for the improvement of classical onshore PV technologies for the use in the FPPP are developed and analyzed here. In [8], Ferrer-Gisbert et al. described a new PV floating cover system for water reservoirs. The system consists of polyethylene floating modules which, with the use of tension producing elements and elastic fasteners, are conveniently adapted to varying reservoir water levels. Trapani et al. in [9] analysed a flexible thin PV film that floated directly on the waterline. The articles [10,11] present the main design features and PV requirements of a FPPP for water irrigation reservoirs whose purpose is to reduce the evaporation of water, while generating electrical power at the same time.
This paper proposes a preliminary solution for a FPPP to be located on a part of the Skadar Lake situated at the distance of about 6 km from the KAP. The proposed installed power of the FPPP is 90 MWp. The calculations carried out in this paper show that the expected annual production of the power plant would be about 186.05 GWh/year, providing about 20.78% the KAP’s electrical energy needs. This paper also describes an innovative concept for the control of an azimuth angle of the floating PV panels providing about a 27.68% higher production per year at the power plant in comparison to the usual conceptual solutions of FPPPs. The installation of reflective surfaces among the arrays of PV modules is recommended for the purposes of additionally increasing the system efficiency. The recommended concept would enable a significant increase in the production of this FPPP in relation to usual solutions having a fixed azimuth angle.
2. Energy Demands of the KAP
The construction of an aluminium smelter in Montenegro was proposed for the first time in the 1960s, when significant quantities of high quality bauxite ore were discovered near the city of Nikšić. The KAP produces its own alumina, extracting it out of the bauxite shipped from the Nikšić bauxite mine. The factory also has its own production of pre-baked anodes. The smelter has an installed capacity of 120,000 tons of liquid aluminium per year.
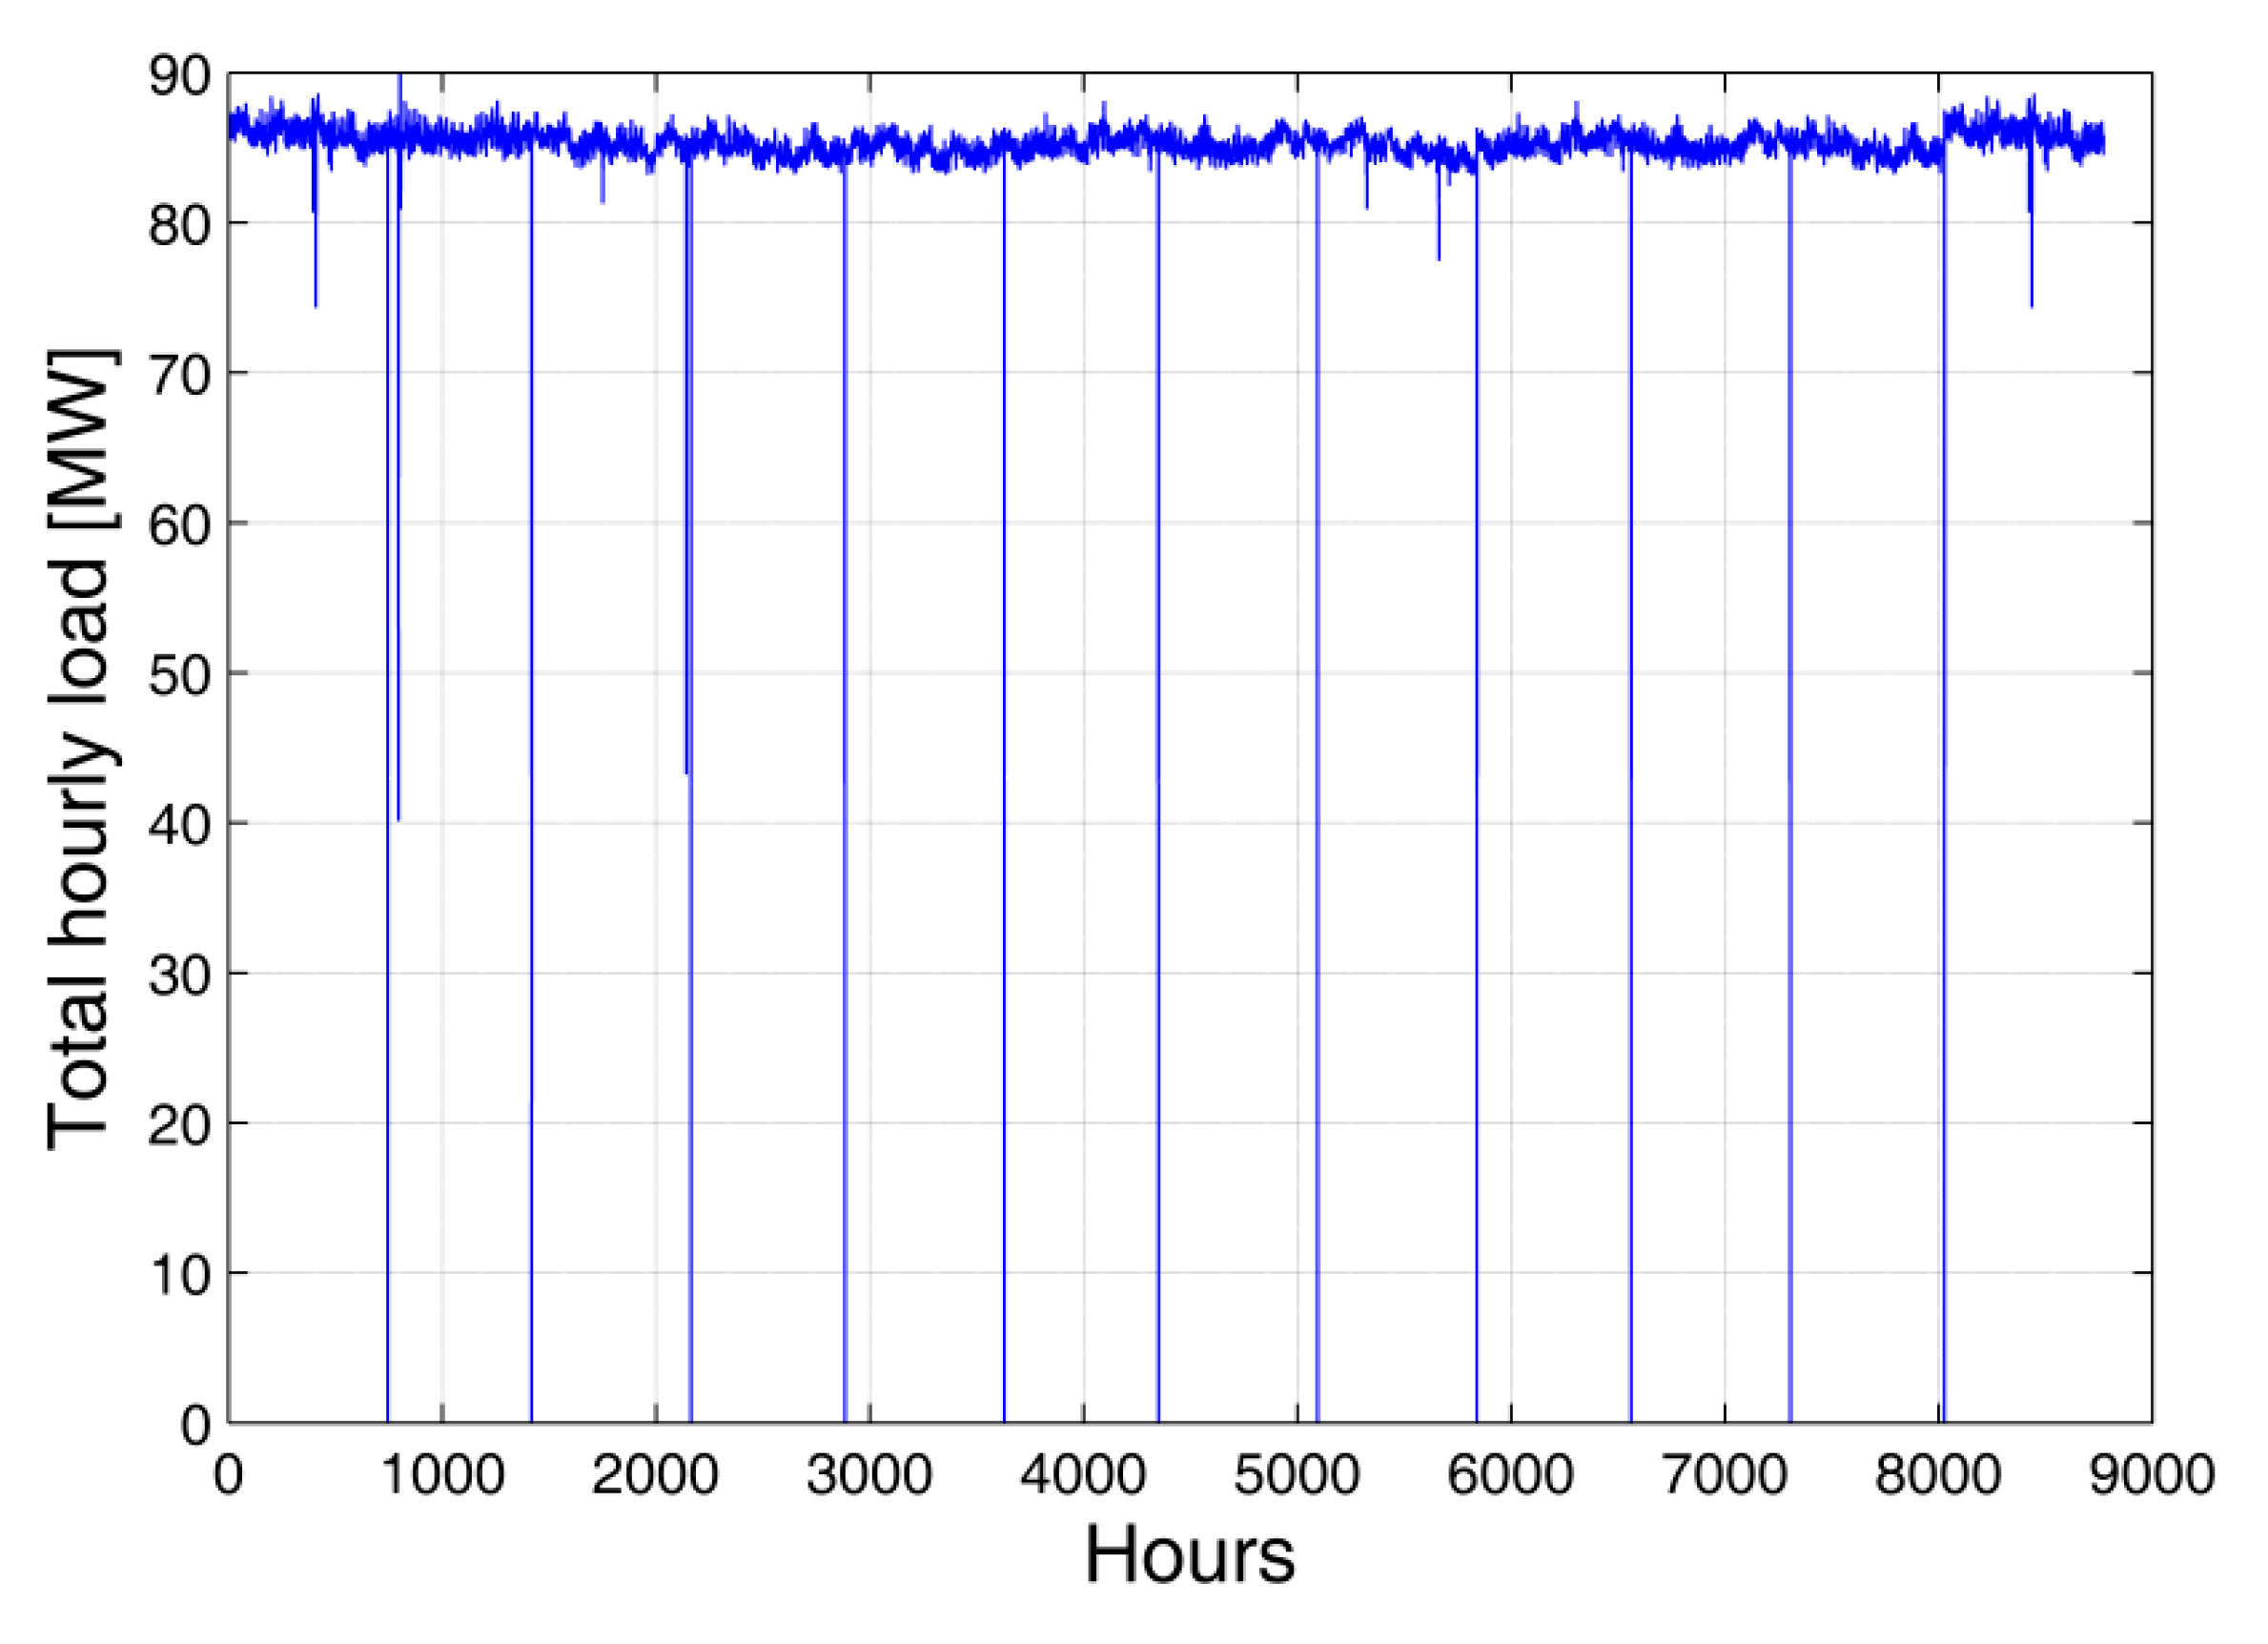
The production of aluminium requires very large quantities of electrical energy, thence the total annual consumption is 895 GWh/year. Figure 1 presents an annual diagram, covering the period from 1 January 2012 to 31 December 2012, of the hourly consumption of electrical energy in the KAP. It can be seen that in case where there is no interruption in the production due to specific technological processes, the consumption of electrical energy is mostly constant.
3. Description of the Target Region of FPPP
The proposed FPPP is planned to be realized in an isolated part of Skadar Lake, which is situated outside the main environmental protection zone. Considering that the average surface of the lake is 475 km2, the 5.23 km2 surface which would be covered by PV panels represents only 1.1% of the total surface, so it can be assumed that the proposed FPPP would not substantially change the ecological system of the lake, especially with regard to any change in the water temperature.
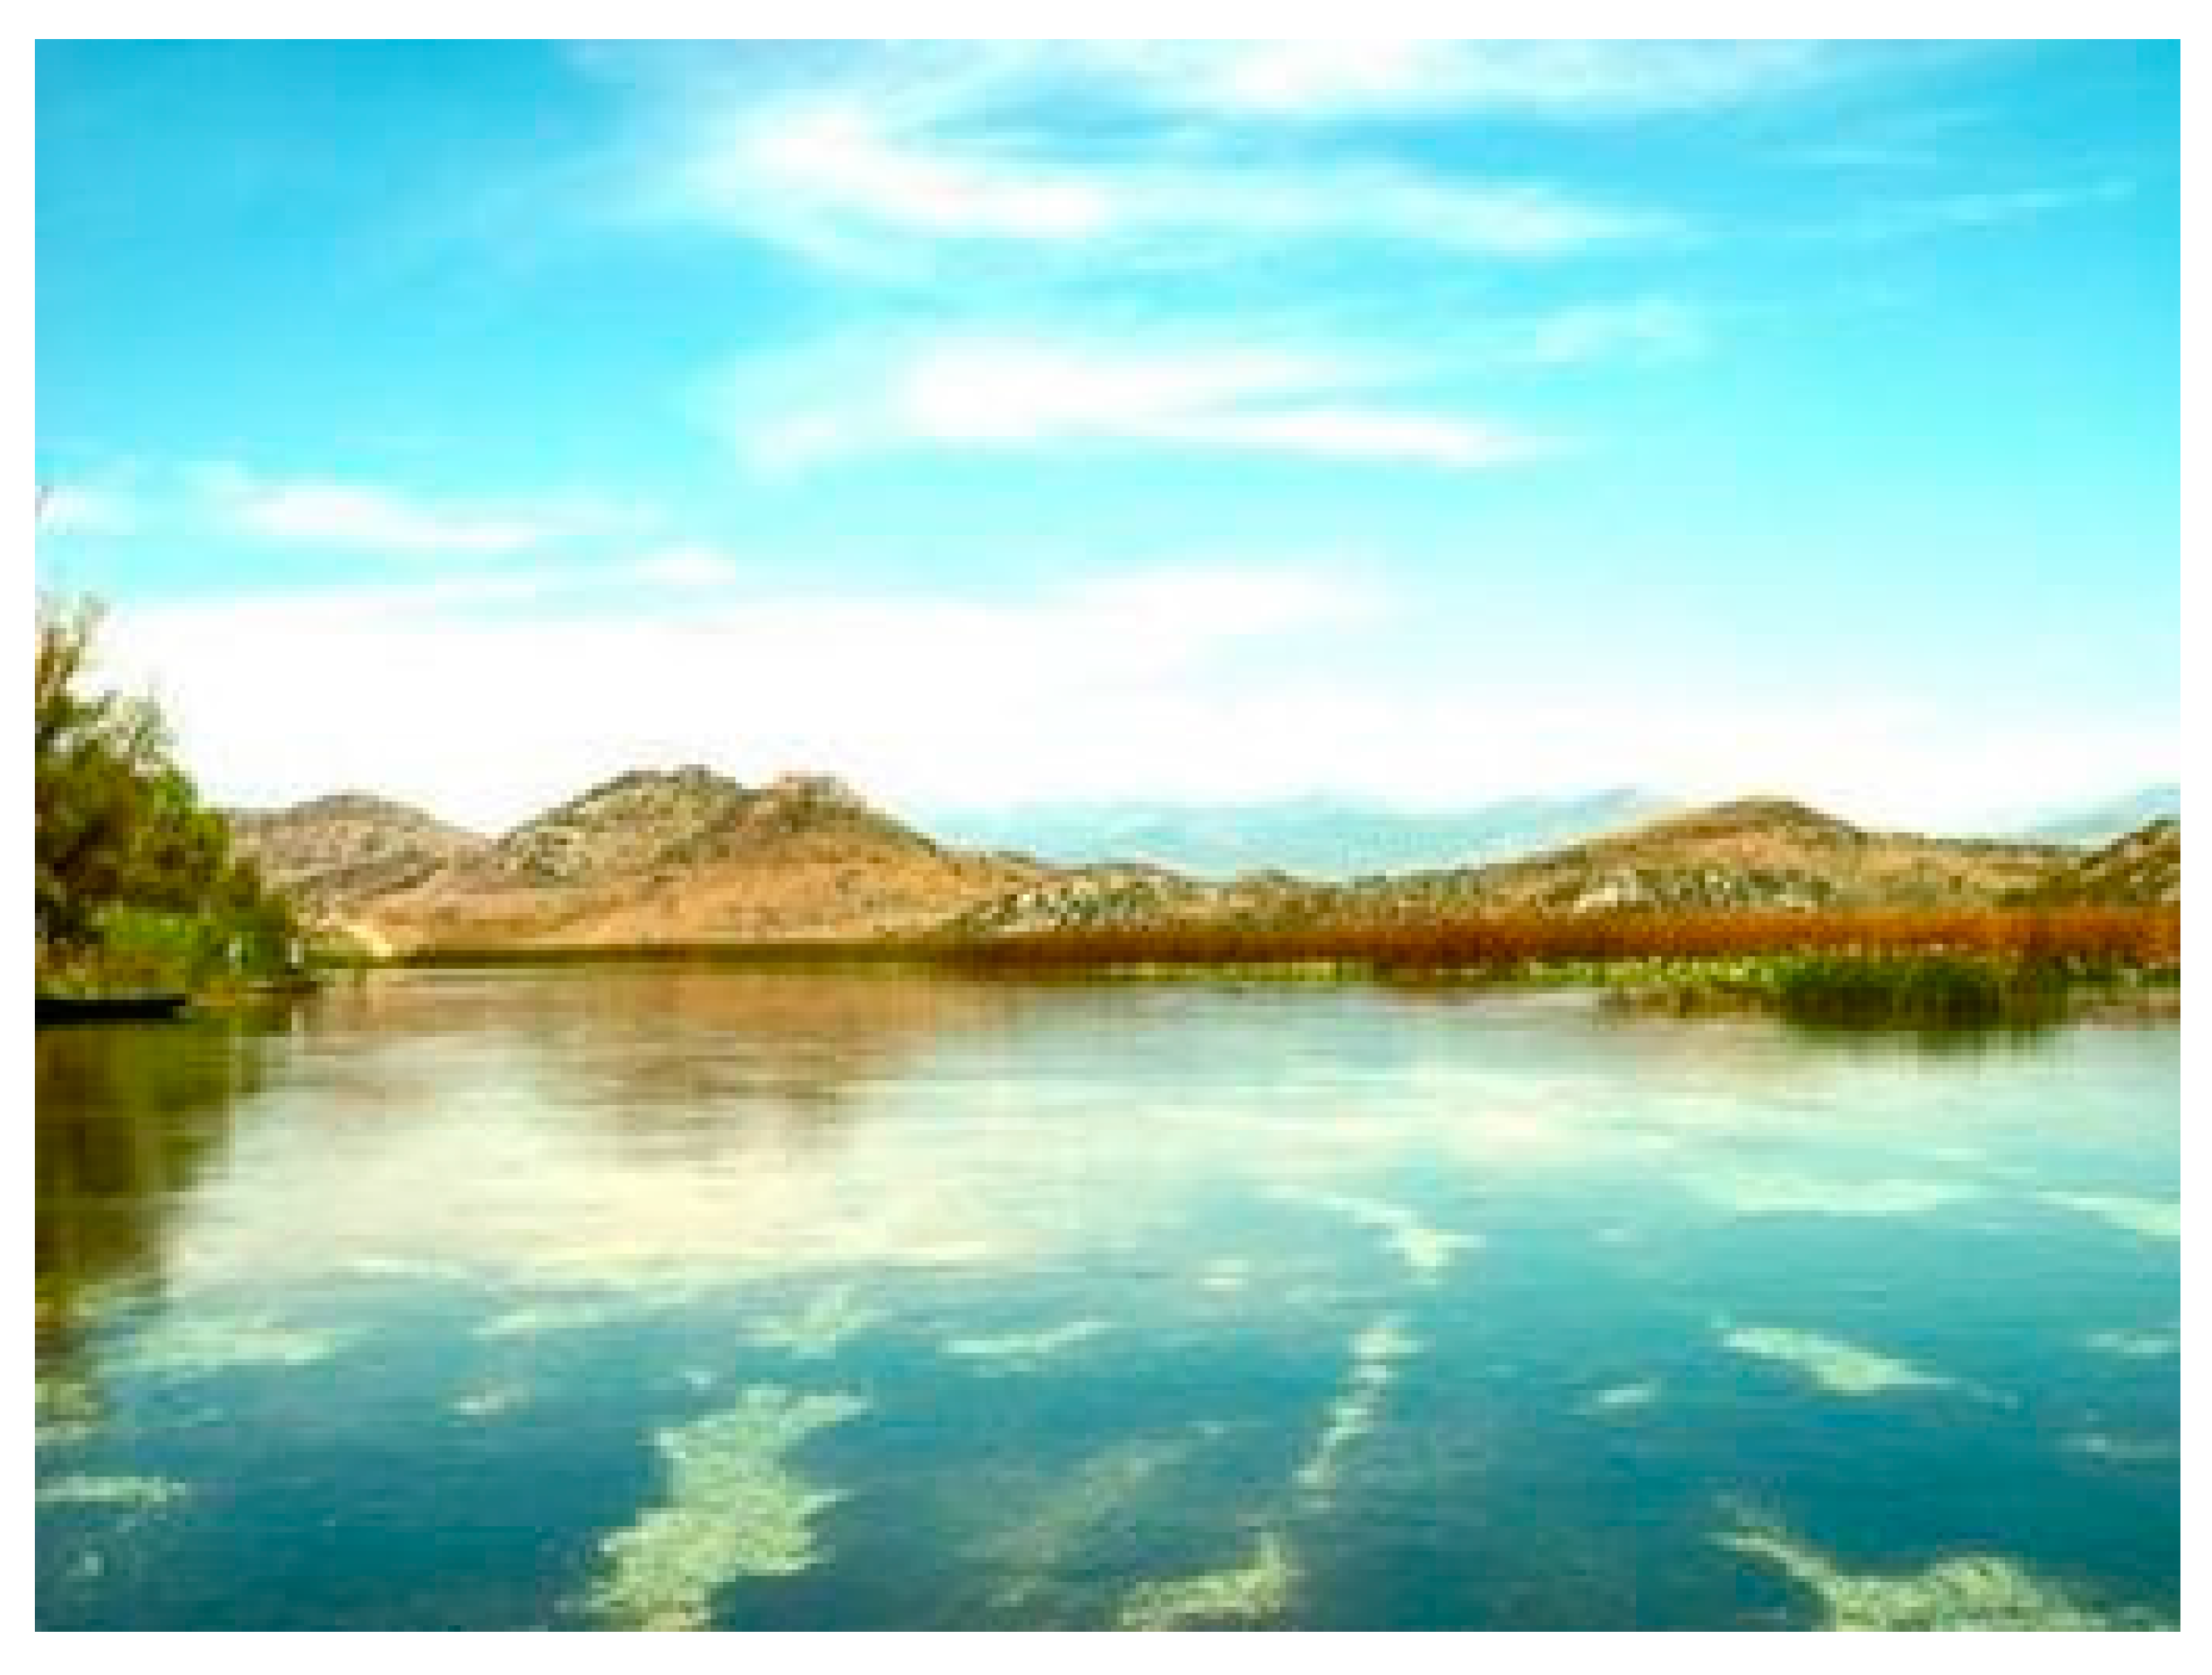
The average depth of the lake is about 6 m, while there is a hill on the west side that projects shade on the lake for a Sun height angle of 20°, what has been taken into account in the calculation of the optimal tilt angle of a PV panel (Figure 2).
The database of the terrain measurements of the solar insolation from the NREL database [12] was used for the calculation of the solar energy resources. Table 1 presents the values of the average horizontal insolation and the surface temperature of lake water for an average day of any month. The NREL database contains hour-based data about an insolation, air temperature and wind speed. The temperature of the Skadar Lake water was obtained from The Hydrometeorological Institute of Montenegro.
With regard to Table 1, it is obvious that a bigger insolation occurs during the summer months, with the biggest insolation of 7.50 kWh/m2/day being obtained in July, while a smaller insolation occurs in winter and the lowest value of 1.64 kWh/m2/day is obtained in December. This paper assumes that a daily temperature can be equalized to the monthly temperature of the lake due to the water temperature inertia, thence the values of mean monthly water temperatures were also adopted for an hour-based level.
4. Preliminary Design of FPPP
The main motivation for the FPPP was related to the land premium and energy efficiency. A study [13] found out that a FPPP has a higher energy density than a land-based one, while an utility-scale solar does not involve a significant cost increase.
The impact of the temperature rise of PV cells is one of the main reasons for the reduction of the efficiency of the production in onshore power plants. Offshore power plants partly solve the mentioned deficiencies of onshore power plants. The potential for building an offshore power plant is bigger than that of onshore ones and these power plants can be used to simultaneously prevent water evaporation from the reservoir used. Due to the contact with water, the temperature impact on the generation of the offshore power plants is reduced, thus increasing the efficiency in comparison to onshore power plants.
In previous FPPP solutions, the PV panels were oriented to the south with tilt angles from 5° to 15°. This paper recommends a solution where the platform with PV panel supports a yawing system, planned to increase the insolation falling onto the FPPP power plant according to the azimuth angle of the Sun. Figure 3 presents a FPPP configuration on the lake consisting of 18 equal platforms, each of the 300 × 300 m size. The installed STC power of the PV panels on each platform is 5 MWp, so in total the installed DC power of the power plant is 90 MWp. There is a substation having a voltage level of 35 kV/1 kV, power of 5 MVA and an inverter facility on each platform. Each substation of the platform is connected by cables to a main shore-based substation, having a voltage level of 110 kV/35 kV, and which is connected to the main distribution system of the KAP with a 6 km long cable.
4.1. Proposed Concept of the Sun Tracking PV Platform
The basic idea was that each platform could be anchored in the central part, where an anchor rope would represent an axis for the rotation of the entire platform. A yawing motion of the platform can be executed by using blades placed on the angles of the platform, Figure 4. The motion of the platform on the water surface is accompanied with a small resistance, thence it can be expected that the control to match the platform with a desired azimuth can be executed with small-power propellers.
To move the platform, the use of propeller hydroelectric units which must have sufficient power to overcome the platform’s resistance to rotation is planned. The exact calculation of the resistance force is quite a complex problem. Generally speaking, a number of resistance forces affect the movement (rotation) of a flat platform moving across the water surface, such as frictional resistance, wave-making resistance, eddy resistance as well as air resistance. With slowly moving objects, the main component is frictional resistance. This component depends on a number of parameters, among which the main ones are the size of platform surface, the roughness of contact surface and the speed of movement. The equation defining the resistance to movement is given in the following general formula [14]:
where R is resistance force (N), Sw is the platform surface which is in contact with the water (m2), while ν is the speed the platform is moving at (m/s). Coefficients f and n depend on the size and roughness of the platform surface. Under normal conditions to manage the azimuth angle of PV panels, the platform is turning equally, while making two semi-turns during 24 h. From sunrise to sunset, the platform makes a rotation of almost 180°. When the Sun goes down, the platform is rotated in the opposite direction (to avoid twisting of cables) at the same speed. Regarding the planned dimensions of the platform, the peripheral speed of movement of edge parts of platform is around 0.03 m/s, so that no significant energy input is expected for such slow movement. However, it is important to take into account the forces of wind pressure on the elements of the platform and to carefully size the number and rated power of drive units during hydromechanical design of the platform. Since the yawing motion of all 18 platforms is executed simultaneously and with the same angle, each power plant must be in a circle with a diameter of 430 m, therefore it is necessary that the distance between the platforms be 130 m. This area, at the same time, maintains the buoyancy capacity and provides access to each platform by boat.
The proposed concept of the rotating platform has a conceptual design character, while the technical solutions that would realize this conceptual design, should ensure its practical execution, which related to the mechanical calculation of the bearing platform, calculation of the main and auxiliary anchors, number and power of drive motor-powered systems, electrical cable links, anticorrosion protection of the elements, lightning protection, etc. It is assumed that the proposed concept is technically feasible, therefore this paper deals particularly with the optimization of parameters and energy gains obtained by the concept of the FPPP with rotating platform in comparison with the option with a fixed platform.
4.2. The Calculation of on Optimal Tilt Angle of a PV Panel
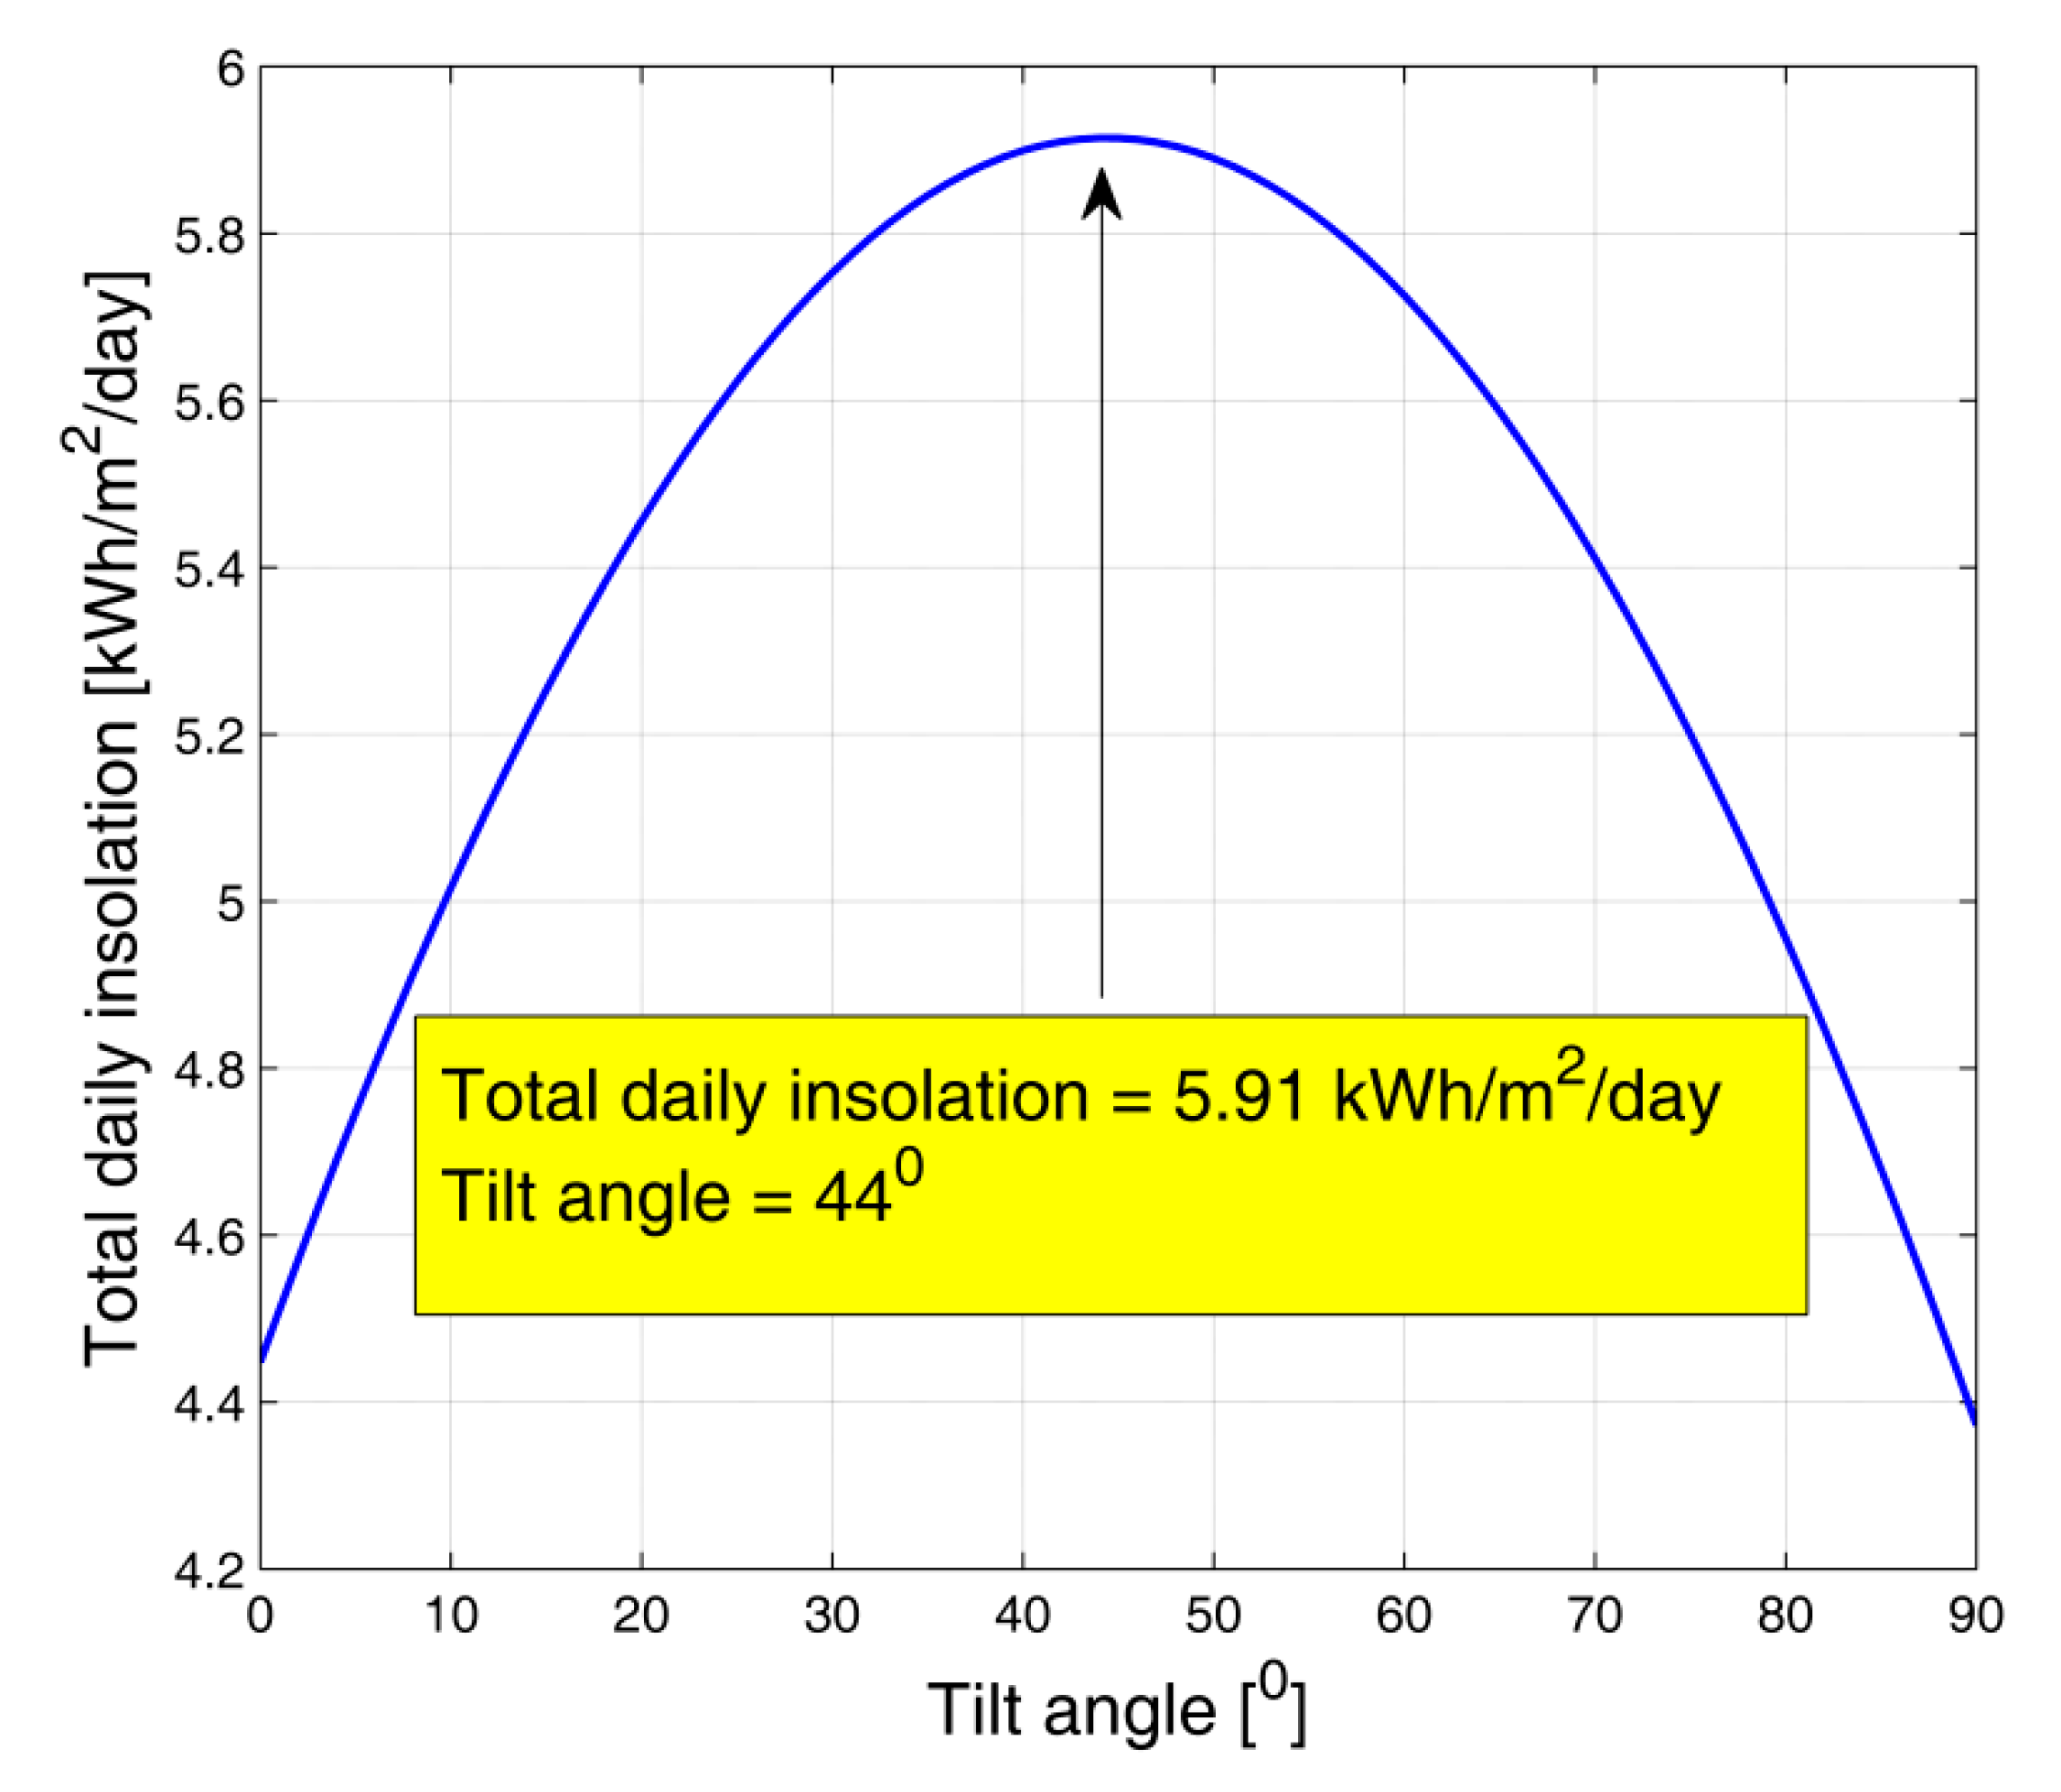
An azimuth angle of each platform was determined according to the azimuth angle of the Sun, while the criterion of a maximum daily insolation for a year was adopted for the determination of a PV panel tilt angle. Figure 5 presents the average annual daily insolation (sum of direct and diffusion insolation) for various values of a tilt angle. According to the adopted criterion, an average daily insolation on the level of 5.914 kWh/m2/day is obtained for an optimal tilt angle of 44°.
The minimum distance between the neighbouring arrays of PV panels is determined according to the day with the smallest height of the Sun (Figure 6). According to Figure 6, the minimum distance can be found from the following Equation:
where l is the shorter side of a PV panel, γt is a PV tilt angle (44°), α is the smallest angle for the height of the Sun occurring on 21 December, which amounts to 18.74°.
The typical sizes of PV panels with an installed power of 300 Wp are in the range of 2 m × 1 m [15], thence the distance between arrays is d = 2.77 m, according to Equation (1). This distance enables us to ensure that there are no losses due to a mutual shadowing of PV panels in the power plant. Given the sizes of platform, the panels and distances between the arrays of panels the installed power of one platform is about 5 MWp, while the total installed power of the power plant is 90 MWp.
4.3. Effect of Proposed Concept on Wind Loads on a PV Array
When designing the supporting structures of the PV panels and stiffened cords, the force of wind pressure affecting the PV modules and parts of the platform situated above the water surface must be taken into account. As opposed to PV systems on the ground, where PV panel carriers are based in several spots, force of wind pressure on FPPP is transferred to the entire structure and can cause huge mechanical stresses in some of its elements, as well as movement of the structure across the lake surface. In a mechanical sense, the wind causes two effects, a lift and a drag force [17]. The lift is the force exerted by air that flows normally to the direction of wind speed. The drag is the force exerted by the air flow on the body in the direction of wind speed.
The calculation of the lift and drag force on the elements of the platform structure is hard to perform analytically, but it is based on experimental analyses and computational fluid dynamics (CFD) models. For the qualitative evaluation of the influential parameters on the resulting force of wind pressure F affecting the platform, one can use a general mathematical form given by the following equation:
where CF is force coefficient, Aw is surface which is affected by wind (m2)and v is wind speed (m/s).
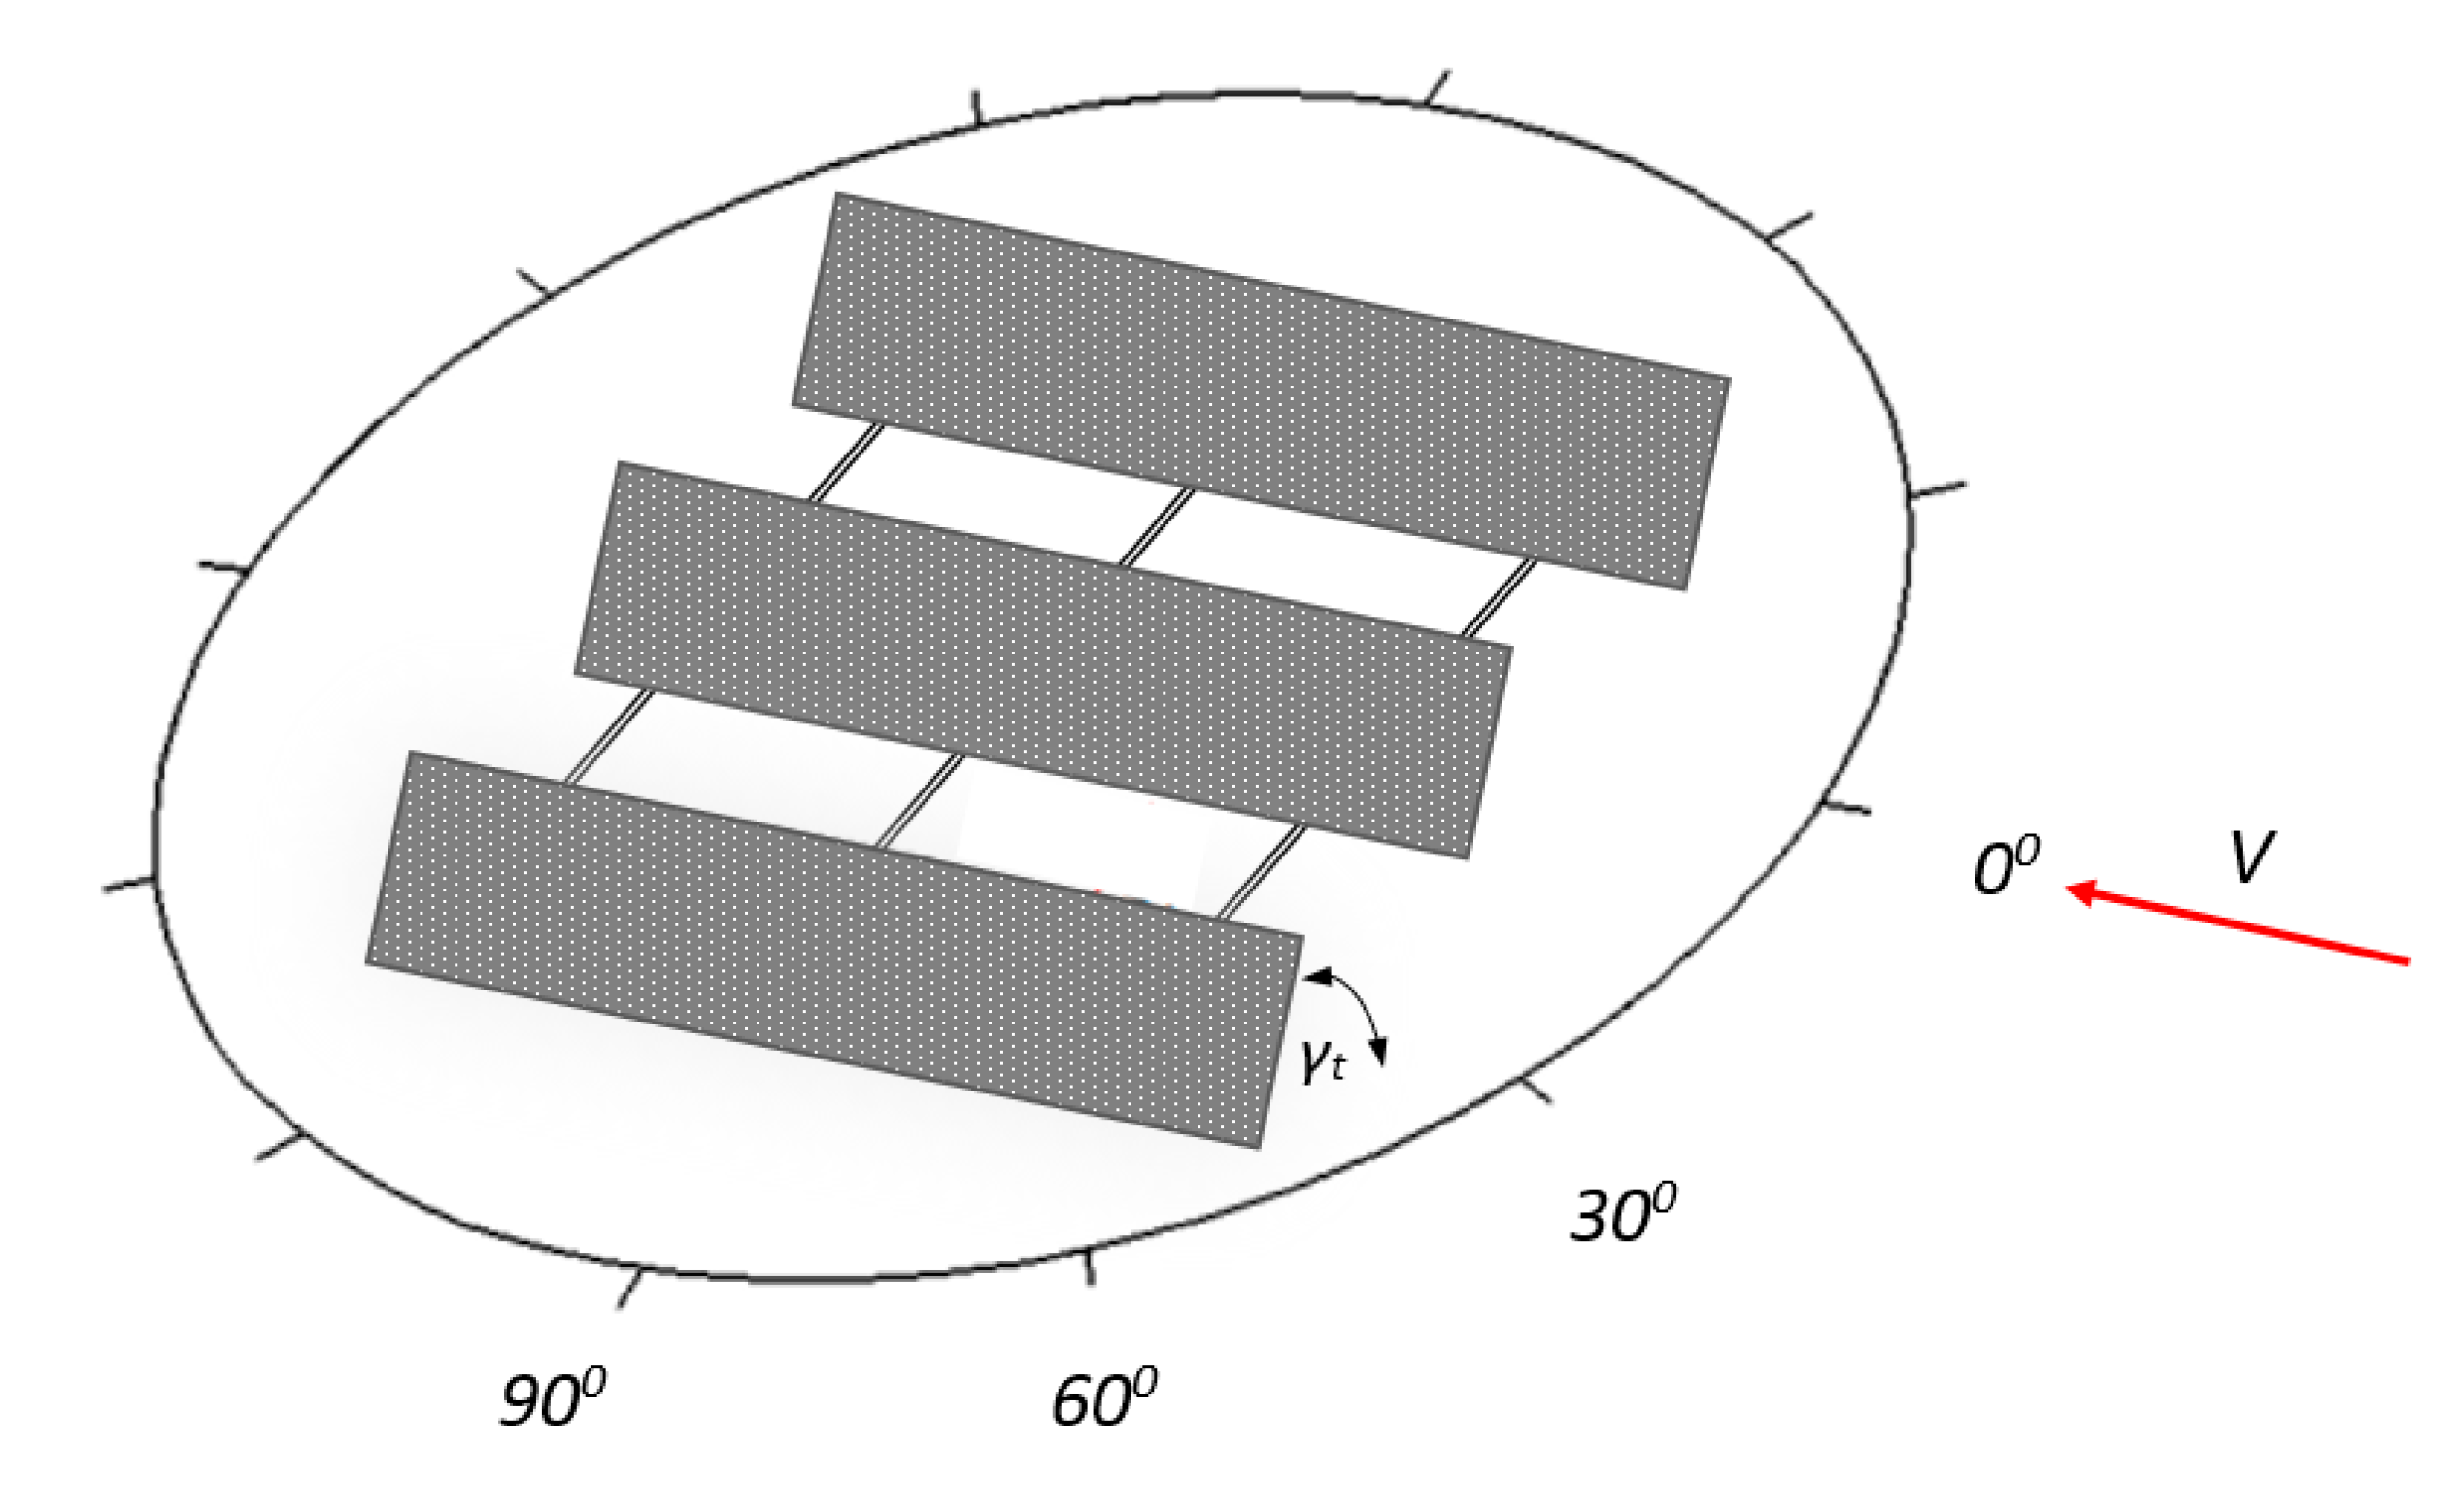
There are a few papers and studies in which analyses of the wind pressure force on PV panels were performed. In [10], Santafé et al., showed that the wind force is proportional to the tilt angle of a PV panel. Additionally, it had been shown that the wind pressure force depended on the size of panel practically linearly i.e., the surface Aw in Equation (3). According to this analysis, a wind pressure force on a proposed panel, under a tilt angle of 44°, would be around 2.5 times larger than for a tilt angle of 12°, typical of standard FPPP carriers [18]. However, the proposed solution enables the prevention of large wind forces on the construction in a simple manner, i.e., in such a manner that, on occasion of strong winds, tracking of Sun azimuth is aborted and the panel is rotated so that the azimuth angle (θ) of the wind in relation to PV modules is 0°, as illustrated in Figure 7. By placing the platform in position in which θ = 0°, it yields a decrease in the lift and drag components of the force of wind pressure to the panel. The lift effect is decreased because in this case the wind is blowing from both sides of the panel in gusts with similar speed, which helps to equalize the air pressure from both sides of the PV module, and the resulting lift force is close to zero. The drag effect depends directly on the surface which is exposed to the wind. In the θ = 0° position the structure is very porous in relation to the wind direction, and the drag force is many times less than in the case when θ = 90°. This conclusion is confirmed by research conducted by Shademan and Hangan in [19], where, through CFD simulations, they showed that the drag force is around five times lower for a wind direction θ = 30° in comparison to θ = 60° which is critical regarding the force on PV panels of large surfaces. Considering these facts, it can be concluded that, with the proposed concept, it is not necessary to size the elements of the FPPP according to the maximum possible wind force, thence the price for the structure of a FPPP platform does not rise in comparison to the existing solutions.
In the case of strong winds, as additional security against movements of the platform and unloading, the motor powered blade systems should be equipped with auxiliary anchors that should be distributed at several points of the platforms. When the motor-driven control system brings the platform to a position with minimal wind pressure, the auxiliary anchors should be then lowered thus protecting the platform against movements that can be caused by the pressure force due to both winds and the wave motion of water in the lake. The auxiliary anchors can be utilized as a parking system during the night. Figure 4 shows the auxiliary anchors placed at two points, but it is possible to install several anchors depending of the platform surface and maximal expected wind speeds at the considered location.
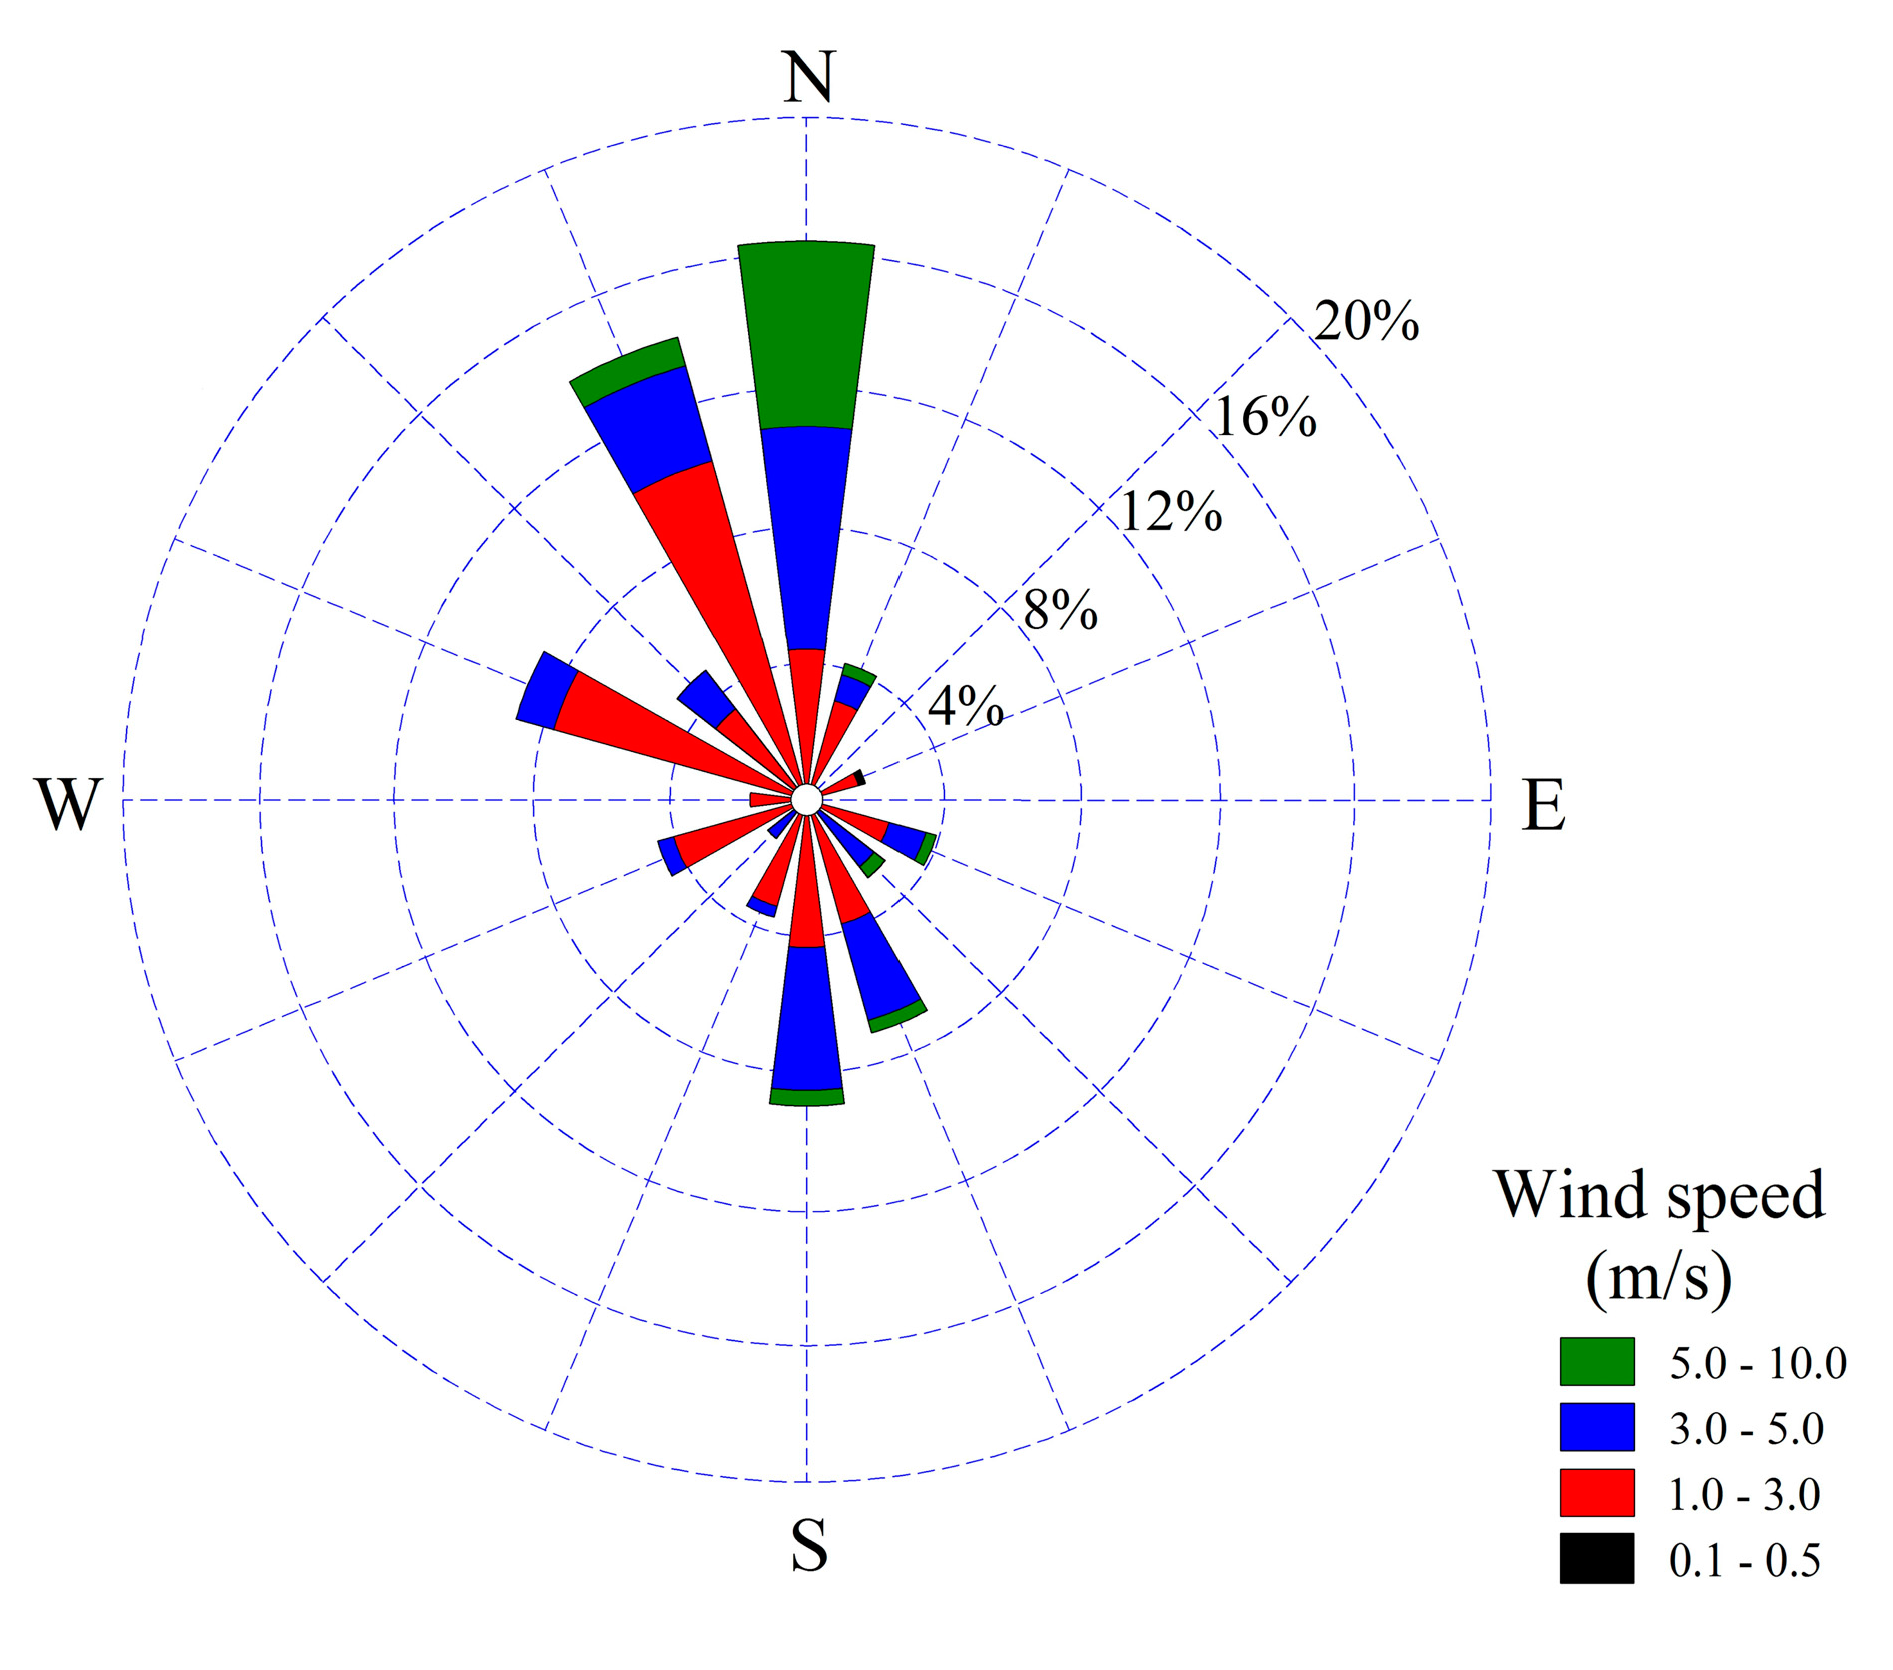
In windy regions the proposed concept of protection against the occurrences of large forces due to wind pressure may result in an efficiency drop of the PV panels to the certain extent if strong winds blow during a sunny day. In the analyzed target region of Skadar Lake, strong winds are a rare phenomenon and mostly emerge during the night. Figure 8 shows a wind rose measured at a meteorological station in close proximity to the proposed location of the FPPP.
Based on the wind rose shown in Figure 8, it can be concluded that extremely strong winds are not expected on the target location. Around 50% of time the wind speed falls within the interval of 1–3 m/s. For this reason, the effects of decrease of the production of the FPPP due to any deflection from the strategy of tracking the azimuth of the Sun during strong winds are neglected in this analysis.
5. Calculation of Production
Energy produced by the FPPP in any hour can be estimated with the help of the following equation:
where is a mean hourly insolation, A is an area and η is a degree of efficiency of the power plant in the analyzed hour.
The degree of efficiency of a PV power plant is determined with the following Equation:
where: ηmodule is the degree of efficiency of a module (a typical value of 0.15 is adopted for the silicon PV panels for the recommended solution), ηtemp is the efficiency of PV conversion due to the influence of deflection of the PV panel temperature from the STC values (25 °C), ηinvertor is the efficiency of the invertor (a fixed efficiency of 0.95 is adopted for the recommended solution) [20].
The reduction of efficiency of PV panels due to the temperature rise is significant and has a great influence on the reduction of PV power plant production. For silicon PV modules, a typical reduction of power efficiency with temperature is 0.4–0.5%/°C [20]. It is necessary to estimate the temperatures of PV panels for the assessment of the efficiency due to a temperature rise of PV panel. The NOCT method was used in this paper. The manufacturer defines the temperature for the nominal exploitation conditions for each PV panel (NOCT—Operation Cell Temperature). By using this parameter, the temperature of a PV panel (Tpanel) can be estimated on the basis of an ambient air temperature Tamb and solar irradiance I falling onto a panel, according to the following formula [15]:
Given that a typical value of the reduction of power efficiency of PV cells, due to a temperature rise of a solar cell above a standard value (25 °C), is −0.5%/°C, the efficiency of a PV cell is calculated according to the Equation [20]:
where ηstc is an efficiency of a panel for a standard value of temperature of 25 °C, Tamb is the hourly ambient temperature, and the NOCT value for a majority of PV panels is about 45 °C. The significant advantages of offshore PV panels in comparison with onshore ones are the more favorable ambient conditions. Given that the FPPP modules are situated in a boundary air layer and the lake surface, this paper assumes that the ambient temperature is Tamb = Tlake.area. In this analysis, a steady-state thermodynamic model of a PV panel was used, which is described by the Equation (6). For more precise calculations of the temperature and efficiency of the PV panel, more complex dynamic thermodynamic models could be used. An overview of various thermodynamic models that could be used in this analysis was presented by Alobaid et al. in [21].
Based on the available data about the direct and diffusion components of solar insolation on a horizontal surface, by using a methodology given in [20], the calculation of insolation on a panel surface for each hour in a year was carried out. The calculation of the production of the FPPP for each hour in a year is calculated on the basis of expressions (2)–(7).
The microlocation of the proposed FPPP lake is far from larger settlements, while possible air pollution and soiling of PV panels of aluminum is also minimal bering in mind that the plant is located to the north-east of the lake (Figure 3), from which location winds are a rare phenomenon, as can be seen in Figure 8. However, it would be useful to verify the NREL base of measurement data used through comparative measurements at the microlocation of the proposed FPPP. Considering that this FPPP occupies a pretty small surface of the lake, it was assumed in this analysis that water temperature in the lake will not significantly change due to its construction. However, it is important to take into consideration that, by covering the surface of the lake with PV panels, part of the Sun insolation would be transformed into electrical energy which finally results in a lower degree of heating of the water in the lake. Considering that the covered lake surface is only 1.1% of the total surface, this effect should not be significant. Due to the size of the lake, it is considered that the effect of thermal inertia of water allows for the values of mean monthly water temperatures to be adopted in analyses as the relevant values in the calculation of the efficiency of the PV modules. Figure 9 presents a monthly production of the FPPP power plant, while Table 2 gives the values of monthly production and mean daily insolation for each month.
The biggest production will be achieved in July with 21.81 GWh, while the smallest production will be achieved in January when it is 7.50 GWh. Annual production of the recommended FPPP is 178.34 GWh, would cover 19.9% of the total needs for electrical energy at the KAP.
6. Calculation of a Reflected Component
The calculation of a reflected irradiance component for the PV power plants installed on the ground, as well as for the FPPP, is often neglected due to small contributions in the total irradiance that is a consequence of the fact that the PV panels are placed under a relatively small tilt angle. For the recommended solution, the FPPP tilt angle is relatively big, thence the analysis is executed for a reflected component falling onto a PV panel. A conceptual solution for rise of this component through the rise of a coefficient of reflection of surfaces between arrays of PV panels was recommended, and it contributed to a significant rise of the production of the FPPP.
The reflected irradiance component IR reaching the panel surface consists of a direct and diffusion component and is calculated with the Equation [20]:
where IBH is a horizontal direct component of irradiance, IDH is diffusion horizontal component of irradiance, ρ is a coefficient of reflection from a horizontal surface surrounding a PV panel and γt is a PV panel tilt angle. For the FPPP, a more precise calculation of the reflected component is obtained if the changes of water reflection coefficient depending on the angle of height of the Sun α are adopted (Table 3 [22]).
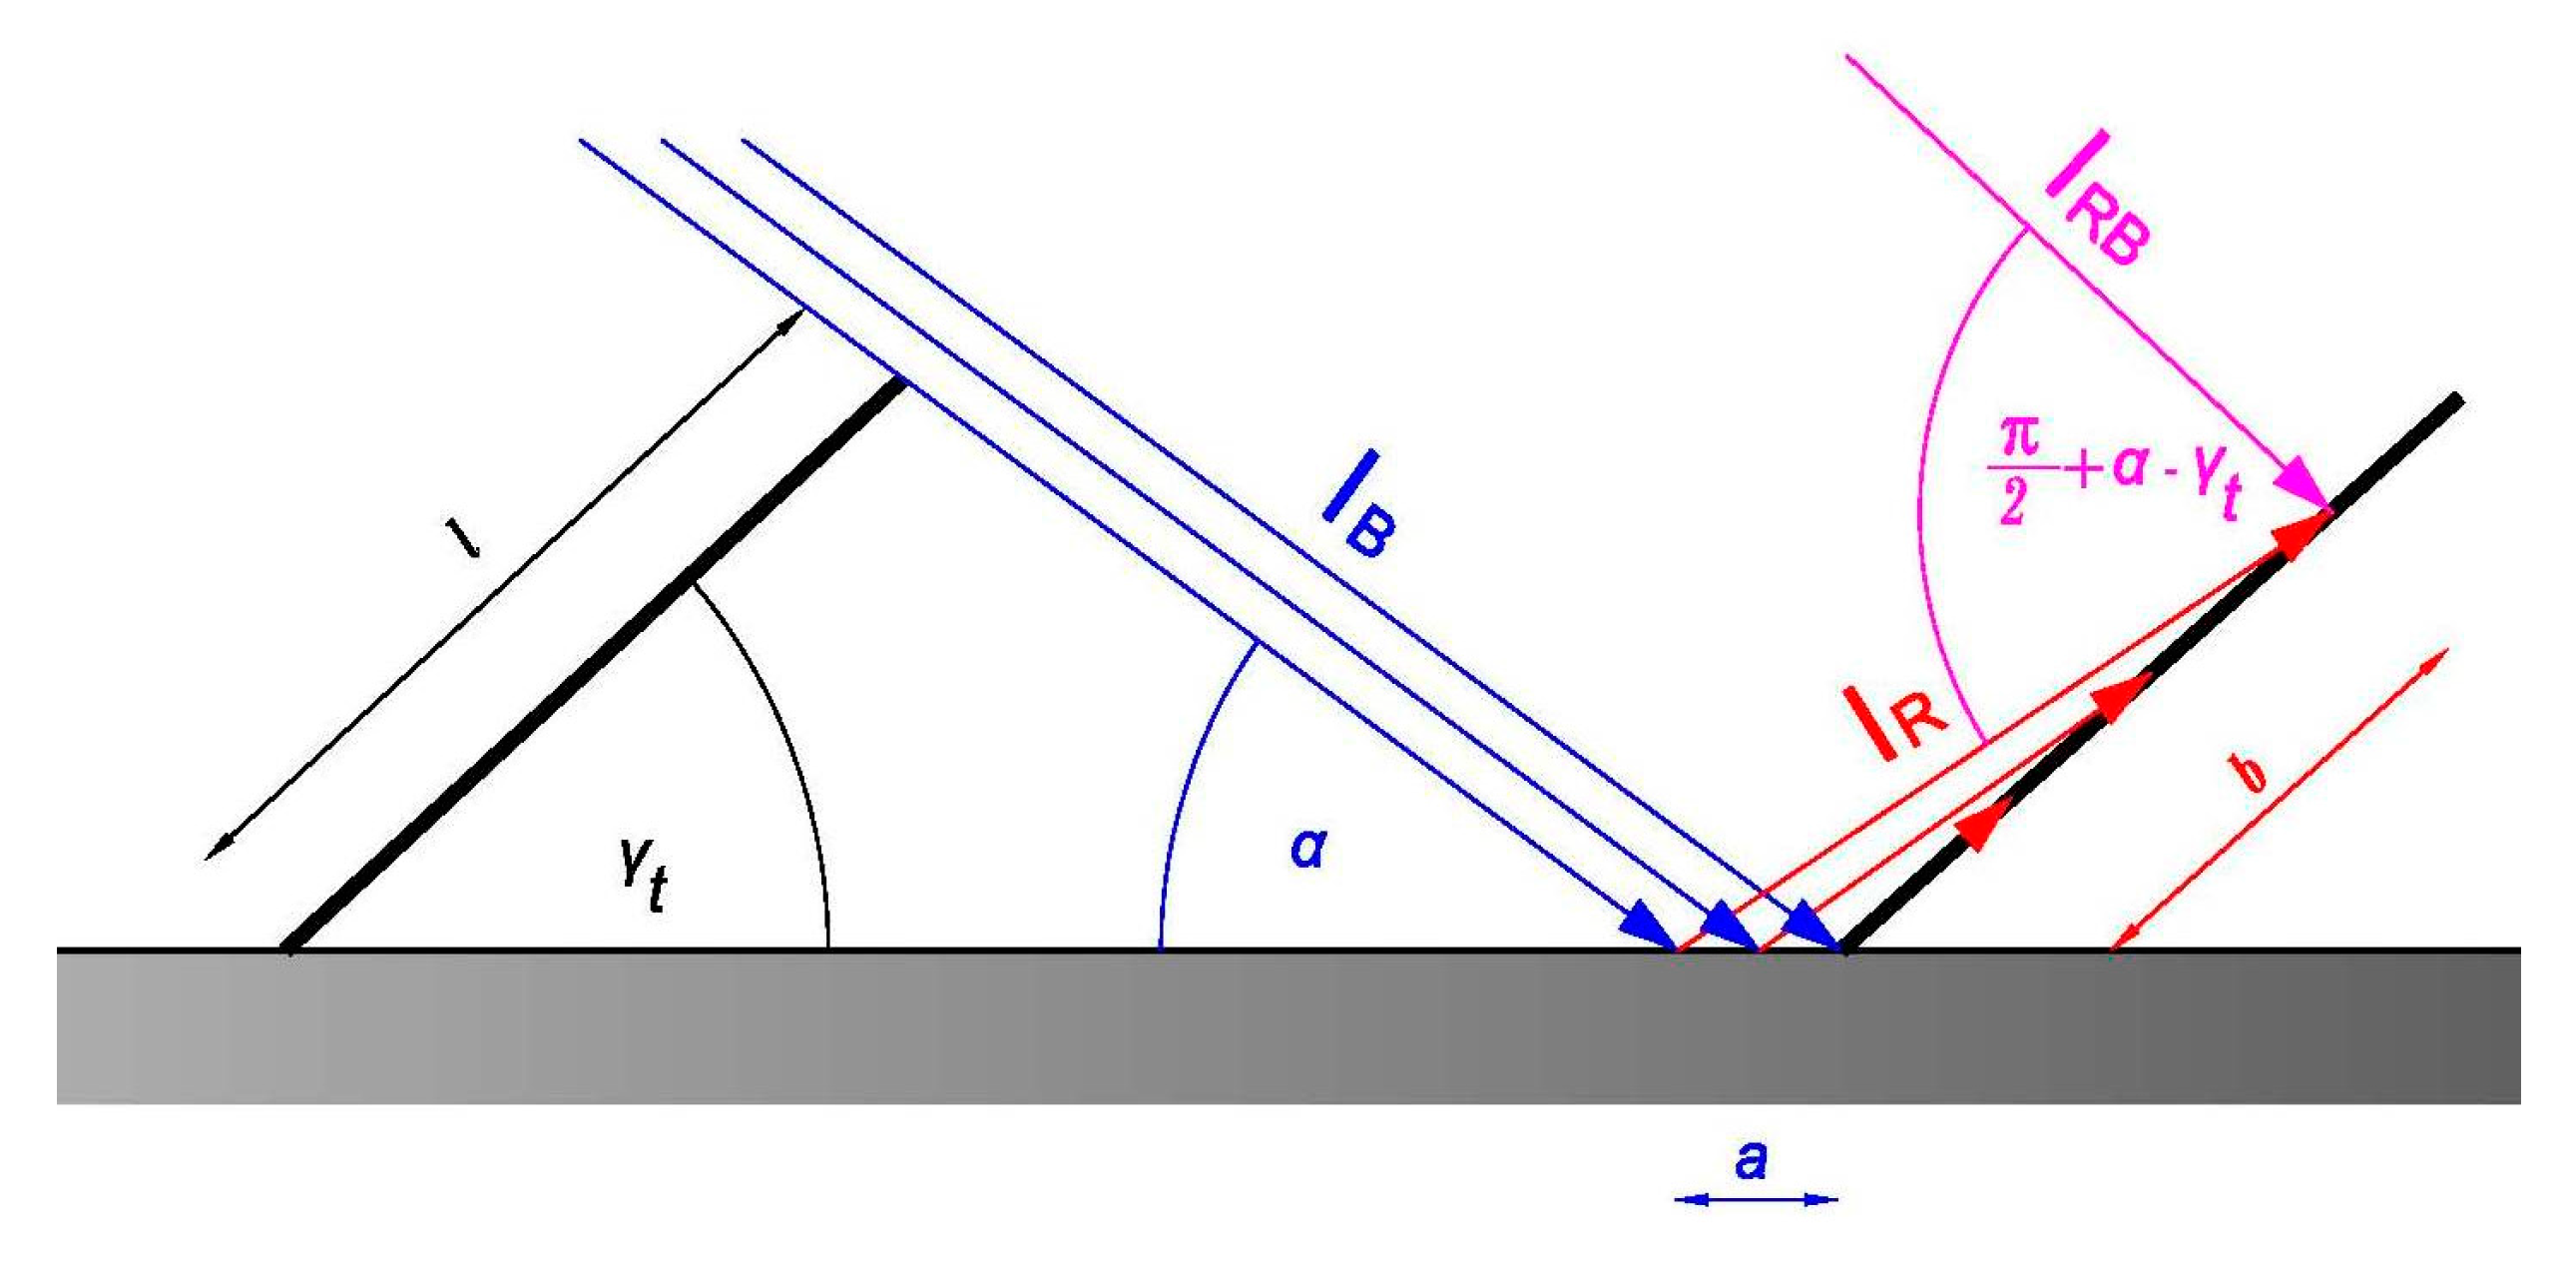
Regarding the fact that the recommended FPPP supports the tracking of the Sun for an azimuth angle meaning that the Sun is always is perpendicular to the direction of a PV panel, a direct reflected component can be calculated according to Figure 10, which presents the situation where the angle of the height of the Sun is bigger than the tilt angle of PV, therefore, in that case, there is an irradiance on the part of area S between the neighbouring arrays of PV panels. Depending on a reflection coefficient, an incoming light flux is reflected from this area to the neighbouring PV panel.
An incoming light flux from a direct radiation on the area between two arrays of PV panels is determined with the following Equation:
where Φinput is an incoming flux, IB is a direct component of the Sun’s irradiance, a is a sunny length and L is a length on which PV panels are placed (length of an array of PV panels).
The flux that is directly reflected from the area a × L under the angle equal to an incoming flux is defined with the following Equation:
where IR is a reflected irradiance component, ρ is a reflection coefficient for the area between PV panels and b is a length of a part of the panel directly shined on by a reflected component.
According to [20], the diffusion reflected irradiance component is:
The total annual increase of irradiance of a PV panel can be obtained by an integration over time of a total reflected flux falling onto the PV panel area. The use of this calculation can show that the reflected component contributes to a rise of the FPPP’s production of 1.85% on an annual level, namely the annual production of the analyzed FPPP is 181.64 GWh.
Regarding the distance between the panel arrays, this paper analyses the both the opportunity of both the placing of light blocks with the reflection coefficient of ρ = 0.6 [22] and their impact on the increase of a reflected irradiance component. By using Equations (8)–(12), it was calculated that the annual production of the FPPP is significantly increased in this way, reaching 186.05 GWh, that is the rise in production would be 4.32% in comparison to the production of the FPPP if the reflected component is not taken into account. The expected annual production of the proposed FPPP would thus provide about 20.78% the KAP’s electrical energy needs.
7. Comparative Analysis of Competitive Solutions
With the objective of evaluating the recommended FPPP concept in relation to ground-based structures, as well as the competitive onshore power plants with a fixed azimuth angle, a comparative analysis of the production of three power plants was carried out:
- Land-based PV plant: located on land by the lake with a fixed optimal azimuth angle (0°) and fixed optimal tilt angle (30°),
- Base concept FPPP: on the lake surface with a fixed azimuth angle (0°) and fixed tilt angle (12°) (usual concept of FPPP),
- The proposed concept FPPP: on a lake surface with a variable azimuth angle and fixed optimal tilt angle (44°), with the reflected component of insolation calculated by the method presented in Section 6.
Table 4 gives the production and average daily insolation for the analysed competitive solutions.
Based on Table 4, it can be concluded that the production of the proposed FPPP in relation to the PV power plant installed on land, with an equal nominal power, is 31.29% larger, while the rise of insolation is 22.91%, where a bigger percent of the increased energy produced in relation to the percent insolation increase can be explained by the fact that the air temperature above the lake surface is visibly higher than the lake surface temperature, thence there is a bigger drop in PV panel efficiency due to the higher temperatures for the PV power plant installed on the ground than in case of the FPPP. Additionally, the temperature impact can be observed through the distribution of the insolation and produced energy of the ground PV plant and the base FPPP plant. Indeed, with regard to Table 4, the insolation increase for the ground PV plant, in comparison with the base FPPP, is 7.72%, while the produced energy is 2.75% lower. The proposed FPPP concept gives an annual production 27.68% bigger than that of a usual (base) FPPP concept with the same power.
An additional increase in efficiency of the proposed FPPP could be achieved through the implementation of water-based cooling of the PV modules, which, in this case, would be realized with the lake water which would be drawn from greater depths so as to yield a better cooling effect. The modelling and experimental approach of this idea was presented by Schiro et al. in [23].
8. Effects of Production of FPPP on Coverage of Consumption of KAP
Vanhoudt et al. [24] and Baetens et al. [25] used Demand Cover Factor (DCF) as a measure of efficiency of local production for coverage of consumption. DCF is defined as the ratio to which the energy demanded by, in this case KAP, is covered by the PV production, in this case the FPPP (Equation (13)):
where PS is the local power supply, in our case, this power is related on the power of the proposed FPPP and PD is the local power demand, in our case, it is power consumption at KAP. The term in {PD,PS} represents the part of the power demand instantaneously covered by the local PV power supply or the part of the power supply covered by the power demand [24,25].
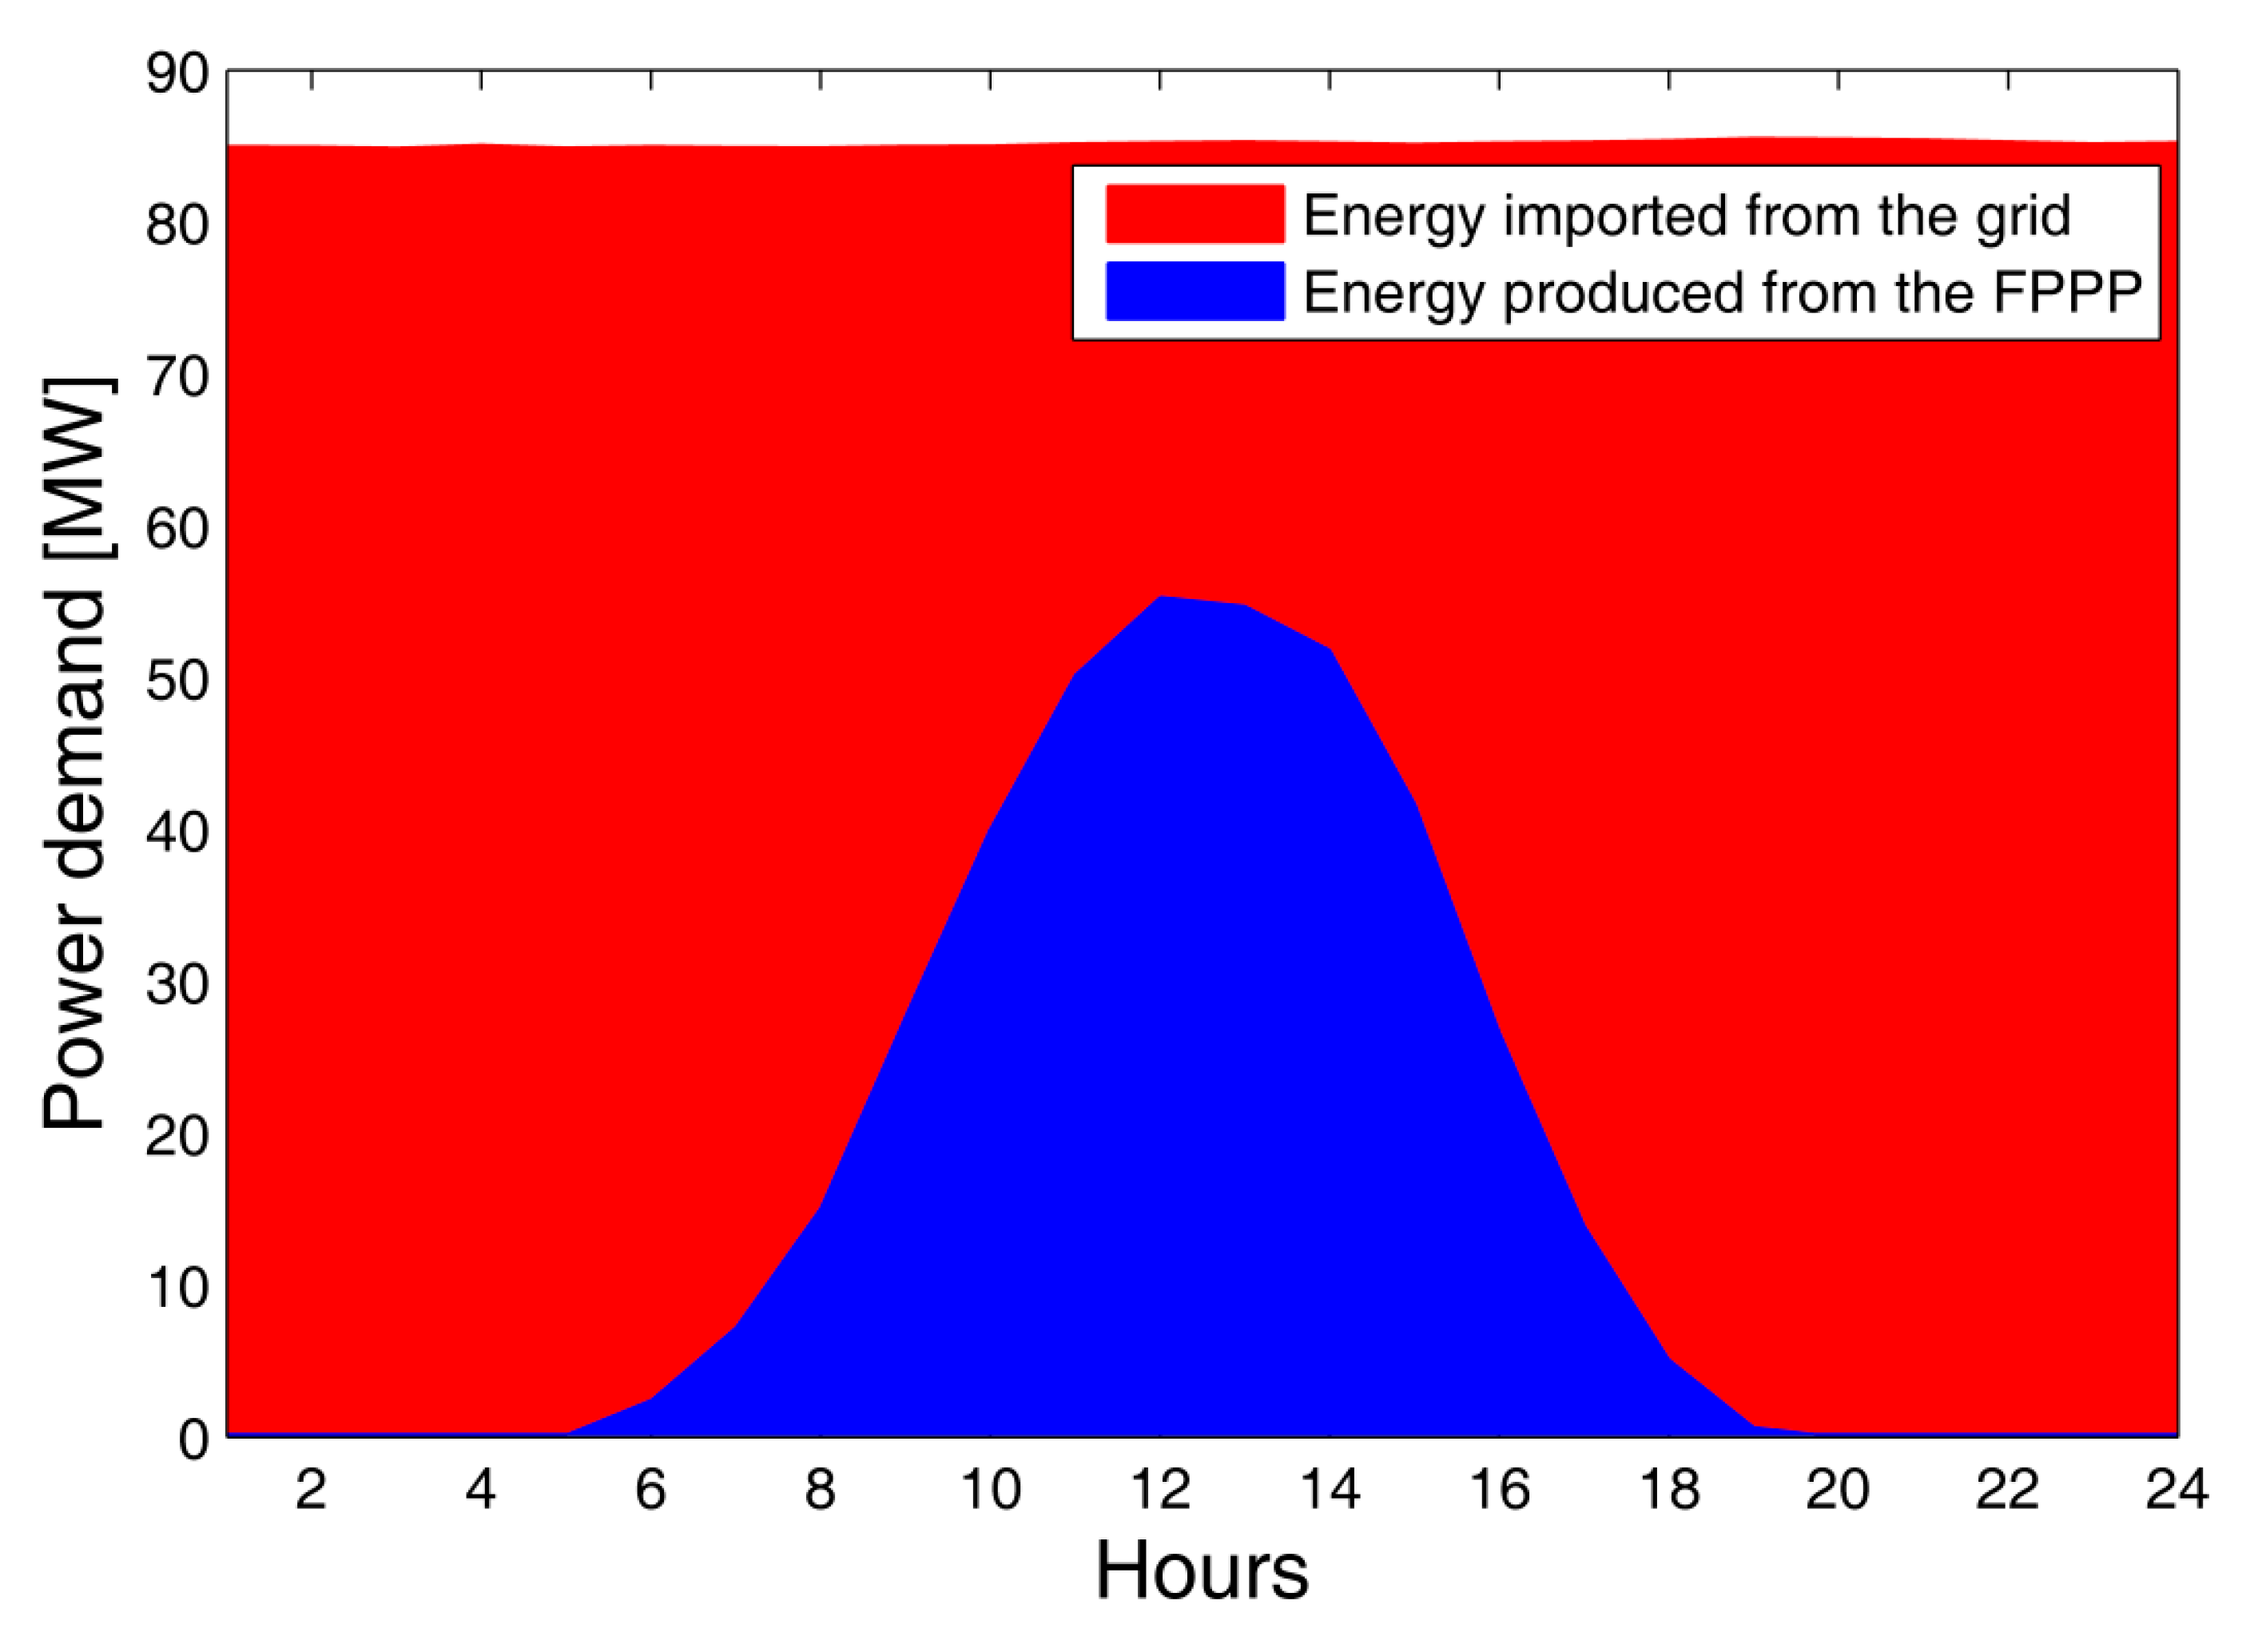
In this paper the calculation of DCF is obtained based on both the average daily diagram of energy consumption of KAP and average daily production of FPPP on an annual level (Figure 11). The use of Equation (13), DCF = 0.199 for the analyzed case, means that it can be expected that the proposed FPPP would covers almost one fifth of daily consumption of KAP on average during a year.
Additionally, this paper presents a comparison made between the production of the FPPP and consumption of KAP for each day during a year and the total energy produced by the FPPP and used for covering consumption of KAP is 220.46 MWh. However, it is important to emphasize that in the periods of a year when the technological process is carried out without disruptions i.e., when consumption of KAP is constant and is around 85 MW, there is no period when the production of the FPPP power plant is larger than consumption of KAP. The cause of this ‘surplus’ of energy which in this case would be injected into electric power system of Montenegro is the result of sporadic pauses in the manufacturing process due to repairs to equipment at KAP. From the aspect of electrical parameters, a pause in the technological process at KAP implies a relatively small consumption of electrical energy. The relatively small value of the electrical energy (about 0.12% of the expected production of the proposed FPPP) which would be injected into the grid is a consequence of the fact that the pause of the manufacturing process due to repairs is typically performed in the early morning hours when the Sun irradiation is small. Based on the considered results, both at the annual as well as the daily level, it can be concluded that the production of the FPPP power plant would cover a part of consumption of KAP but without significant reversible flows of energy. An increase in the value of the DCF factor could be achieved by building a solar thermal power plant which could be used to cover the nighttime electricity consumption of KAP [24,26].
9. Economic Calculation
Considering the purpose of determination of production costs, as well as the efficiency of the FPPP, besides the investment costs, it is necessary to analyse the production costs. This analysis used a simple model for the estimation of the production costs of the FPPP. If the operation costs are modelled as the costs per produced kWh of electrical energy, then the production costs can be calculated using Equation [20]:
where c is a price of 1 kWh of a produced electrical energy (Euro/kWh), Itot is the total investment (Euro), Av is an availability factor of the FPPP, E is an annual production of electrical energy of the FPPP (kWh), m is an operation cost (Euro/kWh), i is an interest rate and n is an amortization period for the power plant.
The following input values are necessary to carry out the estimation of the production costs of the FPPP using the model defined by Equation (14): estimated production of the FPPP, estimated investment costs, exploitation period and an availability of the FPPP. Table 5 gives the estimated values of these parameters.
Experience in the construction and exploitation of FPPPs is relatively scarce to be able to confidently analyze the investment and exploitation maintenance costs, particularly in case of large systems, such as the one proposed in this paper. The development of platform technologies for large FPPP is still intensive. Kim et al. in [27] analyzed costs for construction of FPPP of 1 MWp of power depending on the materials for construction. If a fiber-reinforced polymer is used, the structure is quite lighter, and investment costs are significantly lower. It is expected that with the growth of total installed FPPP capacities, as well as of unit power, the investment costs will drop significantly. The goal of this paper is to promote a new idea with respect to a more efficient exploitation of FPPP and possibilities of its utilization for electricity supply to big consumers and, therefore, the investment costs were roughly estimated on the basis of the research conducted by Ferrer-Gisbert et al. presented in [8]. According to this research, investment costs in the FPPP are 30% higher than for PV power plants installed on the ground.
The operation costs of the FPPP cannot be exactly analyzed due to the lack of experience, but it is expected that, with the growth of installed power, specific maintenance costs be lower. In the case of large PV systems on land specific operating costs are lower than in small systems. Hammad et al. in [28], for a 20MWp PV power plant, adopted the annual operating costs of $12/kWp of installed power. In the report [29], in assessment of the cost-efficiency utility scale PV, fixed operating and maintenance (O&M) costs of USD 6.5/kW/year were adopted.
In view of the simplicity of the proposed structure and the drive for rotation of the platform, it is not expected that the proposed solar tracker system will significantly increase the operating costs as compared to FPPPs with fixed platforms. In [30] it is shown that the operating costs of a ground plant with one-axis solar tracker of 20 MWp installed power are insignificantly higher with respect to the costs of a PV power plant with fixed inclination and azimuth angle of the same power. Average O&M costs, for the utility scale ground mounted PV plants, have steadily declined from about $19/MWh in 2011 to about $8/MWh in 2014, [31]. The PV O&M Working Group [32] analyzed the structure of O&M costs and different experiences recommending 0.5% for large systems and 1% of system initial cost per year for small systems as a reasonable expectation of PV system O&M costs.
Since there is still both insufficient exploitation experience concerning large scale FPPPs, and the proposed system contains an innovative rotating platform concept, in this analysis, specific operating costs of €10/MWh were adopted, which, with regard to the calculated annual production, amounts to around €20/kWp/year, or about 1.6% of the initial cost per year, which is significantly higher than the usual costs for large scale PV systems on the ground. An unavailability of a PV power plant of 5% comprises the unavailability of the grid and a degradation of efficiency of a PV panel during the exploitation period. Figure 12 presents the estimated production costs for different interest rates. If the interest rate of 4% is assumed, the production costs are about €50/MWh.
The authors assume that the construction of the proposed FPPP would be of a great importance on the state level in view of the fact that the aluminium plant is the biggest consumer of electricity in Montenegro and it is located on a terrain that has very good technical preconditions for the construction of the proposed power plant. Its construction would to a large extent resolve the electricity deficit problem, reduce losses in the transmission grid and postpone the need for the construction of new thermal power plants. The authors deem that these are sufficient motives for the government to analyze the extension of subsidies for such a plant. Also, one of the basic objectives of subsidies based on the feed in tariff principle is to provide a contribution to the development of new technologies, which would be achieved with the construction of the proposed power plant. Regarding the fact that the production of electrical energy from PV power plants installed on buildings and structural facilities with installed power up to 1 MW is subsidized at a rate of €120/MWh, based on Figure 12, it can be concluded that this facility would have very good economic return rate indicators with such subventions (IRR = 16%).
10. Impact on the Environment
A building of any outdoor facility brings some negative consequences to the environment, but a carefully planned building can help mitigate certain negative effects. Skadar Lake, as the habitat of several types of fishes, represents a very important locality where migratory birds and waterfowl spend the wintertime, and it is also the nesting locality of the rare Dalmatian pelican (Pelecanus crispus). There are more than 280 types of birds as well as 50 types of fishes in this locality. The Skadar Lake area with a narrow bank belt and swamp belt was declared a national park in 1983. IBA status (area with international significance for staying of birds) was awarded in 1989, and this area is also registered in the global list of swamps of international significance—the Ramsar list—in 1995.
According to the planning documentation [33], the area of the Skadar Lake national park was divided into three protection zones. The recommended location of the FPPP is situated in the second protection zone, while the main transformer station and the 110 kV power line are situated outside the protection zones (Figure 13). With regard to the laws concerning national parks [34], the building of facilities in this zone is allowable if the necessary permissions and agreements are issued. The protection of natural processes, flora and fauna are the priority goals for this zone, thence the facility that would be built in this zone may not endanger these processes to a large extent.
Having regard to the special natural significance of the Skadar Lake area to the further development of the recommended project of the FPPP, it is necessary to carry out a comprehensive analyses of the environmental impact. This paper describes only some of the likely positive effects of the building of the FPPP.
10.1. Impact on the Reduction of Periodic Water Draining of the Lake
One of vital characteristics of Skadar Lake are the seasonal water level oscillations due to inflow from the Morača River, accompanied by the limited capacity of the Bojana River to drain away water to the Adriatic Sea. Having in mind a relatively small average depth of the lake of 6 m, a delevelling of water leads to the periodic draining of the lake, thence the summer water level area is about 370 km2, while the water surface in winters is about 540 km2, and the average water area is 475 km2. Bearing in mind that the FPPP project is planned at an aloof part of the lake, the water evaporation level would be significantly reduced by the presence of the PV panels, as well as a bigger water area would be retained, what should be favourable for animals and vegetation in this part of the lake because the shortage of sunlight prevents the spreading of algae [4,8]. With regard to the significance of the effect of the evaporation decrease by the building of the FPPP, this effect is comprehensively analyzed in Section 11.
10.2. Impact on the Reduction of Greenhouse Gases Emissions
The reduction of greenhouse gas emissions refers to the amount of greenhouse gases generated when a fossil-fuel energy system is used to generate the same amount of electricity produced by a renewable energy system [6]. This is obtained using Equation (15) [6]:
where: Gt is an amount of GHG reduced annually (tCO2/year), Es is an annual electricity production from the FPPP (MWh/year), G is a standard value of GHG emissions of each country (tCO2/MWh), and β is an average loss rate of the power transmission and distribution systems. For the purposes of this calculation, values for G and β were estimated on the basis of data from the Montenegrin electrical energy sources and are 0.38 and 0.18, respectively [2]. The annual reduction of CO2 emissions calculated by using Equation (15) is 83.428 ktCO2/year.
11. Effect of the FPPP on the Reduction of Water Evaporation from Skadar Lake
The building of a PV plant will reduce water evaporation not only from the surface of the part that will be covered by the PV panels, but also from the entire lake’s surface. There are two main effects reducing the level of water evaporation from the lake. The covering of a part of the area reduces the total contact area between the water basin and air thence there is almost no evaporation from the surface below the panels. The second effect is related to the heat balance that is changed after the building of the power plant. One part of the solar energy is converted into electricity, while the other part is reflected from the PV panels and the platform. As a consequence of this, water in the lake will be colder, and thence it will evaporate less.
11.1. Mathematical Model for the Estimation of Reduction of Water Evaporation
The estimation of water evaporation from open water surfaces is a fairly complex process due to the high number of influencing parameters. The water evaporation from a free water surface depends on the water and air temperatures, deficit of air saturation above the water surface, wind speed, insolation, atmospheric pressure and the chemical properties of the water.
Water evaporation directly depends on the area from which water evaporates, thence it is most often measured in mm/day, so as to define how many millimetres the lake level is reduced during an average day. Many mathematical methods for the estimation of evaporation has been developed [35]. One of the methods that is most frequently used for the calculation of water evaporation from open surfaces is Penman’s method [36]. There is several modifications of this method, while there is the following expression in the original form:
where E is average daily evaporation from free water surface (mm/d), Rn is the net irradiance on the analysed water surface (MJ/m2/d), Δ is the gradient of the saturated steam curve (kPa/°C), γ is a physico-metric constant (kPa/°C), λ is the latent heat of evaporation (MJ/kg) and fu is a wind function, calculated according to the following equation:
where: v (m/s) is the wind speed at a height of 2 m above water surface, au and bu are constants (in the original equation they have values au = 1 and bu = 0.536), D is the deficit of water steam pressure (kPa), that is calculated as the difference between the saturated steam pressure (es) and the real water steam pressure (ea):
Using the interdependence of some climatologic weights and a practically acceptable simplifications, in [37] the simplified Penman’s model is comprehensively described by the following equation:
where E0 is the average daily evaporation from the free water surface (mm/day) under the assumption that the water surface is at sea level (z = 0), RS is the solar irradiance on the lake surface that can be measured in hours (h) of sun exposure duration for an average day, what is standard meteorological data, according to the following equation:
where: n is the number of sunny days in an average day in the analysed month and N is the maximum possible number of sunny days of the analysed month, that can be calculated for the given geographic width φ according to the following equation:
where: i is an ordinal number of analysed month in a year, RA is the solar irradiance on the surface of the atmosphere above the analysed location and it can be calculated according to the following approximate equation:
where: α is albedo of the water surface that is usually assumed to be 0.08 and T is mean value of average extreme temperatures in the analysed month (°C):
where RH is average value of relative air humidity in the analysed month expressed in percent (%) and v is mean monthly value of the wind speed at a height of 2 m above the water surface expressed in (m/s). Equation (19) is adjusted by the calculations for water surfaces at sea level. For open free surfaces at higher altitudes z (m) should be corrected according to Equation (24) that is empirically obtained [37]:
The total volume of water that evaporates from free surfaces can be calculated according to the following equation:
The mitigation of water evaporation from the lake (ΔV) after the building the FPPP can be estimated on the basis of the relations of the covered lake surface, namely the total area of the platform of the FPPP (AFPPP), and the total free lake surface before building the FPPP (ALake), according to the following equation:
where the coefficient k < 1 accounts for the fact that a part of additional irradiated energy on the FPPP is handed to water, increasing its potential for evaporation. The values of the coefficient k depends on the type and reflective characteristics of the platform, its coverage level with PV modules and the efficiency of these modules.
11.2. Calculation of the Reduction of Water Evaporation from The Skadar Lake after the Building of the FPPP
The data from the meteorological station of Podgorica situated in the vicinity of the lake were used for the calculation of the water evaporation from Skadar Lake. The data were obtained from the Hydrometeorological Institute of Montenegro [38], and correspond the period 2005–2014. Table 6 presents the input data in the first five rows of this table. The water evaporation from Skadar Lake is calculated for an average day in each month, namely the average daily decrease of the altitude level of water due to water evaporation. The calculated values are presented in the last row of Table 6.
Figure 14 presents graphically the values of water evaporation for an average day in a month.
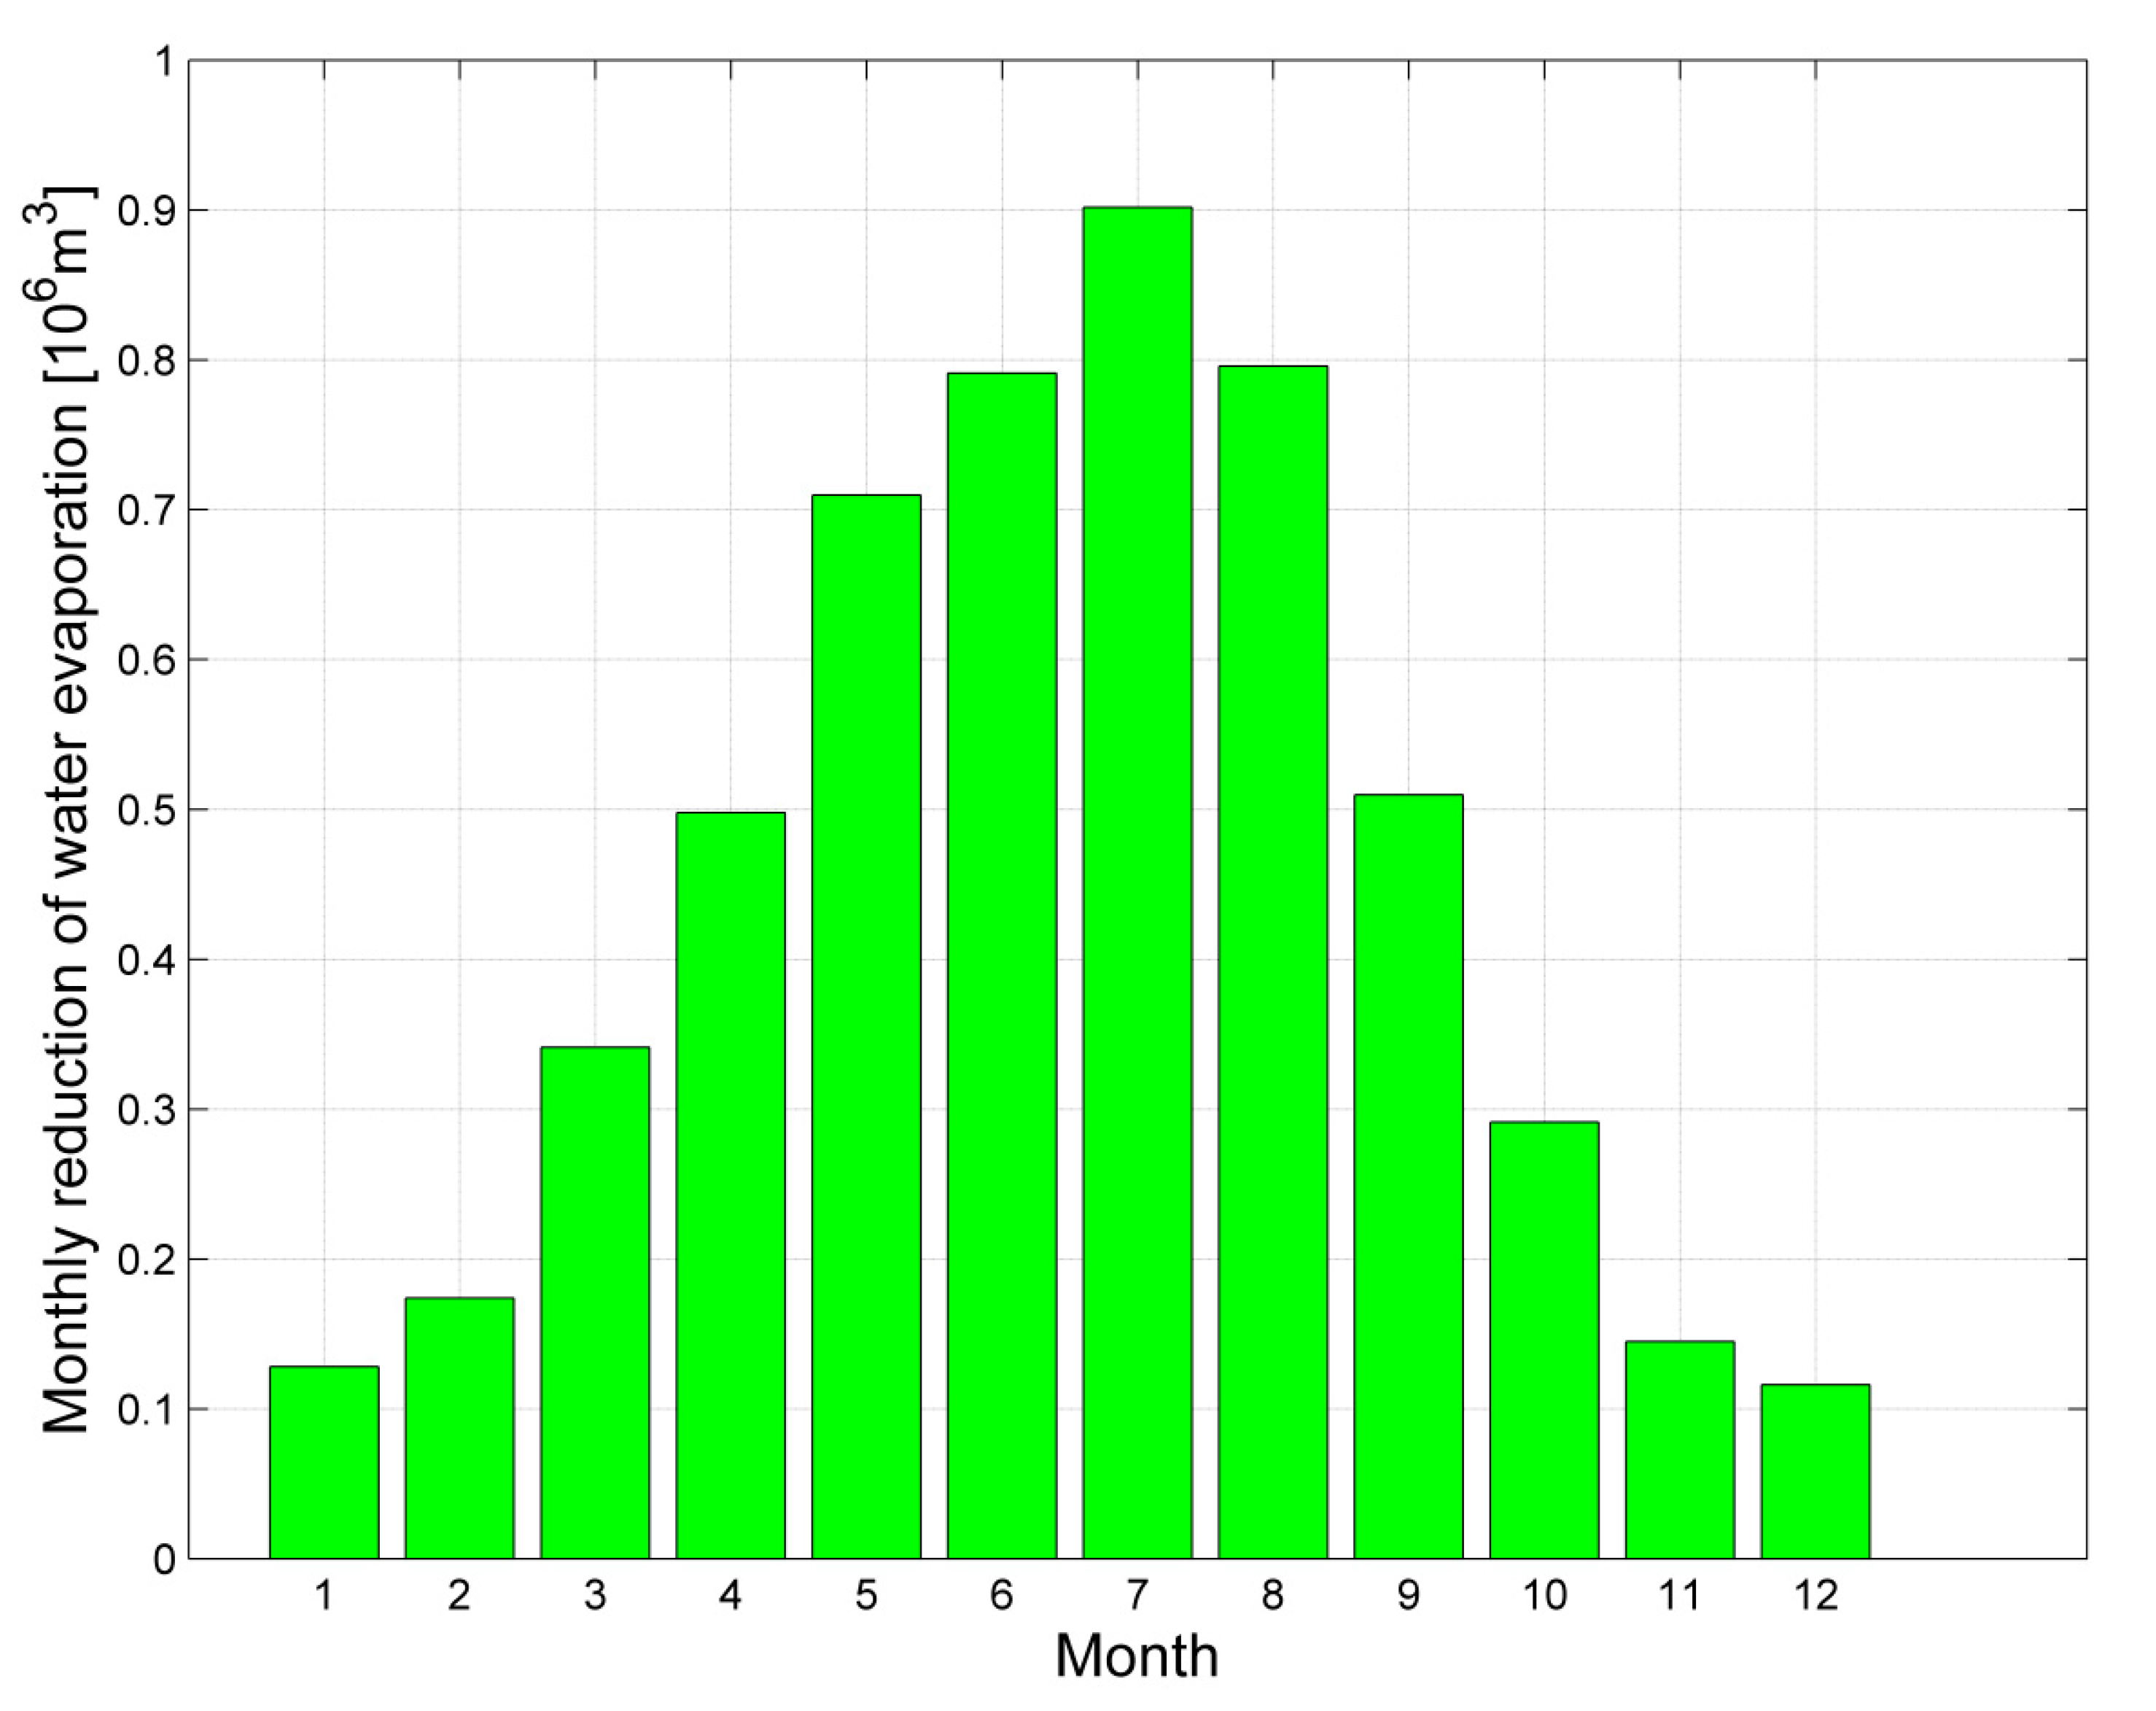
The most intensive evaporation occurs in July. The estimated value of the decrease of water level in this month is about 9.27 mm daily. The smallest intensity of water evaporation is in December and is about 1.19 mm daily. The total water evaporation from Skadar Lake in an average year is about 173 cm. With regard to the calculated water evaporation values from the free surface of Skadar Lake, (Table 6 and Figure 14) and the area occupied by the FPPP, according to Equation (26), the drops of water evaporation for each month were calculated. Given the supposed reflective characteristics of the platform and efficiency of the PV module, in Equation (26) the value of coefficient k = 0.6 is assumed. The data are graphically presented at Figure 15. The total annual reduction of water evaporation after the building of the FPPP on Skadar Lake was 5.41 million m3 obtained by the summation of monthly water evaporations.
12. Conclusions
This paper recommends the concept of the control of an azimuth angle FPPP which provides a production 27.68% higher in comparison to the usual conceptual solutions of the FPPP. The proposed solution consists of 18 power plants in total with an installed power of 5 MWp. The tilt angle for a PV module was determined according to the criterion of a maximum mean annual daily insolation which is 44°.
Each of the power plants has its own system for tracking the Sun’s azimuth that can easily be realized by using systems of motor-powered propellers and an anchor as an axis. Additionally, this paper recommends the increase of the reflecting components of the panels by using light blocks between arrays of panels, that additionally increase the production of the FPPP by 4.32%. The proposed FPPP concept provides an annual production of 186.05 MWh, or more than 20% of the total energy needs of the KAP. Based on NREL data, the estimated production of this FPPP is about 31.29% bigger than in case of a classic PV power plant with equal installed power placed on land and oriented toward the south under the optimal tilt angle of 30° in the vicinity of the planned microlocation. A significantly bigger production of the proposed FPPP concept would be achieved because of the proposed concept of tracking of the Sun’s azimuth angle by the yawing motion of the platforms achieved with propellers. Also, a negative impact of a higher temperature on the production of the FPPP is reduced due to a smaller water surface temperature than air temperature. The recommended solution represents a likely solution for an ecologically acceptable supply of a part of energy for the aluminium factory in Podgorica. The recommended solution with an adopted reflected component would contribute to an annual reduction of CO2 emission for 83.42 kt CO2/year. One of the main positive ecological effects of the building of the FPPP is the reduction of the water evaporation which would amount to about 5.41 million m3 per year. Considering that the proposed FPPP planned on an isolated and shallow part of Skadar Lake (Figure 3 and Figure 13), whose water level in the summer months decreases to a critical height that isolates it from the rest of the lake, the effect of evaporation reduction has a very positive effect on the survival of living organisms in this part of the lake.
Author Contributions
The design and analyses of proposed concept FPPP, as well as the impact of building FPPP on reduction water evaporation is carried out by Vladan Durković under the supervision and support of Željko Đurišić. In addition, the manuscript was first drafted by Vladan Durković and then revised by Željko Đurišić. The both authors read and approve the manuscript.
Conflicts of Interest
The authors declare no conflict of interest.
References
- Declaration of Ecological State Montenegro. Available online: http://www.mgreens.co.me/declaration.htm (accessed on 10 November 2016).
- Annual Electricity Report for Montenegro Publiched by Elektroprivreda Crne Gore AD Nikšić 2015. Available online: http://www.epcg.me (accessed on 29 October 2016).
- Dunjić, S.; Pezzutto, S.; Zubaryeva, A. Renewable energy development trends in the Western Balkans. Renew. Sustain. Energy Rev. 2016, 65, 102032. [Google Scholar] [CrossRef]
- Sahu, A.; Yadav, N.; Sudhakar, K. Floating photovoltaic power plant: A review. Renew. Sustain. Energy Rev. 2016, 66, 8124. [Google Scholar] [CrossRef]
- Trapani, K.; Santafe, M.R. A review of floating photovoltaic installations: 2007–2013. Prog. Photovolt. Res. Appl. 2014, 23, 524–532. [Google Scholar] [CrossRef]
- Jinyoung, S.; Yosoon, C. Analysis of the Potential for Use of Floating Photovoltaic Systems on Mine Pit Lakes: Case Study at the Ssangyong Open-Pit Limestone Mine in Korea. Energies 2016, 9, 102. [Google Scholar]
- Trapani, K.; Millar, D.L. Proposing offshore photovoltaic (PV) technology to the energy mix of the Maltese islands. Energy Convers. Manag. 2013, 67, 18–26. [Google Scholar] [CrossRef]
- Ferrer-Gisbert, C.; Ferrán-Gozálvez, J.J.; Redón-Santafé, M.; Ferrer-Gisbert, P.; Sánchez-Romero, F.J.; Torregrosa-Soler, J.B. A new photovoltaic floating cover system for water reservoirs. Renew. Energy 2013, 60, 60. [Google Scholar] [CrossRef]
- Trapani, K.; Millar, D.L.; Smith, H.C.M. Novel offshore application of photovoltaics in comparison to conventional marine renewable energy technologies. Renew. Energy 2013, 50, 8788. [Google Scholar] [CrossRef]
- Santafé, M.R.; Soler, J.B.T.; Romero, F.J.S.; Gisbert, P.S.F.; Gozálvez, J.J.F.; Gisbert, C.M.F. Theoretical and experimental analysis of a floating photovoltaic cover for water irrigation reservoirs. Energy 2014, 67, 2455. [Google Scholar]
- Santafé, M.R.; Gisbert Pablo, S.F.; Romero, F.J.S.; Soler, J.B.T.; Gozálvez, J.J.F.; Gisbert, C.M.F. Implementation of a photovoltaic floating cover for irrigation reservoirs. J. Clean. Prod. 2014, 66, 5670. [Google Scholar] [CrossRef]
- National Renewable Energy Laboratory. PVWatts Caculator. Available online: http://pvwatts.nrel.gov/ (accessed on 19 October 2016).
- Tynan Scott, H. Evaluating Potential for Floating Solar Installations on Arizona Water Management Infrastructure; The University of Arizona: Tucson, AZ, USA, 2016. [Google Scholar]
- Journee, J.M.J.; Massie, W.W. Offshore Hydromechanics; Delft University of Technology: Delft, The Netherlands, 2001. [Google Scholar]
- Solar Panel Module LG US Business. Available online: http://www.lg.com/us/business/solar-panel/products (accessed on 19 October 2016).
- Quaschning, V. Understanding Renewable Energy Systems, 2nd ed.; Earthscan: London, UK, 2005; pp. 73–76. [Google Scholar]
- Puneeth Kumar, H.P.; Prakash, S.B. CFD analysis of wind pressure over solar panels at different orientations of placement. Int. J. Adv. Technol. Eng. Sci. 2014, 2, 313–320. [Google Scholar]
- Floating Solar Technology Design, Ciel & Terre’s, France. Available online: http://www.ciel-et-terre.net/ (accessed on 2 August 2017).
- Shademan, M.; Hangan, H. Wind Loading on Solar Panels at Different Inclination Angles. In Proceedings of the 11th American Conference of Wind Engineering, San Yuan, Puerto Rico, 22–26 June 2009. [Google Scholar]
- Masters, G. The solar resource. In Renewable and Efficient Electric Power Systems, 1st ed.; John Wiley & Sons: Hoboken, NJ, USA, 2004. [Google Scholar]
- Alobaid, F.; Mertens, N.; Starkloff, R.; Lanz, T.; Heinze, C.; Epple, B. Progress in dynamic simulation of thermal power plants. Prog. Energy Combust. Sci. 2017, 59, 762. [Google Scholar] [CrossRef]
- Munner, T. Solar Radiation and Daylight Models, 2nd ed.; Elsevier: Oxford, UK, 2004; p. 305. [Google Scholar]
- Schiro, F.; Benato, A.; Stoppato, A.; Destro, N. Improving photovoltaics efficiency by water cooling: Modelling and experimental approach to improve the panel efficiency. Energy 2017. [Google Scholar] [CrossRef]
- Vanhoudt, D.; Geysen, D.; Claessens, B.; Leemans, F.; Jespers, L.; Van Bael, J. An actively controlled residential heat pump: Potential on peak shaving and maximization of self-consumption of renewable energy. Renew. Energy 2014, 63, 5343. [Google Scholar] [CrossRef]
- Baetens, R.; De Coninck, R.; Van Roy, J.; Verbruggen, B.; Driesen, J.; Helsen, L.; Saelens, D. Assessing electrical bottlenecks at feeder level for residential net zero-energy buildings by integrated system simulation. Appl. Energy 2012, 96, 73. [Google Scholar] [CrossRef]
- Benato, A. Performance and cost evaluation of an innovative Pumped Thermal Electricty Storage power system. Energy 2017. [Google Scholar] [CrossRef]
- Kim, S.; Yoon, S.; Choi, W. Design and Construction of 1MW Class Floating PV Generation Structural System Using FRP Members. Energies 2017, 10. [Google Scholar] [CrossRef]
- Hammad, M.; Ebaid, M.; Halaseh, G.; Erekat, B. Large scale grid connected (20MW) Photovoltaic system for peak load shaving in Shab Insutrial District. Jordan J. Mech. Ind. Eng. 2015, 9, 45–59. [Google Scholar]
- International Renewable Energy Agency. Renewable Energy Technologies: Cost Analysis Series-Solar Photovoltaics, Volume 1: Power Sector, Issue 4/5; International Renewable Energy Agency: Bonn, Germany, 2012. [Google Scholar]
- USA Energy Information Administration. Capital Cost Estimates for Utility Scale Electricity Generating Plants; U.S. Department of Energy: Washington, DC, USA, 2016; p. 1.
- Bolinger, M.; Seel, J. Utility-Scale Solar 2014: An Empirical Analysis of Project Cost, Performance, and Pricing Trends in the United States; LBNL-1000917; Lawrence Berkeley National Labs: Berkeley, CA, USA, 2015.
- Whaley, C. Best Practices in Photovoltaic System Operations and Maintenance, 2nd ed.; Technical Report NREL/TP-7A40-67553; NREL/Sandia/Sunspec Alliance SuNLaMP PV O&M Working Group: Oka Ridge, TN, USA, 2016.
- Management Plan for the National Park Skadar Lake 2010–2015 (on Serbian), National Parks of Montenegro, Podgorica. Available online: http://www.nparkovi.me/sajt/images/stories/Dokumenti/np%20skadarsko%20jezero%202011-2015.pdf (accessed on 2 September 2017).
- Law on National Parks (on Serbian). Available online: http://www.nparkovi.me/sajt/images/stories/Zakon_o_nacionalnim_parkovima.pdf (accessed on 2 September 2017).
- Jensen, M.E. Estimating evaporation from water surfaces. Presented at the CSU/ARS Evapotranspiration Workshop, Fort Collins, CO, USA, 15 March 2010. [Google Scholar]
- Penman, H.L. Natural evaporation from open water, bare and grass. Proc. R. Soc. Lond. 1948, 193, 120–145. [Google Scholar] [CrossRef]
- Valiantzas, J.D. Simplified versions for the Penman evaporation equation using routine weather data. J. Hydrol. 2006, 331, 6902. [Google Scholar] [CrossRef]
- The Hydro Meteorological Institute of Montenegro. Available online: http://www.meteo.co.me/ (accessed on 5 September 2017).
Figure 1.
Annual diagram of energy consumption in the KAP.

Figure 2.
A part of Skadar Lake for which a FPPP project is being developed.

Figure 3.
The configuration of the FPPP.
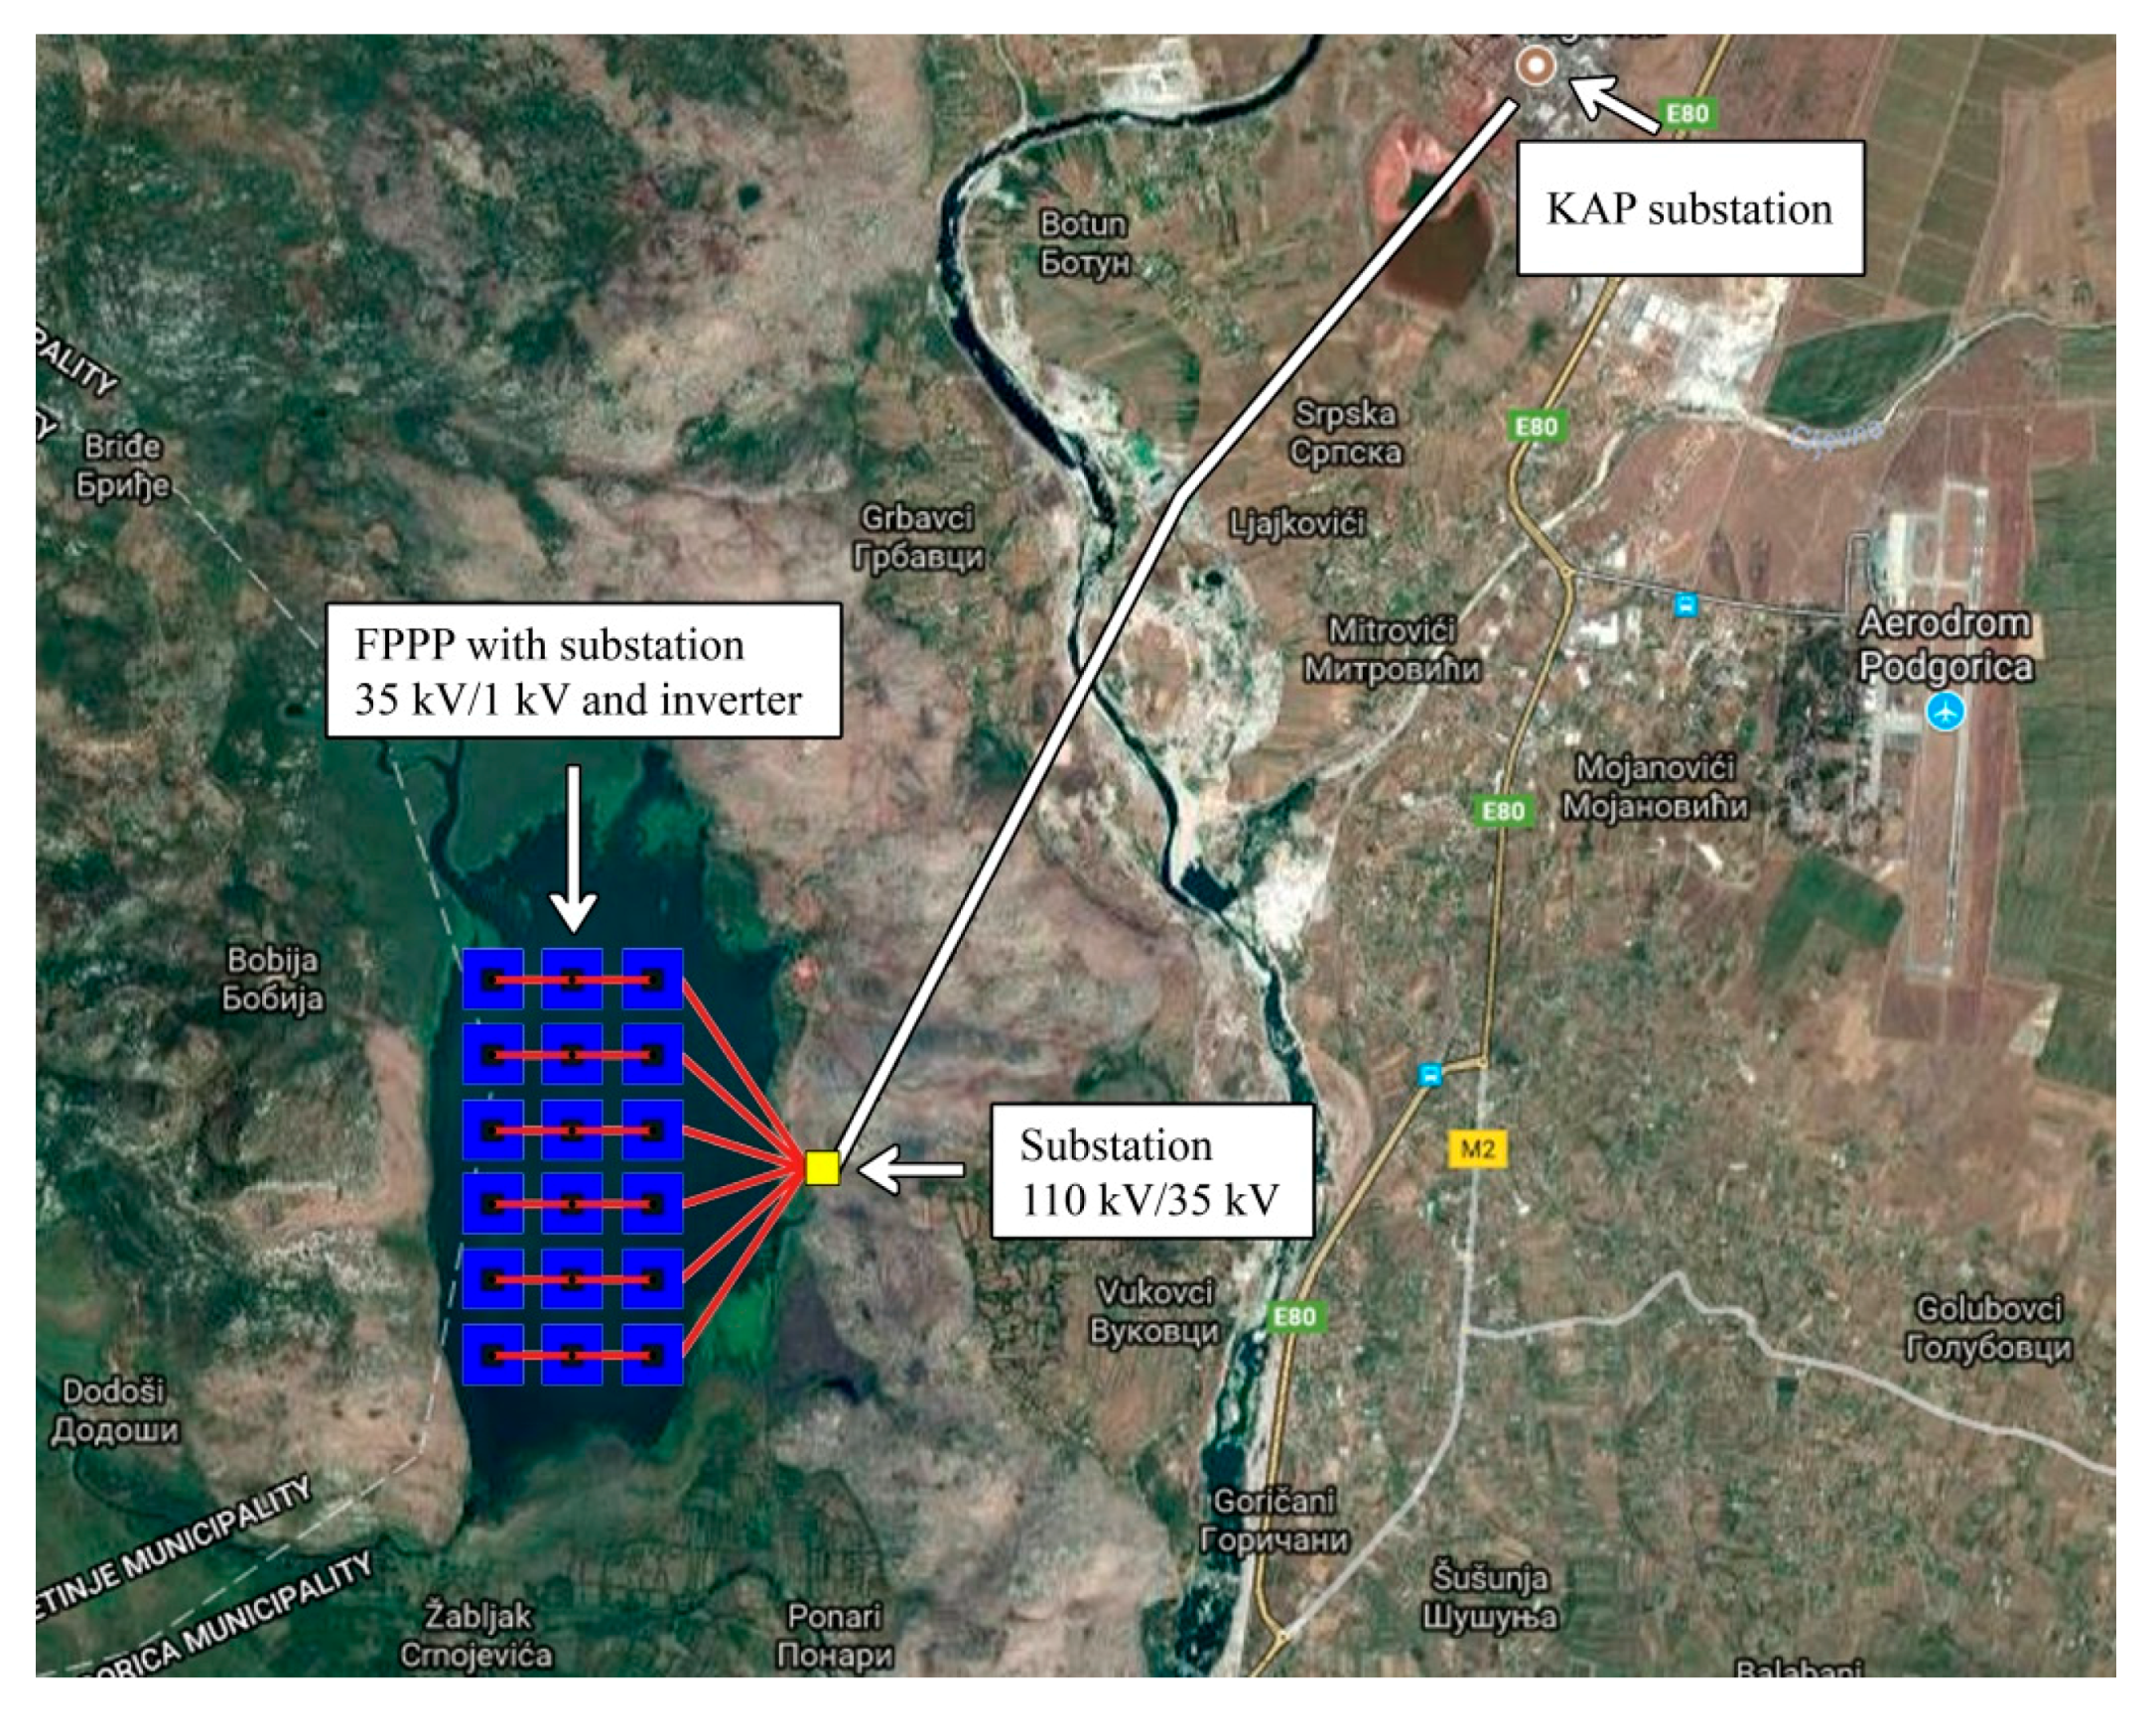
Figure 4.
The conceptual design of the platform structure enabling the tracking of the Sun azimuth.
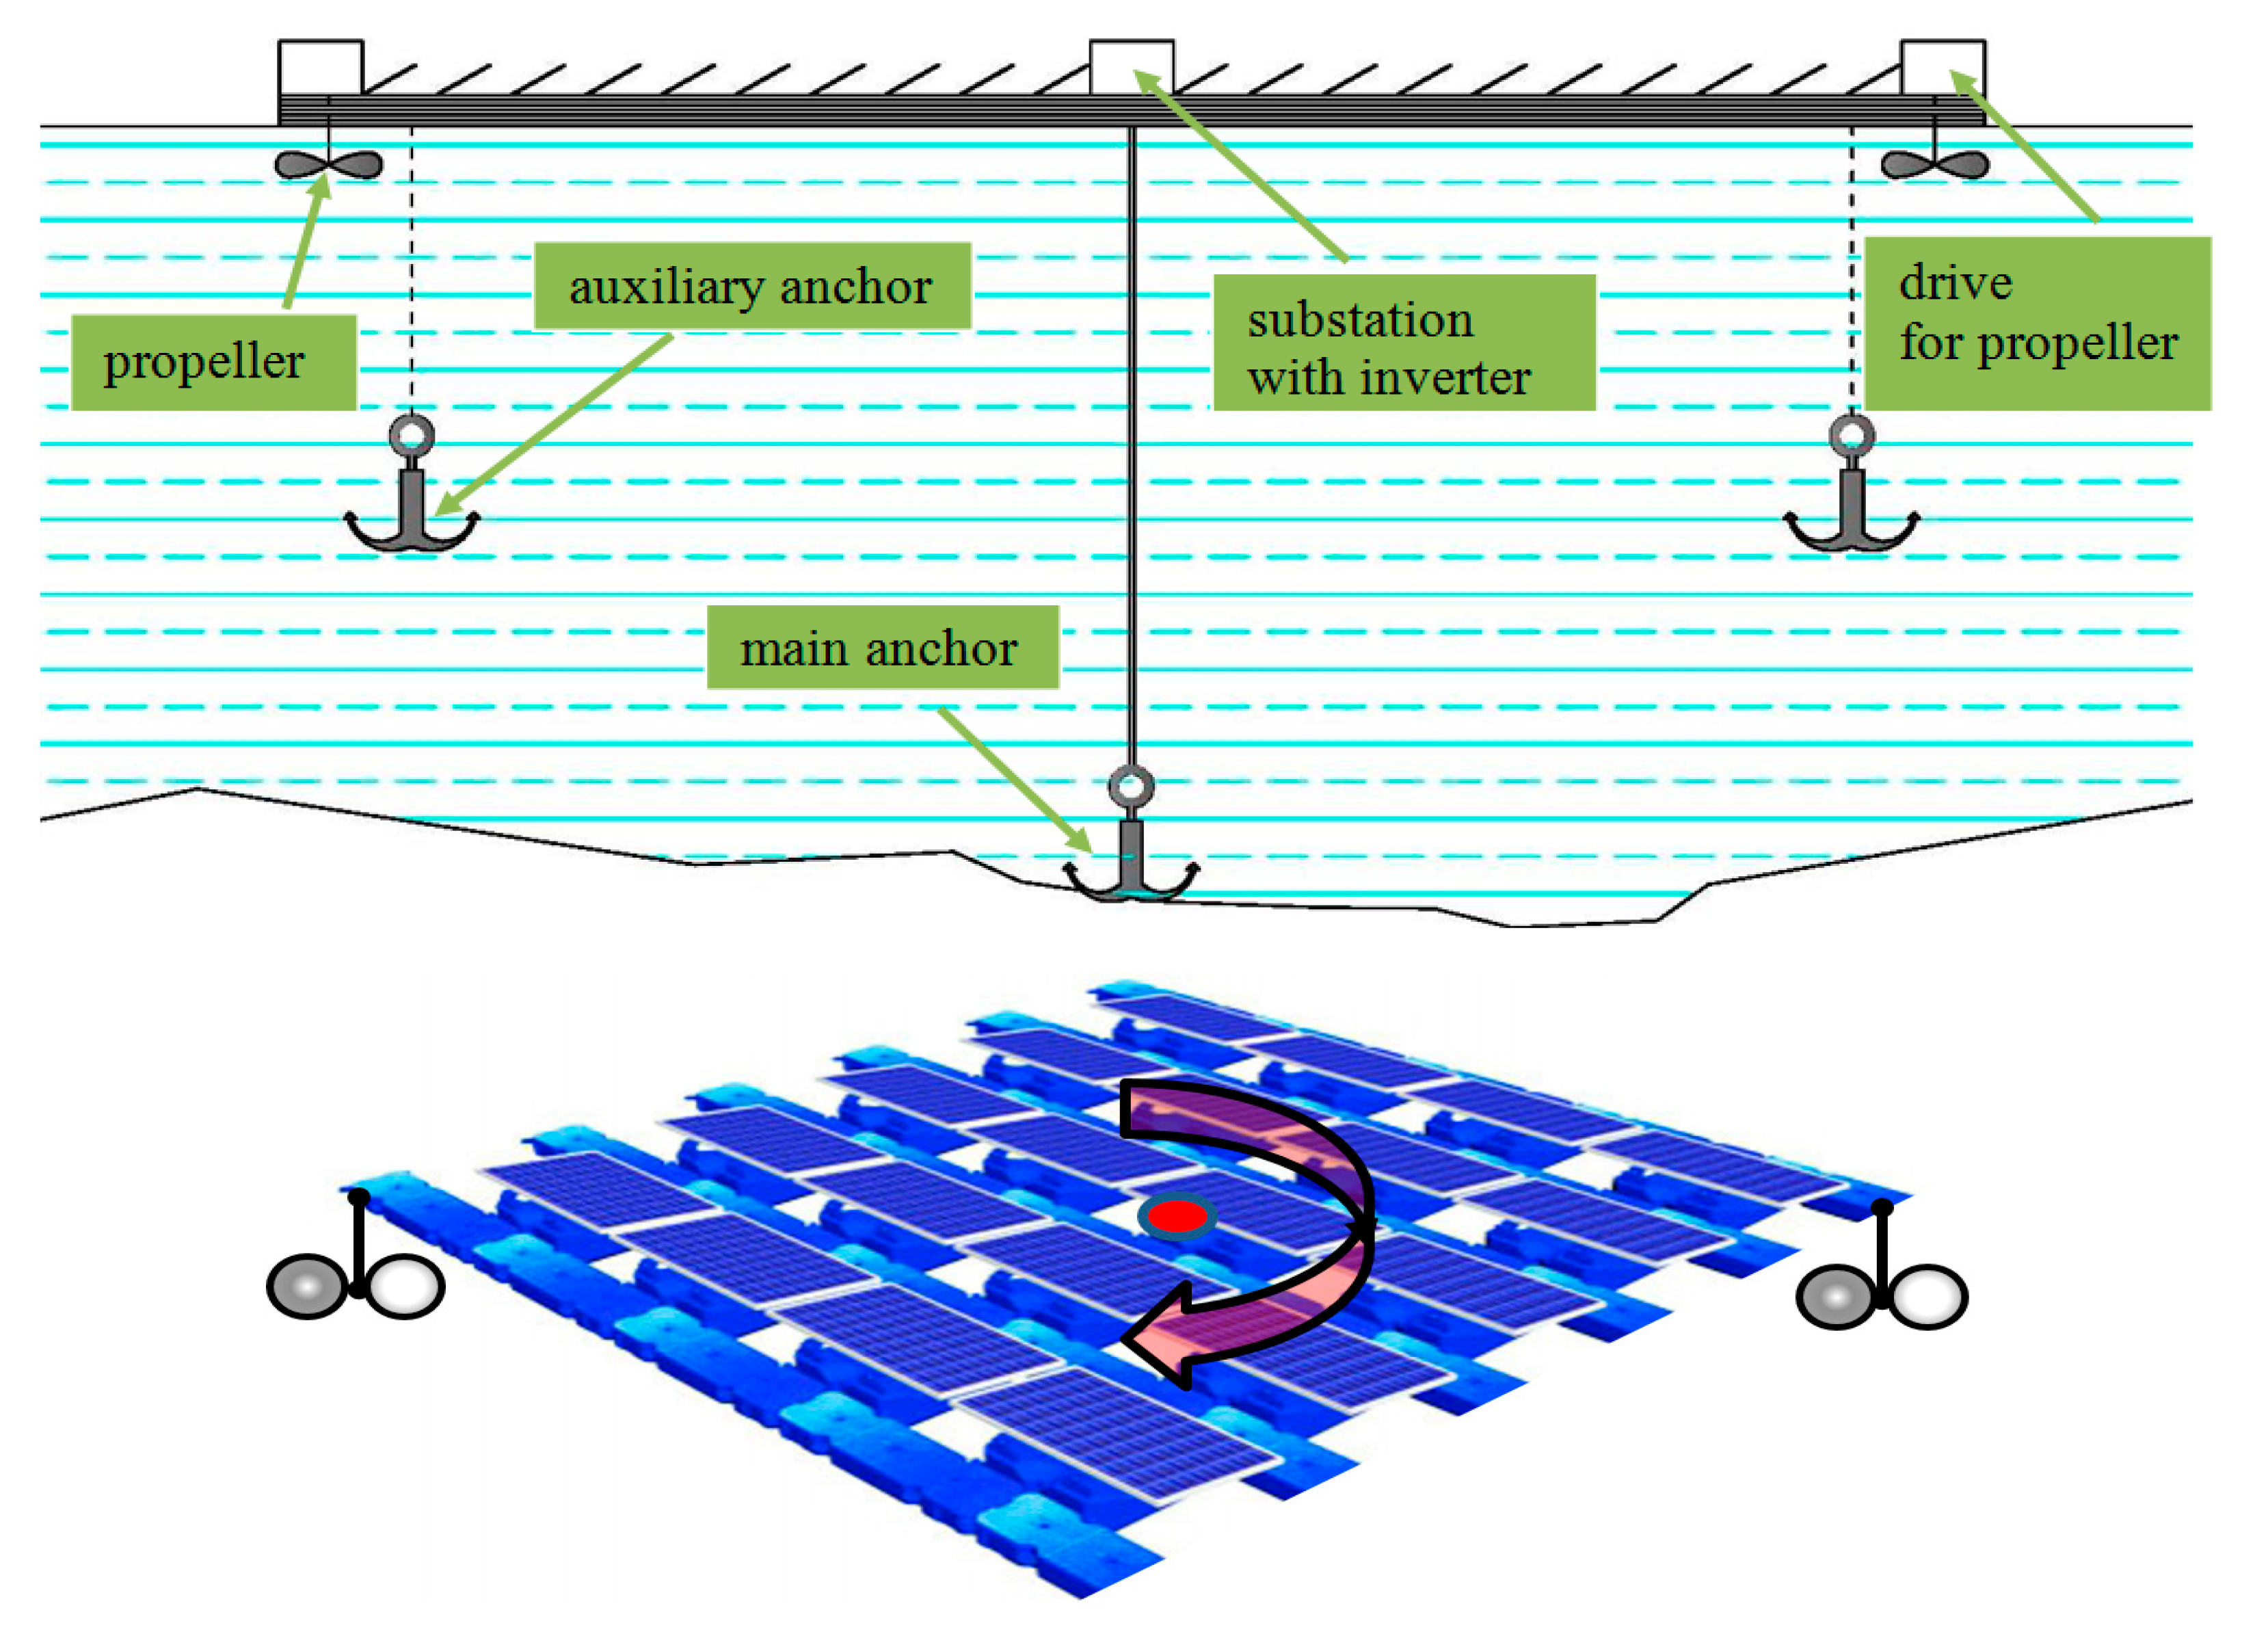
Figure 5.
The calculation of an optimal tilt angle of a PV panel.

Figure 6.
The calculation of the minimum distance between the neighbouring arrays of PV panels [16].
Figure 6.
The calculation of the minimum distance between the neighbouring arrays of PV panels [16].
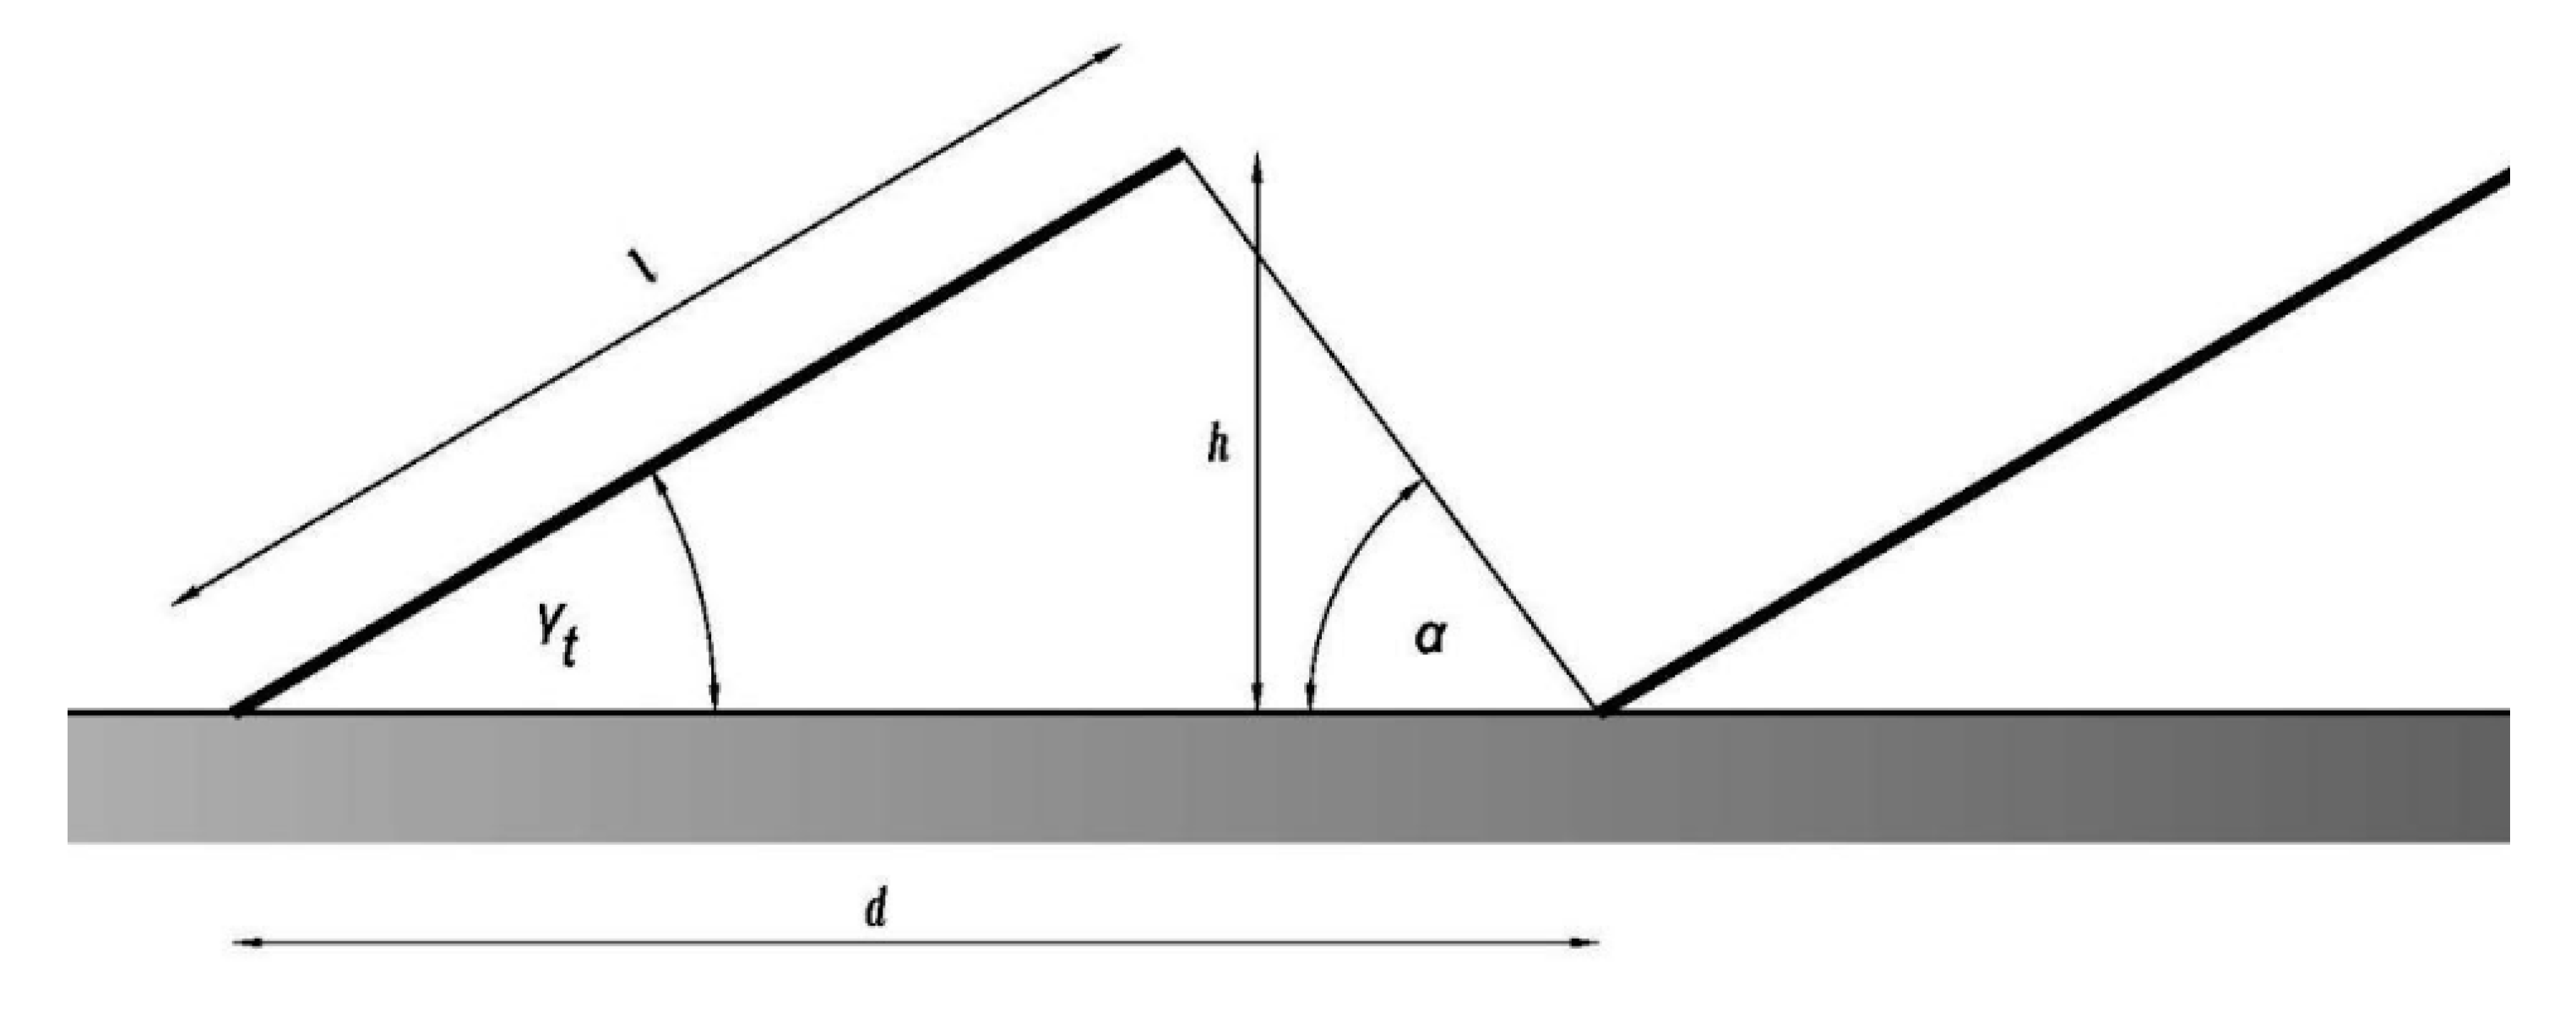
Figure 7.
Positioning of PV panels during strong winds (the assumed wind direction is indicated by the red arrow).
Figure 7.
Positioning of PV panels during strong winds (the assumed wind direction is indicated by the red arrow).

Figure 8.
Long-term statistics of wind measured at an altitude of 10 m in Podgorica, in the proximity of the proposed FPPP.
Figure 8.
Long-term statistics of wind measured at an altitude of 10 m in Podgorica, in the proximity of the proposed FPPP.

Figure 9.
Monthly production of the FPPP.
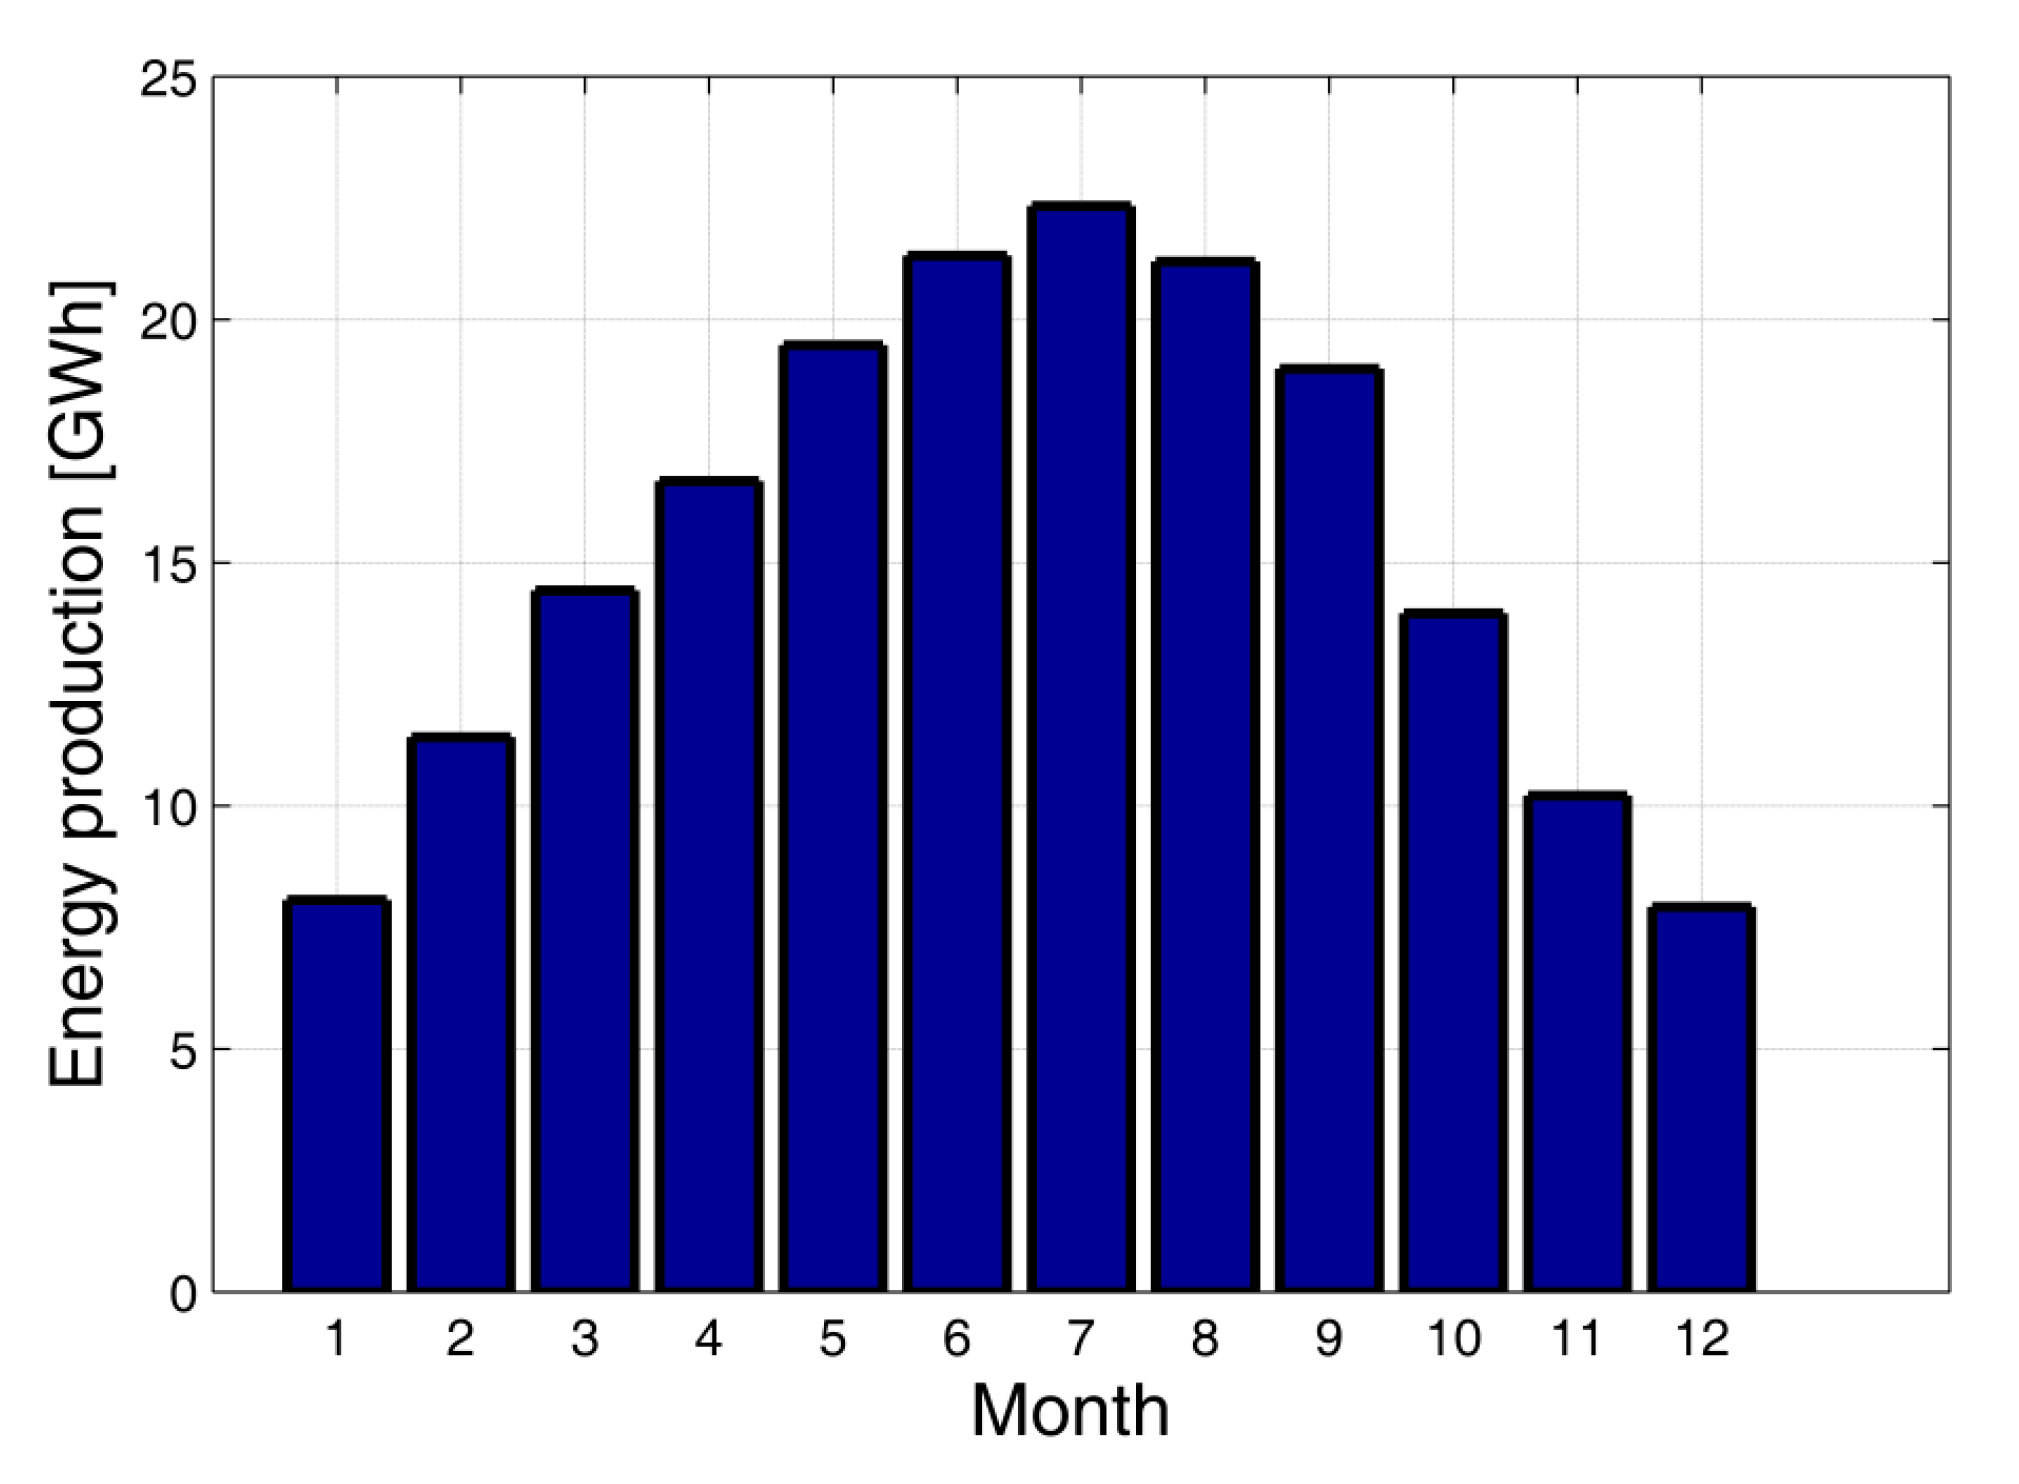
Figure 10.
The calculation of a direct reflected component.

Figure 11.
Average daily production of FPPP and daily consumption of KAP.

Figure 12.
The dependence of the production costs of the FPPP on the interest rate.
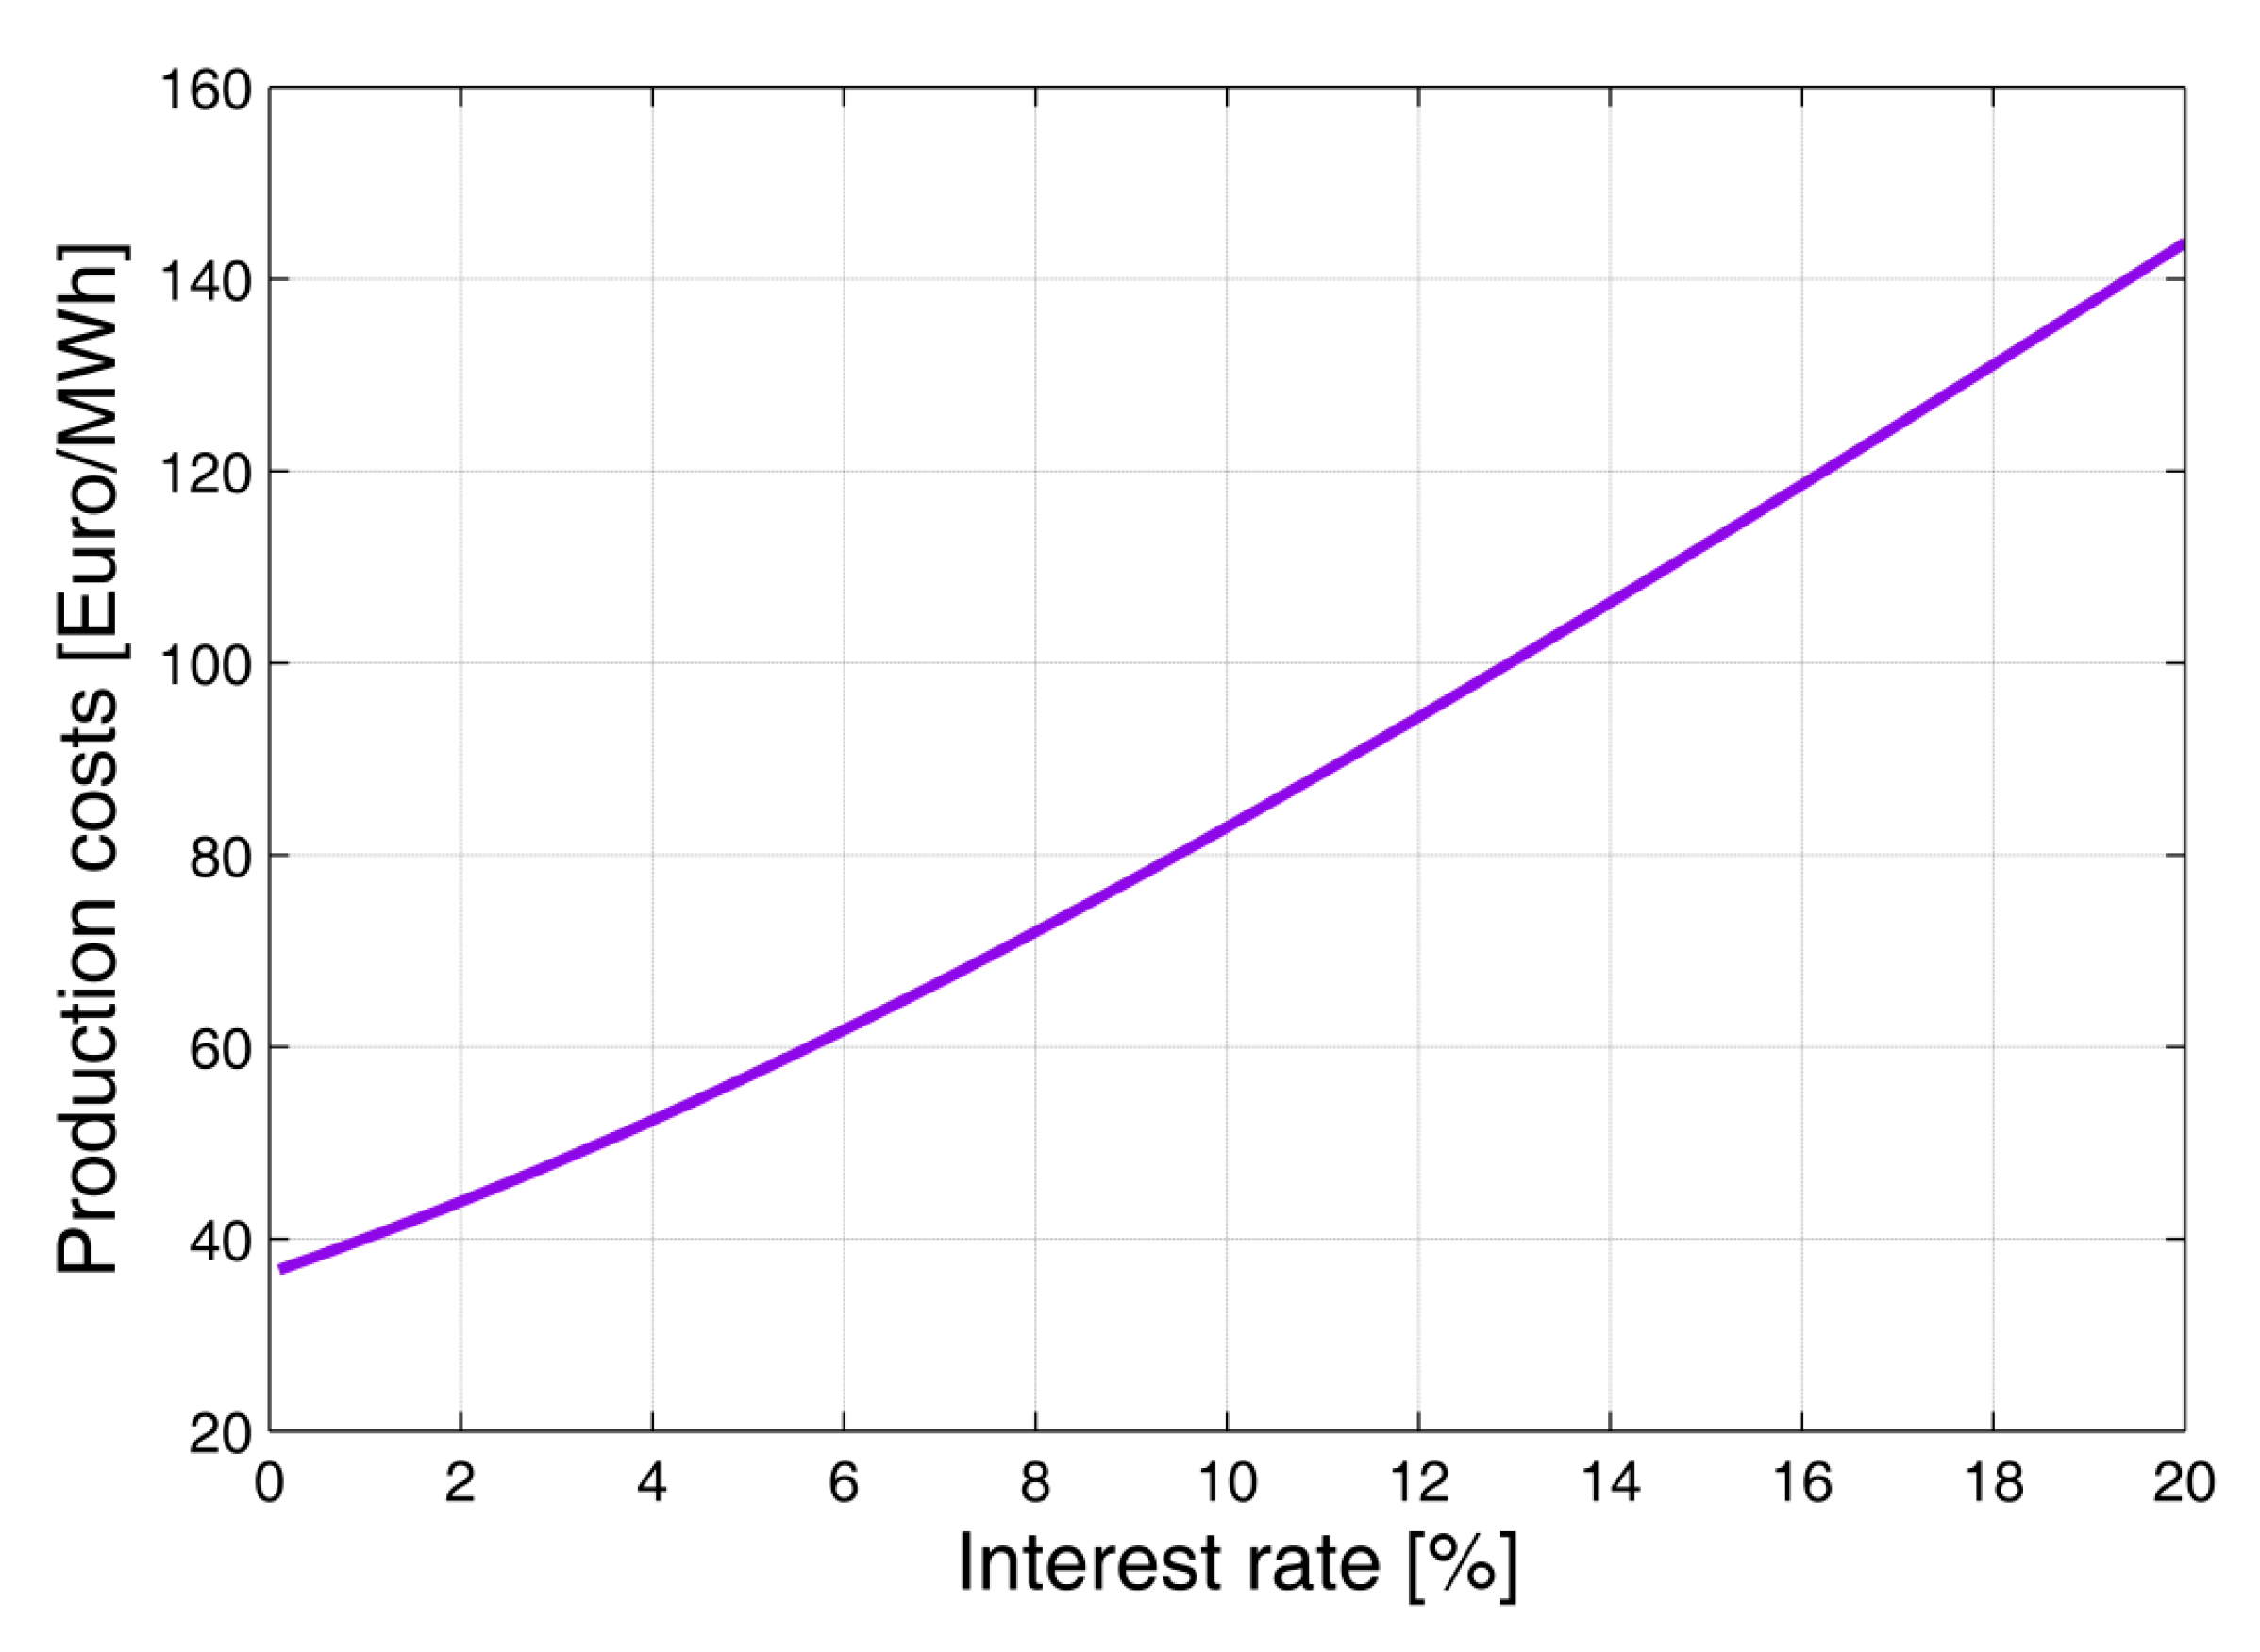
Figure 13.
A map of zoning of the national park—SkadarLake.
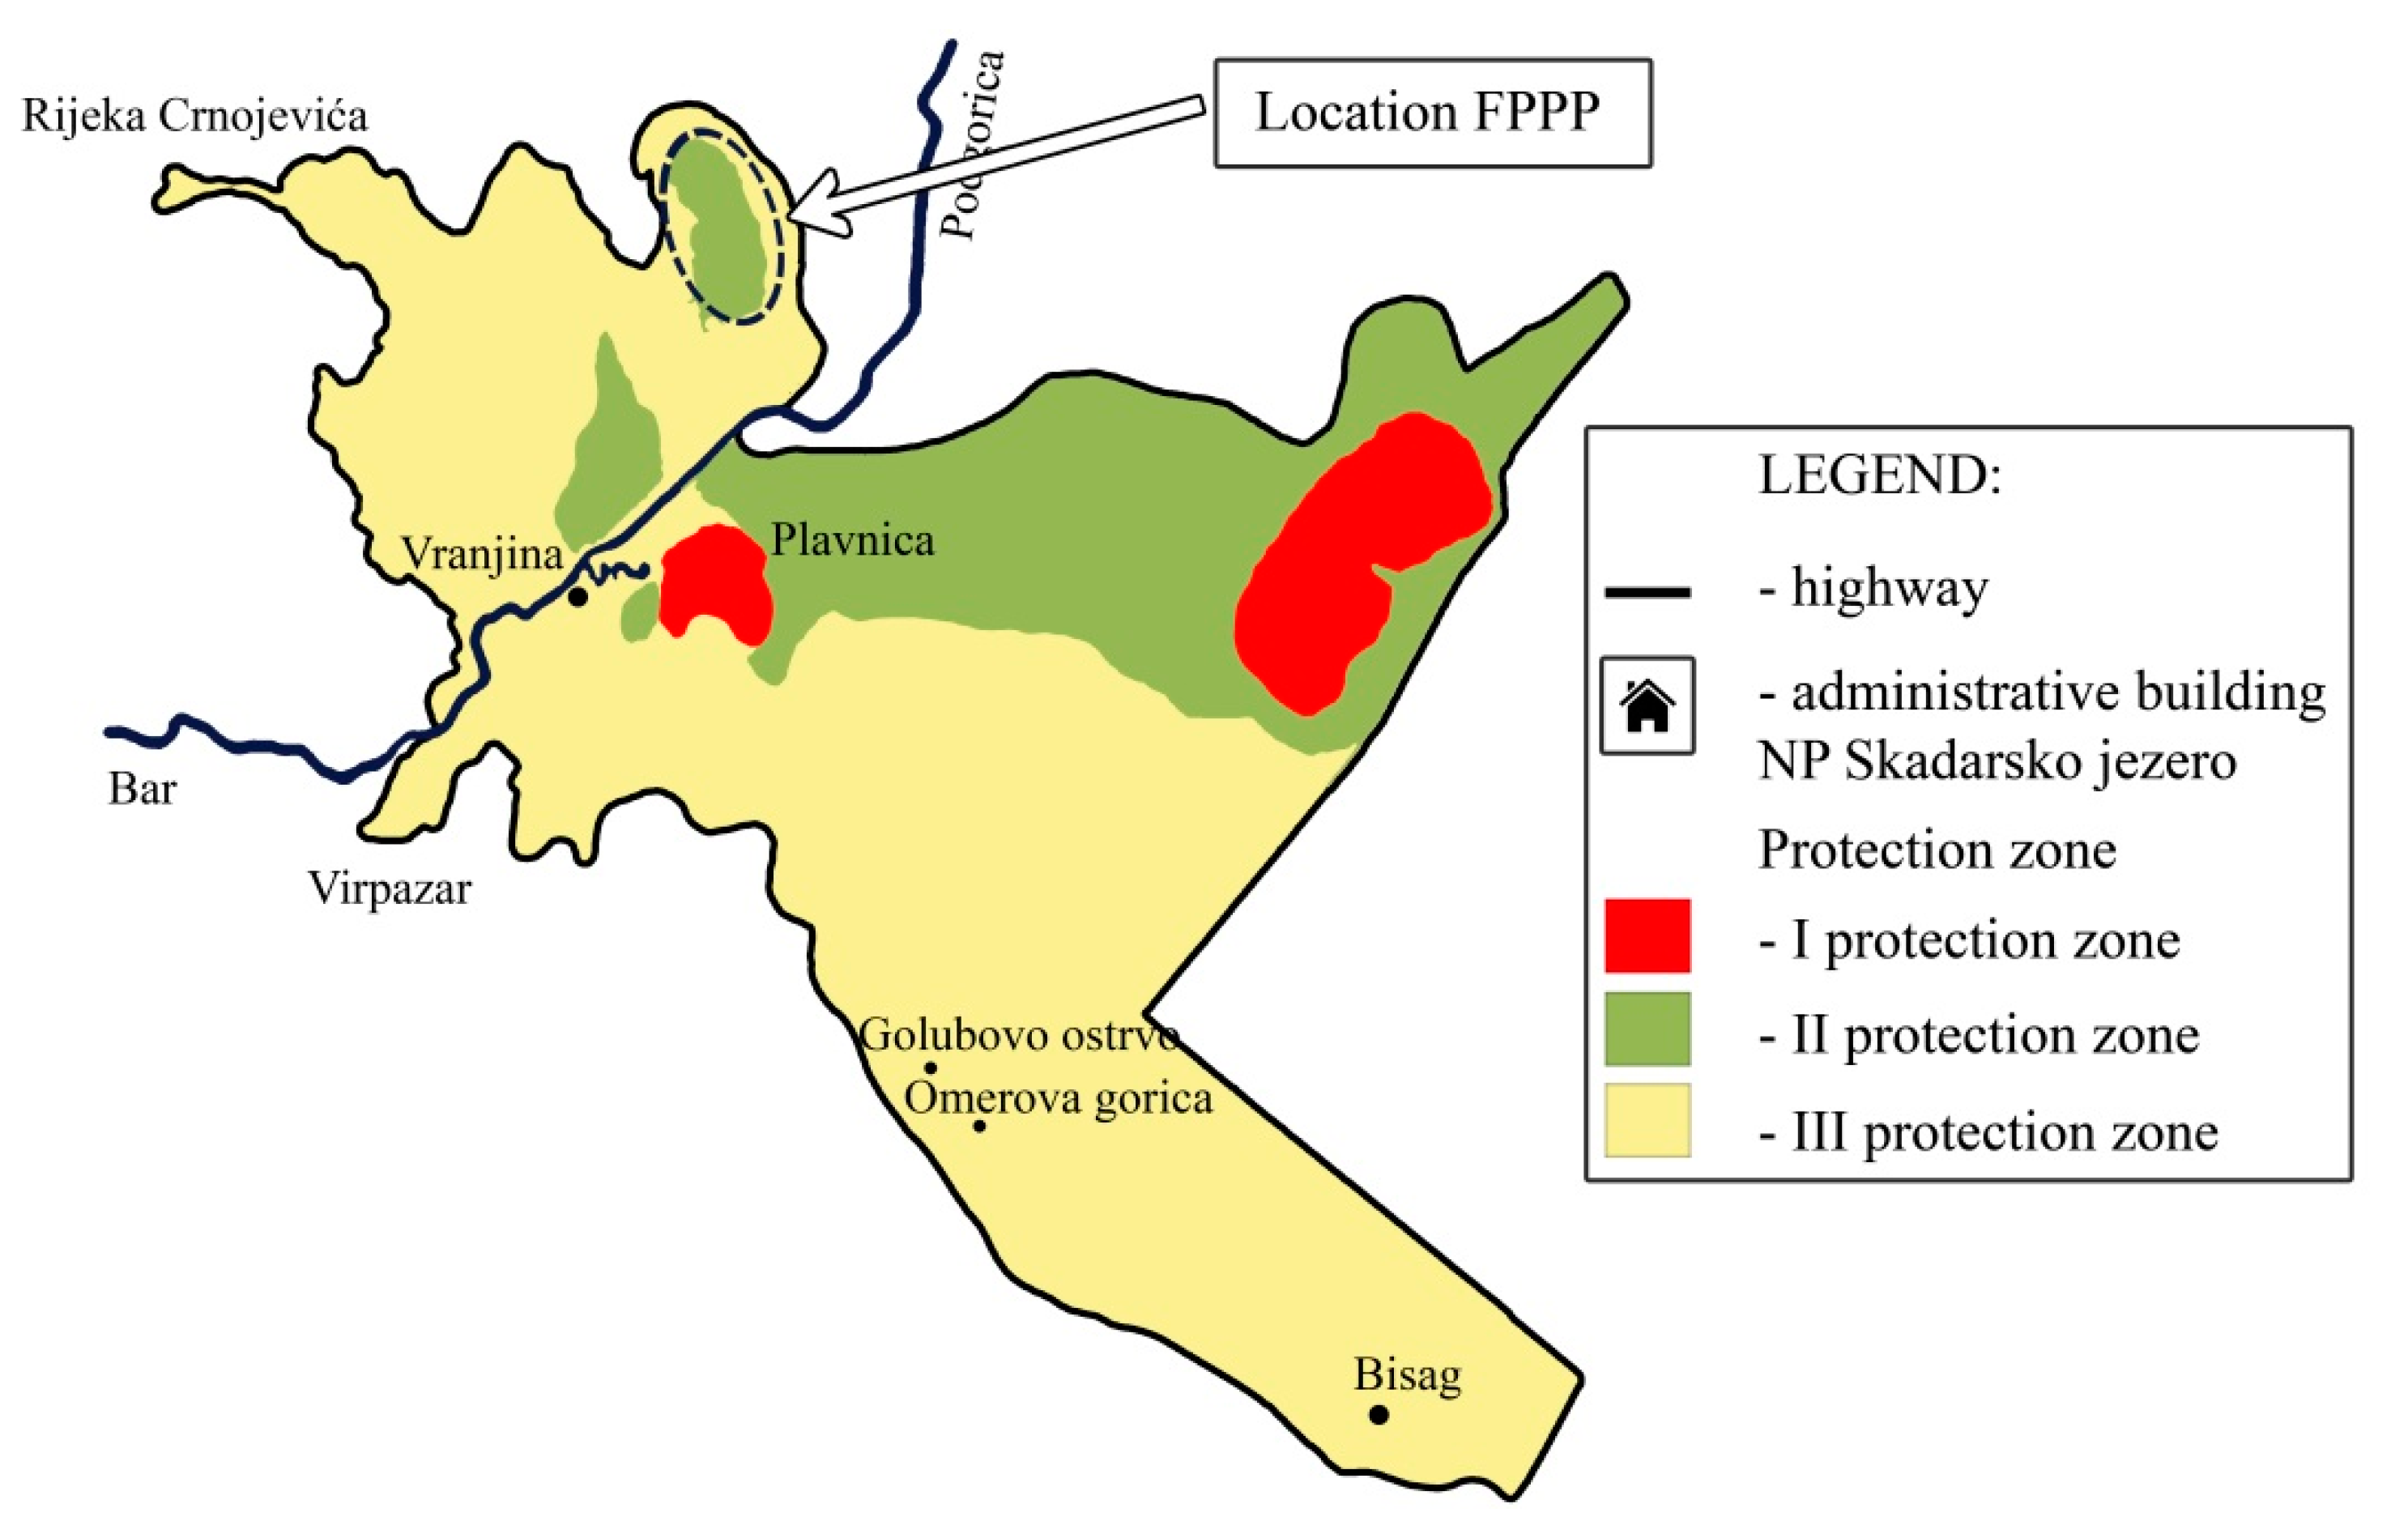
Figure 14.
Reduction of the depth of Skadar Lake due to water evaporation for an average day in each month.
Figure 14.
Reduction of the depth of Skadar Lake due to water evaporation for an average day in each month.
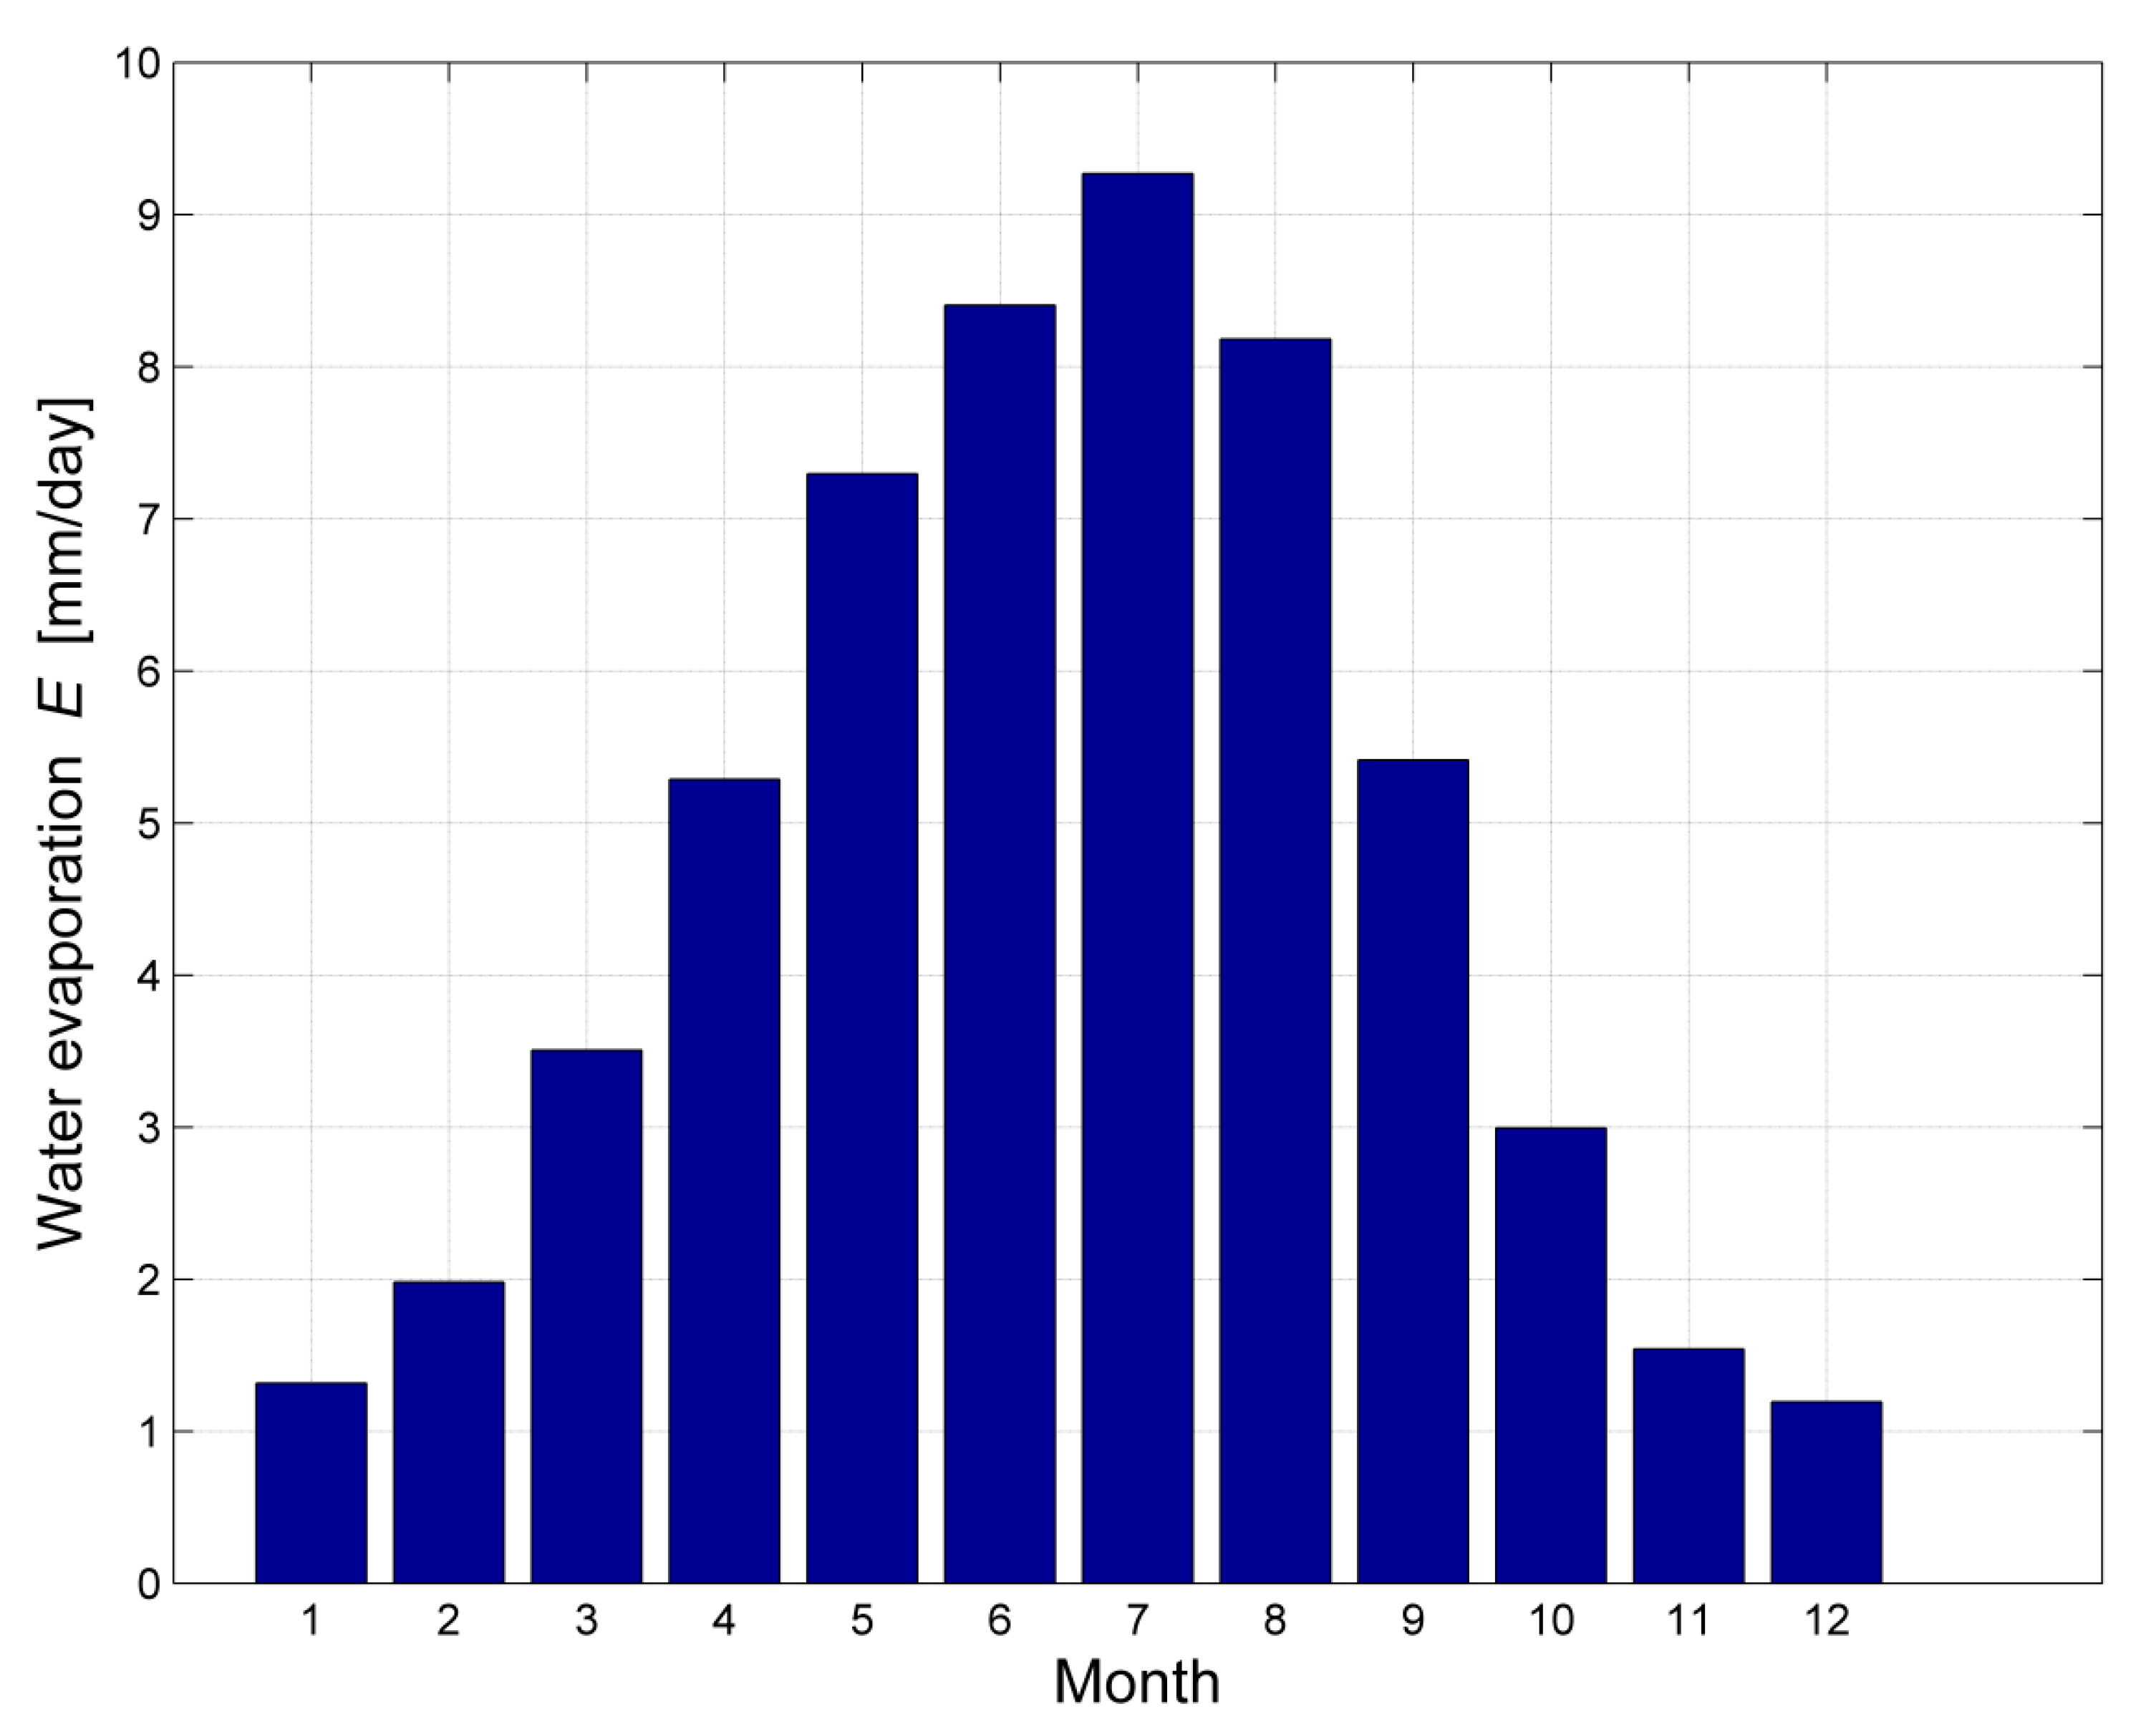
Figure 15.
Monthly reduction of water evaporation at Skadar Lake after building the FPPP.

Table 1.
Horizontal insolation and surface temperature of lake’s water for an average day in each month.
Table 1.
Horizontal insolation and surface temperature of lake’s water for an average day in each month.
| Month | Solar Insolation-Horizontal (kWh/m2/day) | Water Temperature (°C) |
|---|---|---|
| January | 1.80 | 5 |
| February | 2.87 | 8 |
| March | 3.84 | 13.5 |
| April | 5.07 | 15.5 |
| May | 6.47 | 24 |
| June | 7.27 | 26 |
| July | 7.50 | 27 |
| August | 6.71 | 27 |
| September | 5.09 | 20 |
| October | 3.25 | 13.5 |
| November | 2.08 | 11.5 |
| December | 1.64 | 6.5 |
| Annual–Average | 4.47 | 16.45 |
Table 2.
Monthly production and insolation of the FPPP.
| Month | Energy (GWh) | Insolation (kWh/m2/day) |
|---|---|---|
| January | 7.50 | 2.82 |
| February | 10.48 | 4.37 |
| March | 13.65 | 5.15 |
| April | 16.16 | 6.30 |
| May | 19.02 | 7.55 |
| June | 20.82 | 8.71 |
| July | 21.81 | 8.89 |
| August | 20.63 | 8.38 |
| September | 18.26 | 7.32 |
| October | 12.93 | 4.87 |
| November | 9.51 | 3.70 |
| December | 7.53 | 2.84 |
| Total | 178.34 | Annual–Average: 5.91 |
Table 3.
Dependence of a water reflection coefficient on the angle of height of the Sun.
| α | ρ |
|---|---|
| ≥10° | 0.22 |
| ≥20° | 0.12 |
| ≥30° | 0.08 |
| ≥45° | 0.05 |
Table 4.
Comparison of Ground PV, Base FPPP and Proposed FPPP.
| Ground PV Plant | Base FPPP | Proposed FPPP | |
|---|---|---|---|
| Production of energy (GWh) | 141.71 | 145.72 | 186.05 |
| Annual insolation (kWh/m2/day) | 5.02 | 4.66 | 6.17 |
Table 5.
Estimated input parameters for the calculation of IRR.
| Annual Production of a FPPP (GWh) | 186.05 |
|---|---|
| Investment costs (Million€/MWp) | 1.3 |
| O&M costs (Million€/GWh) | 0.01 |
| Exploitation period (year) | 25 |
| Availability of a FPPP (%) | 95 |
Table 6.
Input meteorological parameters and calculated water evaporation from The Skadar Lake for an average day in each month.
Table 6.
Input meteorological parameters and calculated water evaporation from The Skadar Lake for an average day in each month.
| Month | I | II | III | IV | V | VI | VII | VIII | IX | X | XI | XII |
|---|---|---|---|---|---|---|---|---|---|---|---|---|
| TMAX (°C) | 11 | 11.8 | 16.1 | 21.5 | 26.2 | 31 | 34.3 | 34.5 | 28.6 | 22.6 | 16.9 | 11.7 |
| TMIN (°C) | 2.6 | 3.3 | 6.6 | 10.7 | 14.7 | 18.9 | 21.8 | 21.7 | 17.3 | 12.3 | 7.4 | 3.8 |
| RH | 70 | 70 | 64 | 62 | 58 | 54 | 45 | 46 | 57 | 68 | 76 | 73 |
| n (h) | 3.32 | 3.60 | 4.93 | 6.60 | 9.54 | 9.60 | 10.86 | 10.45 | 8.20 | 5.71 | 3.71 | 2.74 |
| V (m/s) | 1.5 | 1.7 | 1.84 | 1.7 | 1.9 | 1.76 | 1.96 | 1.89 | 1.76 | 1.47 | 1.22 | 1.62 |
| E (mm/day) | 1.31 | 1.98 | 3.50 | 5.28 | 7.29 | 8.40 | 9.27 | 8.18 | 5.41 | 2.99 | 1.54 | 1.19 |
© 2017 by the authors. Licensee MDPI, Basel, Switzerland. This article is an open access article distributed under the terms and conditions of the Creative Commons Attribution (CC BY) license (http://creativecommons.org/licenses/by/4.0/).
Share and Cite
MDPI and ACS Style
Durković, V.; Đurišić, Ž. Analysis of the Potential for Use of Floating PV Power Plant on the Skadar Lake for Electricity Supply of Aluminium Plant in Montenegro. Energies 2017, 10, 1505. https://doi.org/10.3390/en10101505
AMA Style
Durković V, Đurišić Ž. Analysis of the Potential for Use of Floating PV Power Plant on the Skadar Lake for Electricity Supply of Aluminium Plant in Montenegro. Energies. 2017; 10(10):1505. https://doi.org/10.3390/en10101505
Chicago/Turabian StyleDurković, Vladan, and Željko Đurišić. 2017. "Analysis of the Potential for Use of Floating PV Power Plant on the Skadar Lake for Electricity Supply of Aluminium Plant in Montenegro" Energies 10, no. 10: 1505. https://doi.org/10.3390/en10101505
Note that from the first issue of 2016, this journal uses article numbers instead of page numbers. See further details here.