Article

Feature Selection for Partial Discharge Severity Assessment in Gas-Insulated Switchgear Based on Minimum Redundancy and Maximum Relevance

1
School of Electrical Engineering, Wuhan University, Wuhan 430072, China
2
Shandong Electric Power Research Institute, State Grid Shandong Electric Power Company, Jinan 250002, China
*
Author to whom correspondence should be addressed.
Energies 2017, 10(10), 1516; https://doi.org/10.3390/en10101516
Submission received: 5 September 2017 / Revised: 22 September 2017 / Accepted: 26 September 2017 / Published: 1 October 2017

Abstract

:
Scientific evaluation of partial discharge (PD) severity in gas-insulation switchgear (GIS) can assist in mastering the insulation condition of in-service GIS. Limited theoretical research on the laws of PD deterioration leads to a finite number of evaluation features extracted and subjective features selected for PD severity assessment. Therefore, this study proposes a minimum-redundancy maximum-relevance (mRMR) algorithm-based feature optimization selection method to realize the scientific and reasonable choice of PD severity features. PD ultra-high frequency data of varying severities are produced by simulating four typical insulation defects in GIS, which are then collected in the lab. A 16-dimension feature set describing PD original characteristics is abstracted in phase-resolved partial discharge (PRPD) mode, and the more informative evaluation feature set characterizing PD severity is further excavated by the mRMR method. Finally, a support vector machine (SVM) algorithm is employed as the classifier for intelligent evaluation to compare the evaluation effects of PD severity between the feature set selected by mRMR and the feature set is composed of discharge times, amplitude value, and time intervals obtained traditionally based on discharge change theory. The proposed comparison test showed the effectiveness of the mRMR method in informative feature selection and the accuracy of PD severity assessment for all defined defects.

1. Introduction

With the advantages of small floor space and high reliability, gas-insulation switchgear (GIS) is outfitted in the power grid in large numbers and has already become a symbolic piece of equipment in power transmission and transformation system [1,2,3,4,5]. However, the internal latent defects caused by electricity, heat, and machinery action, as well as human factors in running GIS equipment, may result in equipment failure, or even induce large-area power failure accidents. Thus, monitoring insulation and evaluating its condition for GIS equipment bear practical importance.
In monitoring the condition of SF6 gas-insulated equipment, the PD signal is the most effective evaluation information for interior insulation condition in GIS [6,7]. However, the project site requires accurate collection of PD signals and extraction of feature information that can accurately reflect the severity of insulation defects from PD signal. With these steps, the insulation deterioration status of GIS equipment can be mastered and the health condition of GIS equipment can be evaluated effectively.
Currently, studies on PD severity assessment mainly focus on experimental and theoretical research. In [8], the study simulated and obtained ultra-high frequency (UHF) signals with different PD severity states with typical defects to analyze the relation between the UHF signal and discharge capacity based on discharge theory. In [9], the researcher emphatically focused on PD development under free metal particle defects and found a strong correlation of the maximal discharge capacity characterizing the severity with the number and position of free metal particles. In [10], PD development under the insulation defect of surface filth for GIS insulators was simulated to identify the PD development of this defect. The process goes through three stages of corona discharge, coexistence of corona discharge, and streamer discharge along the surface, followed by a PD severity assessment by the dint of the discharge phase distribution and pattern characteristics of several statistical spectrograms.
The invigorative result [8,9,10,11,12] in the current research mainly looks into the rules and conditions of PD deterioration. In the area of PD severity assessment, only basic parameters, such as discharge times, amplitude value, and phase, are adopted to describe PD severity characteristics for evaluation, with the evaluation effect far from satisfying power operation companies. Thus, the key problem that remains for this field is how to select more comprehensive and reasonable evaluation features and enable the effective evaluation of PD severity.
The minimum-redundancy maximum-relevance (mRMR) standard was first proposed by Peng Hanchuan [13] and this standard obtains the optimal feature set by mining the correlation among the origin features and the correlation between features and target category. This method is widely recognized in application domains, such as artificial intelligence (AI) algorithms [14], medical disease diagnosis [15], bioengineering [16], and electric engineering [17]. The method has become a much focused classic in the feature selection area given its effectiveness. This mRMR centers on the obtained data in terms of statistical analysis, which can extract more feature information than the simple theoretical analysis for PD severity assessment [11,12], and it cares more about the raw information extraction, but not a higher recognition rate classifier [18,19]. Furthermore, in contrast to the kernel principal component analysis (KPCA) [20,21] for feature extraction, the mRMR selects features from the original feature set without changing the feature’s original expression and it maintains the meaning of the original features very well for effective understanding in practical engineering applications.
This study centers on the feature selection for PD severity assessment. In conjunction with on-line monitoring and fault diagnosis techniques of HV electrical equipment, the paper simulates four kinds of typical insulation defects within GIS equipment in the lab, adopting a step-voltage method to simulate the PD development process, and collected the corresponding PD information to structure the feature set under the phase-resolved partial discharge (PRPD) mode. The standard of mRMR is first introduced to objectively analyze the PRPD feature set from the correlation of the collected data to obtain the optimal evaluation feature set for PD severity assessment. PD severity is defined as four states, namely, normal, attention, serious, and dangerous. With a support vector machine (SVM) as the PD severity state classifier, the evaluation effects of the PD severity assessment feature set based on theoretical analysis and the optimal evaluation features set from the mRMR algorithm are compared. The test result verifies the effectiveness of the proposed method.

2. Experiment

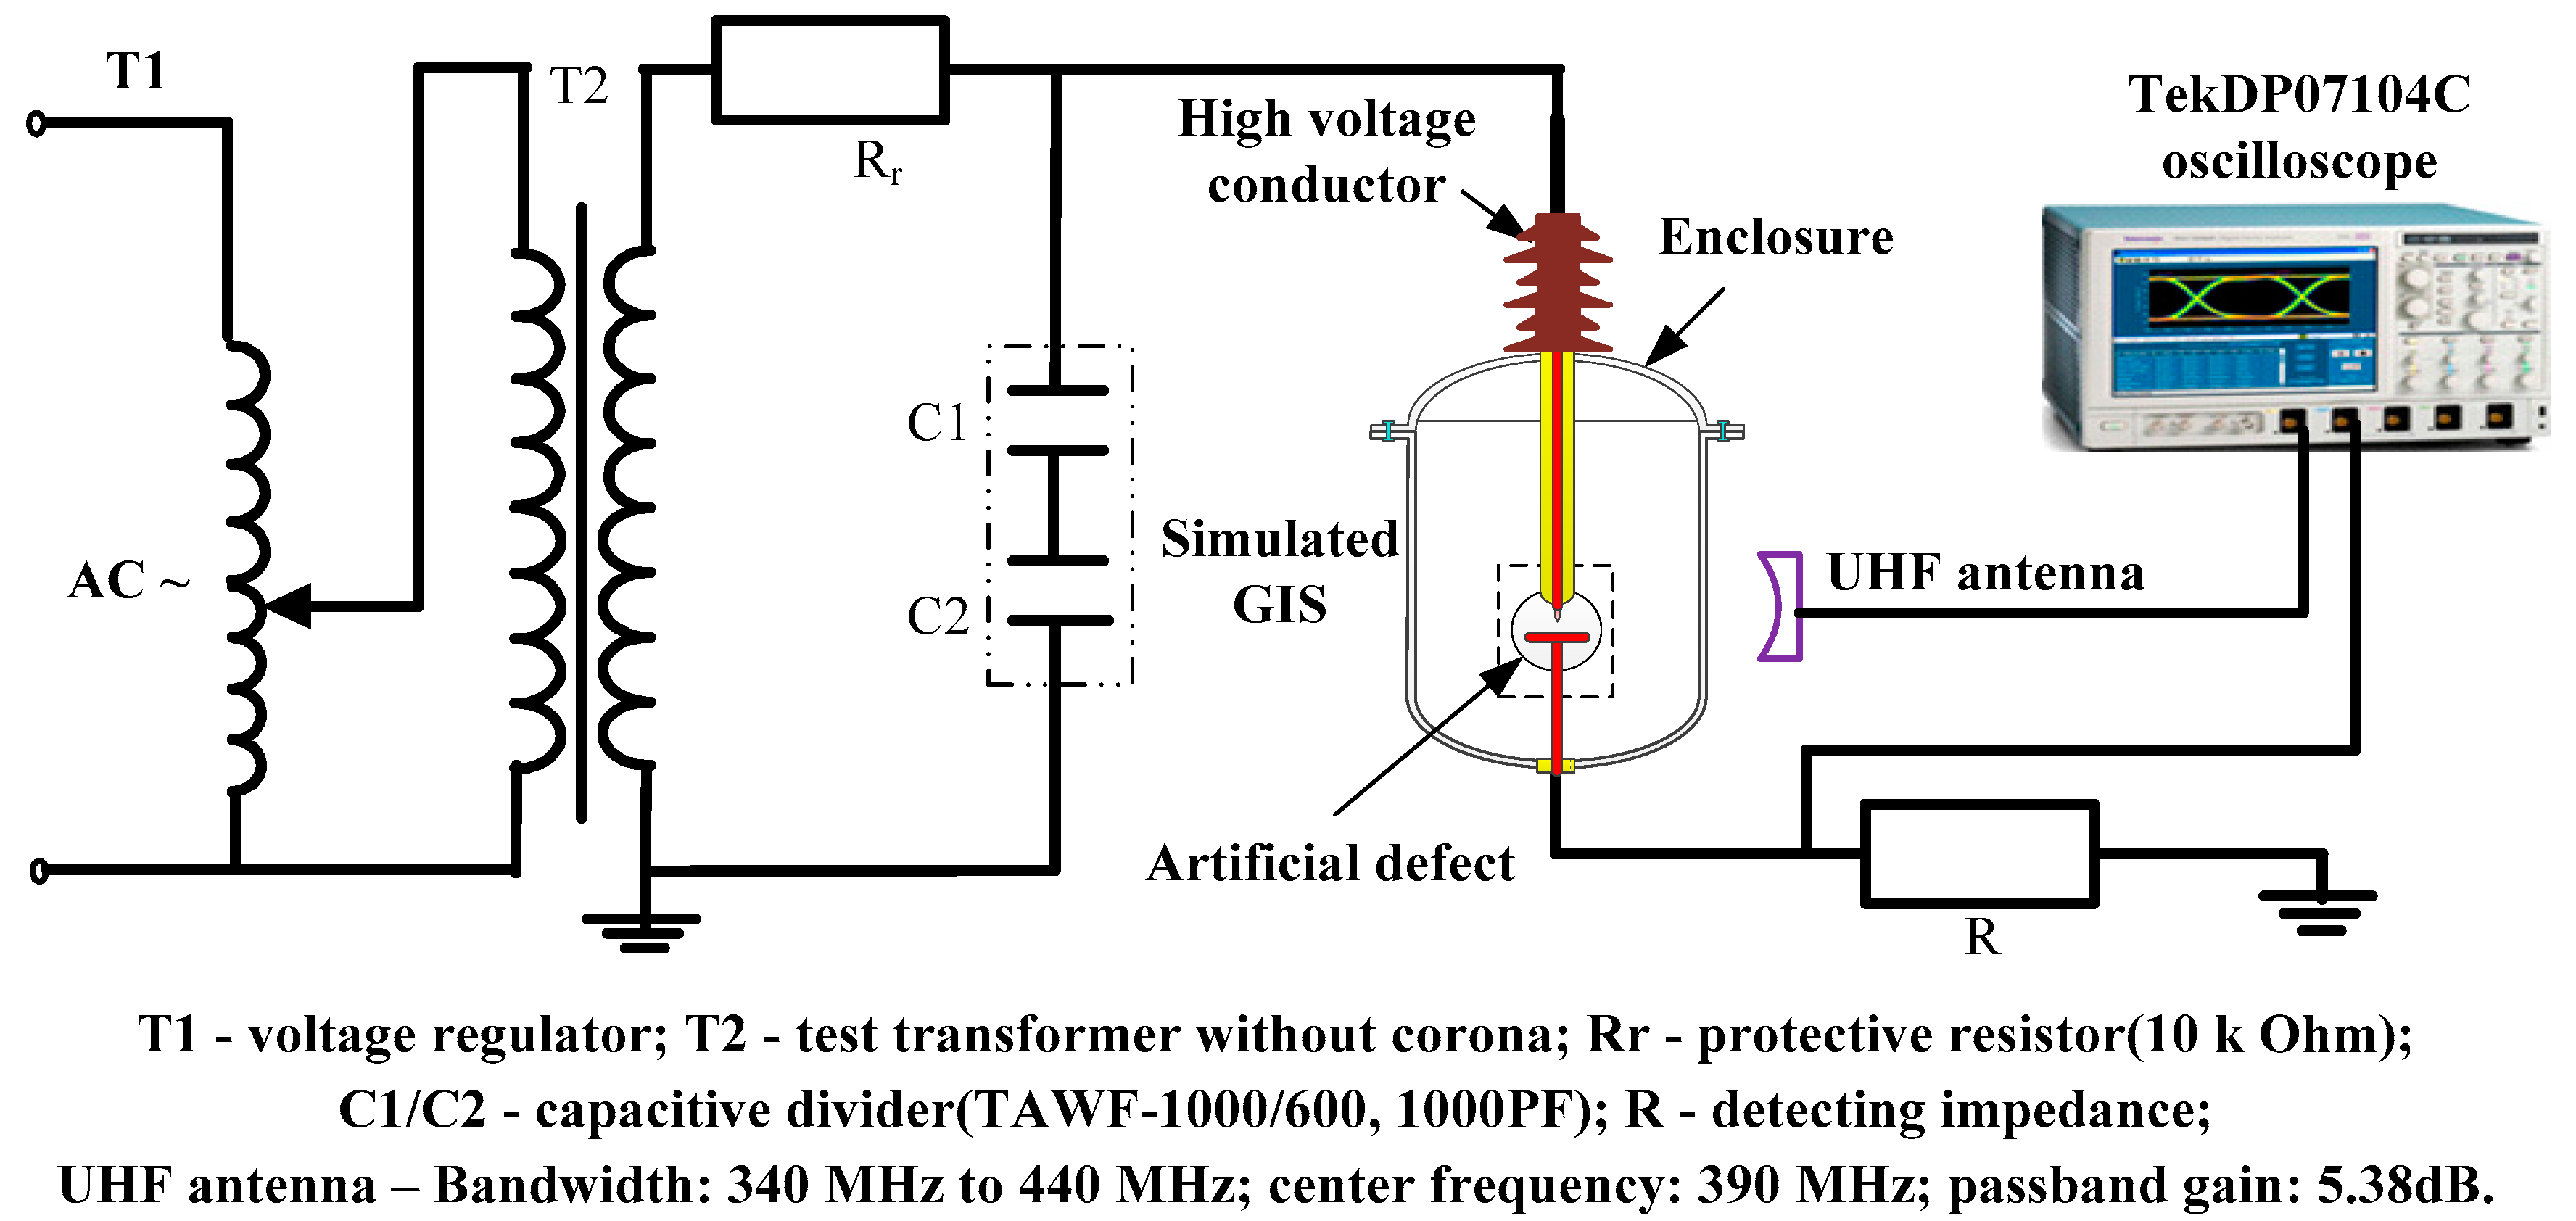
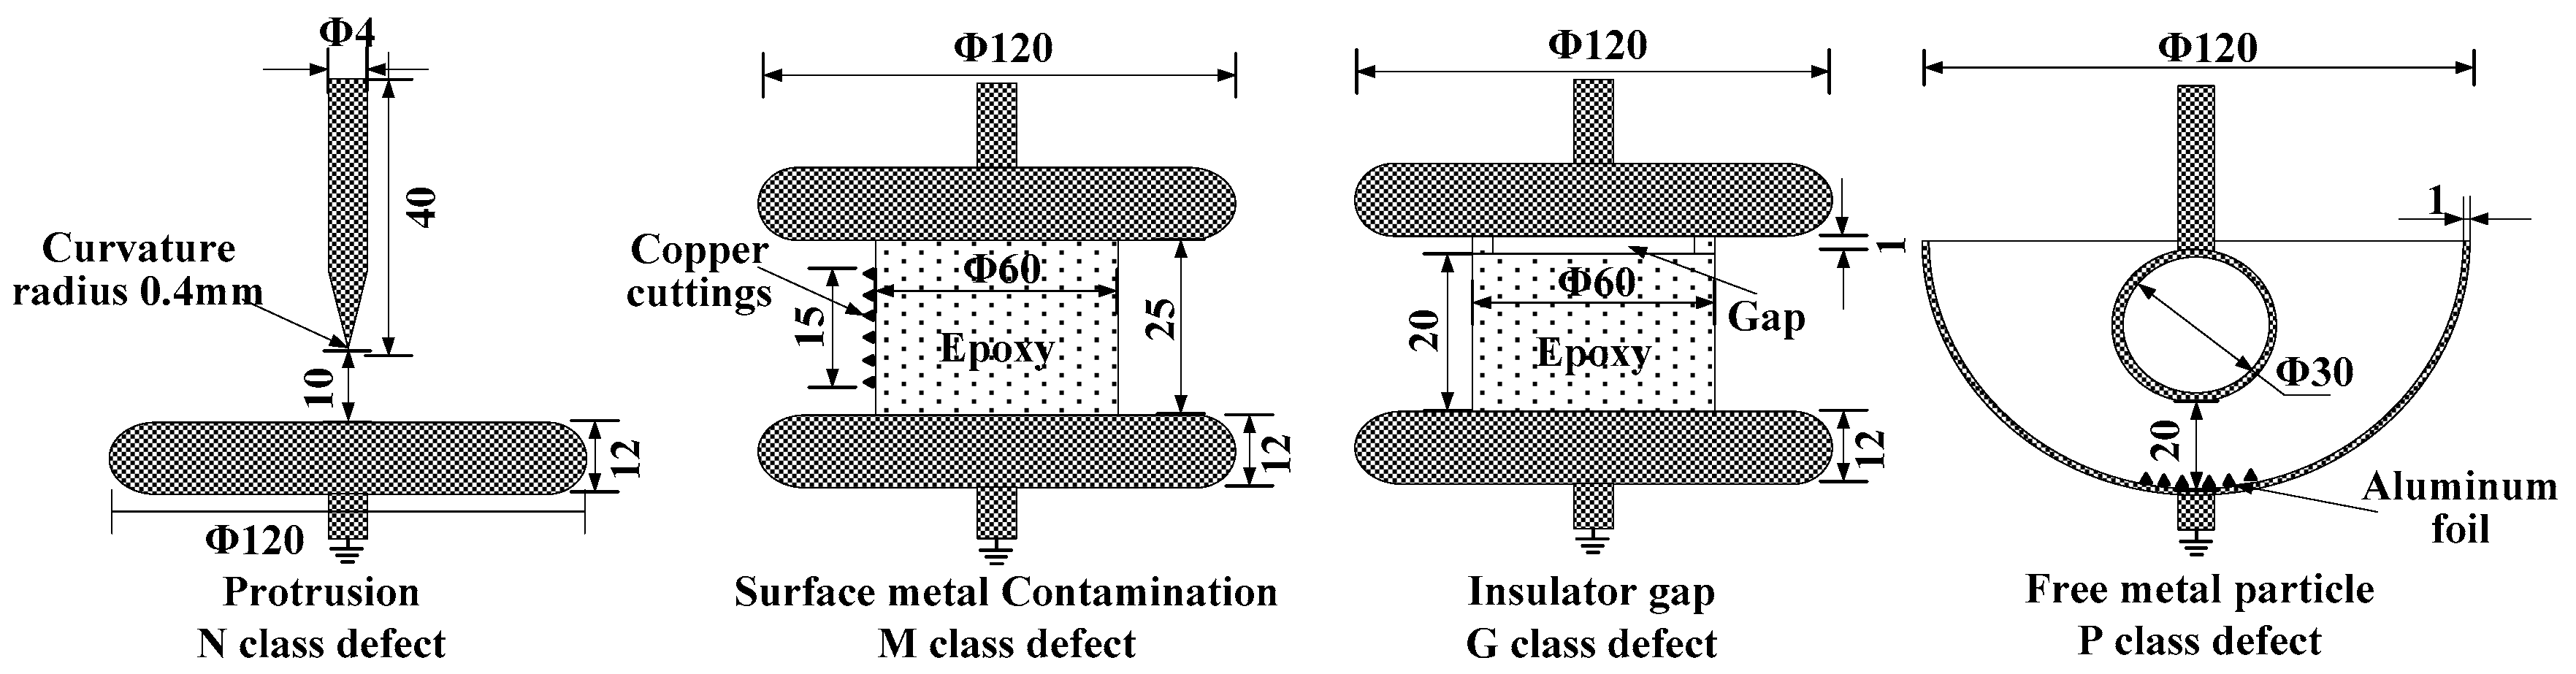
2.1. Experimental Implementation and Method

Figure 1 shows the experimental setup. The most widely applied monitoring technology in GIS equipment, namely, ultra-high frequency monitoring, was adopted to obtain the PD signal. The PD signals were acquired with a microstrip antenna (bandwidth: 340 to 440 MHz; center frequency: 390 MHz) through the dielectric window on the simulated GIS and then transmitted to a digital oscilloscope (analog bandwidth: 1 GHz; maximum sampling rate: 20 GS/s; memory depth: 48 MB) via coaxial cable (wave impedance: 50 ohm) to store the original PD information. The power frequency reference voltage phase signal was obtained while PD signals were collected. The defects were incorporated into the simulated GIS, which was filled with 0.4 MPa of SF6 gas.
The experiment simulated the PD development by externally applying step voltage to four kinds of typical artificial insulation defects (hereafter referred to as N defect, P defect, G defect, and M defect) in GIS [22], as shown in Figure 2.
The applied voltage shown in Table 1 increased gradually from the initial discharge stage to the discharge stage close to breakdown or at breakdown. In the test, the applied voltage process was repeated thrice. This setting was adopted to explore the discharge variation law by increasing the applied voltage by approximately 1.5 kV every 2 h, and 2000 samples were obtained for each voltage value in each defect.

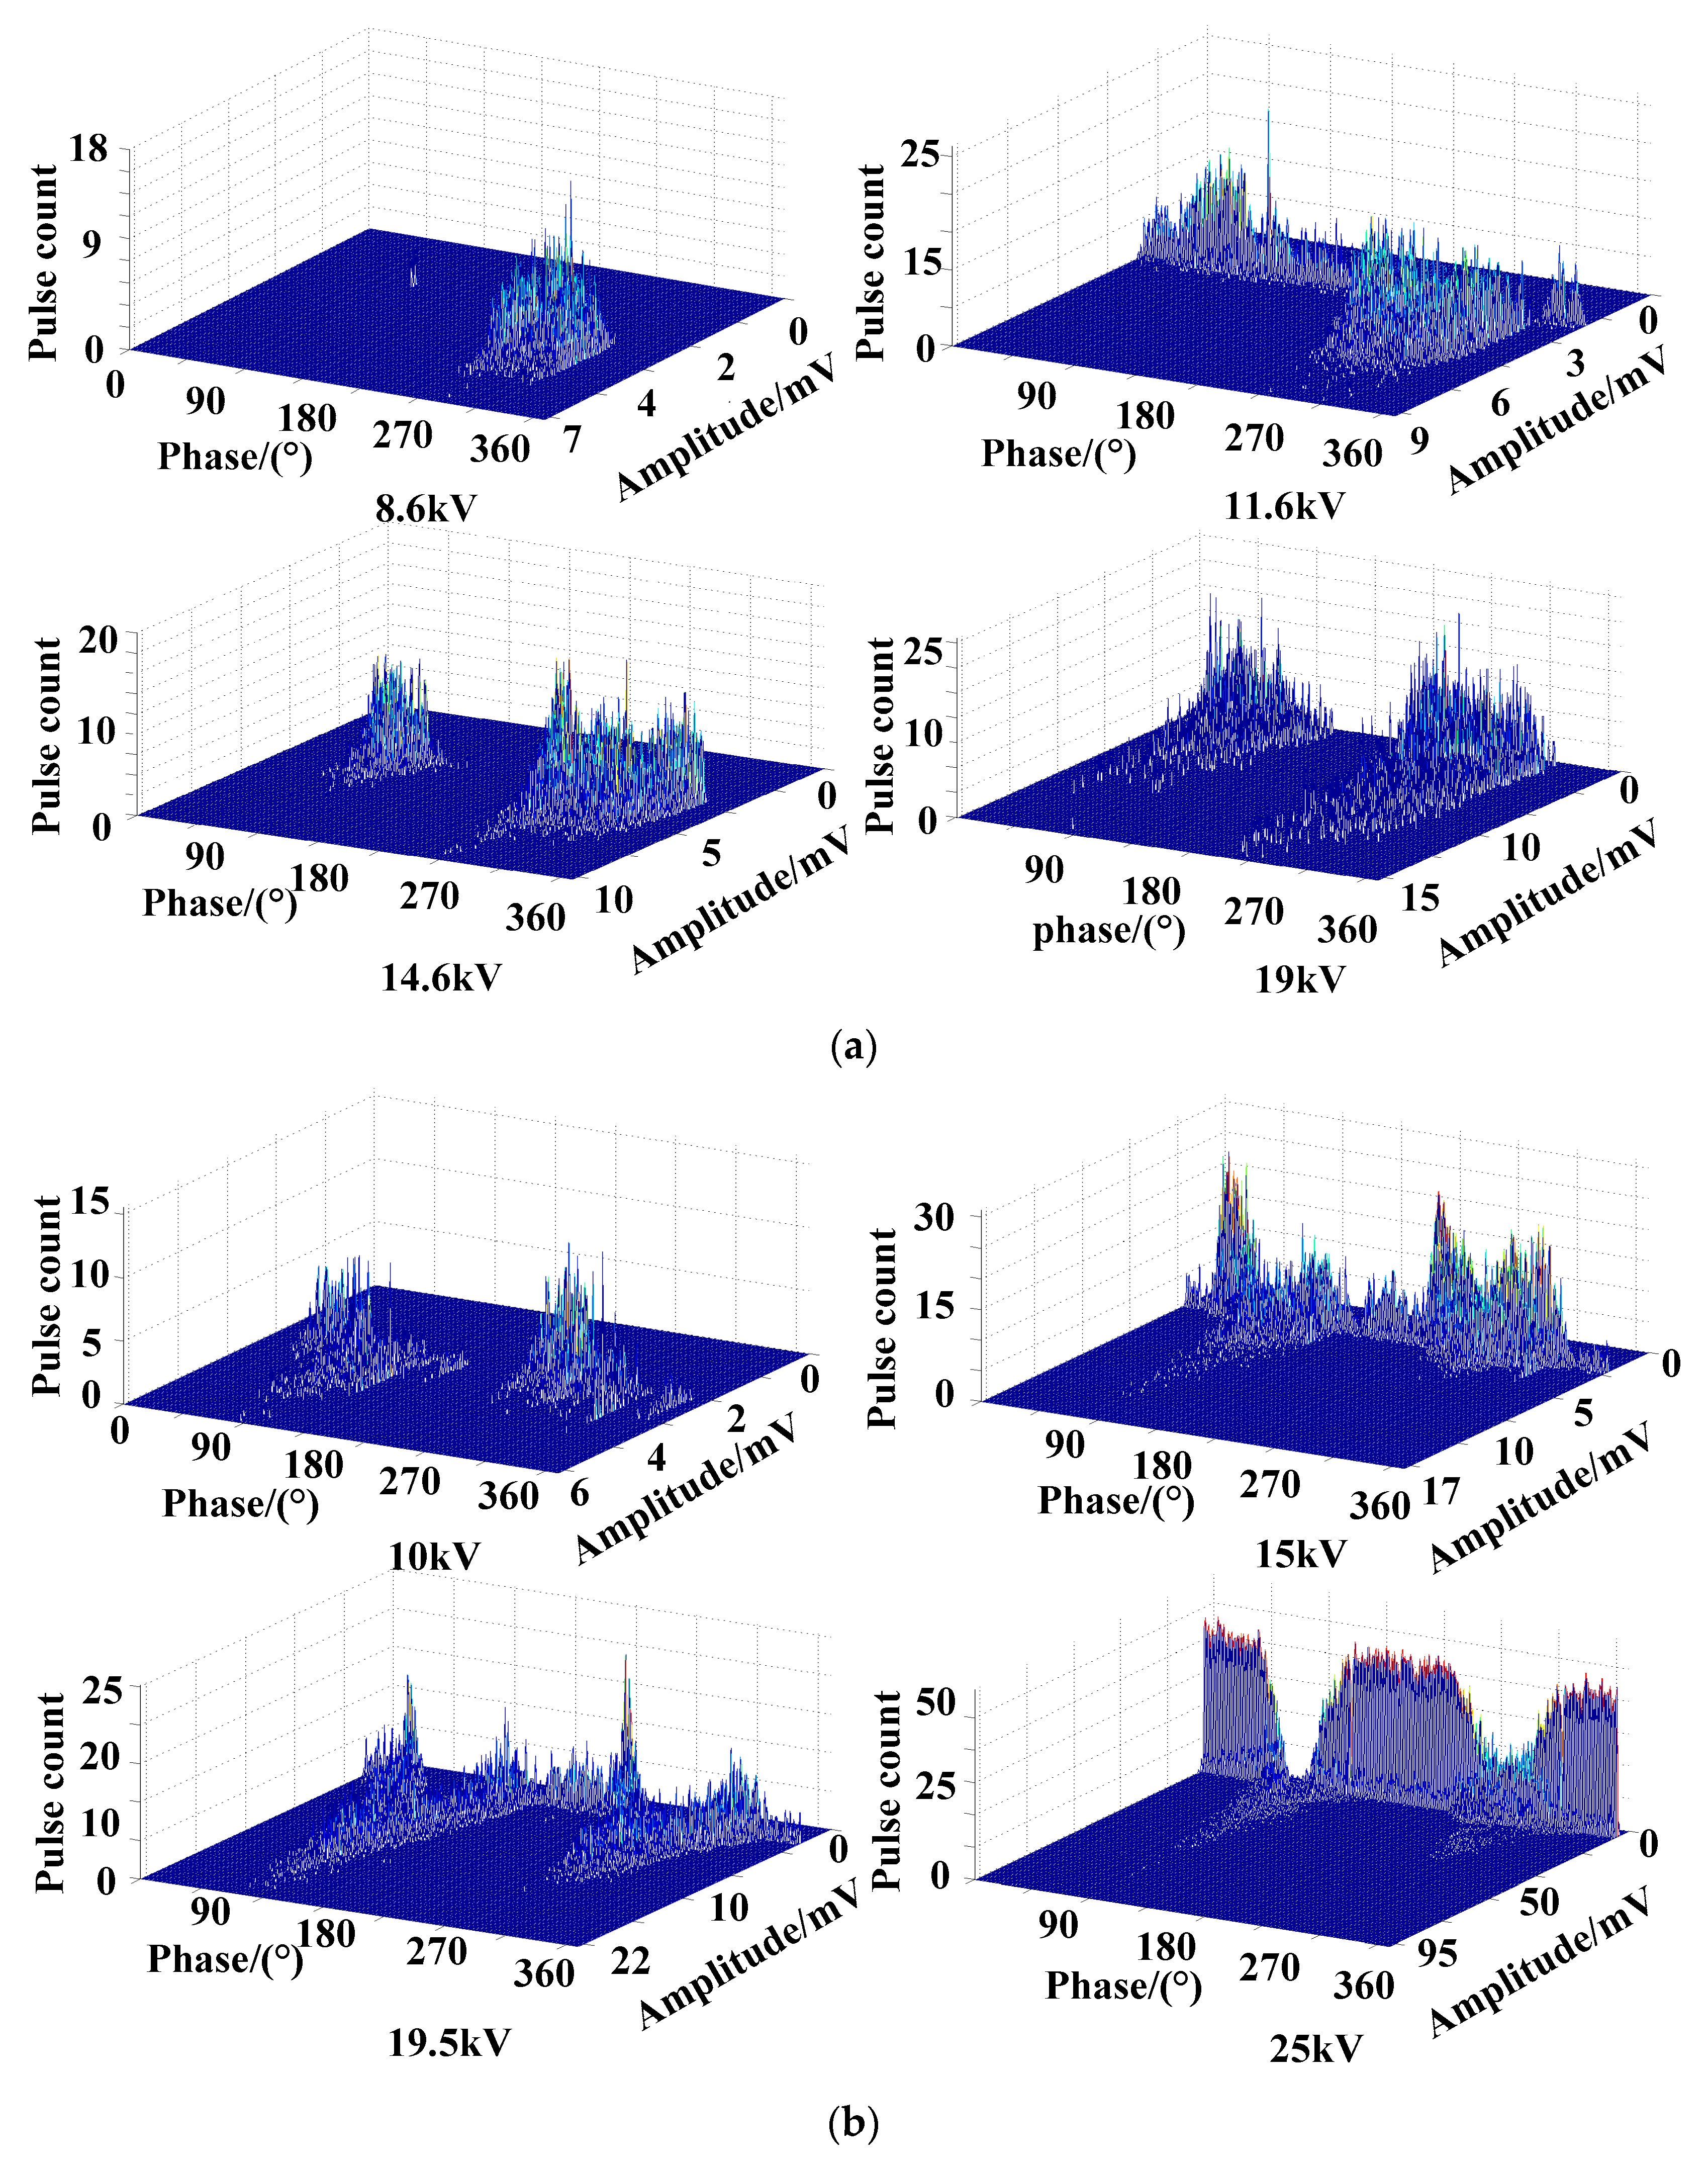
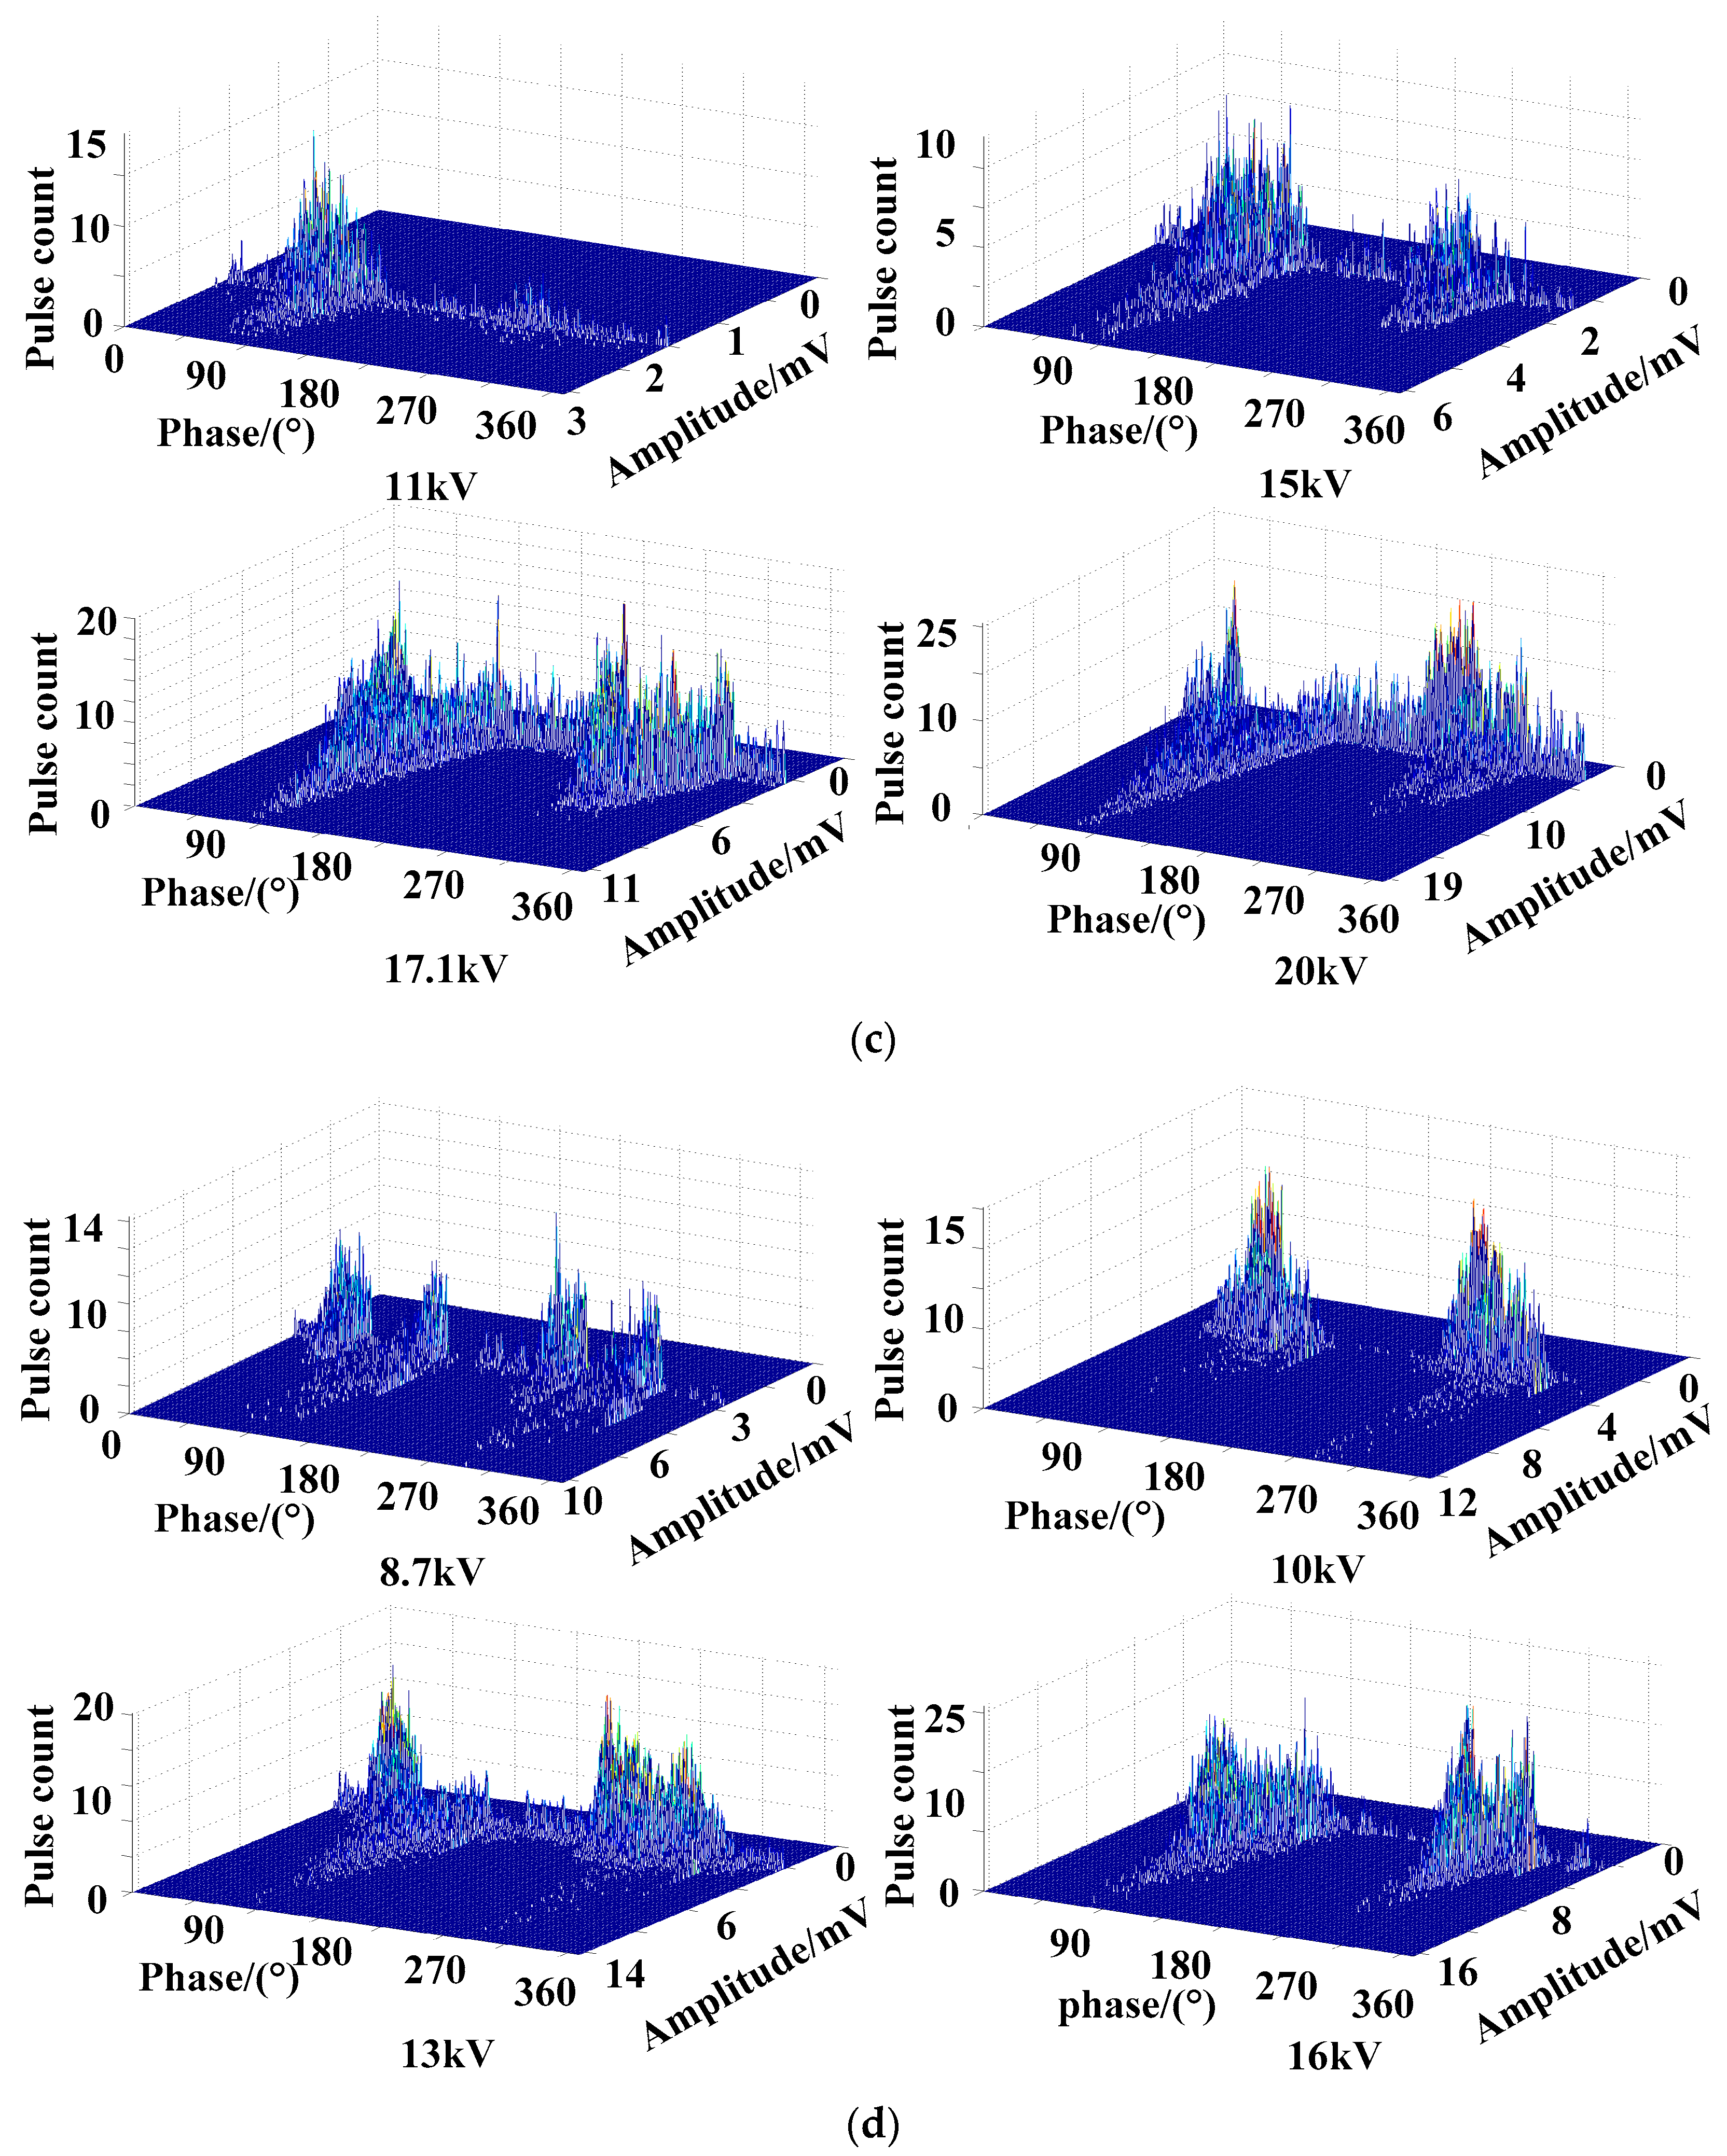
2.2. PD Data Acquisition and Analysis

Presently, scholars [4,7,23] suggested adopting the PRPD mode for feature extraction to abstract PD information, namely the mode of analyzing UHF PD signals by gathering statistics of the fluctuation distribution characteristics of the discharge pulse count n and discharge charge magnitude q with the power frequency phase angle φ. To guarantee the reliability of PD development law research and discharge severity evaluation, this study collected a large number of discharge waveforms in the power frequency cycle and then structured the φ-u-n three-dimensional distribution under four typical defects. In this study, discharge pulse count n represents the number of PD pulses per cycle, and the discharge amplitude u replaces the discharge charge magnitude q [23]. Given that collected PD data in this test are too large, only 50 groups of PD data under four voltage classes with relatively large spans for applied voltage were selected for each kind of defect to display its 3D PD-pattern, as shown in Figure 3.
For the same kind of defects, the outlines of 3D PD-pattern in different PD severity levels were made for comparison. The PD pulse amplitude value, pulse count, and the phase interval showed a certain linear variation trend. Thus, we can evaluate the PD severity by mining related differences of the change fluctuation rule [24].
For different kinds of defects, the 3D PD-patterns along with PD development were compared. The discharge times, amplitude value, and phase of the four types of defects exhibit their own characteristics.
The above analysis shows that the features, such as discharge amplitude, number of times, and phase, can characterize the PD deterioration rule. In characterizing PD severity, the significance levels of different features under the four types of defects are not identical. Thus, objectivity is necessary in choosing evaluation features in structuring the PD severity assessment feature set.
(1)
In the N defect, the development is observed from almost no discharge to discharge and finally being close to discharge intensity of negative half cycle with PD deterioration in the positive half cycle. This step indicates using a change of discharge position to differentiate PD severity of the N defect, which is more advantageous than the three other kinds of defects.
(2)
The discharge amplitude fluctuation in the G defect is significant, and this feature information is more obvious in G than that in the three other kinds of defects.
(3)
Discharge times, amplitude, and position of the P and M defects do not change significantly, like the N and G defects, during PD development. Compared with the M defect, the change of the aforementioned characteristics is less obvious for the P defect.

3. Statistical Features for PD Development

3.1. Statistical Features under the PRPD Mode

The PRPD mode characterizes the original PD information by describing the 3D PD-pattern outline composed of the PD phase, discharge charge magnitude, and discharge times. Effectiveness is generally recognized in condition monitoring of GIS equipment [23]. The statistical feature descriptions on this mode are arranged in Table 2.

3.2. PD Severity Assessment Features Based on Theoretical Study

In [24], the characteristics of φ-u and φ-n distribution are described under different discharge voltages under the N defect based on UHF PD data, and structure the 9D feature set Fs according to the theoretical analysis. Table 3 explains the concrete meaning of features. This feature set structures a relatively perfect characteristic parameter set for PD severity assessment from a theoretical point of view.

3.3. Definition of PD Severity Stage

Currently, a uniform division standard is lacking for PD severity in GIS equipment. Instead, most research divides the PD severity states artificially according to the actual condition of the equipment [16,17]. The study borrows ideas from evaluation theory of the transformer state [17] and, at the same time, combines the actual running state of GIS equipment and the characteristics shown in the PD development. Then, PD severity is classified into four levels of H1: normal state, H2: notice state, H3: abnormal state, and H4: danger state, which are shown in Table 4. The description in Table 4 on the φ-u-n distribution in different voltage classes under N defects in Figure 3a shows that the change and development trend of four PD states corresponding to the statistical features rise with the voltage grade. Each PD level shows a certain difference, which proves the phase division reasonableness of PD [24].

4. Feature Selection Based on the mRMR Method

Although the 16D feature set extracted by the traditional PRPD pattern can fully characterize the contour information from the original spectrum, this 16D feature set continues to indicate characteristic information redundancy in PD severity recognition. In addition, features extracted from the theoretical analysis in Table 3 can relatively reflect the development trend of PD severity, but the feature set must be further expanded given that PD severity theory is imperfect. Therefore, this study introduces the mRMR algorithm to unearth the feature set data under PRPD mode in all kinds of defects and eliminate redundant information. Consequently, the optimal evaluation feature set can be obtained to realize the efficient evaluation of PD severity.

4.1. mRMR Principle

Mutual information is the theoretical definition in the correlation and redundancy calculation in mRMR algorithm. Given two random variables, x and y , and their probability density and joint probability density are defined as p ( x ) , p ( y ) , p ( x , y ) , then the mutual information formula between the two variables can be defined as [13,25]:
I ( x , y ) = p ( x , y ) p ( x , y ) p ( x ) p ( y ) d x d y
Maximum relevance criterion requires that the selected feature set has the greatest dependency on the target category, and it is expressed as follows:
maxD ( S , c ) ,   D = 1 | S | f i S I ( f i , c )
where S denotes the feature set, | S | is the size of feature set, f i is the ith feature, and c is the target value (e.g., the PD severity levels).
Minimal redundancy criterion requires that the correlation between all the features be minimized to ensure the least redundancy information. The corresponding metric is defined by minimizing mutual information between the features:
minR ( S ) ,   R = 1 | S | 2 f i , f j S I ( f i , f j )
where f i and f j respectively stand for the ith and jth features.
The mRMR algorithm combines the maximum correlation and minimum redundancy criteria, and then defines the two operators, Φ 1 and Φ 2 , as shown in Equation (4). These operators are named as mutual information difference (MID) and mutual information quotient (MIQ), respectively, to guide the selection of the optimal feature set theoretical analysis [14]:
{ m a x Φ 1 ( S , c ) , Φ 1 = D R m a x Φ 2 ( S , c ) , Φ 2 = D R
In this study, the proposed algorithm attempts to realize the optimal feature set S m selection according to the maximum correlation and minimum redundancy principle. The assumption is that optimal feature set S m 1 composed of the m−1 feature has been obtained and the mth feature can be searched by Equation (5):
{ m a x M I D , M I D = max { I ( f i , c ) 1 m 1 f i S m 1 I ( f i , f j ) } m a x M I Q , M I Q = max { I ( f i , c ) / 1 m 1 f i S m 1 I ( f i , f j ) }
where f j is one feature in the primitive feature set that does not belong to S m 1 .

4.2. PD Severity Assessment Feature Selection Model Designs

Based on the principle of mRMR algorithm, in this paper, the detailed process of the optimal evaluation feature selection for PD severity assessment is as follows:
  • Original PD database construction. Based on the analysis of the 3D PD-pattern and the characteristics of the four types of defects in Table 1, the PD severity state of the four typical defects are summarized in Table 5. From the information, we can extract the corresponding dataset of the four defined states for the four defined defects.
    To remove the physical unit interference of the extracted features, based on quantitative analysis, the data of all the features are normalized to [0, 1]. The following normalized preprocessing method is adopted:
    x i * = x i x m i n x m a x x m i n   ( i = 1 , 2 , )
    where, x i and x i * are the original signal and the normalized signal, respectively, and x m a x and x m i n represent the minimum and maximum values of the input signal, respectively.
  • Disposal of feature data discretization. The extraction features in this paper are continuous variables and, thus, require discrete processing. The normalized feature data are divided into different intervals to achieve the discretization of the continuous quantity [25].
  • PRPD features set construction. The process of the collected original PD data is based on statistical formulas in PRPD [23] mode and building of the PRPD feature set.
  • Optimal feature set selection: The size of optimal feature set is defined, and MID and MIQ search rules are used to obtain the optimal feature set and feature sort number of each defect, respectively.
  • Evaluation effect test: The classifier and the ratio of sample training set and test set, which are suitable for the research, need to be chosen before the test. Then, the optimal feature set is defined as the input of the chosen classifier for recognizing the PD severity state.
In addition, the feature set constructed by the theoretical analysis in Table 3 is used as a comparison in the test. Validity of the feature selection method can then be verified.
Artificial neural network [20,21] and SVM [26] are the most mature algorithms in pattern recognition. The SVM basic principle is to find a hyper plane in the feature space of data composition so that different types of training samples are located on both sides of the hyper plane. A large number of PD pattern recognition applications of the SVM algorithm prove the superior performance of the algorithm. In this study [26,27], SVM is directly selected as the classification method for PD severity assessment.

5. PD Severity Assessment Test

5.1. PD Severity Assessment Feature Selection Model Designs

The PRPD statistical feature extraction was performed according to the original PD database construction process proposed in Section 4.2. The 800 original feature set samples, that is, an 800 × 16 data matrix, are constructed for each type of defect. Then, the label vector matrix corresponding to the PD severity state of the 800 × 16 sample data is formed.
To evaluate the merits of the feature set in different views, the size of optimal feature set m is defined as 8–16, respectively, and optimal results are obtained by MID and MIQ search rules. Table 6 presents the optimal evaluation feature set in descending order mode corresponding to the N defect, where feature sorting is determined in the order shown in Table 6.
The results in Table 6 in the case of N-type defects show that when the optimal feature set size m is 16 (the size of original feature sets), the rankings of all the features are calculated by MIQ and MID search strategies, and the rankings of the best features selected by the MIQ and MID algorithms are roughly the same. When the feature size m is 8–15, the result of the calculation of the optimal features is the first m feature in the 16D optimal feature ordering.
In the calculation of the other three defects, the results indicate the ordering rule in different optimal feature set size of the M, G, and P defects is the same as that of the N defect. Therefore, Table 7 only shows the ranking of the optimal feature set when the feature size is 16 in the M, G, and P defects.
According to the results in Table 7, prioritization for the same feature in each defect is significantly different. For example, the optimal features of the N-type defect are numbers 1 and 16, indicating the dramatic change of the discharge times and amplitude in positive and negative discharge cycles. This result is confirmed by the obvious change of the 3D PD-pattern of the N defect in the positive half-cycle discharge, as PD severity deepened in Section 2.2. The first two features, that is, numbers 13 and 9 of the G defect, indicate that the steepness and the skewness of the discharge amplitude and times of the whole positive and negative half-cycles are the most important. This result confirms that the number of discharge times and amplitude of the G defect are larger during the entire PD deterioration in Section 2.2.
The most previous features of numbers 14, 5, and 16 of the M defect type show that the features that can reflect the difference between the positive and negative discharge half-cycle can highlight PD deterioration. The optimal features of numbers 16, 5, and 3 of the P defect type show that the changes of discharge times and amplitude can better distinguish PD degradation under the P-type defect than other defects. In addition, the results of the optimal feature ordering in M and P defects indicate that the rules hidden in the PD data, which cannot be found with simple statistical analysis, are captured by the data analysis-based mRMR method, which is helpful to further understand the law of PD deterioration.
The above results show that the mRMR algorithm extracts the important feature information corresponding to all kinds of defects from the data level. The mRMR method can analyze the φ-u-n distribution objectively and reasonably. The above analysis is conducive to the scientific assessment of PD severity.

5.2. PD Severity Evaluation Effect Test Based on mRMR Method

In this study, the optimal feature set of four types of defects selected by mRMR algorithm was deemed as the input vector of the SVM classifier. For each type of defect, the test selected 600 groups of training samples and 200 groups of test samples to analyze the evaluation effect of each feature set for PD severity. Hereinto, the accuracy rate of the PD severity assessment is defined as the ratio of the samples evaluated accurately to the total test samples.
The SVM classification effects of the optimal input features set selected by MID and MIQ search strategies and the features set in the original sequence number in Table 2 (hereinafter referred to as OS), namely the features 1–16, are shown in Figure 4.
During the test, the reduction of input samples dimension decreased the workload of the classifier and removed redundant information for the classifier. This feature enhanced the working efficiency of the classifier significantly. For example, when the number of evaluation features is 9, the training and test time of SVM classifier is 72% of the total collection state.
According to the result of Figure 4, when the number of selected feature set under MID and MIQ rules of the four defined types of defects is 10 or 11, the evaluation accuracy rate of each type of defect reaches the evaluation accuracy rate of the original 16-dimension feature set. The feature set selection by the MIQ and MID behaved better in PD severity recognition than the feature set in the original sequence number (OS). The findings indicate the necessity and effectiveness of the feature selection algorithm. For P and G defects, the addition of feature numbers 15 and 16 at the end of the optimal ordering decreased the accuracy rate of PD severity assessment. Therefore, interference information that affected classification existed in the primitive feature set.

5.3. PD Severity Evaluation Effect Comparison with Features from the mRMR Method and Theoretical Analysis

Based on the analysis presented in Section 5.1 and Section 5.2, mRMR algorithm is selected to obtain a 10-dimensional optimal feature set F m corresponding to each type of defect, and feature set F s = [ u m a x + ,   u m a x ,   N + ,   N ,   T + ,   T ,   T m a x ,   Q a c c ,   E n ] acquired in Section 3.2 for contrastive analysis of the PD severity evaluation effect. Based on the two feature extraction methods, 800 groups of feature samples are constructed against the same primitive PD information. After SVM classification, we determined the evaluation accuracy rate of four types of defects as N, P, M, and G at each PD severity grade (H1, H2, H3, and H4), and the average evaluation accuracy rate, as shown in Table 8. Generally, the evaluation effect based on the F m and F s feature sets are excellent, and the PD severity assessment accuracy of the SVM classifier and the BPNN classifier based on the F m feature set are similar. However, in P and M, defects with relatively poor evaluation effect based on the F s feature set and the optimal selected feature set F m retain high evaluation accuracy rates. The feature selection method adopted in this study is reliable in practical engineering application.

6. Conclusions

PD severity assessment in GIS is a concern in the power industry. The 3D PD-patterns from UHF data, along with PD development in four typical defects, are analyzed in this study. For PD severity assessment feature extraction, PRPD feature extraction mode, mRMR method-based feature selection, and feature extraction method-based PD theoretical analysis are employed. Compared with the PD severity evaluation effect of the two proposed features sets, we draw the following conclusions:
  • The theory analysis of the 3D PD-pattern under four defects in different discharge states in Section 3.1 shows that with regard to the representation of PD severity, the sequence of the influence degree of the statistical features, such as discharge time, amplitude, and position, in evaluating the severity of different defects is inconsistent. The ordering result of the optimal feature subset under PRPD mode acquired through MID and MIQ searching rules in Section 5.1 provides excellent verification for the 3D PD-pattern analysis from the data level.
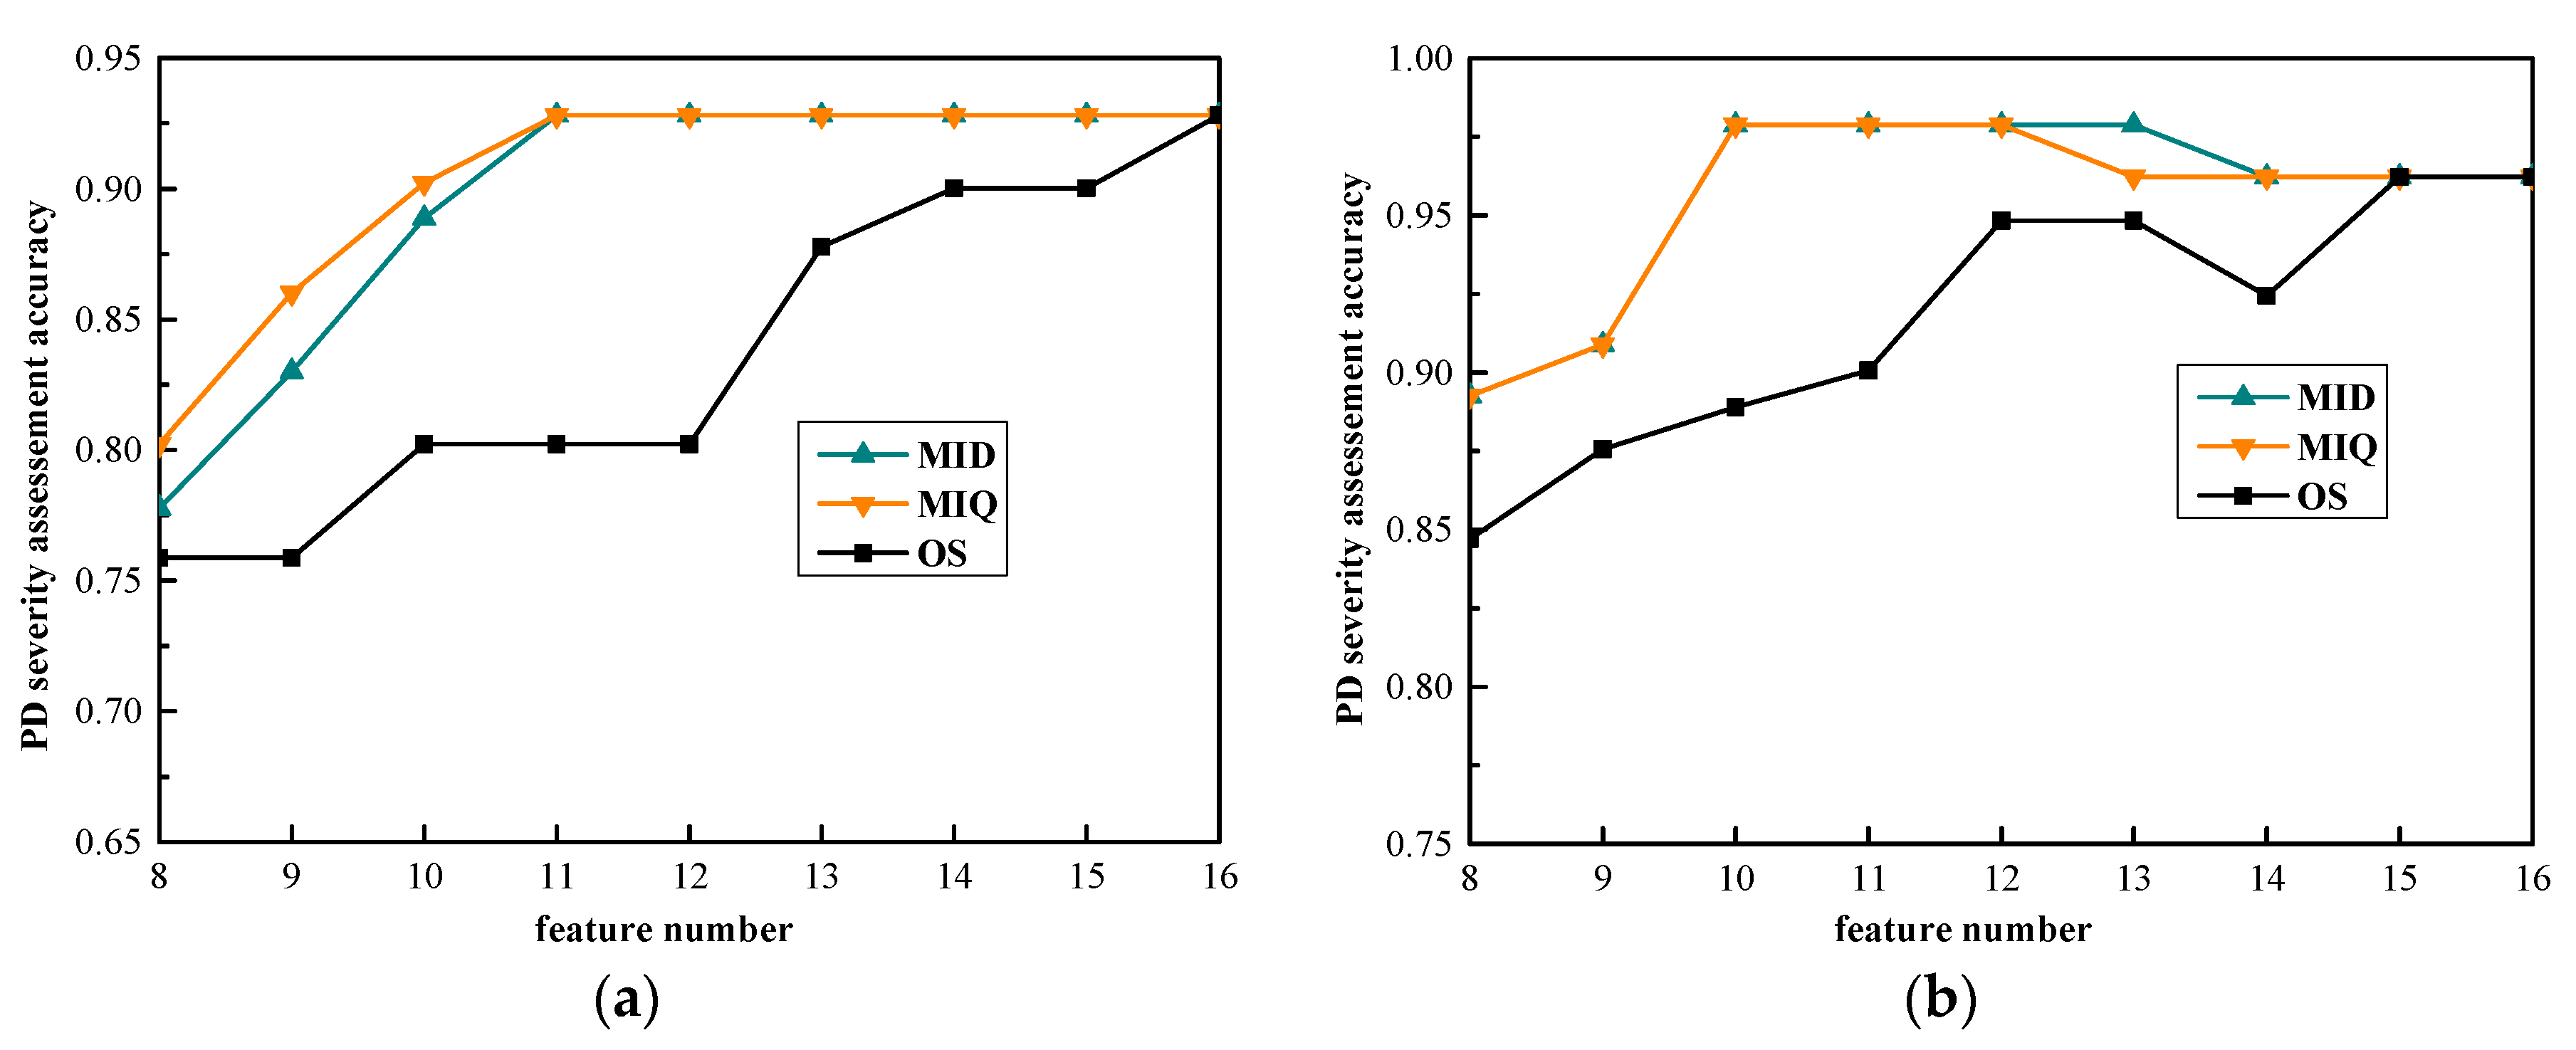
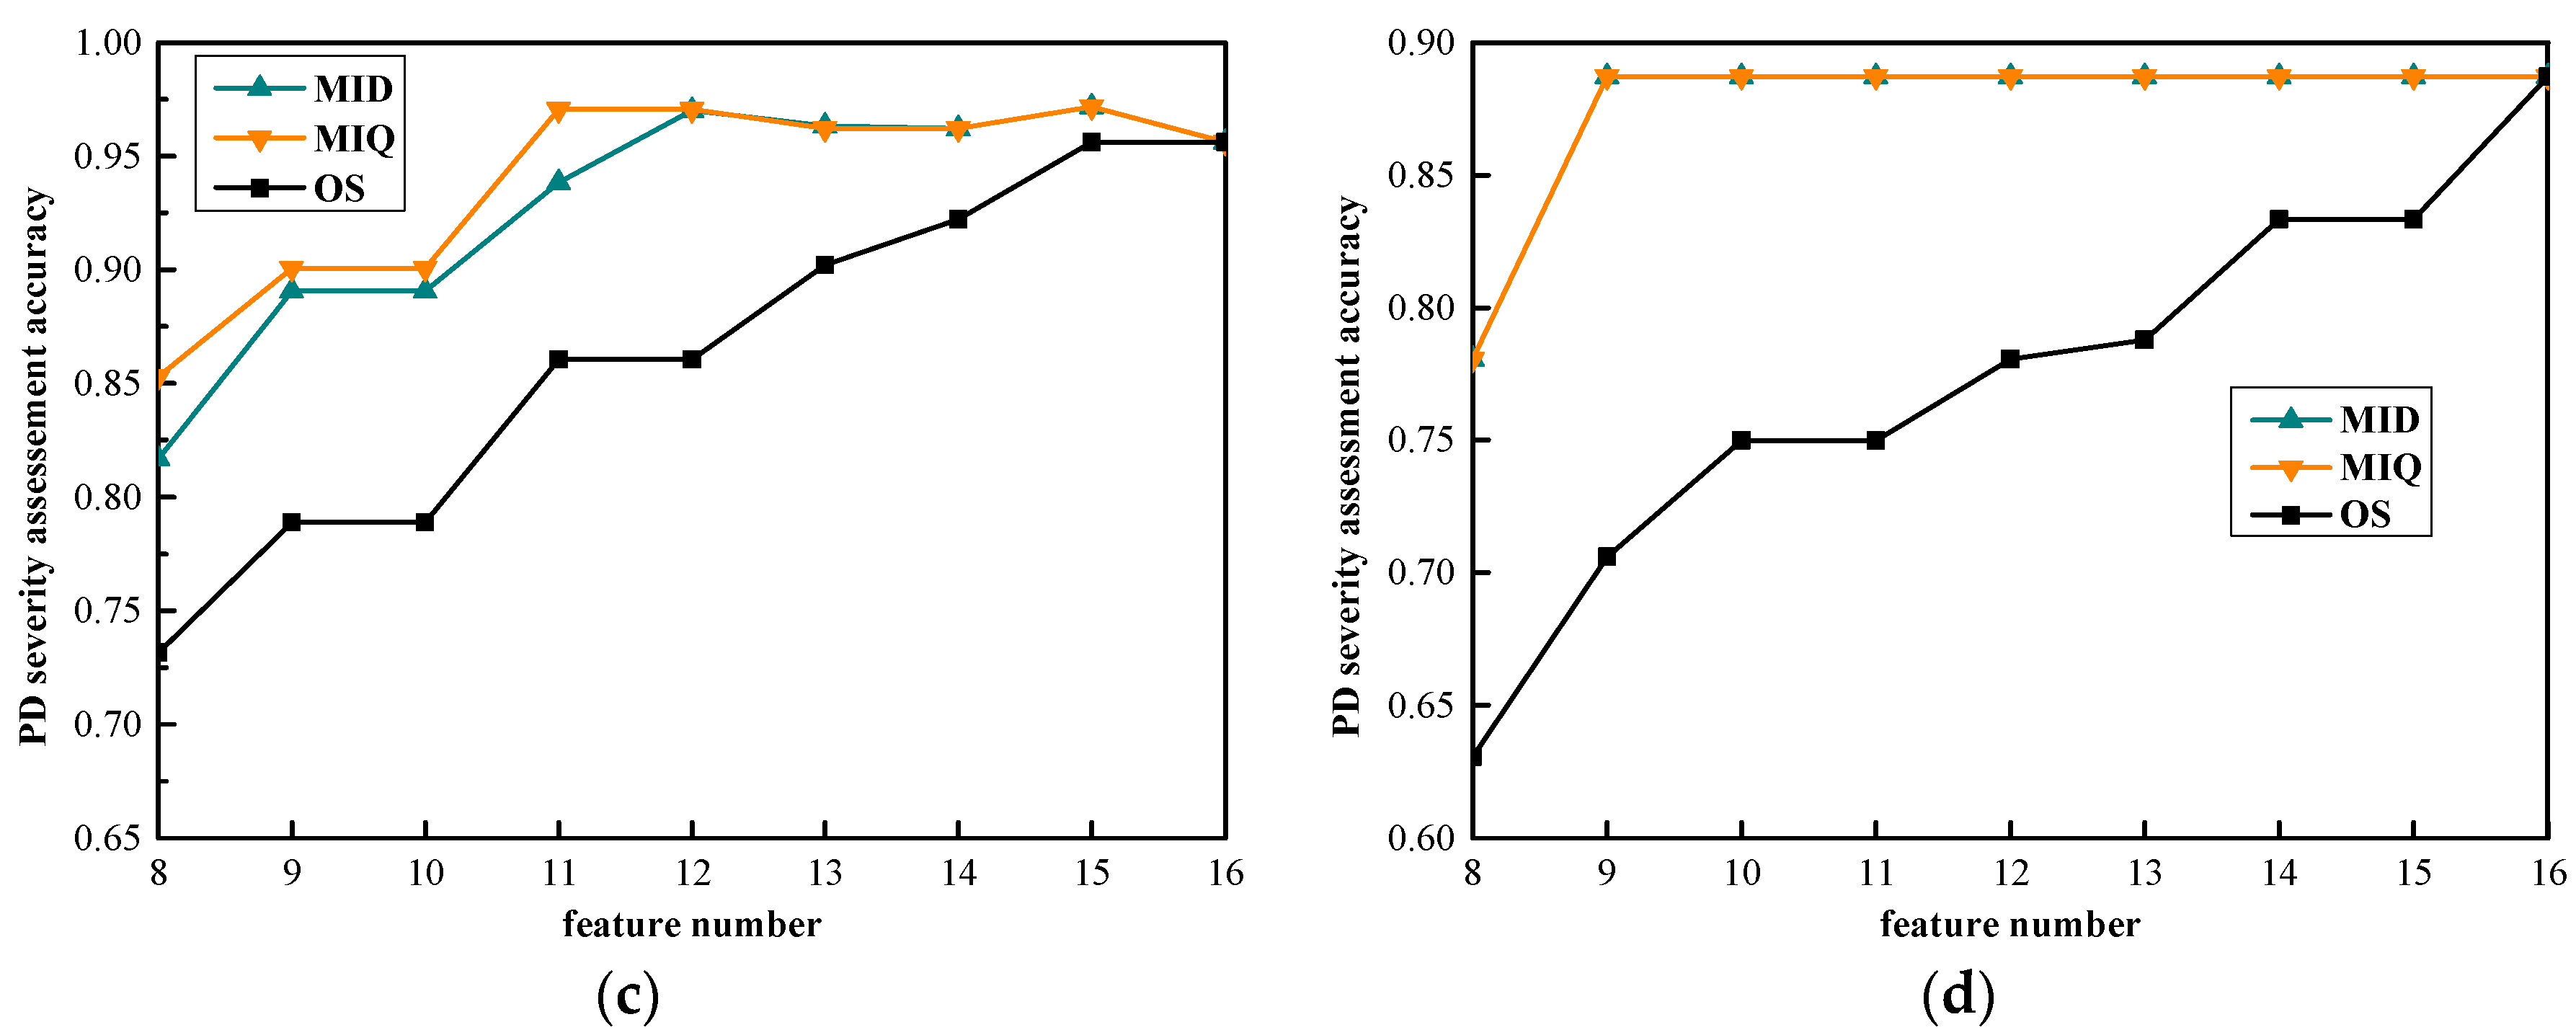
  • The PD severity evaluation accuracy comparison results of the MID feature set, MIQ feature set, and the OS feature set with a SVM classifier indicates the original PRPD feature set includes feature items that exert minimal representation effect on PD severity under the four defined defects and are even involved in redundant feature items under the P and G defects. The first 10 or 11 features in the MID feature set, or the MIQ feature set, can obtain the same PD severity evaluation effect from the original 16D feature set.
  • The PD severity evaluation effect comparison between the features set F m selected by mRMR algorithm and statistical features set F s extracted based on theoretical analysis indicates that PD severity assessment accuracy with the optimal feature set F m has a higher stability of precision than the traditional feature set, in engineering applications under all defined defects. The similar PD severity assessment accuracy of the SVM classifier and the BPNN classifier based on F m feature show that the PD selection process for deep PD information mining plays a more important role than the classifier selection.
In practical application, the findings have implications for personalized GIS insulation condition assessment, and highlight the role of historical data to build a personalized intelligent evaluation scheme in the future.

Acknowledgments

The authors gratefully acknowledge the support of the National High-Tech Research and Development Plan of China (grant no. 2015AA050204), the National Natural Science Foundation of China (51537009), and the State Grid Corporation of China (grant: 2014-1192).

Author Contributions

Ju Tang, Xiaoxing Zhang, and Fuping Zeng conceived and designed the experiments; Miao Jin, Siyuan Zhou, Yi Yang, and Yan Ma performed the experiments and analyzed the data; Miao Jin and Fuping Zeng studied and tested the algorithm; Miao Jin and Ju Tang wrote the paper.

Conflicts of Interest

The authors declare no conflict of interest.

References

  1. Mas’Ud, A.A.; Albarracín, R.; Ardila-Rey, J.A.; Muhammad-Sukki, F.; Illias, H.A.; Bani, N.A.; Munir, A.B. Artificial Neural Network Application for Partial Discharge Recognition: Survey and Future Directions. Energies 2016, 9, 574. [Google Scholar] [CrossRef]
  2. Metwally, I.A. Status review on partial discharge measurement techniques in gas-insulated switchgear/lines. Electr. Power Syst. Res. 2004, 69, 25–36. [Google Scholar] [CrossRef]
  3. Ma, H.; Chan, J.C.; Saha, T.K.; Ekanayake, C. Pattern recognition techniques and their applications for automatic classification of artificial partial discharge sources. IEEE Trans. Dielectr. Electr. Insul. 2013, 20, 468–478. [Google Scholar] [CrossRef]
  4. Tenbohlen, S.; Coenen, S.; Djamali, M.; Andreas, M.; Mohammad, H.S.; Martin, S.D. Diagnostic measurements for power transformers. Energies 2016, 9, 347. [Google Scholar] [CrossRef]
  5. Okabe, S. Insulation properties and degradation mechanism of insulating spacers in gas insulated switchgear (GIS) for repeated/long voltage application. IEEE Trans. Dielectr. Electr. Insul. 2007, 14, 101–110. [Google Scholar] [CrossRef]
  6. Raymond, W.J.K.; Illias, H.A.; Bakar, A.H.A.; Mokhlis, H. Partial discharge classifications: Review of recent progress. Measurement 2015, 68, 164–181. [Google Scholar] [CrossRef]
  7. Ren, M.; Dong, M.; Liu, J. Statistical analysis of partial discharges in SF6 gas via optical detection in various Spectral ranges. Energies 2016, 9, 152. [Google Scholar] [CrossRef]
  8. Gao, W.; Ding, D.; Liu, W.; Huang, X. Investigation of the Evaluation of the PD severity and verification of the sensitivity of partial-discharge detection using the UHF method in GIS. IEEE Trans. Power Deliv. 2014, 29, 38–47. [Google Scholar]
  9. Ren, M.; Dong, M.; Liu, Y.; Miao, J.; Qiu, A. partial discharges in SF6 gas filled void under standard oscillating lightning and switching impulses in uniform and non-uniform background fields. IEEE Trans. Dielectr. Electr. 2014, 21, 138–148. [Google Scholar] [CrossRef]
  10. Qi, B.; Li, C.; Xing, Z.; Wei, Z. Partial discharge initiated by free moving metallic particles on GIS insulator surface: Severity diagnosis and assessment. IEEE Trans. Dielectr. Electr. 2014, 21, 766–774. [Google Scholar] [CrossRef]
  11. Okabe, S.; Yamagiwa, T.; Okubo, H. Detection of harmful metallic particles inside gas insulated switchgear using UHF sensor. IEEE Trans. Dielectr. Electr. 2008, 15, 701–709. [Google Scholar]
  12. Sahoo, N.C.; Salama, M.M.A.; Bartnikas, R. Trends in partial discharge pattern classification: A survey. IEEE Trans. Dielectr. Electr. 2005, 12, 248–264. [Google Scholar] [CrossRef]
  13. Peng, H.; Long, F.; Ding, C. Feature Selection Based on Mutual Information: Criteria of Max-Dependency, Max-Relevance, and Min-Redundancy. IEEE Trans. Pattern Anal. Mach. Intell. 2005, 27, 1226–1238. [Google Scholar] [CrossRef] [PubMed]
  14. Ahmad, F.; Isa, N.A.M.; Hussain, Z.; Osman, M.K.; Sulaiman, S.N. A GA-based feature selection and parameter optimization of an ANN in diagnosing breast cancer. Pattern Anal. Appl. 2015, 18, 861–870. [Google Scholar] [CrossRef]
  15. Xu, Y.; Ding, Y.X.; Ding, J.; Wu, L.Y.; Xue, Y. Mal-Lys: Prediction of lysine malonylation sites in proteins integrated sequence-based features with mRMR feature selection. Sci. Rep. 2016, 6, 38318. [Google Scholar] [CrossRef] [PubMed]
  16. Lima-Mendez, G.; Faust, K.; Henry, N.; Decelle, J.; Colin, S.; Carcillo, F.; Chaffron, S.; Ignacio-Espinosa, J.C.; Roux, S.; Vincent, F.; et al. Ocean plankton. Determinants of community structure in the global plankton interactome. Science 2015, 348, 1262073. [Google Scholar] [CrossRef] [PubMed] [Green Version]
  17. Ashkezari, A.D.; Ma, H.; Saha, T.K.; Cui, Y. Investigation of feature selection techniques for improving efficiency of power transformer condition assessment. IEEE Trans. Dielectr. Electr. 2014, 21, 836–844. [Google Scholar] [CrossRef]
  18. Majidi, M.; Fadali, M.S.; Etezadi-Amoli, M.; Oskuoee, M. Partial discharge pattern recognition via sparse representation and ANN. IEEE Trans. Dielectr. Electr. 2015, 22, 1061–1070. [Google Scholar] [CrossRef]
  19. Majidi, M.; Oskuoee, M. Improving pattern recognition accuracy of partial discharges by new data preprocessing methods. Electr. Power Syst. Res. 2015, 119, 100–110. [Google Scholar] [CrossRef]
  20. Zhang, S.; Li, C.; Wang, K.; Li, J.; Liao, R.; Zhou, T.; Zhang, Y. Improving recognition accuracy of partial discharge patterns by image-oriented feature extraction and selection technique. IEEE Trans. Dielectr. Electr. 2016, 23, 1076–1087. [Google Scholar] [CrossRef]
  21. Mas’Ud, A.A.; Stewart, B.G.; McMeekin, S.G. Application of an ensemble neural network for classifying partial discharge patterns. Electr. Power Syst. Res. 2014, 110, 154–162. [Google Scholar] [CrossRef]
  22. Tang, J.; Zhou, Q.; Tang, M.; Xie, Y. Study on mathematical model for VHF partial discharge of typical insulated defects in GIS. IEEE Trans. Dielectr. Electr. 2007, 14, 30–38. [Google Scholar] [CrossRef]
  23. Mas’Ud, A.A.; Stewart, B.G.; Mcmeekin, S.G. An investigative study into the sensitivity of different partial discharge φ-q-n pattern resolution sizes on statistical neural network pattern classification. Measurement 2016, 92, 497–507. [Google Scholar] [CrossRef]
  24. Dong, Y.L.; Tang, J.; Zeng, F.P.; Liu, M. Features Extraction and Mechanism Analysis of Partial Discharge Development under Protrusion. J. Electr. Eng. Technol. 2015, 10, 344–354. [Google Scholar] [CrossRef]
  25. Kraskov, A.; Stögbauer, H.; Grassberger, P. Estimating mutual informationl. Phys. Rev. E 2004, 69, 066138. [Google Scholar] [CrossRef] [PubMed]
  26. Robles, G.; Parrado-Hernández, E.; Ardila-Rey, J.; Martínez-Tarifa, J.M. Multiple partial discharge source discrimination with multiclass support vector machines. Expert Syst. Appl. 2016, 55, 417–428. [Google Scholar] [CrossRef]
  27. Tang, J.; Zhuo, R.; Wang, D.B.; Zhang, X.X. Application of SA-SVM Incremental Algorithm in GIS PD Pattern Recognition. J. Electr. Eng. Technol. 2016, 11, 192–199. [Google Scholar] [CrossRef]
Figure 1. Schematic of the PD experimental setup.
Energies 10 01516 g001
Figure 2. Four typical artificial defects in GIS (unit: mm).
Energies 10 01516 g002
Figure 3. PD φ-u-n PD-pattern of the four artificial defects. (a) The 3D PD-pattern of the N defect; (b) the 3D PD-pattern of the G defect; (c) the 3D PD-pattern of the P defect; and (d) the 3D PD-pattern of the M defect.
Energies 10 01516 g003aEnergies 10 01516 g003b
Figure 4. The PD severity assessment accuracy of four defects in the three types of feature sorting. (a) N-class defect; (b) P-class defect; (c) G-class defect; and (d) M-class defect.
Energies 10 01516 g004aEnergies 10 01516 g004b
Table 1. PD experimental voltages.
Defect TypeVoltage Grade (kV)
N Class Defect7.3→8.6→9.3→10.4→11.6→13.5→14.6→16.4→19.4
P Class Defect11.0→12.3→13.6→15.0→16.1→17.1→18.0→19.0→20.0
M Class Defect8.7→10.0→11.5→13.0→14.5→16.0→17.5
G Class Defect10.0→13.5→15.0→16.5→18.0→19.5→21.0→23.0→25.0→27.0
Table 2. Statistical characteristics under PRPD mode.
No.FeaturesDescription
1–6 S K m + , S K m , S K m
S K n + , S K n , S K n
Skewness of positive half cycle, negative half cycle, and whole cycle.
7–12 K u m + , K u m , K u m
K u n + , K u n , K u n
Steepness of positive half cycle, negative half cycle, and whole cycle.
13–14 Q m ,   Q n Amplitude and discharge time ratio between positive and negative half cycles.
15–16 C C m ,   C C n Cross-correlation coefficient of positive and negative half cycles.
Table 3. Statistical features based on theoretical analysis.
TypeParametersDescription
Statistical Features u m a x + , u m a x The maximum discharge pulse amplitude in positive and negative positive half-cycle.
N + , N The discharge times in positive and negative positive half-cycle.
Time Interval of Adjacent Discharge T + = 1 N + 1 i = 1 N + 1 t i +
T = 1 N 1 i = 1 N 1 t i
The time interval of two adjacent discharge pulse in positive and negative positive half-cycle.
T m a x The maximum time interval of two adjacent discharge pulses in one power cycle.
Equivalent Cumulative Discharge Quantities Q a c c = i = 1 N u i 2 Discharge quantities in a certain period.
Signal Entropy E n = i = 1 N ( u i i = 1 N u i ) log u i i = 1 N u i The PD Information complexity is denoted by signal entropy [19].
Table 4. Definition of the PD severity levels.
StateDefinitionDescription
Normal State H1Initial Stage of DischargeDischarge times and amplitude are small, and the positive half-cycle is almost no PD discharge in this state.
Attention State H2A Slight DischargeDischarge times, amplitude, Qacc, and En has changed on certain degree, and a small quantity of weak discharge pulses appears in positive half-cycles.
Serious State H3Serious Stage of DischargeDischarge times, amplitude, Qacc, and En have obvious changes in this state.
Dangerous State H4Pre-breakdownPD discharge in positive half-cycles is no weaker than that in negative half-cycles, and the discharge pulse amplitude is saturated.
Table 5. Definition of the severity degrees of PD.
Defect TypesCorresponding PD States of the Applied Voltage (kV)
H1H2H3H4
N Class Defect7.3/8.6/9.411.6/13.514.6/16.419.4
P Class Defect11/13.615/16.117.1/18.019.0/20.0
M Class Defect8.710.0/11.513.0/14.516.0/17.5
G Class Defect10/13.5/1516.5/18/19.521.0/23.025.0/27.0
Table 6. Assessment feature subsets in descending order under N class defect.
Features NumberFeature Search Rules
MIDMIQ
816, 1, 13, 6, 15, 7, 4, 1416, 1, 13, 6, 14, 15, 7, 4
916, 1, 13, 6, 15, 7, 4, 14, 1116, 1, 13, 6, 14, 15, 7, 4, 11,
1016, 1, 13, 6, 15, 7, 4, 14, 11, 316, 1, 13, 6, 14, 15, 7, 4, 11, 3
1116, 1, 13, 6, 15, 7, 4, 14, 11, 3, 1216, 1, 13, 6, 14, 15, 7, 4, 11, 3, 2
1216, 1, 13, 6, 15, 7, 4, 14, 11, 3, 12, 816, 1, 13, 6, 14, 15, 7, 4, 11, 3, 2, 12
1316, 1, 13, 6, 15, 7, 4, 14, 11, 3, 12, 8, 1016, 1, 13, 6, 14, 15, 7, 4, 11, 3, 2, 12, 8
1416, 1, 13, 6, 15, 7, 4, 14, 11, 3, 12, 8, 10, 2,16, 1, 13, 6, 14, 15, 7, 4, 11, 3, 2, 12, 8, 10
1516, 1, 13, 6, 15, 7, 4, 14, 11, 3, 12, 8, 10, 2, 516, 1, 13, 6, 14, 15, 7, 4, 11, 3, 2, 12, 8, 10, 5
1616, 1, 13, 6, 15, 7, 4, 14, 11, 3, 12, 8, 10, 2, 5, 916, 1, 13, 6, 14, 15, 7, 4, 11, 3, 2, 12, 8, 10, 5, 9
Table 7. Assessment feature subsets in descending order under M, P, and G class defects.
Defect TypeFeature Search Rule
MIDMIQ
N Class Defect16, 1, 13, 6, 15, 7, 4, 14, 11, 3, 12, 8, 10, 2, 5, 916, 1, 13, 6, 14, 15, 7, 4, 11, 3, 2, 12, 8, 10, 5, 9
G Class Defect13, 15, 3, 11, 16, 14, 1, 12, 2, 9, 10, 7, 8, 6, 5, 413, 9, 15, 1, 14, 11, 16, 3, 12, 2, 10, 7, 6, 8, 5, 4
M Class Defect14, 16, 5, 15, 13, 1, 4, 7, 9, 12, 6, 8, 10, 3, 11, 214, 5, 16, 13, 15, 1, 4, 7, 9, 12, 8, 6, 10, 11, 3, 2
P Class Defect16, 5, 3, 15, 14, 11, 6, 9, 8, 4, 12, 7, 13, 10, 2, 116, 5, 6, 15, 14, 11, 3, 9, 8, 13, , 4, 12, 7, 10, 2, 1
Table 8. Assessment feature subsets in descending order under M, P, and G class defects.
StatePD Severity Assessment Accuracy (%)
F m -SVM F m -SVM F m -BPNN
NPMGNPMGNPMG
H10.920.950.900.920.890.810.760.810.910.900.880.90
H20.900.920.880.980.720.800.700.950.890.890.860.95
H30.880.880.850.880.790.800.720.800.860.880.850.87
H40.820.910.820.920.800.830.800.830.830.920.800.90
ALL0.880.920.850.930.770.810.800.830.870.900.840.91

