Effects of Nonlinearity in Input Filter on the Dynamic Behavior of an Interleaved Boost PFC Converter


1
College of Mechatronics and Control Engineering, Shenzhen University, Shenzhen 518060, China
2
Microsystem and Terahertz Research Center, China Academy of Engineering Physics, Chengdu 610200, China
3
School of Mechanical Engineering and Automation, Harbin Institute of Technology, Shenzhen 150001, China
*
Author to whom correspondence should be addressed.
Energies 2017, 10(10), 1530; https://doi.org/10.3390/en10101530
Submission received: 12 August 2017
/
Revised: 22 September 2017
/
Accepted: 25 September 2017
/
Published: 2 October 2017
(This article belongs to the Special Issue Emerging Power Electronics Technologies for Power Systems and Machine Drives)
Abstract
:A power factor correction (PFC) converter with interleaved multi-channel topology is gaining increasing attention due to its ability in reducing input and output current ripples, but an Electromagnetic Interference (EMI) noise filter is still required for suppressing the large high-frequency switching noise that could potentially degrade the input power quality of the supplying grid and cause malfunctions to other grid-connected systems. In this paper, a magnetic modeling of an interleaved PFC converter with an input differential mode (DM) EMI filter has been successfully implemented, which considers the nonlinear behavior of the inductive component in the EMI filter. The Jiles-Atherton (J-A) model is applied to describe the filtering inductor whose core displays saturation and hysteresis. The simulation results are verified with the experimental test.
1. Introduction
As more and more grid-connected applications of switching power converters are used in our daily life, power factor corrections (PFCs) have been commonly employed to alleviate the poor power factor problem due to conventional AC-DC converters and meet the harmonic requirement IEC 61000-3-2 in the low-frequency range [1]. An interleaved PFC that can meet the above two tasks will be investigated in this paper for its high power capacity, low switching losses, and reliable operation [2,3]. Although it can efficiently reduce power-frequency harmonic components, its fast switching circuit produces some high-frequency noises which pose a potential pollution to power grid and influence other operating devices connected to the grid. The severity of these conducted EMI noises and its containing measured need be investigated and suppressed to comply with the EMC standard for the conducted EMI noise in the 150 kHz–30 MHz range [4].
High rates of di/dt and dv/dt are the main concern for the existing conducted EMI noise in the PFC converter [5]. In the case of high frequency switching pulse current, the large voltage would be produced by the inductive component in the system. On the other hand, the high rate of dv/dt depends on the switching frequency and voltage variation magnitude. These harmonics would produce high-frequency current flowing through parasitic capacitance present in the circuit. There are two types of EMI noises, i.e., differential mode (DM) and common mode (CM) noises. The DM noise exists between line and neutral and is caused by the fast turn-on and turn-off of the power switch, reverse recovery of the power diodes, and high pulse current. The CM noise exists between the line and ground, and neutral and ground, and is mainly caused by the parasitic capacitance and high dv/dt.
Therefore, an EMI filter should be connected between power supply mains and the PFC circuit to suppress the high-frequency noise being transferred from the converter to the mains. In the interleaved PFC circuit, the DM noise is dominant, and a DM filter will be installed in the circuit [6,7,8]. The EMI filter consists of inductive and capacitive components, and this would influence the system performance such as power factor, total harmonic distortion, and so on [9,10]. In order to analyze the influence of the EMC filter on the performance of PFC converter and obtain the dynamics of the PFC circuit, accurate models for the components in the EMC filter are very useful in the overall system simulation. As usual, the inductor is considered as a constant value in the overall system simulation, but the actual inductance varies with time, in theory [11], which could be difficult to identify. The traditional nonlinear inductor model includes the piecewise linearized model and the volterra-series model, which are not very accurate to model the nonlinearity of inductor [12,13]. In order to predict the dynamic influence of the inductor in the EMI filter, a hysteresis model of the magnetic core will be applied in the interleaved PFC converter to investigate the dynamic behavior. Two models, Preisach’s model [14] and Jiles-Atherton’s (J-A) model, are commonly used to model magnetic cores. In this paper, the J-A model is used to model the magnetic component in this circuit.
The Jiles-Atherton model is a time-domain history-dependent hysteresis model which consists of a group of first-order equations to describe the hysteresis mechanism in magnetic materials, and it is based on the existing ideas of domain wall motion including both bending and translation [14,15]. Applying the J-A model to describe the magnetic core which display the saturation and hysteresis will be investigated in this paper. The dynamics of the interleaved PFC circuit with the EMI filter will be modeled with the consideration of non-linearity of the inductor in the filter; an experiment in which a ferrite-cored inductor of the L-C EMI filter is used has been implemented to verify the simulation results and examine the effectiveness of the EMI filter.
In Section 2, a review of interleaved PFC converter and the simplified EMI noise model is presented. The J-A model of the nonlinear EMI filtering inductor in the converter is introduced in Section 3. In Section 4, a comprehensive PFC converter simulation and its effectiveness are presented. In Section 5, simulation and experimental results are compared and the effect of the nonlinear inductor on the system is introduced. Section 6 concludes the result analysis.
2. Configuration of the Interleaved PFC Converter
2.1. System Controller Design
In this paper, the average current control method is used for the PFC controller, and this method is less sensitive to the switching losses than the peak current and hysteresis control techniques. Figure 1 shows the system control topology. There are two control loops in the average current control method, one is the outer voltage loop which is used to control the DC output voltage, and the other is the inner current loop, which is used to control the input current proportional to the utility line voltage.
For the boost average current control method, the average output voltage should be higher than the input peak voltage at any time. The input current drawn from the AC line at any instant must be proportional to the line voltage which is controlled by the inner loop of the controller. The boost inductors and are interleaved in the circuit, and the control signal of switch is delayed by a half switching period as compared with switch . The currents of and are conducted in CCM, the input current is the summation of the two boost inductor currents, and ripples are cancelled by each other due to the interleaving topology [16]. It can be found that this topology has a capability of reducing current ripple and EMI noise, but it also increases the additional cost of auxiliary circuits and power devices.
The duty cycle d in every switching period is:
where is the switch turn-on time and is the switch turn-off time, is the rectified input voltage, and is the PFC converter output voltage.
2.2. Conducted EMI Noise Model
The EMI noise has been a concern for a long time due to the popularization of the switching power converter. High-frequency driving signals of the power semiconductor can produce high voltage and current variation in the converter, therefore, creating a high level of EMI noise. This EMI noise would couple with the input terminal of the converter, then the conducted noise would be injected into the power grid, and other equipment may be influenced if they are connected in the same network.
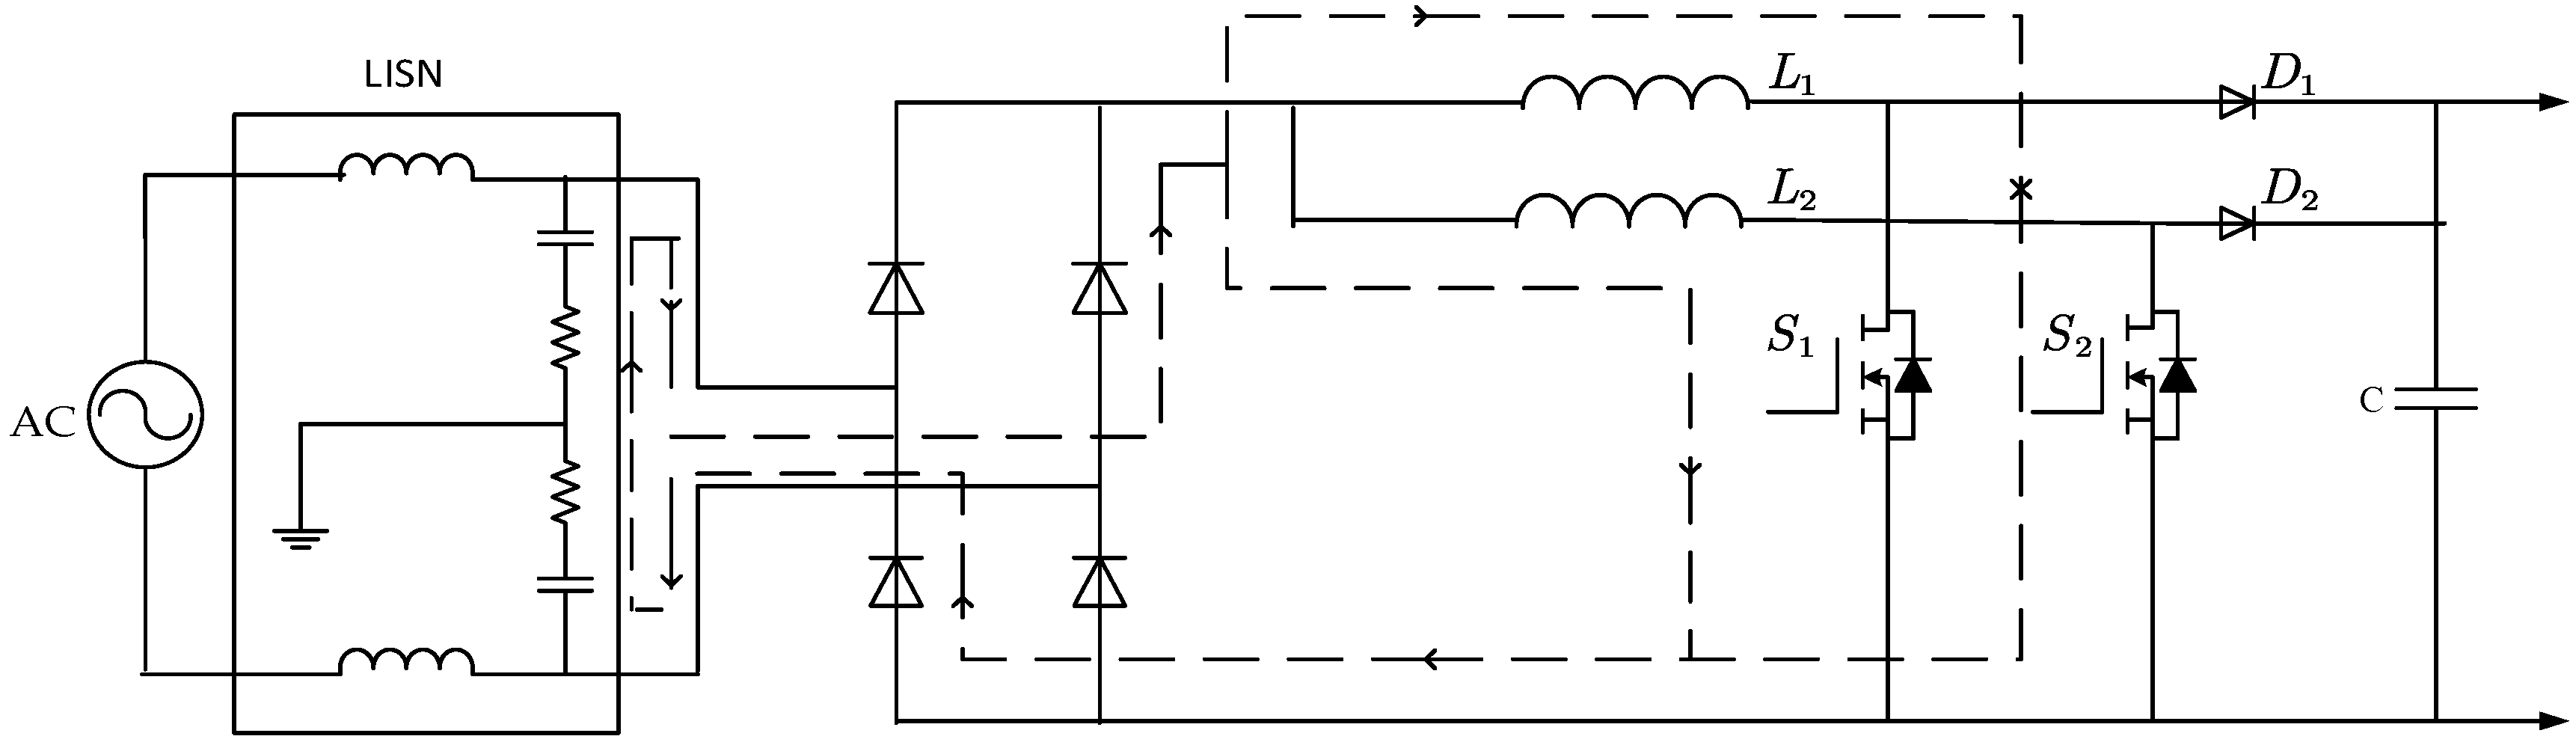
The DM noise plays a dominant pole role in the conducted EMI of the interleaved PFC converter. Figure 2 shows the DM noise transferring path in the circuit topology, and the path overlaps the PFC converter input current, and its frequency is much higher than the input AC frequency. Thus, the DM noise is mainly dependent on the input current waveform which contains the power frequency component and superimposed triangular waveform due to switching. The generated DM EMI noises have frequencies equal to multiples of the switching frequency.
For the two-wire interleaved PFC converter in this paper, the simplified DM noise model [17,18] is shown in Figure 3. and are the boost inductors of the PFC converter. Due to the switching of MOSFETs in the two channels of PFC converter, and across the MOSFET drain to source, which varies from to the output voltage (390 V in this paper) are the sources of the EMI noise. In the conducted EMI frequency range, the impedance of the capacitors in the LISN can be ignored compared to the two LISN 50 Ω resistors.
Based on the DM noise model, the differential noise can be solved readily. As the two channels of the PFC converter have the same design and switching frequency, the impedances of the two boost inductors are the same. Due to the interleaved topology, the fundamental component of the two noise sources will cancel each other. Thus, there will be no switching frequency noise in the two-channel PFC converter. For the second-order harmonic component of the noise sources, they are in phase and produce DM noises through the LISN resistor. The two DM noises will add together at . For the same reason, all the odd harmonics cancelled each other and even-order harmonics remain the same as those in the non-interleaving topology. Therefore, the DM noise analysis and filter design should be based on the even-order harmonics in the interleaved topology.
3. Nonlinear Inductor Modeling
An inductor and a capacitor are the two components in the EMI filter, and the capacitor draws a small current which is not compensated in the control loops. This may degrade the power factor of the PFC converter slightly, and a more serious problem is that the THD of the input current would be worsened due to the filtering inductor. In order to predict the dynamics of the PFC converter more precisely, an accurate model for the inductor has been built to simulate its hysteresis behavior.
3.1. Jiles-Atherton Hysteresis Model
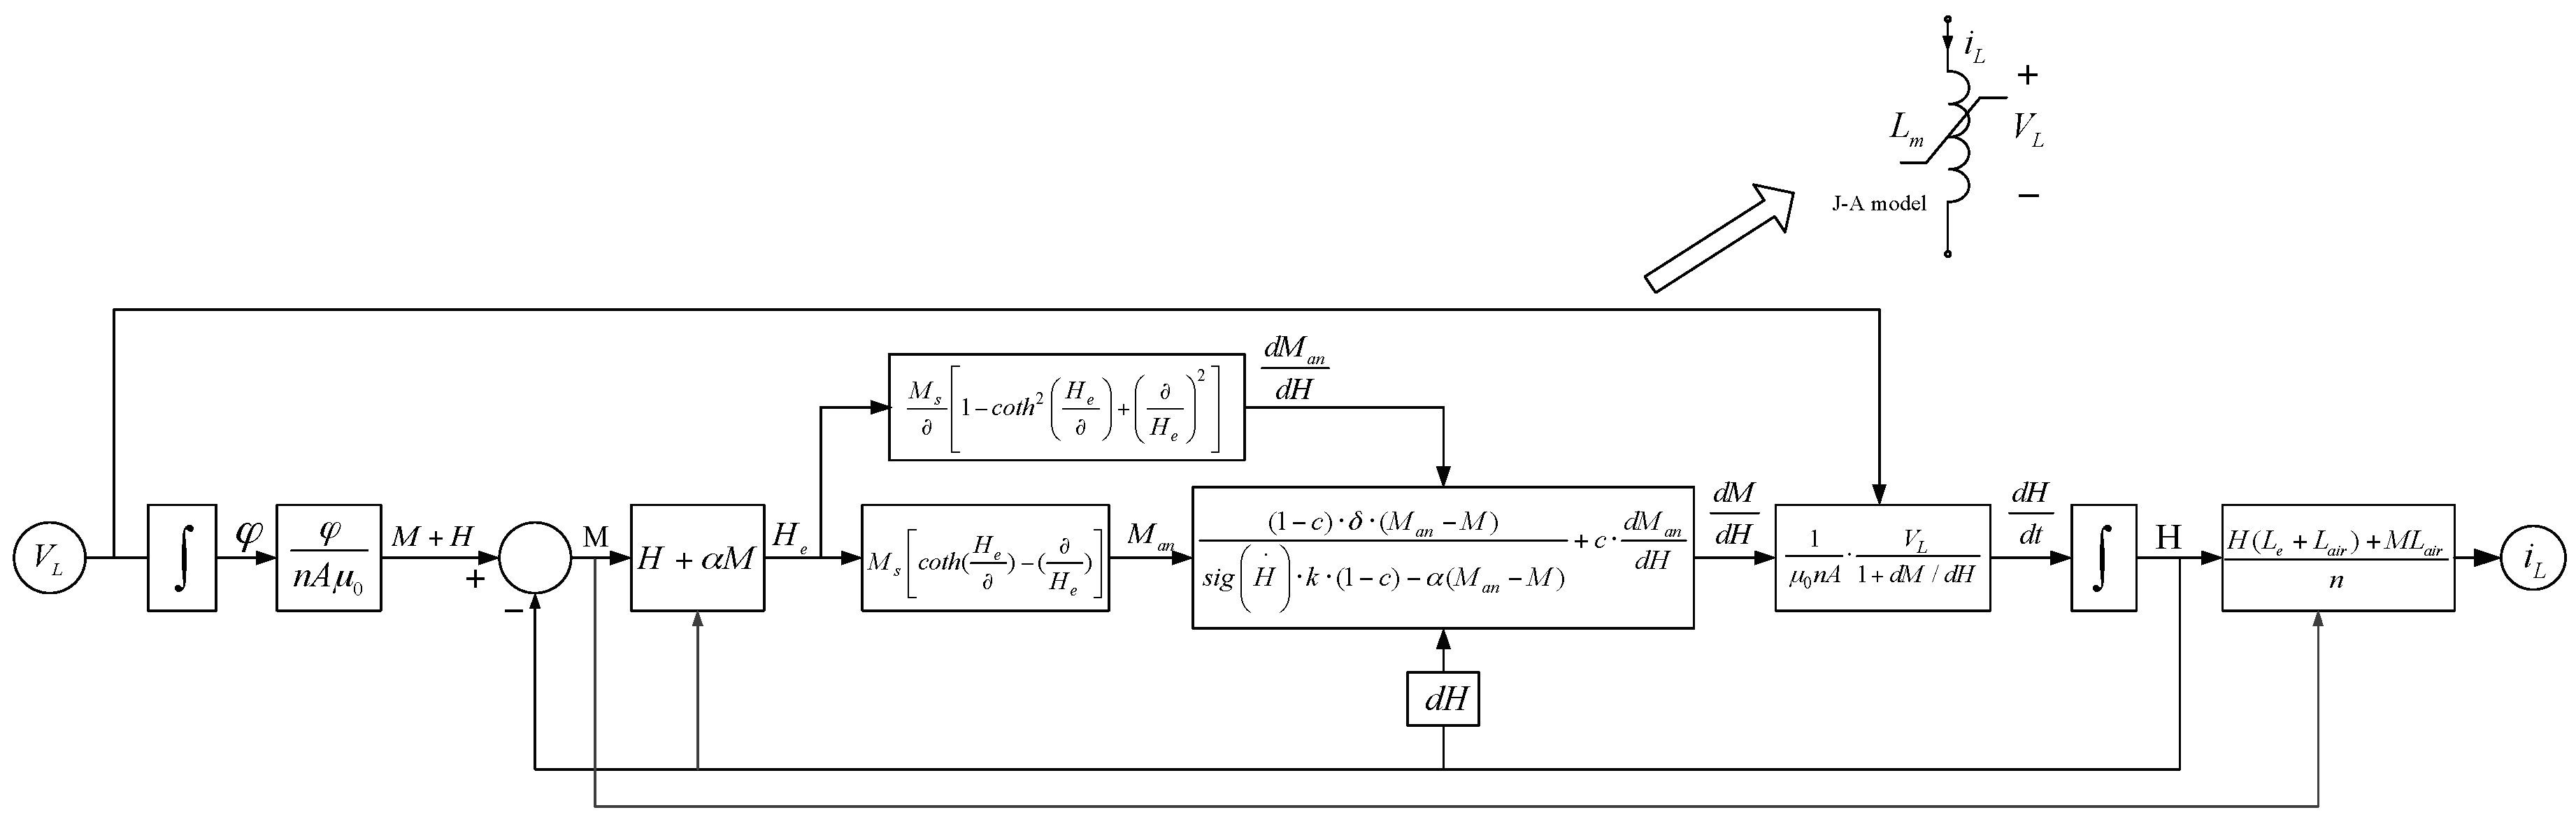
The EMI filtering inductor’s nonlinear behavior will be implemented using the Jiles-Atherton (J-A) model and applied it to the overall system simulation. The J-A model can be used to model the hysteresis characteristic of the magnetic core. The J-A model is a group of first-order ordinary differential equations (ODE) which could be implemented numerically to describe the relationship between magnetization and the magnetic field [19], and then the numerical details can be applied in Simulink (MathWorks company, Natick, Massachusetts, 01760, USA) for the overall system simulation. The J-A model is given as:
where is the total magnetization, is the anhysteretic magnetization, is the irreversible magnetization, the function is defined as sig(x) = 1 for and for . is the effective magnetic field, B is the flux density, H is the core magnetic field, is the inter-domain coupling factor, and is the permeability of free space.
The anhysteretic magnetization can be described using Langevin function as shown below:
According to Equation (8), the differential is:
where is saturated magnetization, and is a shape parameter.
Equation (10) can easily derived using Equations (2)–(7):
where:
Then
Equation (13) can be derived with integration both sides of Equation (12),
where is the initial magnetization, is the start moment of the computation, denotes the voltage across filtering inductor respectively. Equation (13) is discretized as below:
From Equations (11) and (12) one can obtain:
Hence:
where is the system input current which flows through filtering inductor.
Equation (16) can be discretized as:
Then the nonlinear filtering inductor model can be built in the embedded MATLAB function of Simulink following the procedures shown in Figure 4.
3.2. Inverse J-A Model Parameters
The parameters , and of the J-A model can be obtained from the magnetic material specification and solving some particular equations as shown in procedure below. The wall motion parameter can be estimated as , and is the coercive force (A/m).
From Equation (8), it can be derived that:
where , remanence flux density and. is the remanence differential susceptibility.
The secant method [20] introduced in Equation (20) will be used to calculate the parameter .
If tolerable error, .
According to Equation (6):
From Equations (19) and (21) one can obtain:
where is the maximum value of magnetization at tip of B-H loop, is the maximum differential susceptibility. Using the secant method as introduced in Equation (20) to solve Equation (22), and then the shape parameter can be obtained.
Wall motion parameter c can be calculated:
where is the initial differential susceptibility.
Using the derived J-A model parameters could improve the accuracy of the filtering inductor simulation. The prediction will be verified in the next section. The hysteresis parameters for the sample material are:, k = 140 (A/m),, , and .
4. Simulation Results
The system configuration which includes the nonlinear inductor model in the interleaved PFC converter is shown in Figure 4. The simulation will be conducted under the following conditions and Table 1: the input AC voltage is set to 110 or 220 V, respectively, the load is simplified as a resistor . In addition, other important system component parameters are provided: the two boost inductors , input DM EMI noise filter inductor if its nonlinearity is ignored and capacitor , the output capacitor .
Figure 5 shows the simulated waveforms of the magnetic field, magnetization, and their relationship. It supports that the J-A model can be used in the overall system simulation and predict the hysteresis phenomenon of the filtering inductor accurately. As expected, Figure 6a has a larger maximum magnetic field, magnetization, and input current than Figure 6b since the input voltage for the case of Figure 6a is smaller as a constant output power. The observed results are useful to choose the appropriate magnetic core and number of turns of the EMI filtering inductor to avoid the core always running into a saturation state, which produces severe harmonics in the PFC converter.
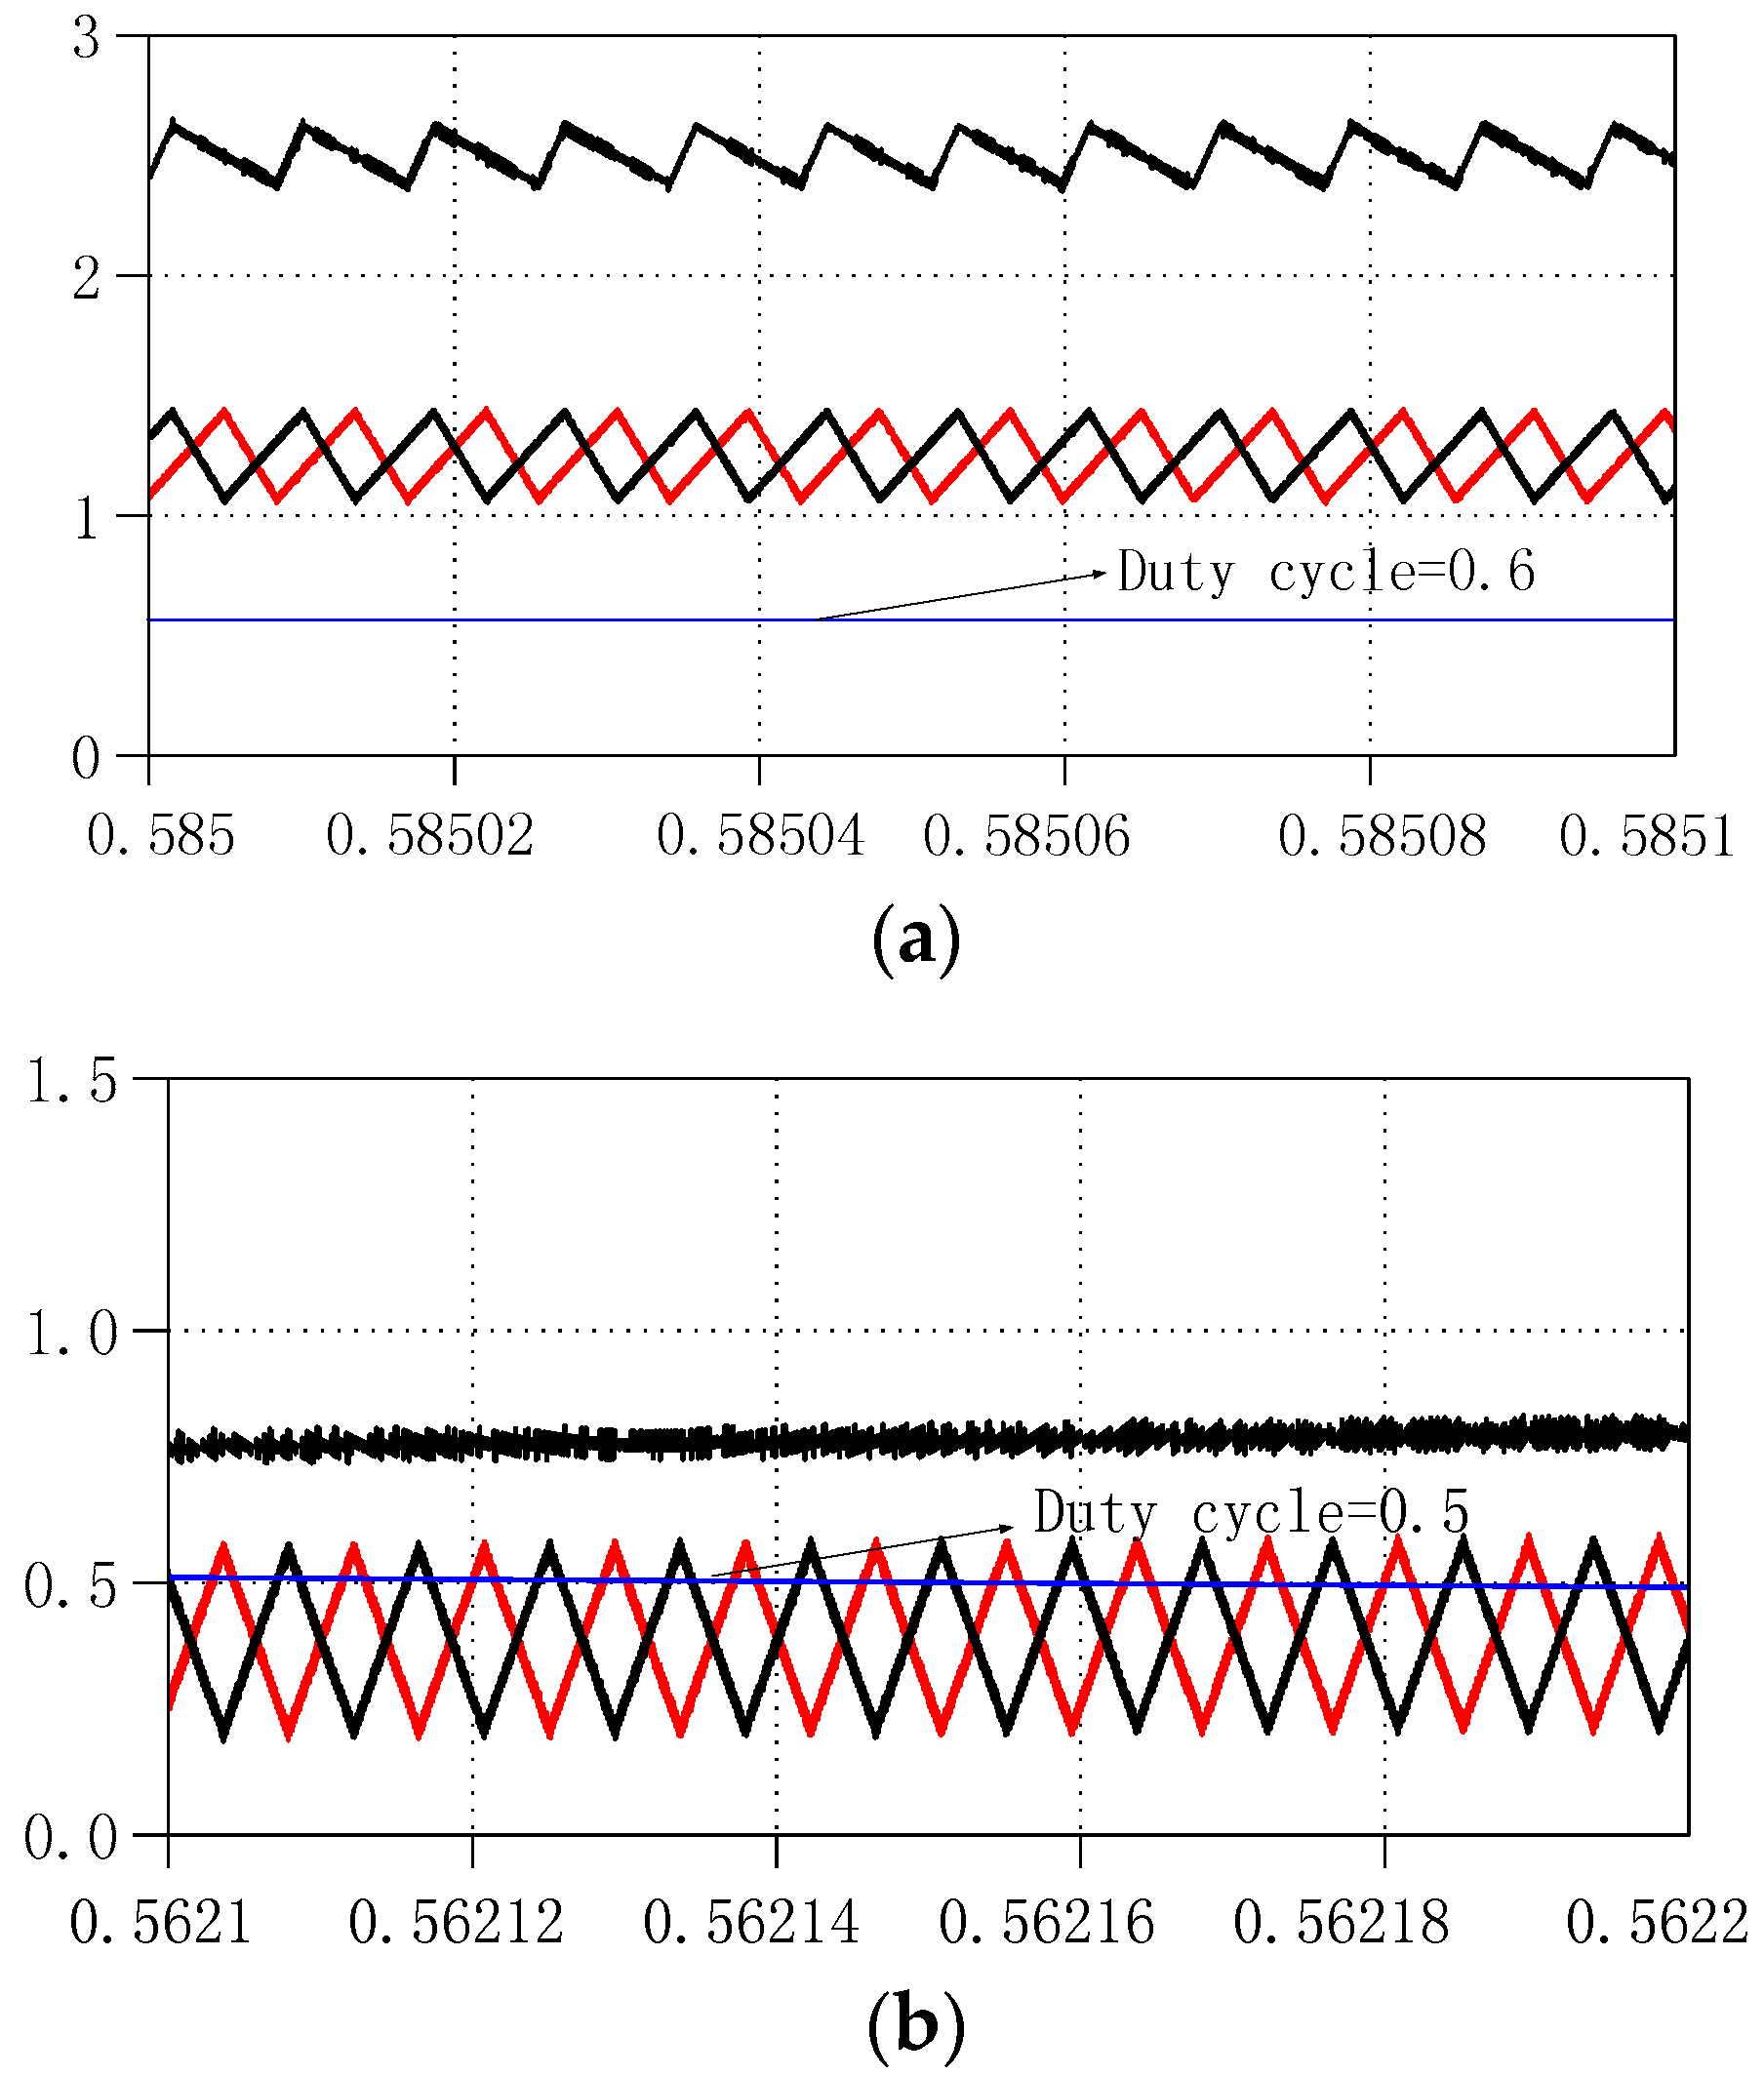
Figure 7 shows the boost inductor currents, input currents when or 220 V with J-A model consideration, respectively. It can be observed that current flowing into the interleaved PFC converter has a smaller ripple than the boost inductor currents due to the interleaving topology. The interleaved PFC converter has a capacity of reducing the total harmonic distortion, switching losses, and inductor magnetic core, as compared with the traditional single-boost inductor configuration [21]. It also can be found that there is a smaller current ripple when the PFC converter runs at a lower input voltage. Figure 8 shows the zoomed-in boost inductor current and input current; the boost inductor current ripple cancel each other, resulting in smaller current ripple in the input current. Figure 8a shows the current ripple when the input instant voltage is 24 V and duty cycle is around 0.6, Figure 8b shows the input instant voltage is 155 V and duty cycle is around 0.5. Smaller current ripple reduces the size of the magnetic core and DM EMI noise.
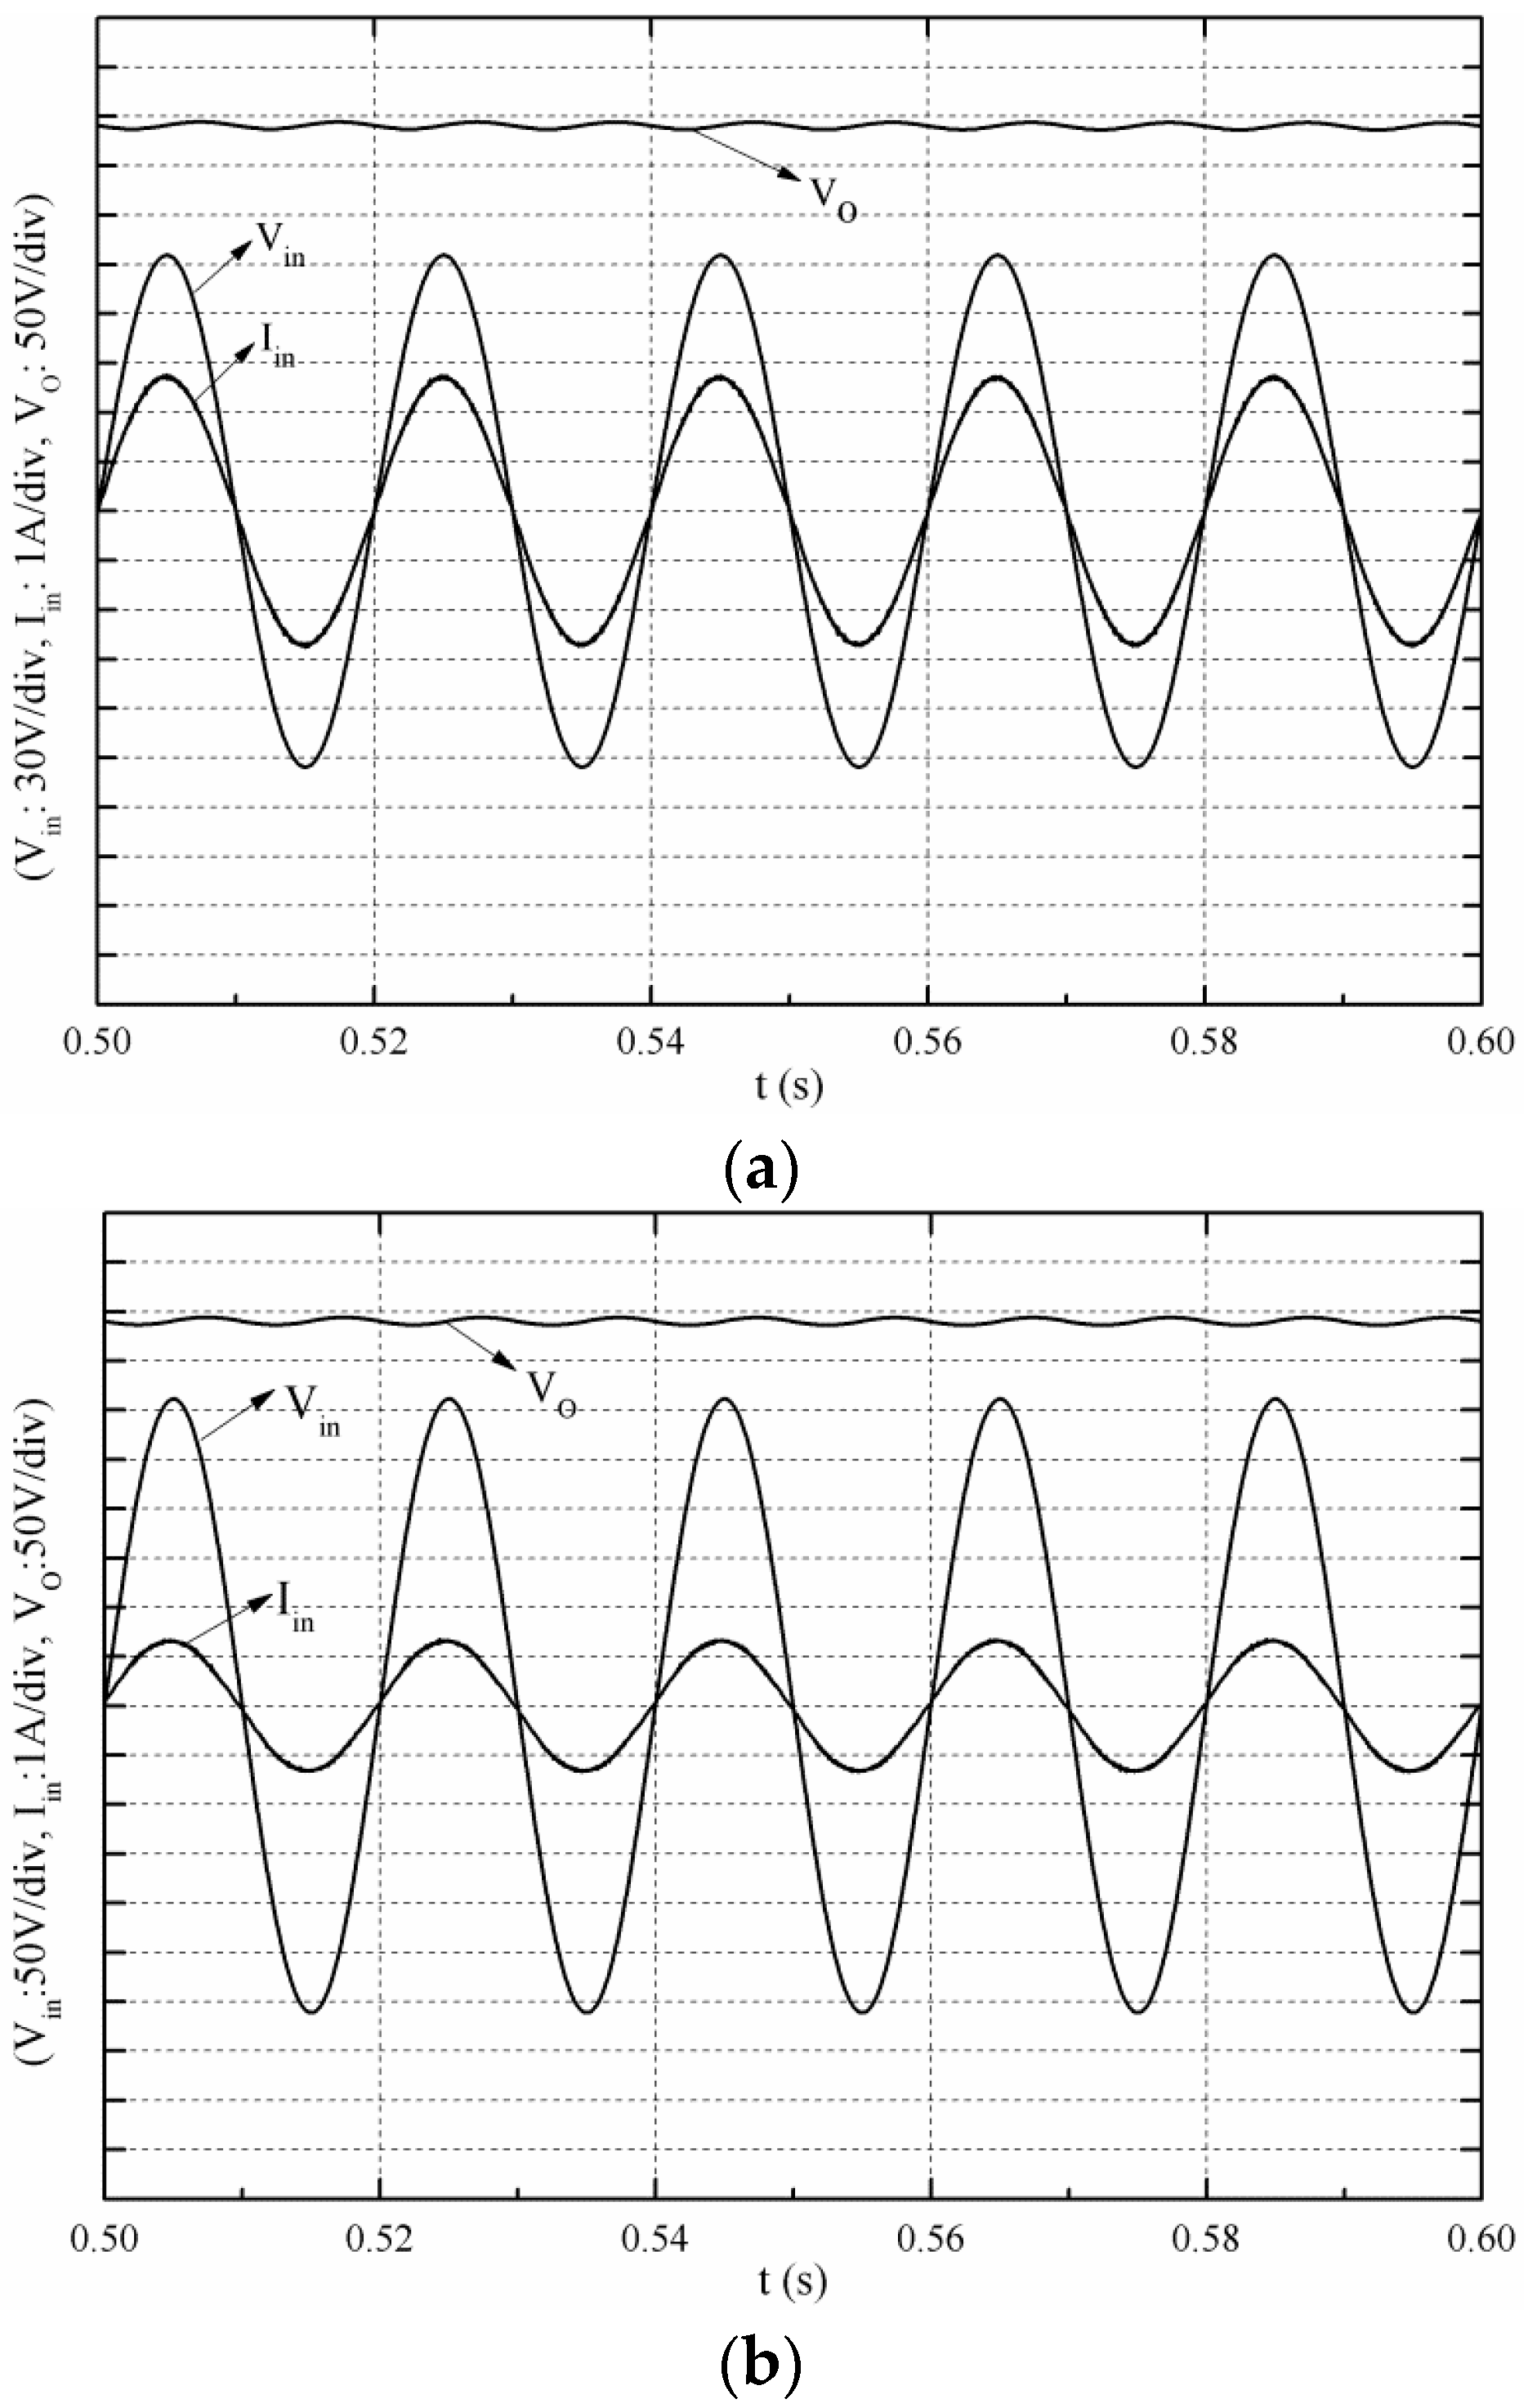
Figure 9 shows the simulated input voltage, current and output voltage when the J-A model is considered. From Figure 9, it can be found that as a closed loop control system, the interleaved PFC converter including the complicated nonlinear filtering inductor model can run into steady state and predict the system phenomenon. It shows that the J-A model would not affect the stability of the PFC converter system. These simulation results will be verified in the following section.
5. Experiment Results
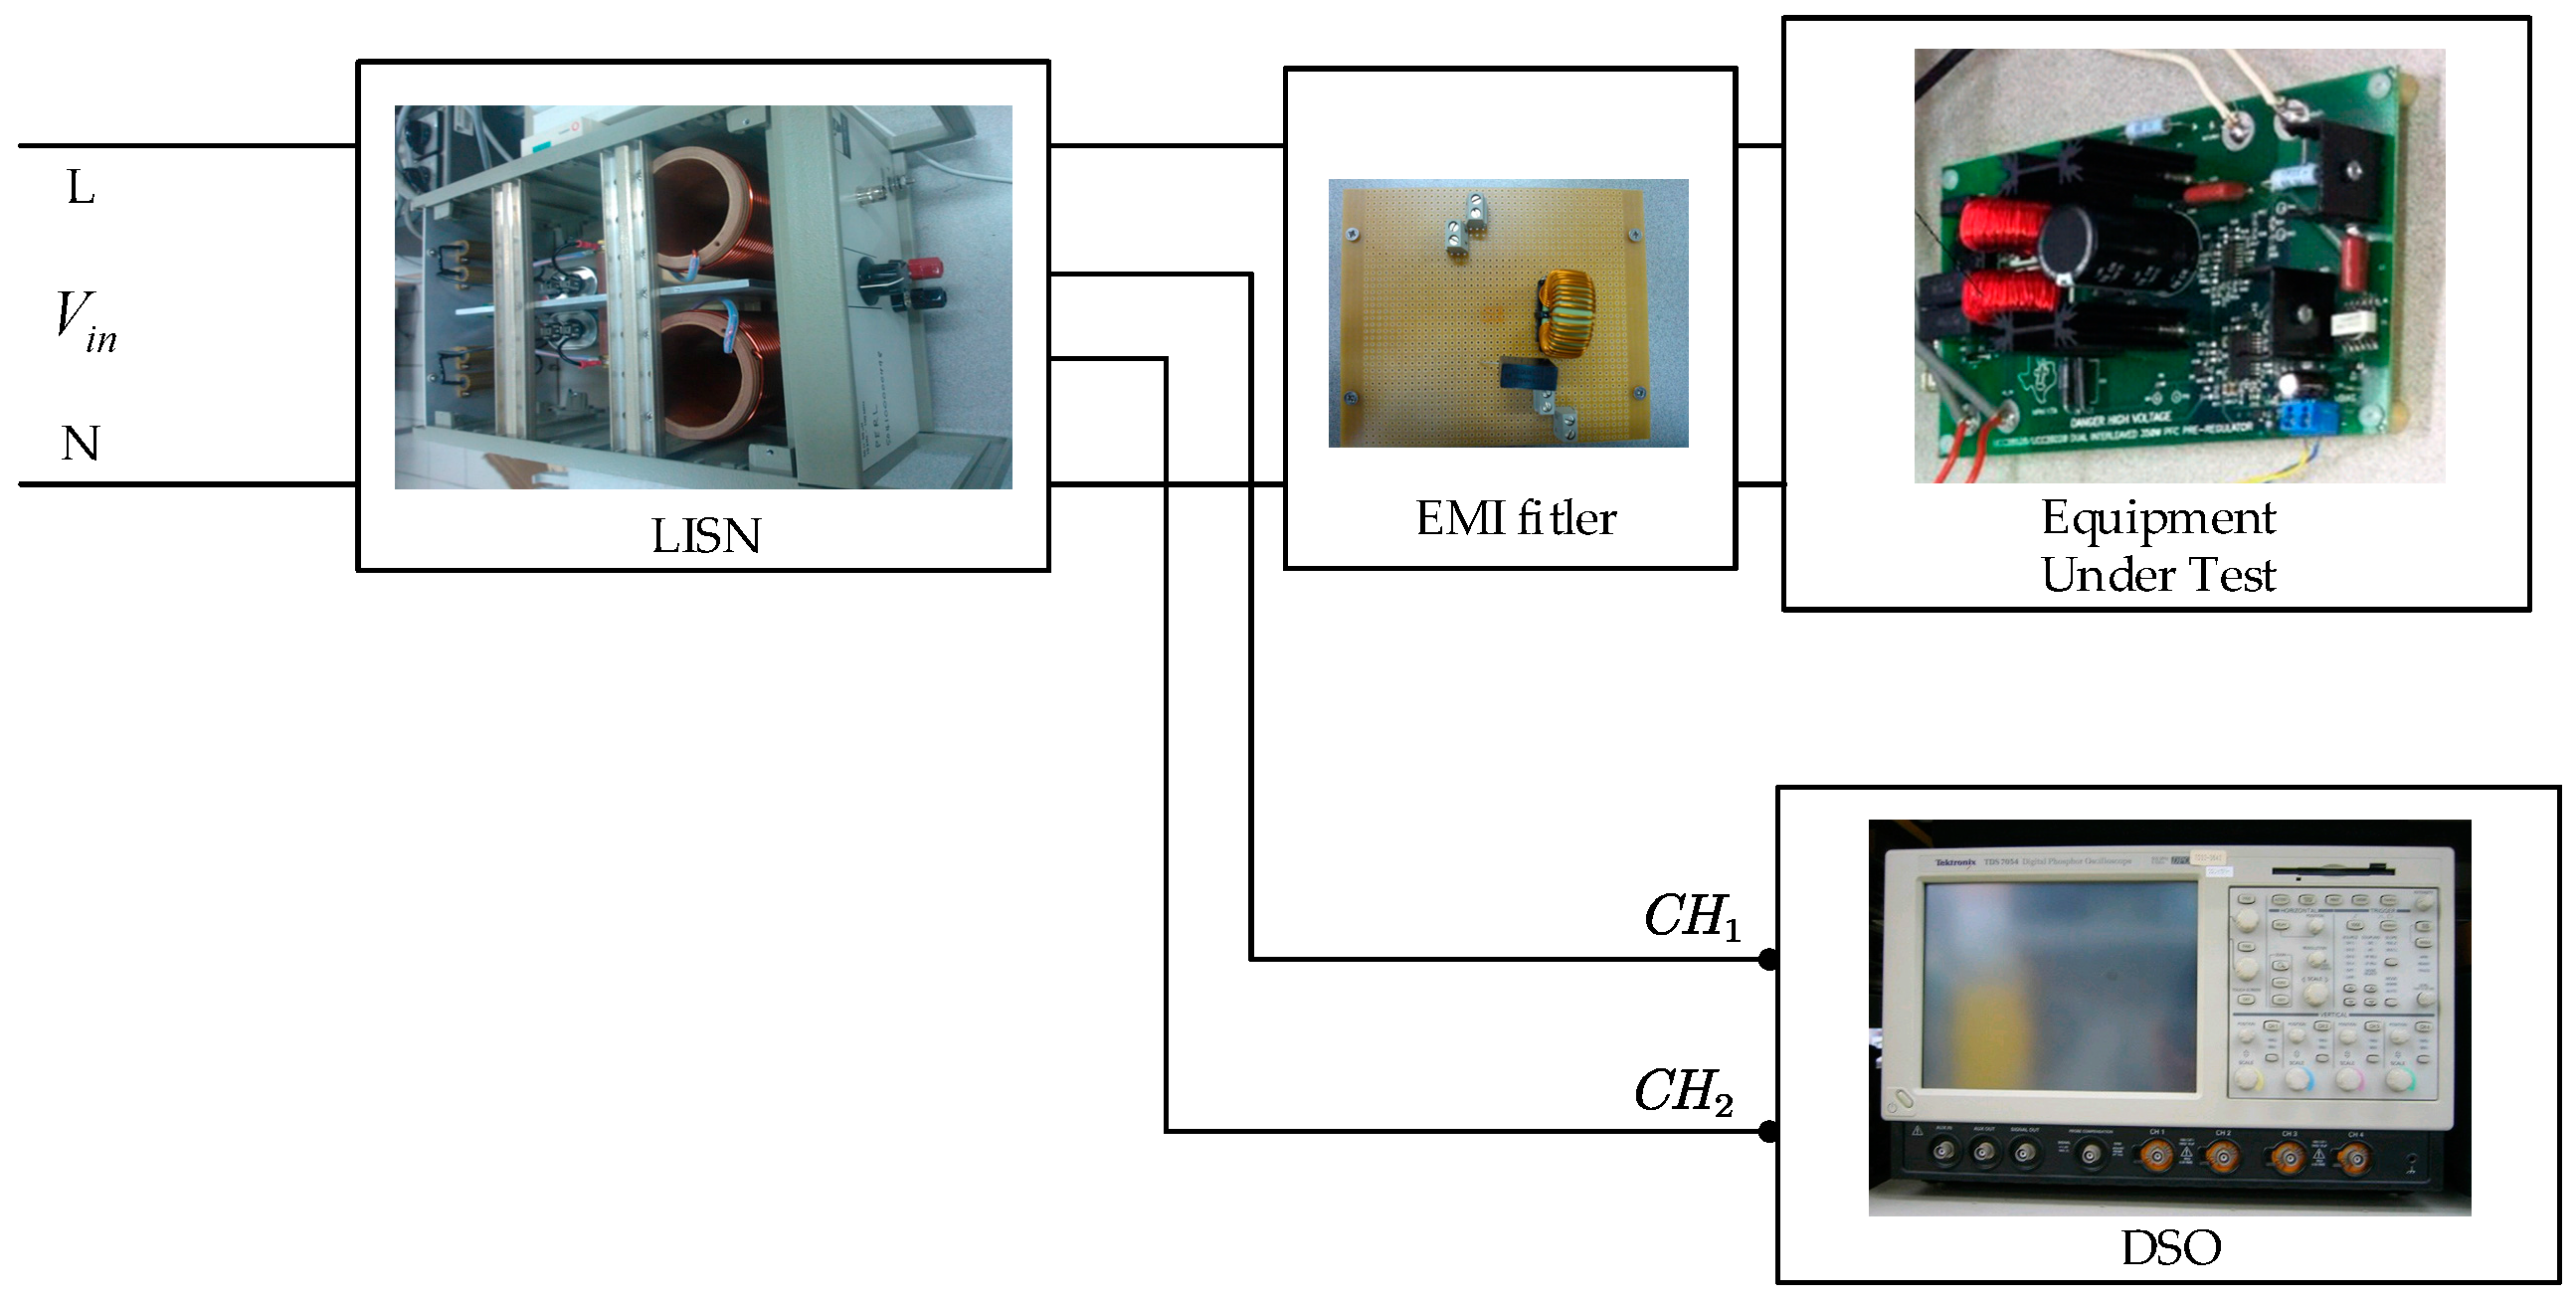
An experiment has been conducted to verify the simulation results. The hardware setup for the experiment consists of a UCC28258/UCC28220 dual interleaved PFC pre-regulator including two CTX16-17309 produced boost inductors as shown in Figure 10. The EMI filter consists of a capacitance of approximately , and a differential inductance which is produced with LCR-COMPONENTS-DF5-CHOKE, in which the core is toroidal in shape and is made of ferrite with its average D being and cross-sectional area A being , the number of turns n being 40. The model of LISN is 3725/2M. The experiment input voltage is the same as the simulation condition.
An EMI filter has been installed in the PFC converter to suppress the EMI noise generated by the fast-switching devices. The time-domain EMI measurement system [22], which is simple and efficient will be used to do the spectrum analysis in the experiment. The EMI noise emitted from the PFC converter is captured from the line (L) and neutral (N) output of the LISN. The signals from the LISN will be fed into the digital storage oscilloscope to do a sampling process. The spectrum of the time-domain measurement can be obtained via Fourier transform, as shown in Figure 11.
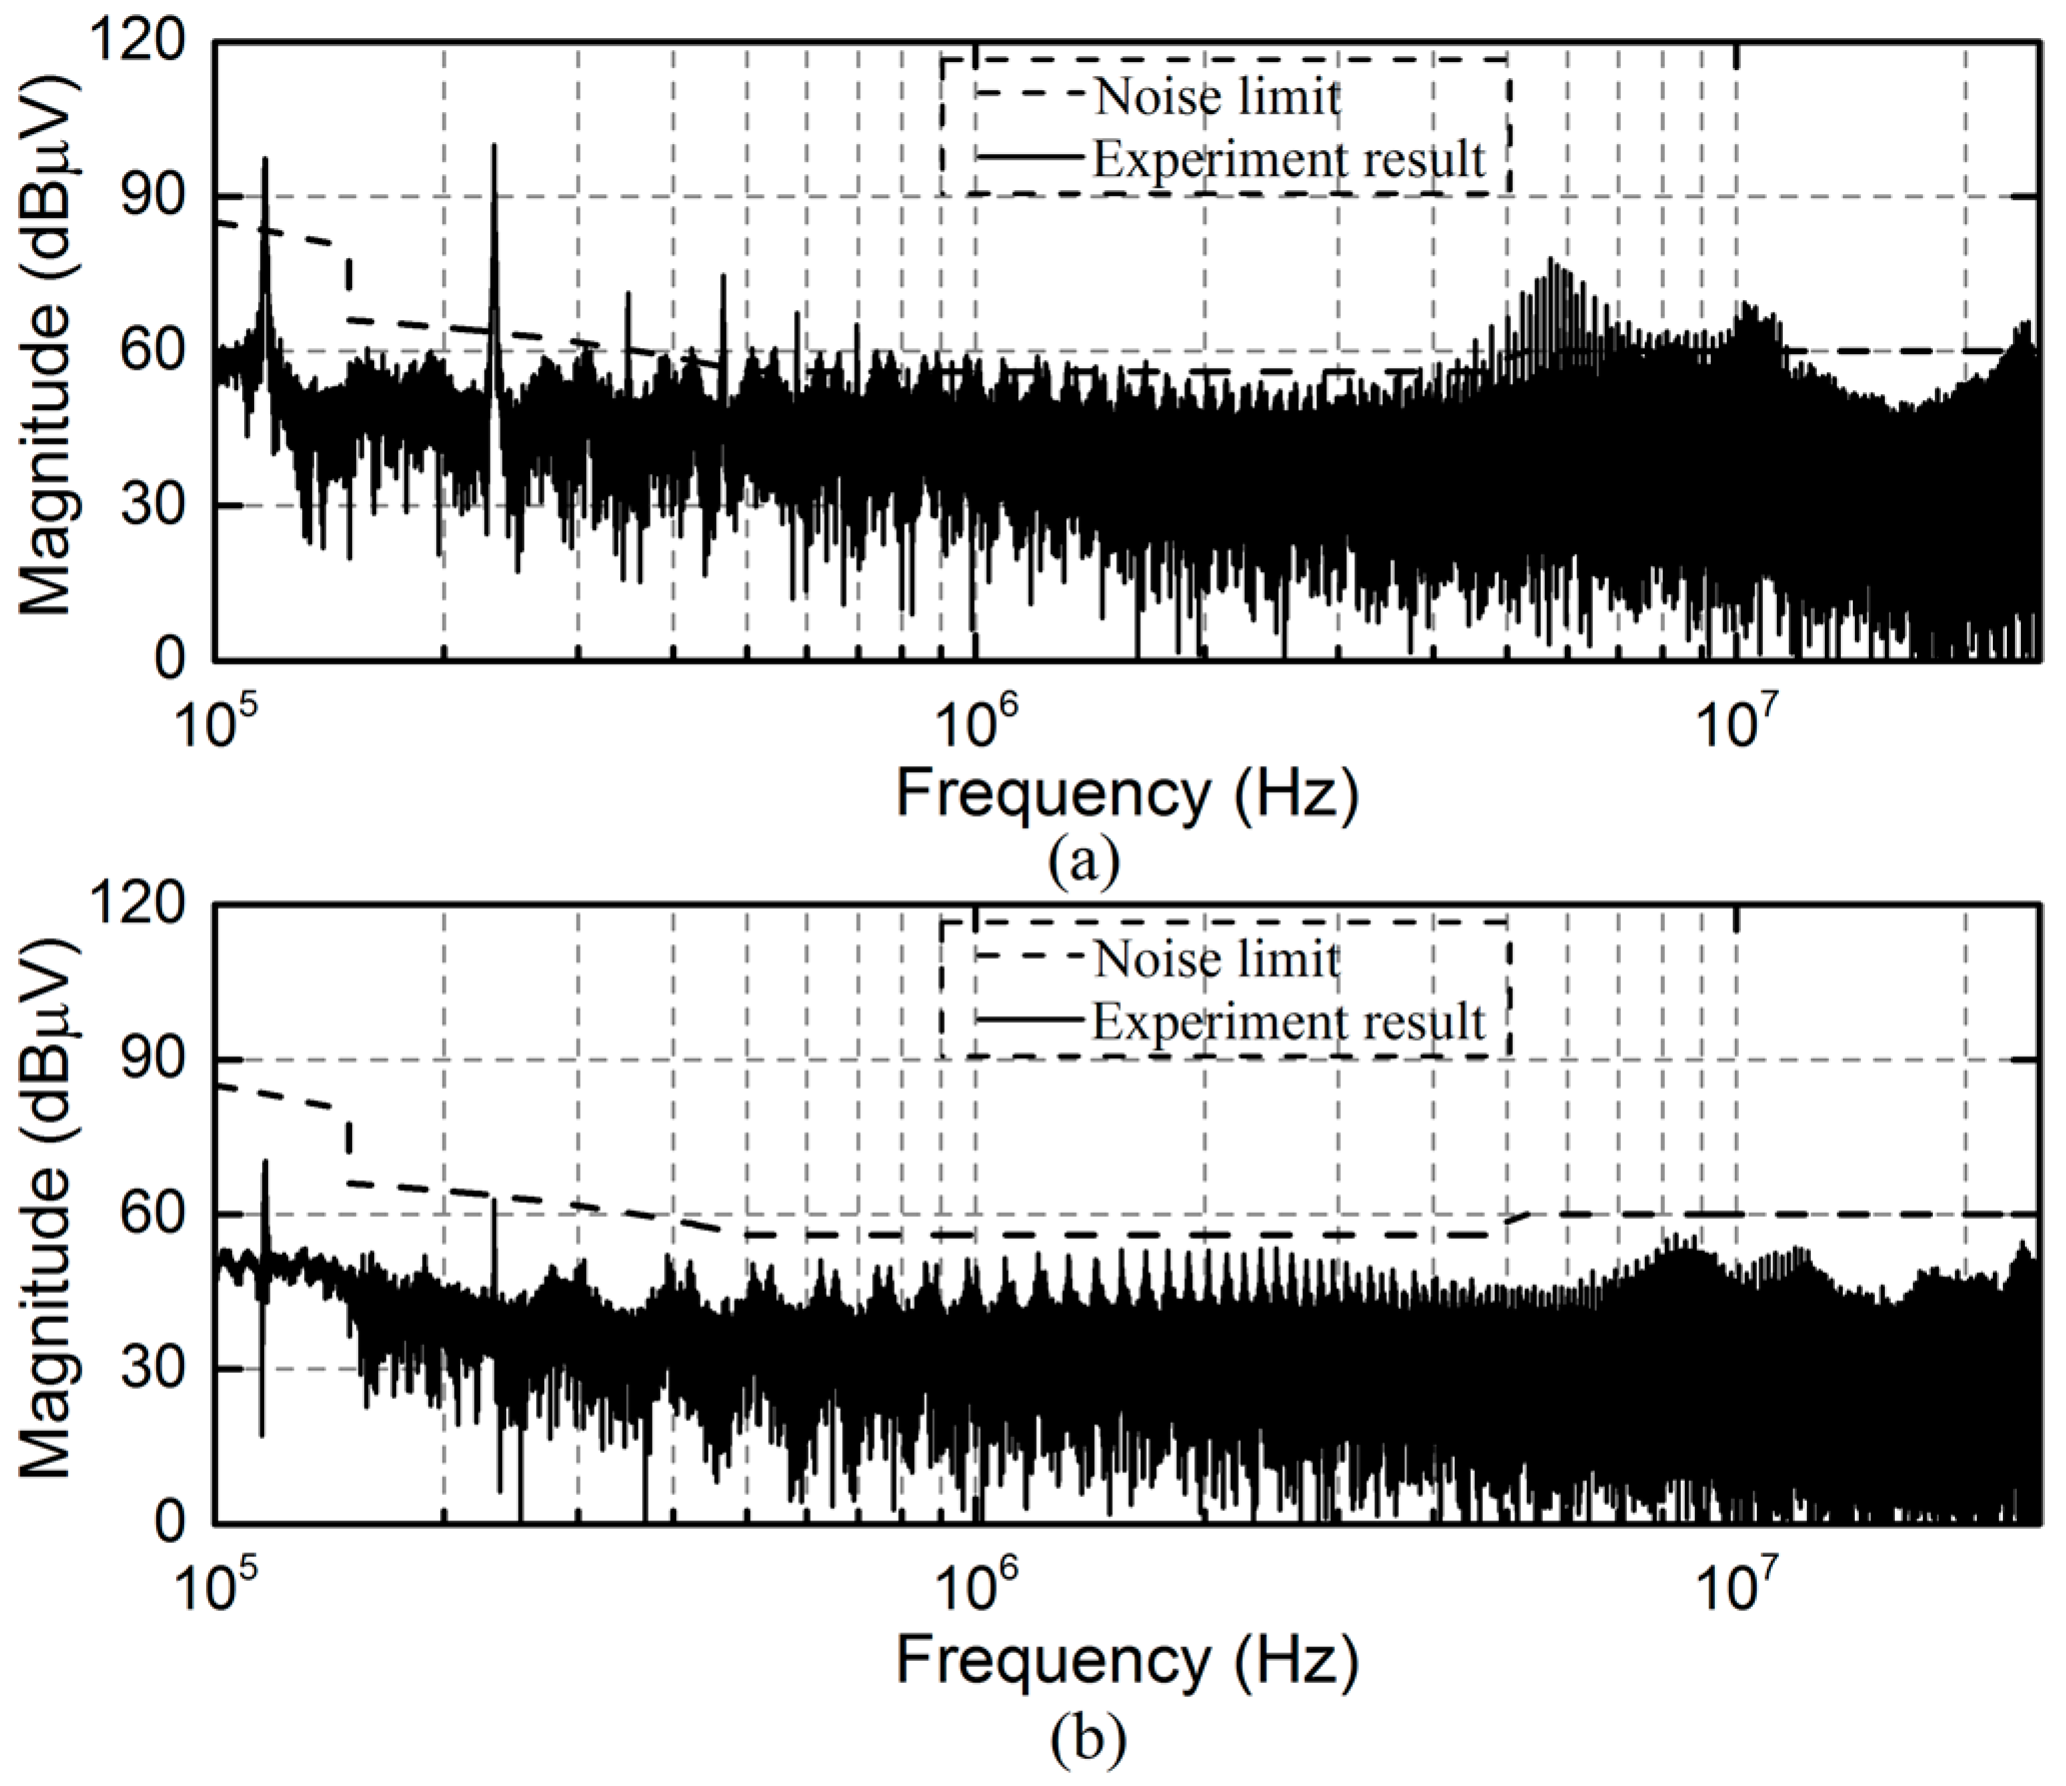
Figure 12 shows the EMI noise spectrum analysis with and without the EMI filter installation. It can be found that the first EMI peak noise happened at and the maximum magnitude happened at which has been derived in the previous section. The EMI noise spectrum analysis shown in Figure 12b shows that the noise across the spectrum is reduced apparently after the EMI filter installation, and the EMI filter has a better attenuation at a higher frequency.
Table 2 shows the THD analysis results, from which one can see that the THD of power frequency harmonics increased slightly due to the EMI filter installation, which has been expected. However, this minor deterioration is overwhelmed by the benefit of significant suppression of the conducted EMI in the kilohertz to megahertz range.
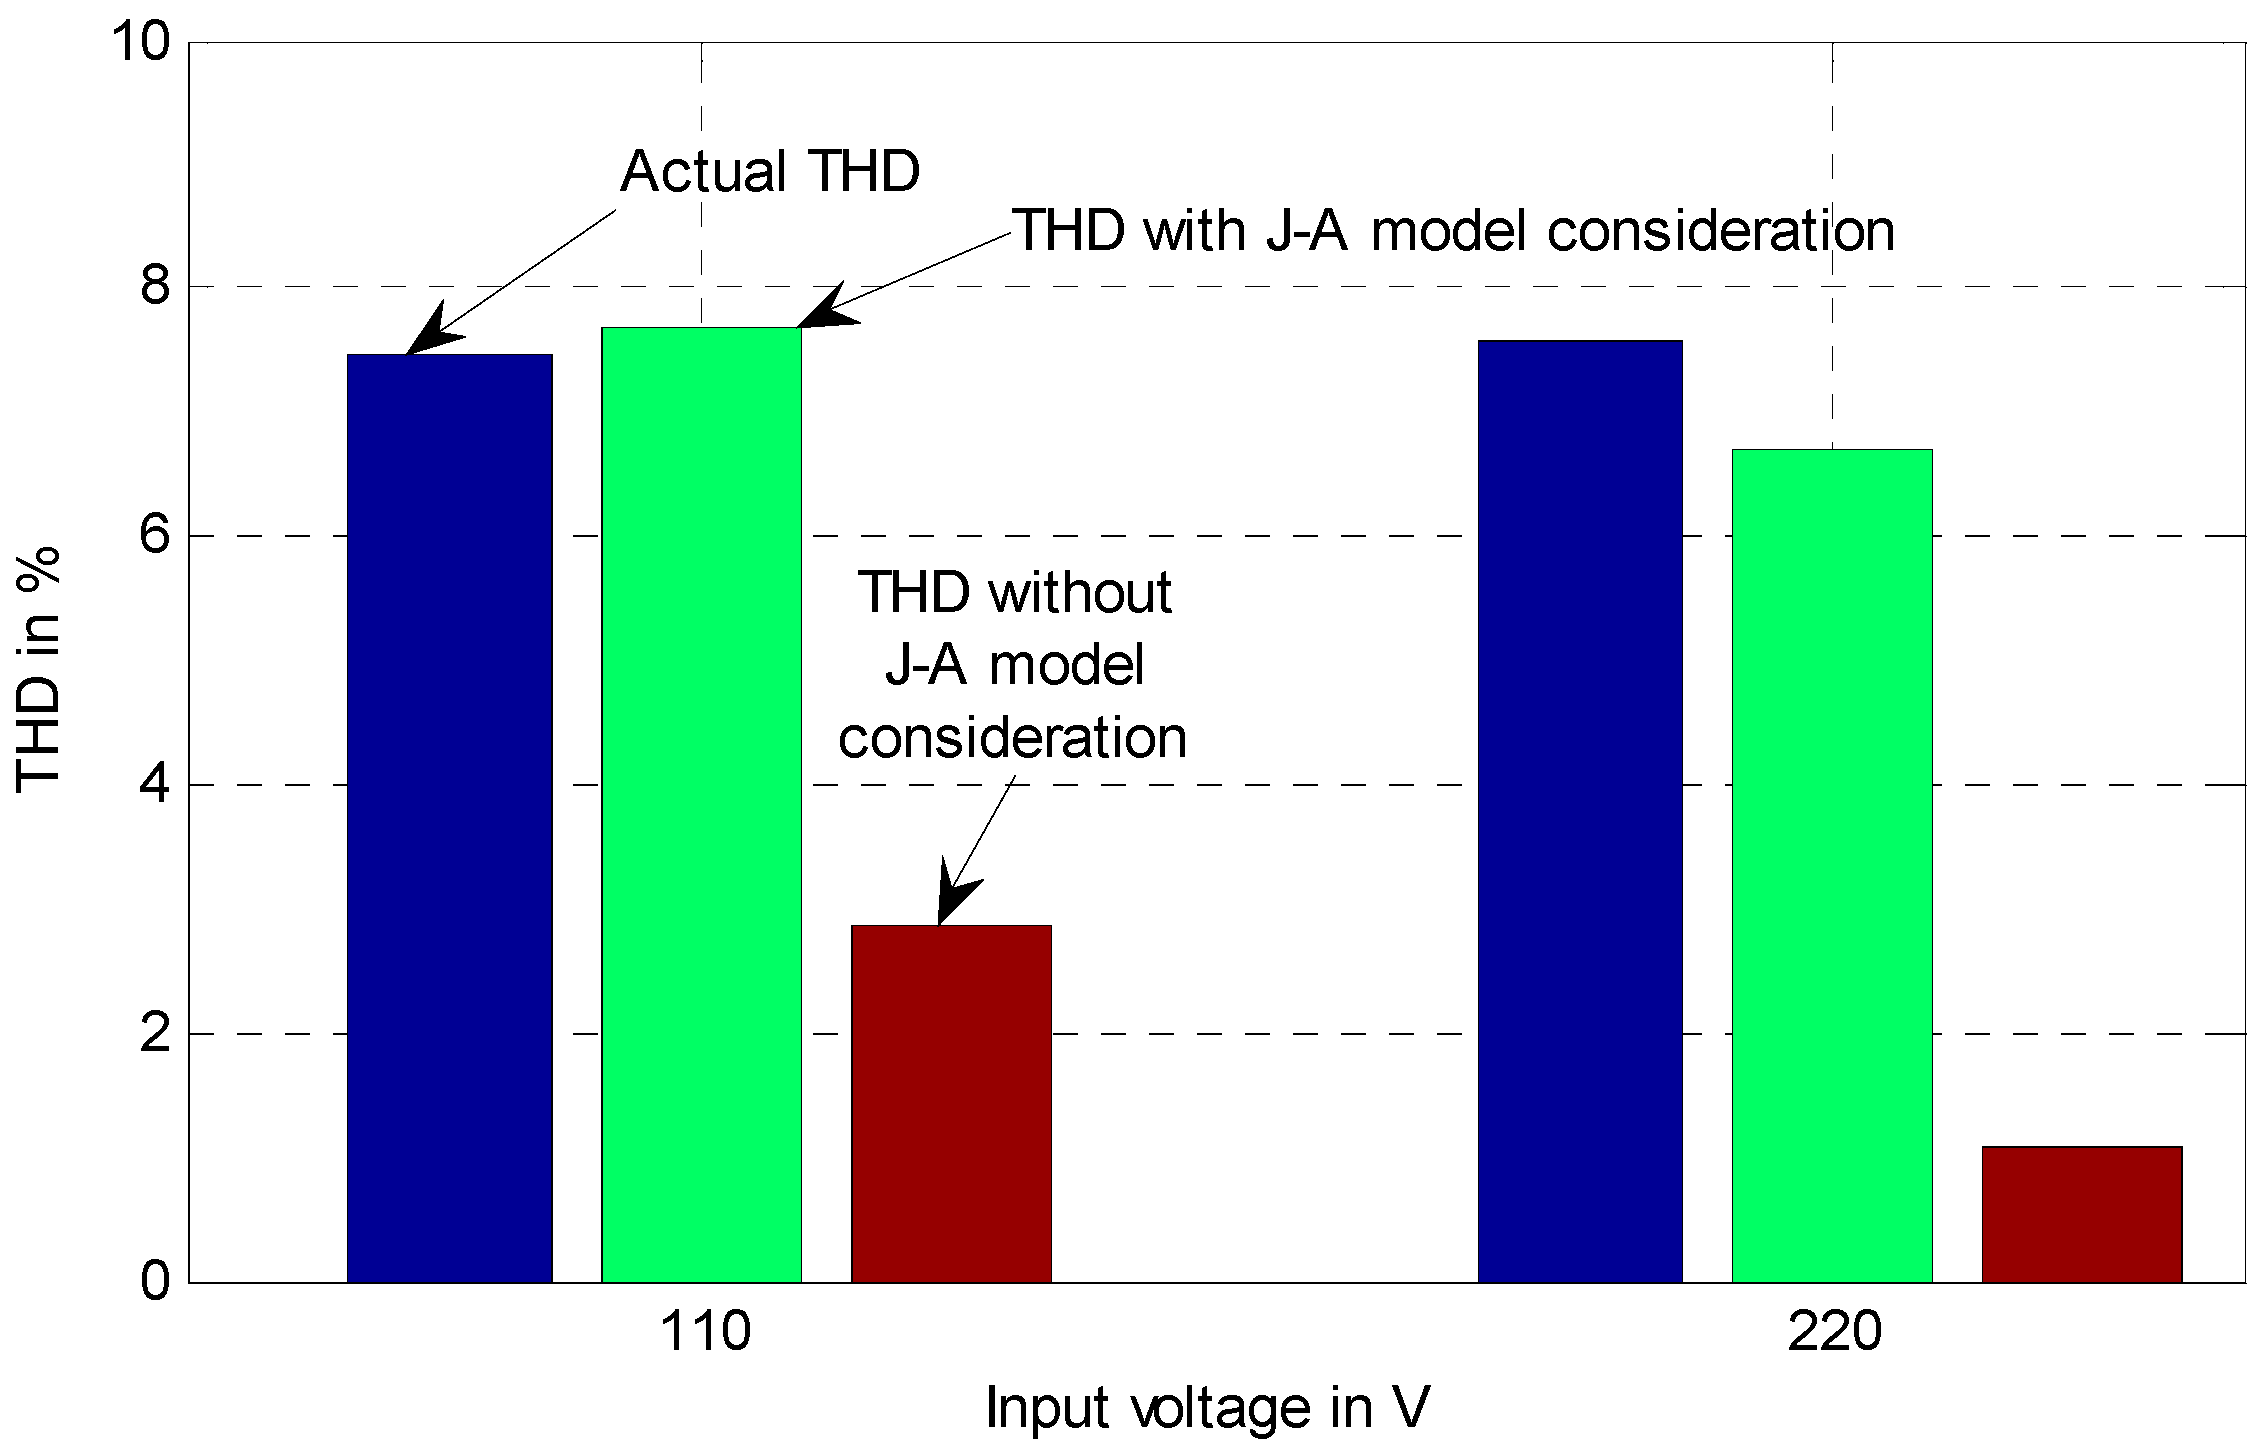
Figure 13 shows the input current THD analysis results with, and without, J-A model consideration. It can be found that the PFC circuit, if considering the inductor nonlinearity described by the J-A model, can predict the input currents accurately under different conditions. Comparing with the experimental results, it can be found that the predicted THD are accurate if considering the J-A model in the EMI filter. In real design, people will avoid saturation of the inductor. Using a larger magnetic core can avoid inductor saturation, but it also increases the weight and cost of the product. Using a smaller core is acceptable if it runs into the saturation area for a short time, so long as the reduced EMI noise passes the standard, as shown in Figure 12. The nonlinearity of the inductor not only happens in the saturation area, thus, the THD is impacted by the nonlinearity and saturation in this manuscript and using the J-A model could improve the accuracy of dynamic modeling.
6. Conclusions
An interleaved PFC converter can effectively reduce the ripple current due to its effective ripple current cancellation, but its production of conducted EMI noise due to the fast switching devices still could pose a threat to polluting the power mains and influence other electronic systems connected to the same power mains. Hence, an EMI filter is necessary to work together with the PFC converter to suppress the EMI noise and guarantees the harmonics compliance with the EMC standard. In this paper a comprehensive modeling of an interleaved PFC with an input EMI filter has been successfully implemented. In the modeling, the non-linearity of the EMI inductor was considered by adopting the J-A model, which has been shown to describe the hysteresis of the filtering inductor well. Overall, the system simulation results have been verified by the experimental ones. This comprehensive modeling is meaningful since it can predict THD performance of the designed circuit and reduce the product design cycle and cost.
Acknowledgments
The work was financially supported by the Foundations of Shenzhen Science and Technology Committee (JCYJ20160422165525693, GJHZ20150313093836007) and Shenzhen University Research and Development Startup Fund (2016042). The first author also acknowledges the support of the Microsystem and Terahertz Research Center in his attachment to China Academy of Engineering Physics.
Author Contributions
Yitao Liu conceived and designed the experiments; Shan Yin analyzed the data; Xuewei Pan performed the experiments; and Yitao Liu, Huaizhi Wang, Guibin Wang, and Jianchun Peng wrote and revised the paper.
Conflicts of Interest
The authors declare no conflict of interest.
References
- Electromagnetic compatibility (EMC). Part 3–2: Limits—Limits for Harmonic Current Emissions (Equipment Input Current under 16 A Per Phase); Int. Electrotech. Commiss: Geneva, Switzerland, 2006. [Google Scholar]
- Chang, L.-Y.; Chang, J.-H.; Chao, K.-H.; Chung, Y.-N. A Low-Cost High-Performance Interleaved Inductor-Coupled Boost Converter for Fuel Cells. Energies 2016, 9, 792. [Google Scholar] [CrossRef]
- Musavi, F.; Eberle, W.; Dunford, W.G. A high-performance single-phase bridgeless interleaved PFC converter for plug-in hybrid electric vehicle battery chargers. IEEE Trans. Ind. Appl. 2011, 47, 1833–1843. [Google Scholar] [CrossRef]
- CISPR16-1-1. Specification for Radio Disturbance and Immunity Measuring Apparatus and Methods Part 1–1: Radio Disturbance and Immunity Measuring Apparatus—Measuring Apparatus; Int. Electrotech. Commiss: Geneva, Switzerland, 2003.
- Caponet, M.C.; Profumo, F.; Tenconi, A. EMI filters design for power electronics. In Proceedings of the 2002 IEEE 33rd Annual Power Electronics Specialists Conference, Cairns, Australia, 23–27 June 2002; pp. 2027–2032. [Google Scholar]
- Raggl, K.; Nussbaumer, T.; Kolar, J.W. Guideline for a Simplified Differential-Mode EMI Filter Design. IEEE Trans. Ind. Electron. 2010, 57, 1031–1040. [Google Scholar] [CrossRef]
- Fei, Y.; Xinbo, R.; Qing, J.; Zhihong, Y. Input Differential-Mode EMI of CRM Boost PFC Converter. IEEE Trans. Power Electron. 2013, 28, 1177–1188. [Google Scholar] [CrossRef]
- Zhai, L.; Lin, L.; Zhang, X.; Song, C. The Effect of Distributed Parameters on Conducted EMI from DC-Fed Motor Drive Systems in Electric Vehicles. Energies 2017, 10, 1. [Google Scholar] [CrossRef]
- Said-Romdhane, M.; Naouar, M.; Belkhodja, I.; Monmasson, E. An Improved LCL Filter Design in Order to Ensure Stability without Damping and Despite Large Grid Impedance Variations. Energies 2017, 10, 336. [Google Scholar] [CrossRef]
- Srndovic, M.; Familiant, Y.; Grandi, G.; Ruderman, A. Time-Domain Minimization of Voltage and Current Total Harmonic Distortion for a Single-Phase Multilevel Inverter with a Staircase Modulation. Energies 2016, 9, 815. [Google Scholar] [CrossRef]
- Boteler, D.H. Characteristics of time-varying inductance. IEEE Trans. Mag. 1994, 30, 172–176. [Google Scholar] [CrossRef]
- Mastromauro, R.A.; Liserre, M.; Aquila, A.D. Study of the effects of inductor nonlinear behavior on the performance of current controllers for single-phase PV grid converters. IEEE Trans. Ind. Electron. 2008, 55, 2043–2052. [Google Scholar] [CrossRef]
- Safamehr, H.; Najafabadi, T.A.; Salmasi, F.R. Enhanced control of grid-connected inverters with non-linear inductor in LCL filter. IET Power Electron. 2016, 9, 2111–2120. [Google Scholar] [CrossRef]
- Bernard, Y.; Mendes, E.; Bouillault, F. Dynamic hysteresis modeling based on Preisach model. IEEE Trans. Magn. 2002, 38, 885–888. [Google Scholar] [CrossRef]
- Jiles, D.C.; Atherton, D.L. Theory of ferromagnetic hysteresis. J. Magn. Magn. Mater. 1986, 61, 48–60. [Google Scholar] [CrossRef]
- Fei, Y.; Xinbo, R.; Yang, Y.; Zhihong, Y. Interleaved Critical Current Mode Boost PFC Converter with Coupled Inductor. IEEE Trans. Power Electron. 2011, 26, 2404–2413. [Google Scholar] [CrossRef]
- Liu, Y.; See, K.Y.; Tseng, K.-J. Conducted EMI Prediction of the PFC Converter Including Nonlinear Behavior of Boost Inductor. IEEE Trans. Electromagn. Compat. 2013, 55, 1107–1114. [Google Scholar]
- Zhang, H.; Wang, S.; Li, Y.; Wang, Q.; Fu, D. Two-capacitor transformer winding capacitance models for common-mode EMI noise analysis in isolated DC-DC converters. IEEE Trans. Power Electron. 2017, 32, 8458–8469. [Google Scholar] [CrossRef]
- Liu, Y.; Zhang, D. Comprehensive Modeling of Resonant Inverter for Driving Fluorescent Lamp With the Consideration of Nonlinear Magnetization of Inductor. IEEE Trans. Magn. 2011, 47, 4318–4321. [Google Scholar] [CrossRef]
- Díez, P. A note on the convergence of the secant method for simple and multiple roots. Appl. Math. Lett. 2003, 16, 1211–1215. [Google Scholar] [CrossRef] [Green Version]
- Stuart, T.A.; Shaoyan, Y. Computer simulation of IGBT losses in PFC circuits. IEEE Trans. Aerosp. Electron. Syst. 1995, 31, 1167–1173. [Google Scholar] [CrossRef]
- Krug, F.; Russer, P. Quasi-peak detector model for a time-domain measurement system. IEEE Trans. Electromagn. Compat. 2005, 47, 320–326. [Google Scholar] [CrossRef]
Figure 1.
Average current control block of the system.
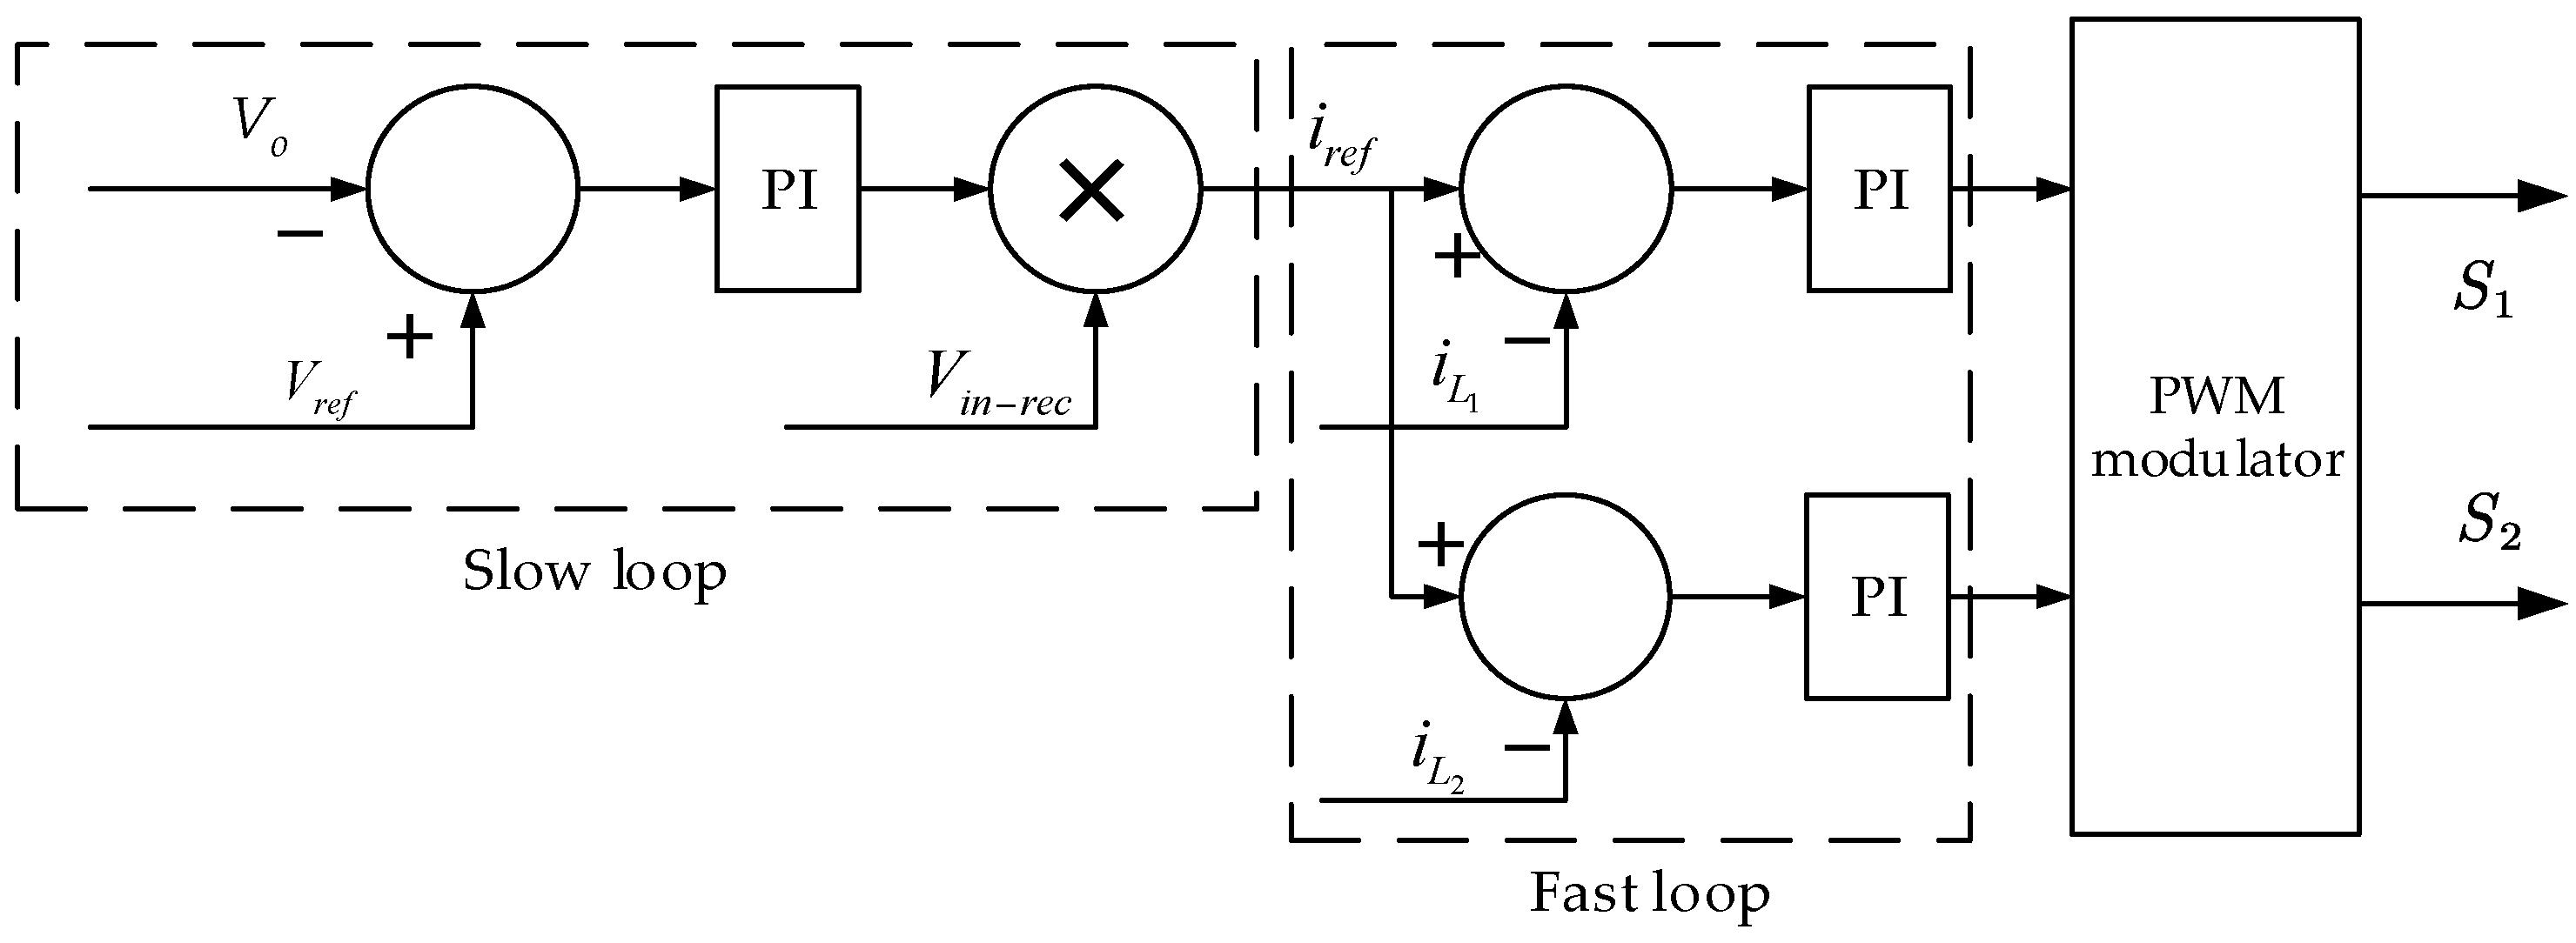
Figure 2.
DM circulation in the interleaved PFC.

Figure 3.
DM noise model for the interleaved PFC converter.
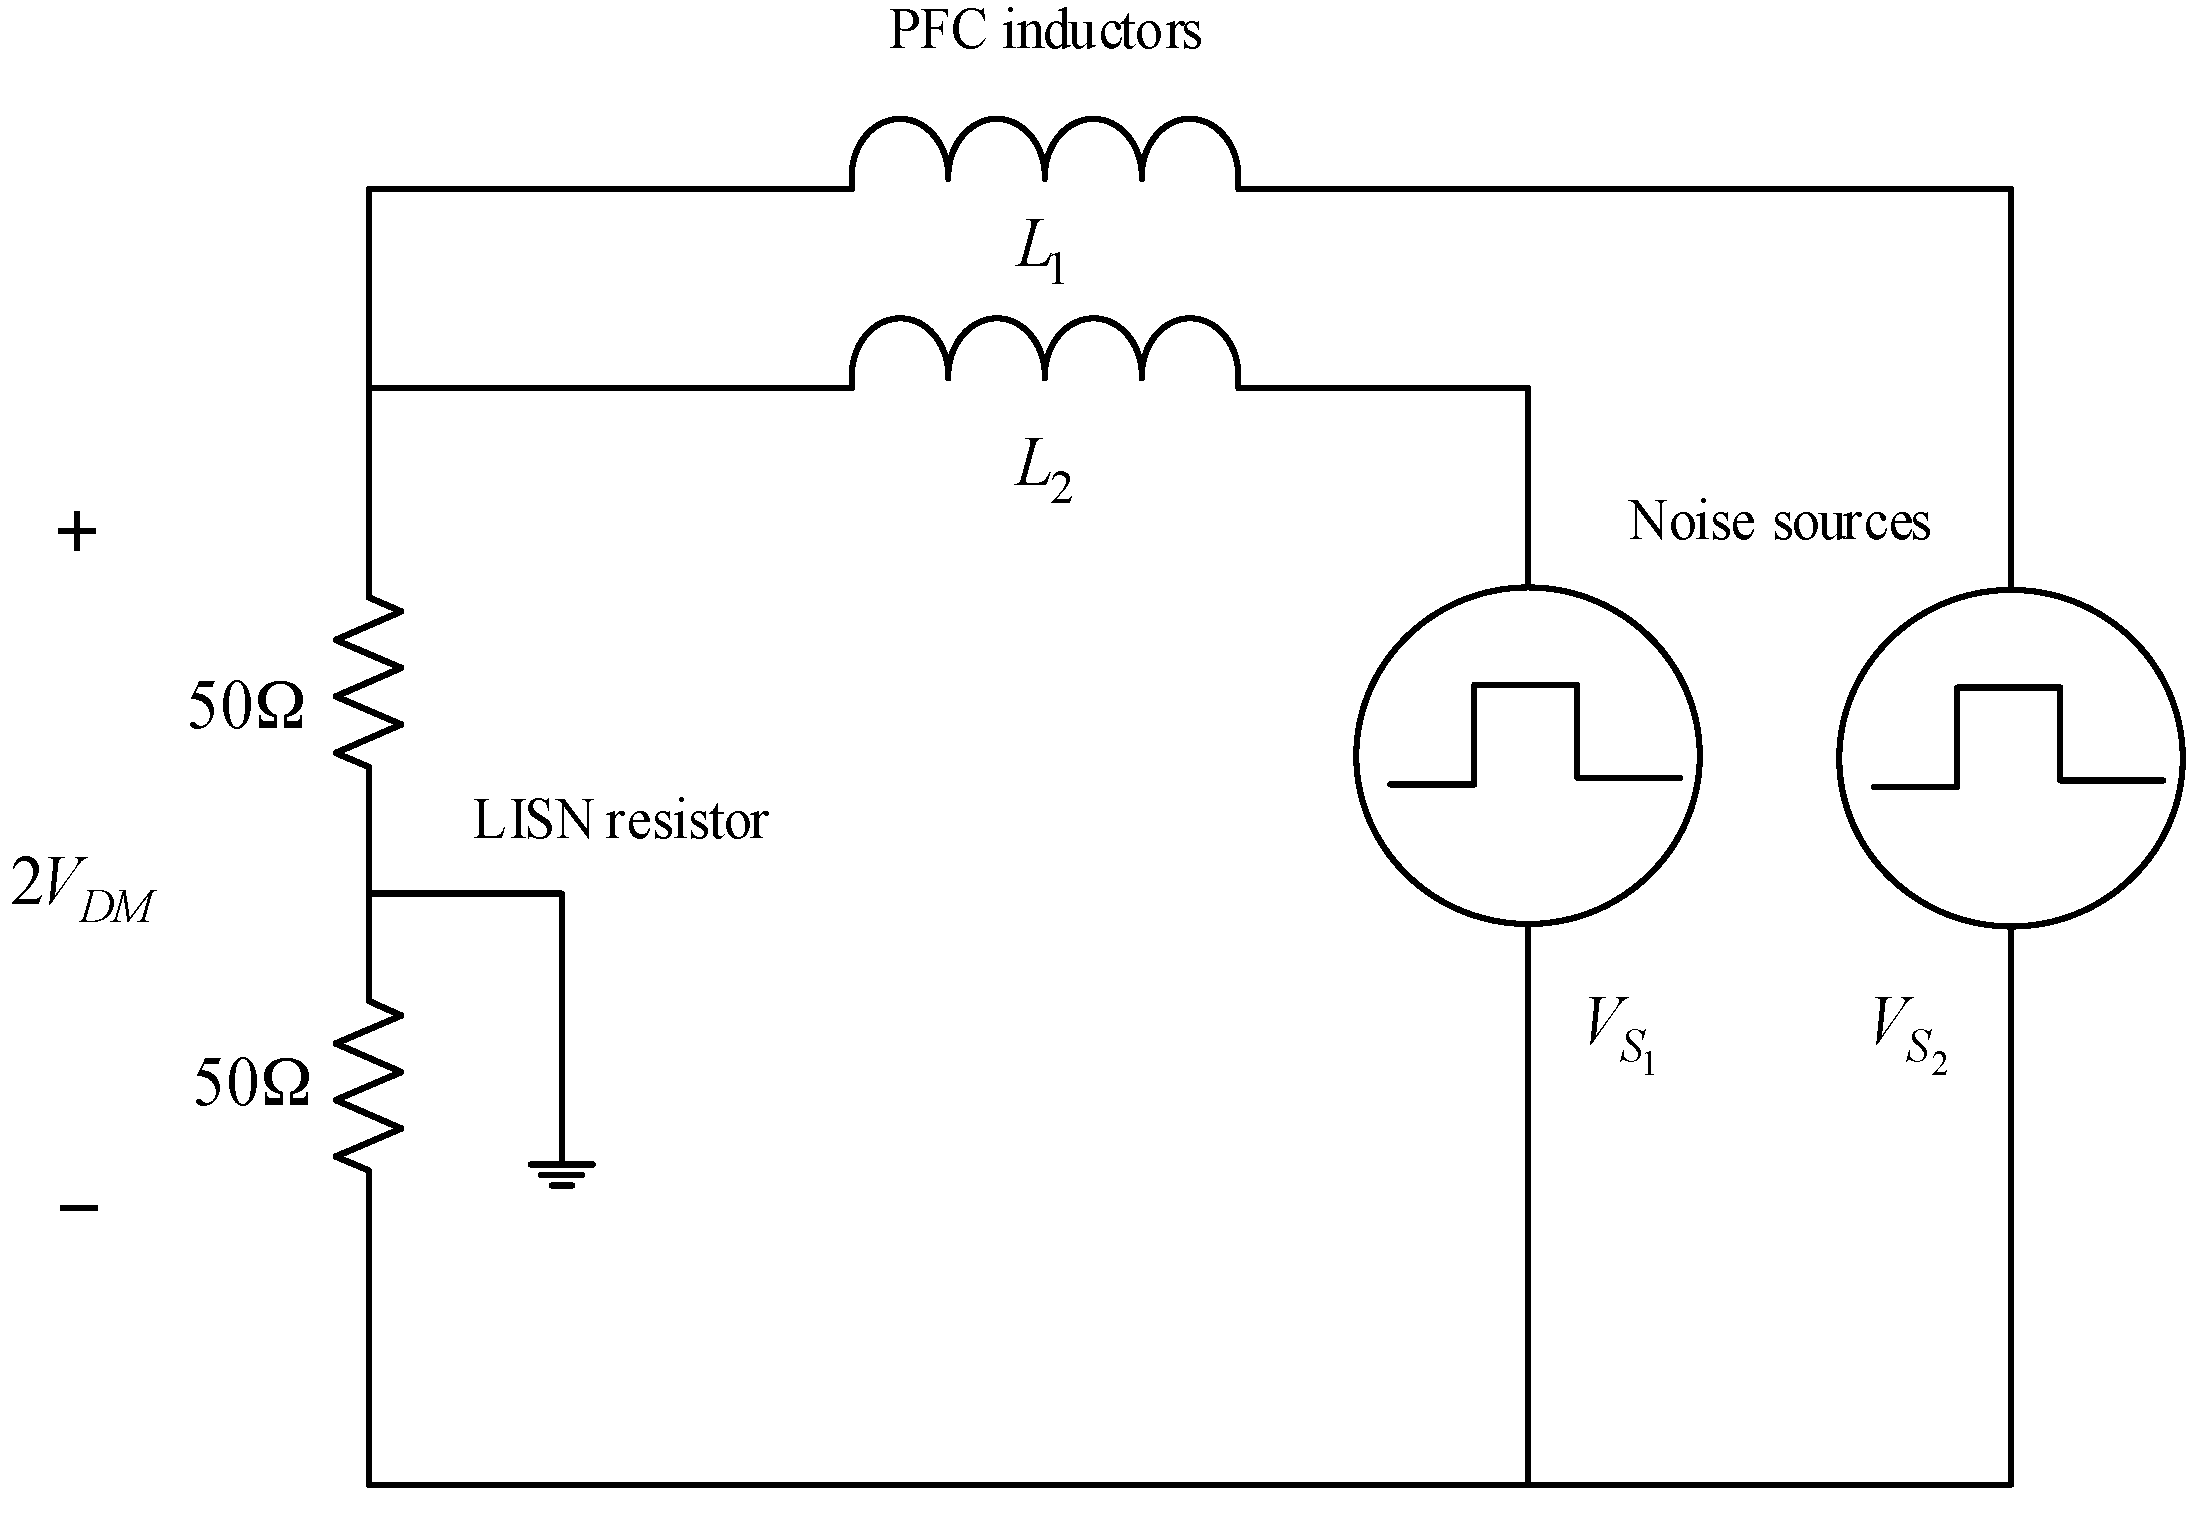
Figure 4.
Implementation of the J-A hysteresis model in the PFC converter.

Figure 5.
Configuration of the simulated PFC block.
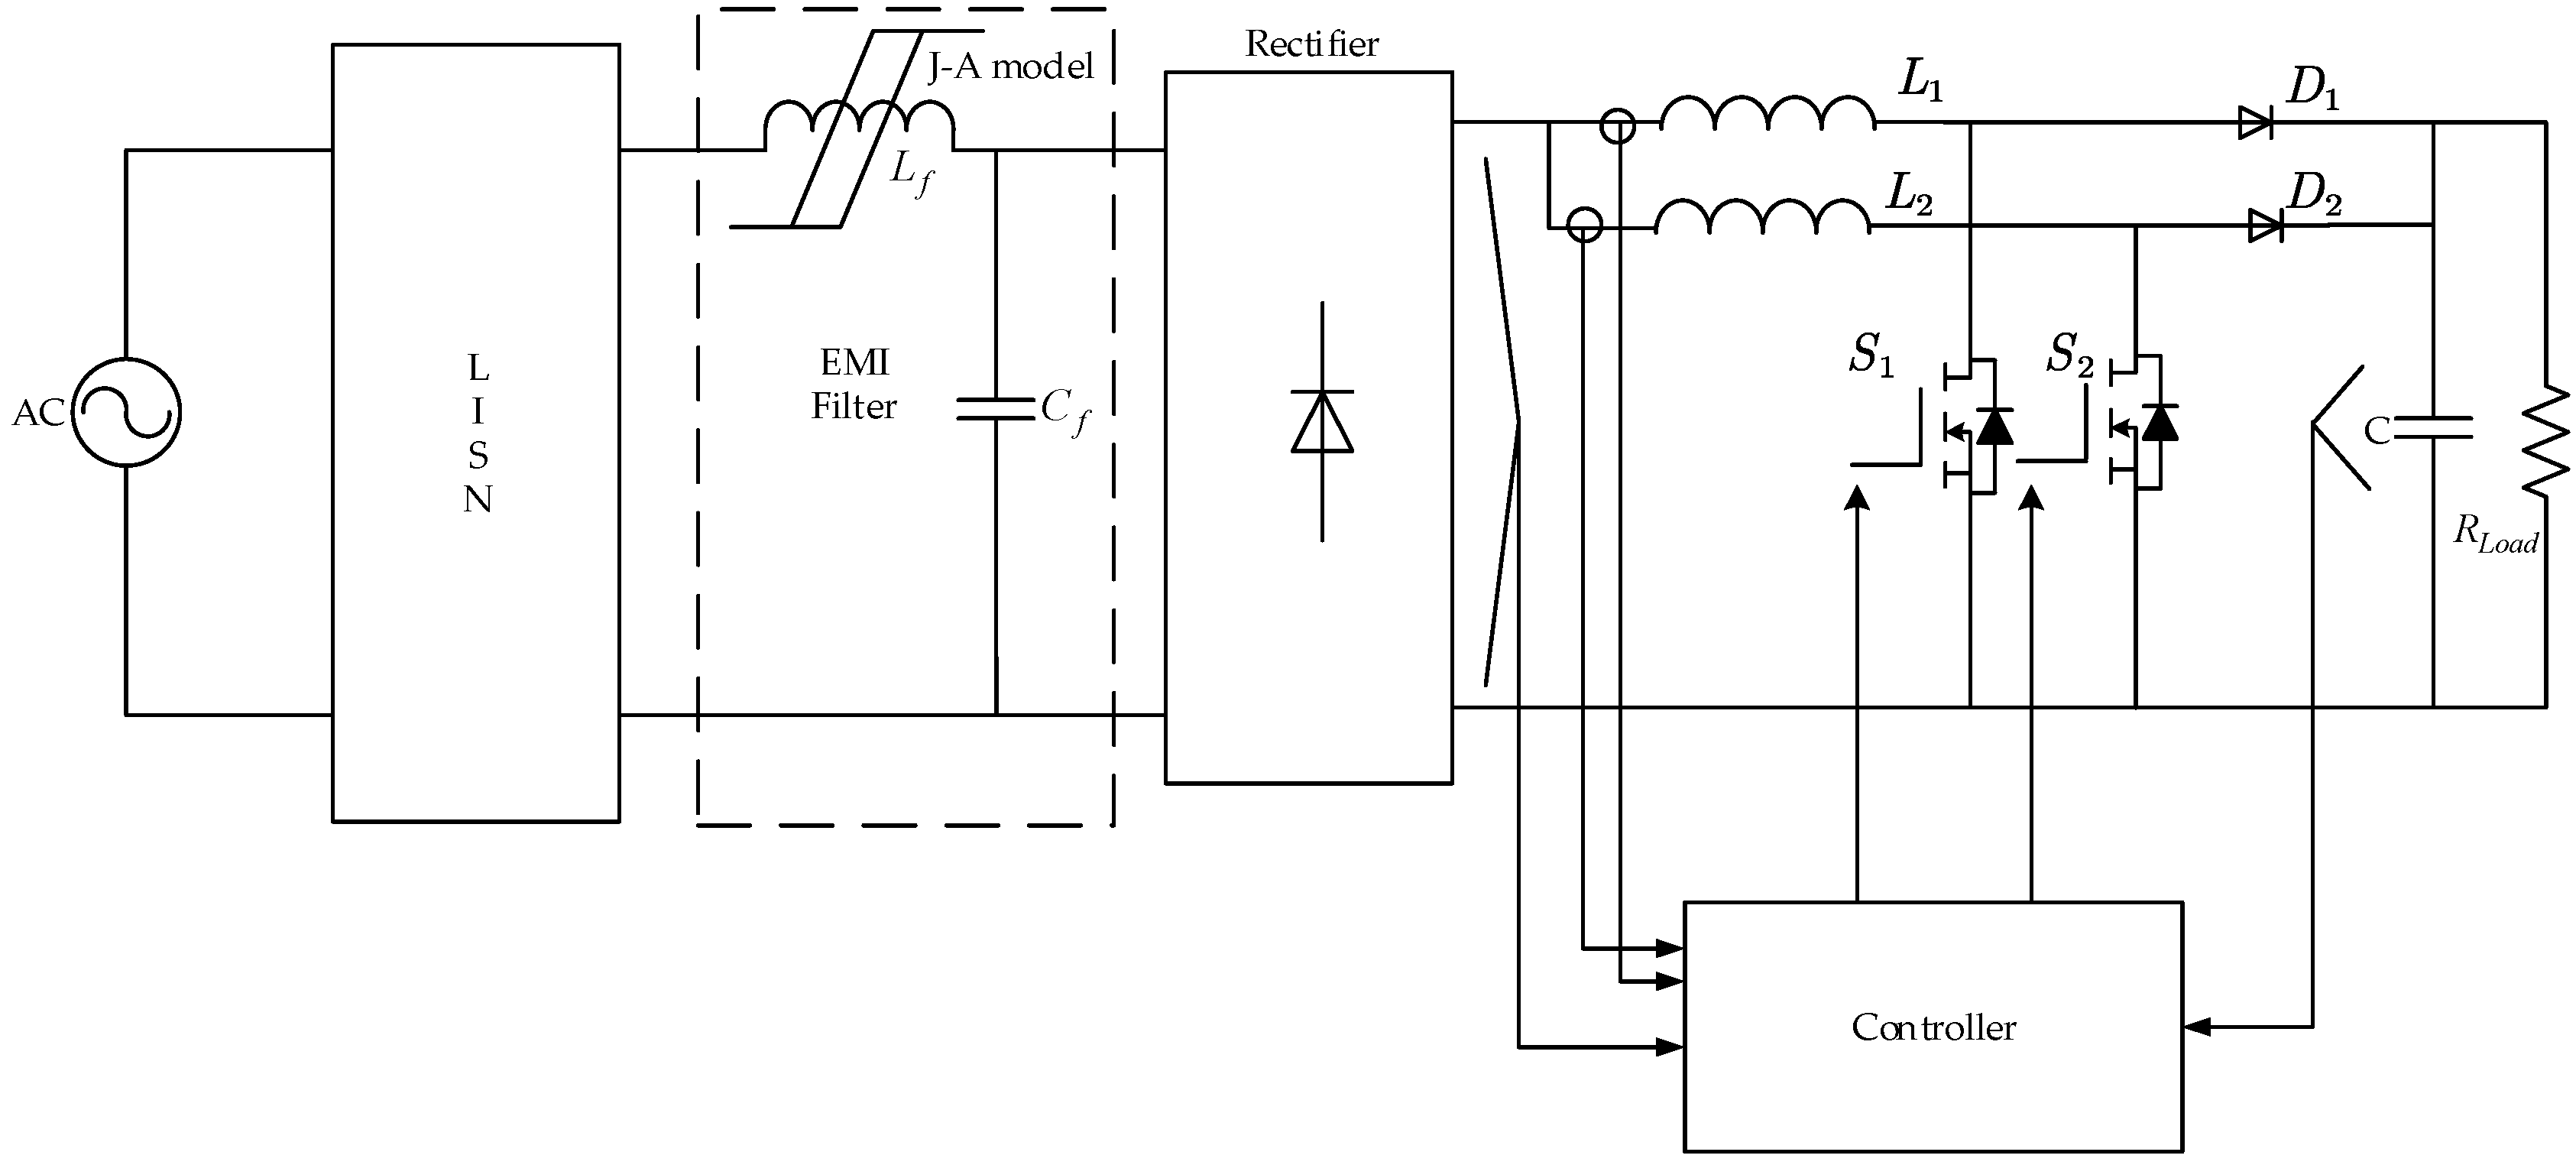
Figure 6.
Relationship between the magnetic field and magnetization; (a) ; and (b)
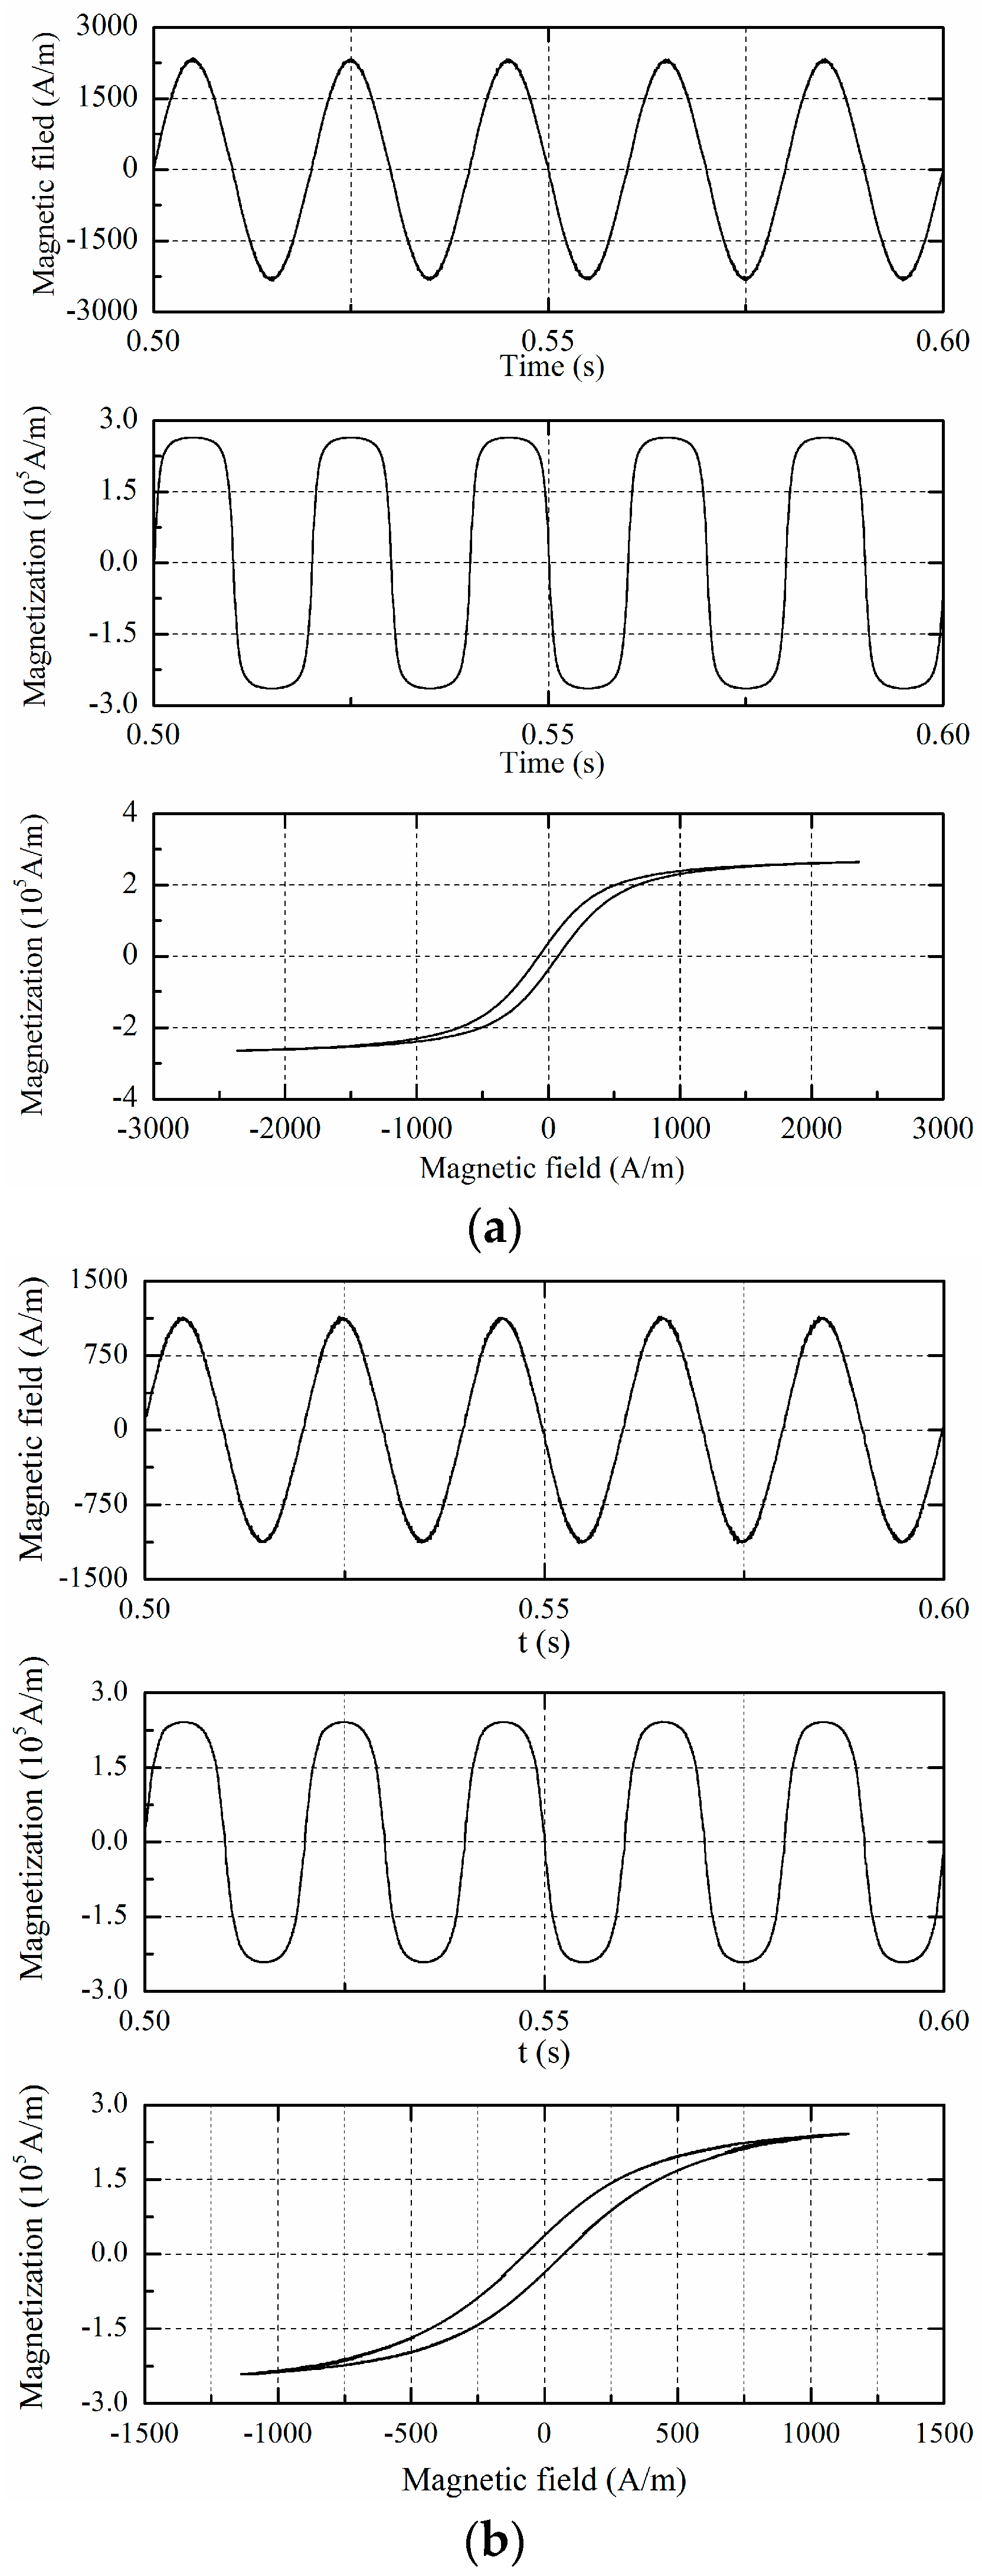
Figure 7.
Inductor currents and input current with J-A model consideration; (a) ; and (b)

Figure 8.
Zoom in current ripple; (a), = 110 V; and (b) = 220 V.

Figure 9.
PFC input voltage, current, and output voltage with J-A model consideration; (a) ; and (b) .
Figure 9.
PFC input voltage, current, and output voltage with J-A model consideration; (a) ; and (b) .

Figure 10.
EMI measurement setup.

Figure 11.
Spectrum calculation setup.
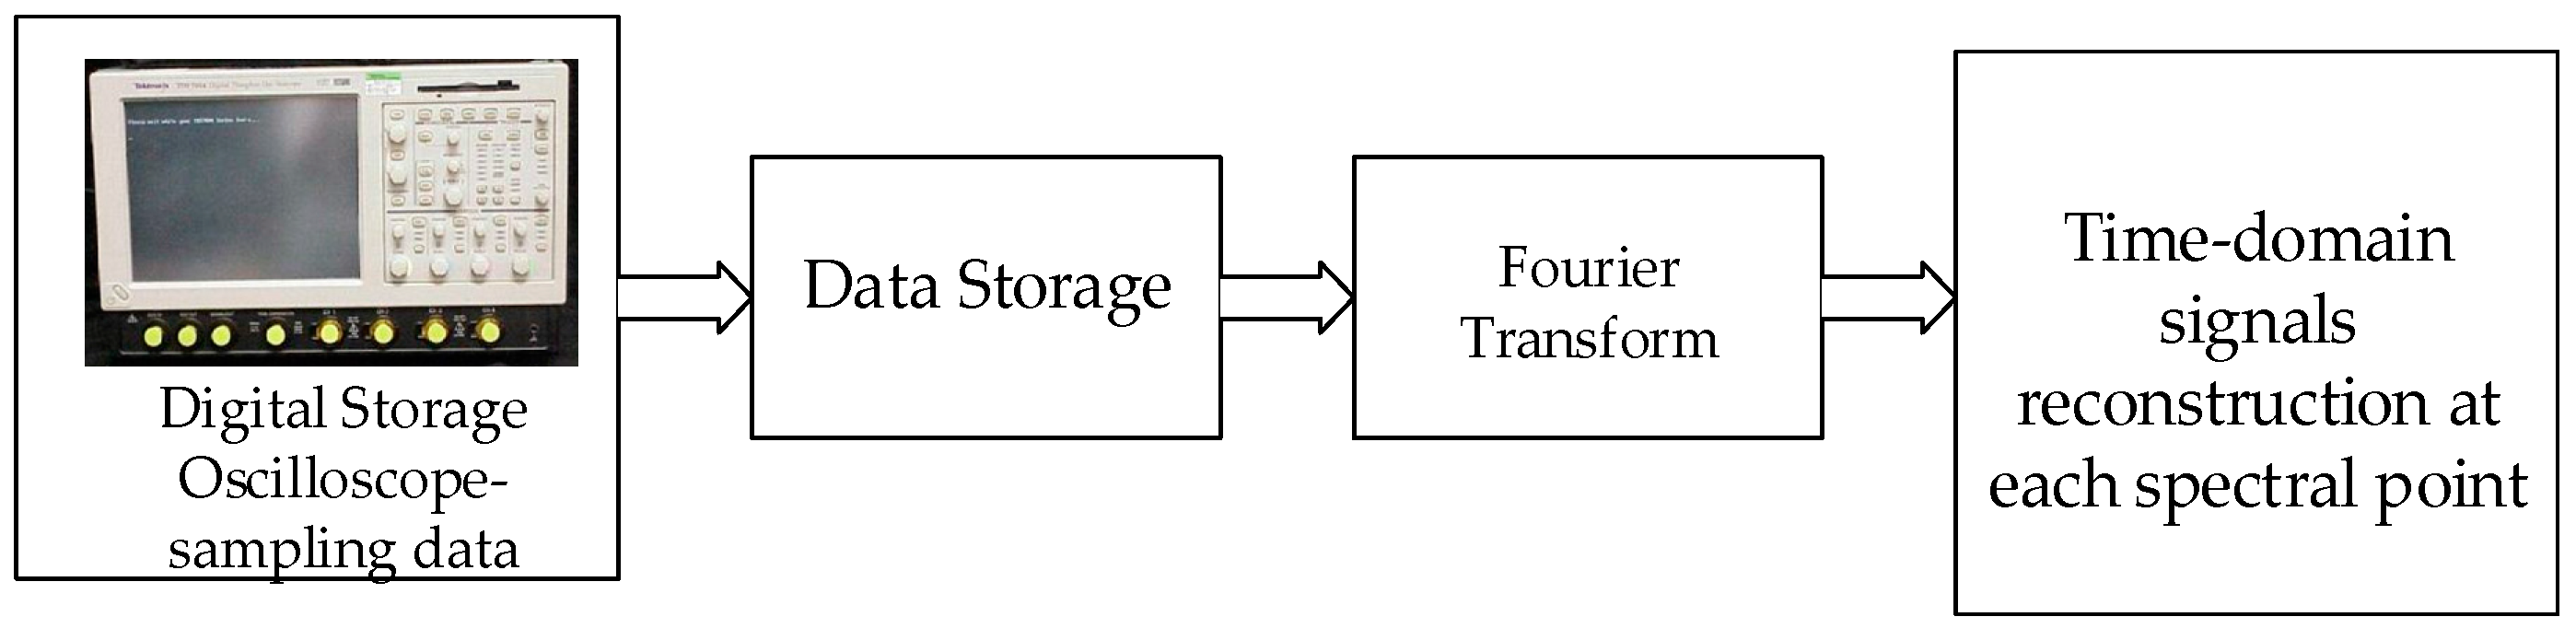
Figure 12.
DM EMI noise, (a) without the EMI filter, and (b) with the EMI filter.

Figure 13.
Input current THD analysis result with, and without, J-A model consideration.


Table 1.
PFC converter specifications and parameters.
| Specifications and Parameters | |
|---|---|
| Input AC voltage(rms) | 85–265 V |
| Power frequency | 50 Hz |
| Output DC voltage | 390 V |
| Switching frequency | 116.5 kHz |
| Output power | 195 W |
Table 2.
THD analysis results.
| Input Voltage | THD (without EMI Filter) | THD (with EMI Filter) |
|---|---|---|
| 110 V | 6.51% | 7.46% |
| 220 V | 5.45% | 7.57% |
© 2017 by the authors. Licensee MDPI, Basel, Switzerland. This article is an open access article distributed under the terms and conditions of the Creative Commons Attribution (CC BY) license (http://creativecommons.org/licenses/by/4.0/).
Share and Cite
MDPI and ACS Style
Liu, Y.; Yin, S.; Pan, X.; Wang, H.; Wang, G.; Peng, J. Effects of Nonlinearity in Input Filter on the Dynamic Behavior of an Interleaved Boost PFC Converter. Energies 2017, 10, 1530. https://doi.org/10.3390/en10101530
AMA Style
Liu Y, Yin S, Pan X, Wang H, Wang G, Peng J. Effects of Nonlinearity in Input Filter on the Dynamic Behavior of an Interleaved Boost PFC Converter. Energies. 2017; 10(10):1530. https://doi.org/10.3390/en10101530
Chicago/Turabian StyleLiu, Yitao, Shan Yin, Xuewei Pan, Huaizhi Wang, Guibin Wang, and Jianchun Peng. 2017. "Effects of Nonlinearity in Input Filter on the Dynamic Behavior of an Interleaved Boost PFC Converter" Energies 10, no. 10: 1530. https://doi.org/10.3390/en10101530
Note that from the first issue of 2016, this journal uses article numbers instead of page numbers. See further details here.