Gas-In-Place Estimate for Potential Gas Hydrate Concentrated Zone in the Kumano Basin, Nankai Trough Forearc, Japan


1
Department of Geology & Geophysics, University of Hawaii at Manoa, Honolulu, HI 96822, USA
2
Department of Geography, University of Hawaii at Manoa, Honolulu, HI 96822, USA
3
Research and Development Center for Earthquake and Tsunami, Japan Agency for Marine-Earth Science and Technology, Yokohama, Kanagawa 236-0001, Japan
*
Author to whom correspondence should be addressed.
Energies 2017, 10(10), 1552; https://doi.org/10.3390/en10101552
Submission received: 4 August 2017
/
Revised: 15 September 2017
/
Accepted: 19 September 2017
/
Published: 9 October 2017
(This article belongs to the Special Issue Methane Hydrate Research and Development)
Abstract
:Methane hydrate concentrated zones (MHCZs) have become targets for energy exploration along continental margins worldwide. In 2013, exploratory drilling in the eastern Nankai Trough at Daini Atsumi Knoll confirmed that MHCZs tens of meters thick occur directly above bottom simulating reflections imaged in seismic data. This study uses 3-dimensional (3D) seismic and borehole data collected from the Kumano Basin offshore Japan to identify analogous MHCZs. Our survey region is located ~100 km southwest of the Daini Atsumi Knoll, site of the first offshore gas hydrate production trial. Here we provide a detailed analysis of the gas hydrate system within our survey area of the Kumano forearc including: (1) the 3D spatial distribution of bottom simulating reflections; (2) a thickness map of potential MHCZs; and (3) a volumetric gas-in-place estimate for these MHCZs using constraints from our seismic interpretations as well as previously collected borehole data. There is evidence for two distinct zones of concentrated gas hydrate 10–90 m thick, and we estimate that the amount of gas-in-place potentially locked up in these MHCZs is 1.9–46.3 trillion cubic feet with a preferred estimate of 15.8 trillion cubic feet.
1. Introduction
Natural gas hydrates (GH) are crystalline inclusion compounds that form within the pore space of marine sediments along continental margins worldwide. These hydrate deposits are stable at specific pressure-temperature relationships, host highly compressed gas molecules (most commonly methane), and are proposed to be the largest dynamic reservoir of organic carbon on this planet [1,2,3]. GHs have enticed global interest for several reasons including climate change and potential slope stability hazards, but primarily because these deposits could prove to be an unconventional energy resource [3,4]. At the exploration stage, it is important to develop systematic GH exploration methods that consider gas source, migration mechanisms into the hydrate stability field, zones of free gas, indicators of gas hydrate accumulation, and at least a first order volumetric gas-in-place estimate for apparent zones of concentrated hydrates [5,6].
Seismic imaging is an important tool for identifying GH because both GH and free gas alter the physical properties of marine sediments, which will in turn affect the travel path and attenuation of the seismic wavelet [7,8,9]. Concentrated hydrate deposits tend to form at and just above the base of gas hydrate stability (BGHS). This results in a sharp contrast in mechanical properties at the phase boundary between GH saturated layers overlying a zone where free gas, water, and potentially non-cementing hydrate occupy the pore space [10]. This contrast in physical properties is expressed in seismic data as bottom simulating reflections (BSRs), and BSRs remain our strongest remotely sensed indicator to infer the presence of GH [11]. Constraints from wells, and ideally pressure cores, are an essential second step for confirming hydrate occurrence and for estimating the amount of gas present in a given hydrate reservoir [12].
This study uses high-resolution, 3-dimensional (3D) seismic reflection data combined with Integrated Ocean Drilling Program (IODP) borehole data collected through the Kumano Basin, off Kii Penisula, Japan, at Sites C0009 and C0002 to: (1) identify and map potential zones of concentrated gas hydrate in our survey region; and (2) calculate a volumetric gas-in-place estimate for these newly mapped MHCZs using constraints from borehole data. Our study site is an exceptional location to assess a gas hydrate system because there is a wealth of scientific drilling data available to constrain our seismic interpretations.
2. Geologic Setting
2.1. Tectonic Environment
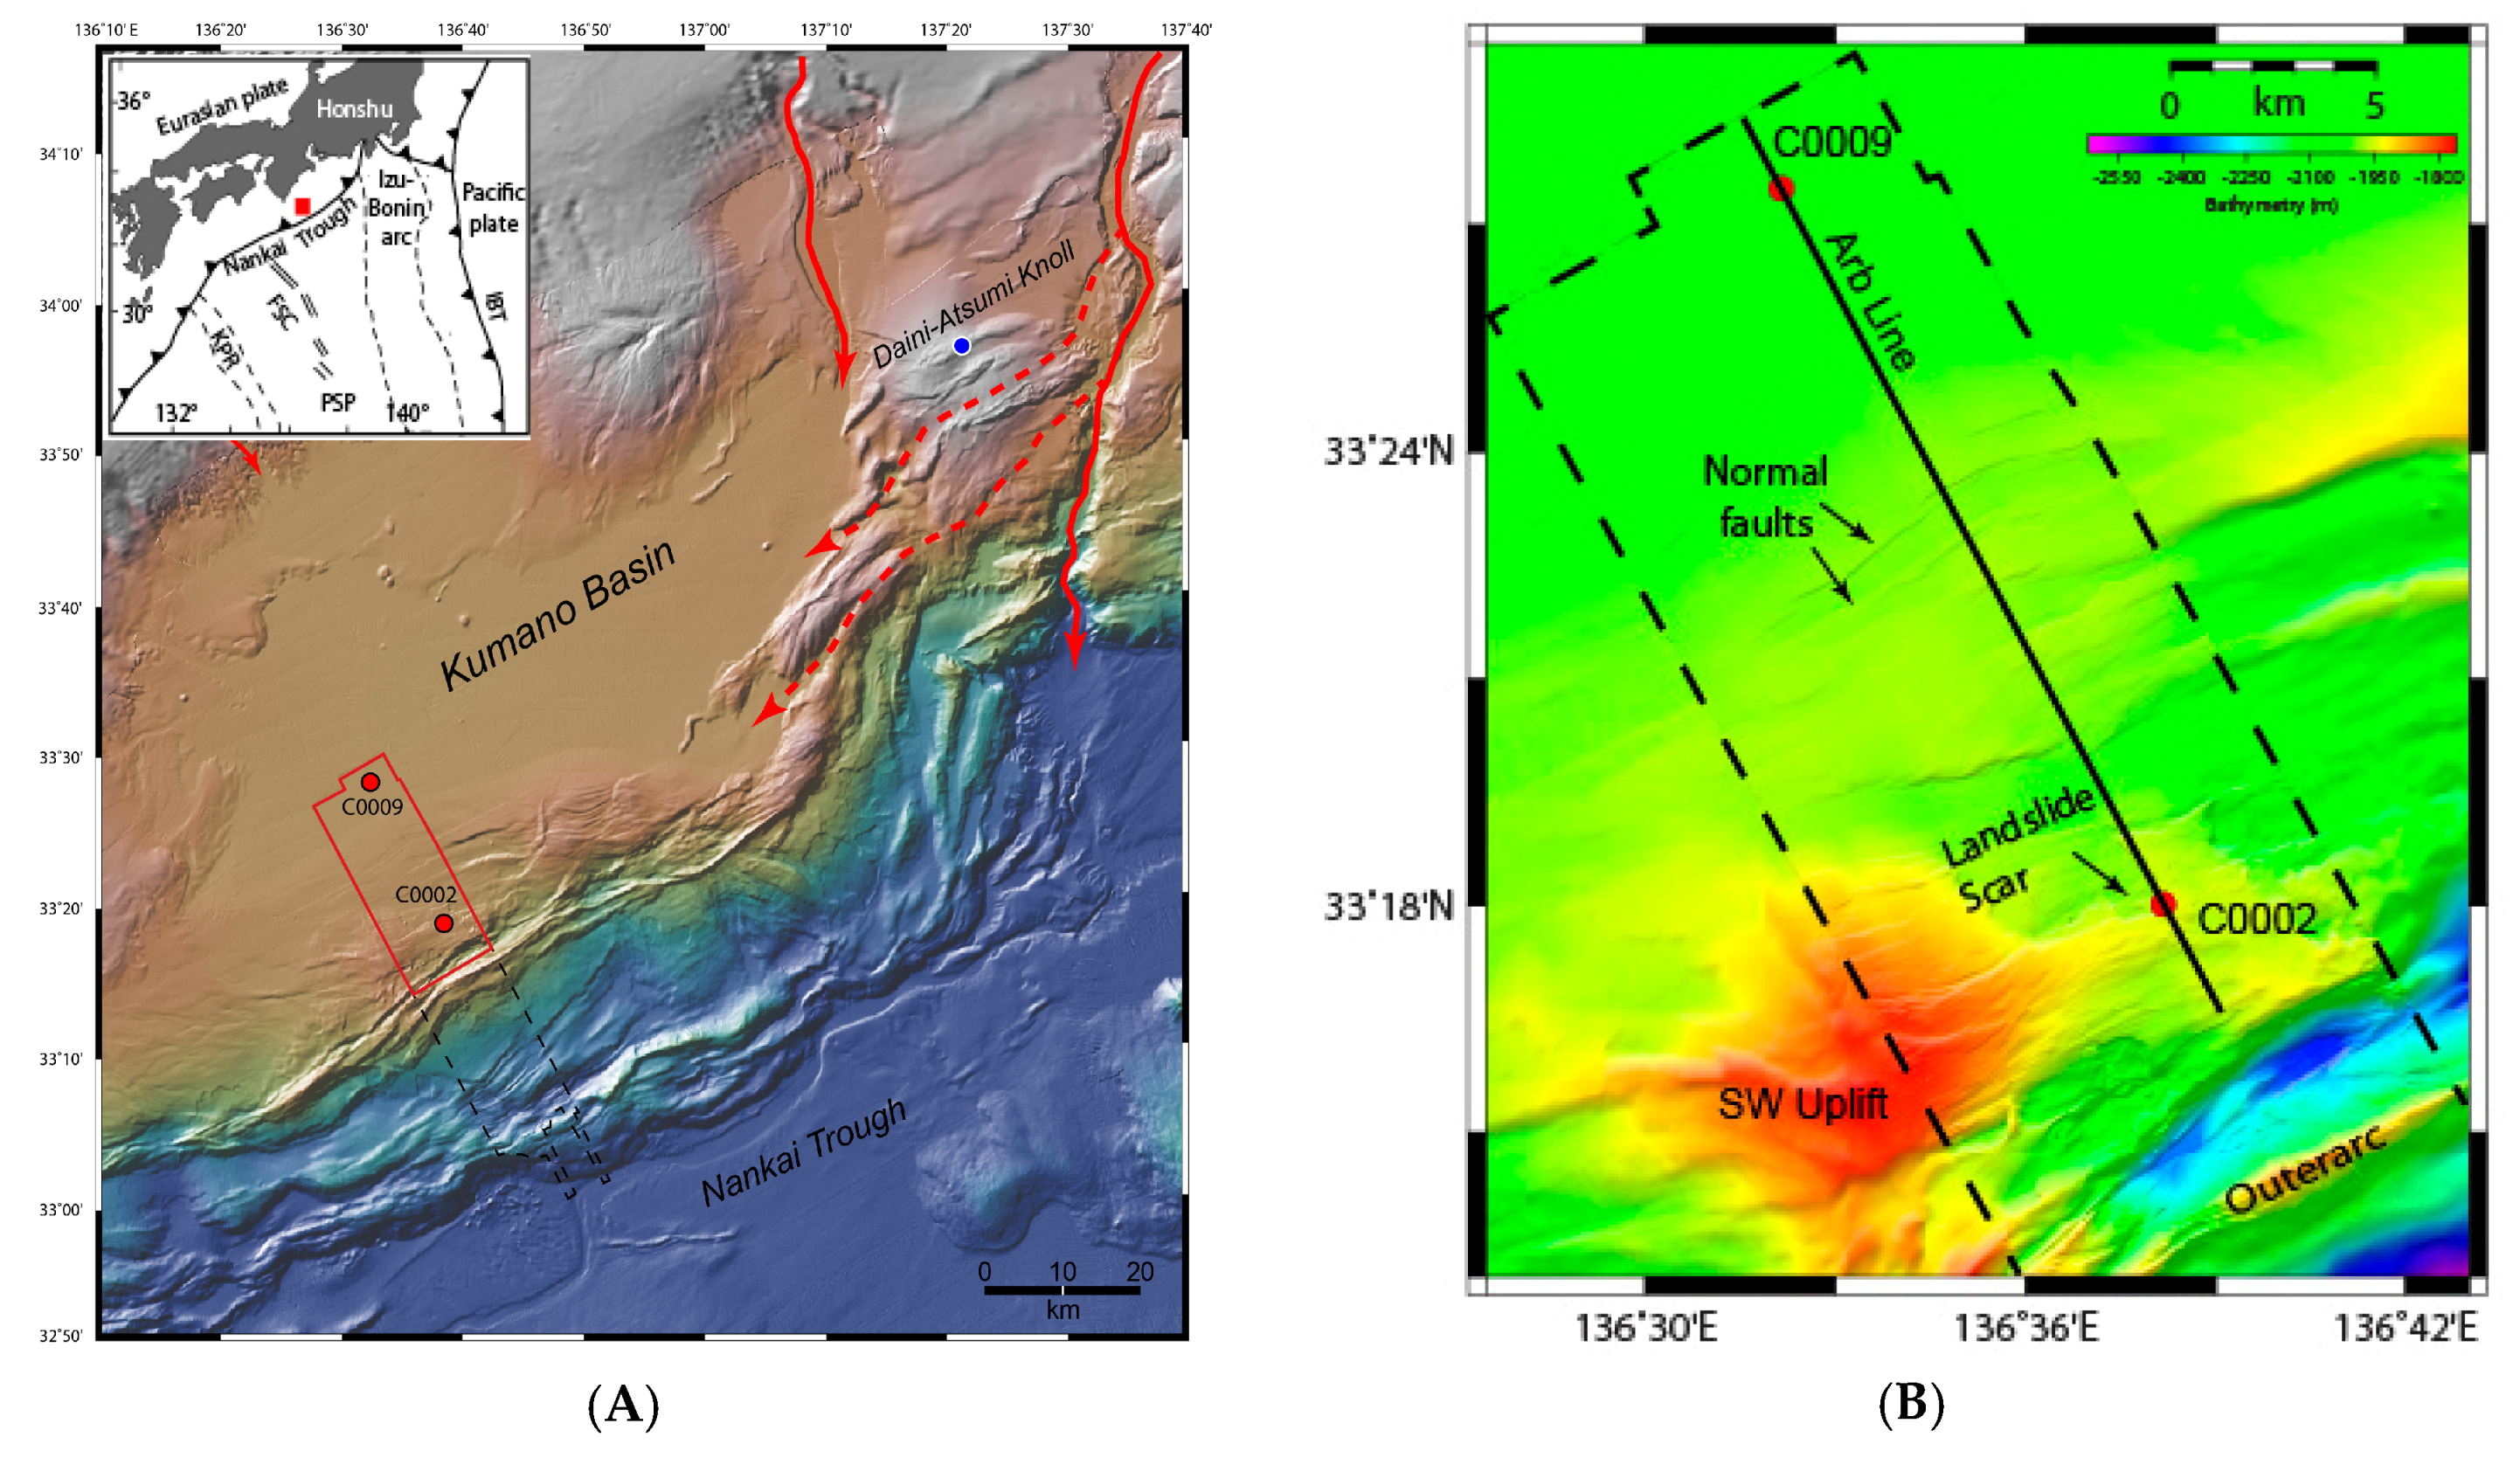
Our study region in the Kumano Basin (Figure 1) is a part of the Nankai subduction zone system, which has been site to intensive GH exploration and characterization efforts [4,13,14,15]. GH is widely distributed across forearc basins like Kumano because subduction zone compressional tectonics produce fracture and fault networks that can act as fluid migration pathways enabling the delivery of gas-charged fluids from depth into the hydrate stability zone [16,17,18,19]. These fluids are often rich in chemical compounds including methane and potentially other higher C2+ hydrocarbons such as ethane and propane [17,20]. Not surprisingly then, the Nankai Trough, a region with a long history of enormous, megathrust earthquakes (M > 8.0), concomitant fluid expulsion potential from compressive stress induced compaction (increases pore pressure), and mineral dehydration, is connected to the largest known methane hydrate bearing zones offshore Japan [20,21,22,23].
2.2. Kumano Basin Evolution
Kumano Basin’s evolutionary history is complex, but it is generally accepted that the initial accommodation space was formed when uplift along the megasplay fault created a barrier to sediment delivery to the trench at around ~1.95 Ma [26,27,28,29]. Biostratigraphic age constraints obtained at Sites C0002 and C0009 mark the basin sediments as Quaternary to modern in age [26,29]. At present, the basin is filled with ~2 km of pelagic and hemipelagic muds intercalated with clastic turbidites and thin ash layers [26]. Basin strata are severed by a series of deep-cutting normal faults with offsets of 5–30 m [30], and small scale faults in the accretionary wedge which are some of the youngest deformational structures [31]. The seafloor is relatively flat at ~2000 m water depth with a bottom water temperature of 2 °C, and it has been well imaged by side-scan sonar, swath bathymetry, and seismic surveys [25,32,33]. The surface morphology shows large normal faults that offset the seafloor, several large-scale landslide scars (Figure 1B), while the seismic data reveals that buried mass transport deposits are common throughout the basin [34].
The basin fill is characterized by a submarine fan turbiditic depositional system delivering sediments from Kii Peninsula via large submarine canyons (Figure 1A). There have been significant fluctuations of sediment provenance and shifts in delivery pathways and rerouting since the basin’s initiation [35,36,37,38]. A margin-wide assessment has shown that the submarine fans have transformed over time from a braided channel-dominated system to a small fan dominated system with shrinking, separated, small basins; to a trough fill turbidite system; to a channel-levee system [39,40,41]. These changes in depositional processes over time affect the spatio-temporal delivery of organic matter necessary for methane production as well as the distribution of potential reservoirs given that turbidites, ash layers, and channel fill sediments are most likely to host high concentrations of GH and free gas [42]. In the absence of sufficient total organic carbon for in situ methane production, migration of gas from depth through either focused or diffuse fluid flow, or hydrate recycling instigated by rapid changes in sedimentation or tectonic uplift/subsidence, is required to support a concentrated gas hydrate system [43,44,45].
Each of the geologic elements necessary to support a robust GH system, including deep water (high pressure), cold bottom waters (2 °C), sand rich turbidite deposits sandwiched by fine-grained muds, gas hydrate recycling provocations via tectonic perturbations (uplift, rapid sediment transport), and potential fluid expulsion events with gas migration routes from depth (deep cutting normal faults) are present in our study region.
3. Materials and Methods
3.1. Borehole Data
Empirical evidence for gas source, migration routes, and gas hydrate occurrences are compiled from numerous IODP expedition reports and post expedition publications. These data are presented in Table S1 and are used to constrain our seismic interpretations and volumetric gas-in-place estimate. Borehole data collected by the drillship D/V Chikyu includes geochemical, geophysical, and sedimentological information. For shipboard methods see reference [26]. Site C0009 was logged, but sediment cores were not collected from the basin [40]; thus, we rely heavily on data from C0002 (Figure 2).
3.2. Seismic Data
3.2.1. Seismic Acquisition
The 3D seismic reflection survey was carried out by Petroleum GeoServices (PGS, Singapore) in 2006 [46]. The resulting volume covers a geographical area of 12 × 56 km with 12.5 m between inlines (oriented NW-SE) and 18.75 m between crosslines (SW-NE) with excellent shallow resolution of 5–7 m [46]. Two arrays of 28 Sodera G-guns fired alternatively at 37.5 m intervals, and four 4500 m long hydrophone cables with 360 receivers grouped at 12.5 m spacing received the seismic source. This setup of 4 streamers per 2-sources produced 8 common midpoint (CMP) profiles per sail line with a spacing of 37.5 m and 30-fold data. Frequency range was 40–50 Hz for the BSR depths. The entire survey area is oriented at 330.1°.
3.2.2. Seismic Processing
The data were processed by CGG geophysical services and were corrected for noise and gain. Normal moveout was applied and binned traces were stacked following velocity analysis. The data underwent 3D pre-stack depth migration (PSDM). The PSDM volume has a 12.5 m interval between crosslines and an 18.75 m between inlines [46].
3.2.3. Data Interpretation
The 3D reflection seismic data are used in this study to map bottom simulating reflections, and to evaluate gas hydrate and free gas occurrence via visual interpretation. We adopt the GH seismic interpretation model of Boswell et al. [47]. Localized high amplitude reflections (HARs) serve as direct hydrocarbon indicators for free gas when below the gas hydrate stability zone (GHSZ), and likely indicators of gas hydrate when occurring within the GHSZ [48,49,50]. The primary seismic BSR is assumed to be in equilibrium marking the phase boundary of the structure-I (methane) gas hydrate stability. Seismic interference from the presence of a complex fault network in the center of the survey made automatic tracking of the BSR impossible. Therefore we manually picked BSRs in the inlines and confirmed correct picks by cross-checking picks in the crosslines. BSR horizons were mapped on every inline in the PSDM 3D seismic amplitude volume (IL2150-IL2720) across an area of ~27 × 12 km. In zones where BSRs were difficult to visually identify in the amplitude volume because of fault interference, picking was guided by use of the signal envelope attribute [51]. All seismic interpretations were made using Paradigm 3D Canvas Seismic Software, and the maps were created using Generic Mapping Tools software (GMT) [52].
3.3. Gas-in-Place (GIP) Estimate
For consistency, we adopt the volumetric gas-in-place estimation method used by the MH21 Research Consortium to evaluate the eastern Nankai Trough hydrate concentration zones [53]:
whereby GIP represents the gas-in-place, GRV is the total rock volume extracted from our isopach maps of inferred zones of concentrated GH, N/G is the net to gross ratio, φ is the porosity, MHSh is the methane hydrate saturation taken from shipboard Cl- data (the volumetric fraction of hydrates pore space occupancy), VR is the void ratio at standard temperature and pressure, and CO is the hydrate cage occupancy which is defined as the ratio of hydrate cages occupied by a natural gas molecules/the total number of cages [54]. The top of the hydrate concentration zone is defined by our upper-BSR interpretation, while the bottom of the hydrate concentration zone is defined by our main-BSR interpretation.
GIP = GRV × N/G × φ × MHSh × VR × CO
The controls on GH occurrence and stability are affected by the geothermal gradient, sediment thermal conductivity, pore pressure, porosity, permeability, pore water salinity, the amount of total organic carbon (TOC), flux of natural gas from depth, in situ gas production, gas solubility with depth, ambient pore water gas saturation, pore water availability, host sediment grain size and mineralogy, effective stress, and potentially even the morphology of the hydrate itself [55,56]. Thus, it is important to keep in mind that large estimation errors are possible. A key source of error for each gas hydrate proxy assessment (e.g., saturation estimates from pore-water and well-logs; hydrate presence from seismic) is related to baseline assumptions which may be elusive in the absence of pressure cores.
4. Results and Discussion
4.1. Drilling Data Summary
The amount of methane that can be generated in situ in the upper sediment column is limited by the amount of bioavailable organic carbon that escapes oxidation via rapid burial. Thermal cracking demands temperatures of >80 °C which would be equivalent to ~2 kmbsf at Site C0002 or ~3.5 kmbsf at Site C0009 given their respective geothermal gradients (Table S1). The total organic content (TOC) at Site C0002 is generally low (between 0.4–0.8 with an average of 0.5 wt %) with a small peak corresponding to the lower basin sediments. This package of lower basin sediments is very thin at C0002, but is significantly thicker in other regions more landward in the basin (refer to Table S1). Very high TOC content was found in the same sequence at C0009 (5.0 wt %) [57]. HARs are imaged across the organic rich sediment package, and are geophysical evidence for gas charge fluid delivery from the accretionary prism and deep basin sediments. Data from Expeditions 338 and 348 collected at C0002 clearly show that there is a component of thermogenic and microbial gas mixing. Thermal cracking to produce higher order hydrocarbons could be taking place on the incoming plate where the heat flow is higher [58]. Prior to subduction, these thermogenic gases may be transported up into basin sediments with deeply sourced fluids from the heavily fractured underlying accretionary prism. Hydrate saturations in the upper basin sediments were calculated by several groups using proxy measurements including Cl- freshening [59] and well-logs [57,59,60,61]. Discrepancies in their assessments are related to their baseline assumptions.
4.2. Seismic Mapping and Interpretation
4.2.1. Bottom Simulating Reflections (BSRs)
We observed that multiple BSRs are abundant throughout the survey region. The primary BSR (Figure 3B) is interpreted to be the current base of gas hydrate stability (BGHS). This was confirmed by drilling at C0002 by the presence of a thick GH layer in sediment cores correlating with a peak in resistivity at the depth of our BSR boundary (~400 mbsf) with free gas detected below (Figure 2) [26]. This BSR appears as a continuous, crosscutting reflection that closely mirrors the seafloor and is opposite polarity to the seafloor (red horizon). It reaches a minimum depth of ~320 mbsf and a maximum depth of ~520 mbsf, with an average depth at 400 mbsf (Figure 3B). A similar range in BSR depths were reported offshore Chile [62]. The primary BSR predominantly exhibits a strong, high amplitude character, suggesting a continuous free gas zone is present beneath (Figure 4). The continuous and generally high amplitude nature of the BSR is characteristic of a diffusive system supported by gas hydrate recycling processes [63,64]. Selective increases in BSR amplitudes indicate the important role of sand layers as a conduit for upward migration of gas-bearing fluids [65,66,67] (Figure 4). The large normal faults (Figure 3B) do not offset the BSR-meaning that there has been sufficient time since fault activity for BSR equilibration.
A second set of BSRs, which we refer to as Upper BSRs, are observed to occur above the main BSR. Based on their seismic character, we infer that these horizons image the top of methane hydrate concentration zones (Figure 5, Figure 6, Figure 7 and Figure 8). They appear in our data as crosscutting reflections and are generally the same polarity as the seafloor (black horizon) signifying an increase in impedance contrast, as opposed to the reverse polarity nature of the main BSR (Figure 6 and Figure 7). These Upper BSRs cluster in two regions of the basin (Figure 5, Figure 6 and Figure 7) and are located between 10–100 m above the primary BSR, but are on average ~40 m above the BSR.
Upper BSR Zone-1 is in the central region of the seismic survey. It is associated with an underlying basement high and abundant deep cutting normal faults (Figure 6). The Upper BSR horizons in this zone are patchy and generally sub-parallel to the seafloor. Many of these boundaries terminate against the normal faults which segments the hydrate reservoir lateral continuity with maximum continuity running parallel to the trench. GH deposits were similarly found to be closely related to large scale structural features in the Ulleung Basin [68], the Gulf of Mexico (GoM) [69,70] and the Krishna Godavari Basin offshore India [71]. Upper BSRs in Zone-2 are more narrowly constrained and are limited to the seaward edge of the basin where uplift has occurred along the outerarc ridge (Figure 5 and Figure 7). They are nearly parallel to the seafloor, and appear to primarily crosscut sandy units (Figure 7). They have a steeper slope than the Upper BSRs in Zone-1 occurring up to 90 m above the primary BSR.
The thicknesses between the Upper BSRs and the primary BSRs are shown in our isopach map (Figure 5A). This represents the thickness of the MHCZs from which we derive a gross-rock volume (GRV). Note that neither C0009 or C0002 drilled through an Upper BSR.
Given the shallow depths of the Upper BSRs in relation to the geothermal gradient in the basin (see Table S1), we can rule out the option of an opal-A to opalCT transition at the depths of the Upper BSR boundaries. There is also no evidence in C0002 cores or C0009 logs to suggest the presence of a thick authigenic carbonate layer. Gas hydrates are associated with stimulated microbial activity which results in the production of magnetic iron sulfides from sulfate reduction [72,73], and the preservation of greigite and pyrrhotites is favored in regions with disseminated gas hydrates and will transform to pyrite once gas hydrates decompose [74]. While a concentrated layer of pyrite could represent a “fossilized” or “paleo” BSR [74], it is unlikely that a concentrated pyrite layer would be thick enough for seismic detection at the scale of the observed Upper BSRs.
Zones of high amplitude reflections occurring above the BSR akin to the Upper BSRs we observe in our seismic data were also found in the Nankai prism [75], in the GoM [6,76], and in the eastern Nankai Trough [67,77]. Core analyses at those sites determined those reflections marked the top of highly concentrated gas hydrate zones [47,67]. Similar thin, positive amplitude reflections above the BSR have also been interpreted to represent the top of a concentrated gas hydrate zones along the Chilean margin [78]. For these reasons, we argue that the Upper BSRs in our seismic data mark the top of MHCZs. These proposed MHCZs appear in their seismic character to be analogous to the confirmed MHCZs in the eastern Nankai Trough at Daini Atsumi Knoll [8].
4.2.2. Seismic Evidence for Gas Source and Migration Pathways into the MHCZs
The 3D PSDM seismic volume reveals a complicated geologic environment including complex faulting, tilting of beds from tectonic uplift of the basin’s seaward margin, deformation structures in the underlying accretionary prisms, and dozens of large mass wasting. High amplitude reflections (HARs) correlating with gas charged sands are common beneath the BSR (Figure 8, Figure 9 and Figure 10). HARs above the BSR are nearly always updip of zones with HARs below the BSR and are likely GH (Figure 9, Figure 10 and Figure 11).
The presence of gas appears in seismic data as reductions in acoustic impedance, which strengthens the reflectivity coefficient and results in either HARs, a polarity change, or as anomalous low velocity, low coherency zone [79,80,81]. Other seismic indicators of gas-charged fluids include flat spots, bright spots, and dim spots, which are each known as “direct hydrocarbon indicators”, and are thus important features to look for when searching for hydrocarbons in marine sediments [50,82]. Gas can also produce “seismic turbidity” which appears as a visual distortion of seismic horizons [83]. We assume that oil is not present in the Kumano Basin given that the organic matter found during drilling is predominantly woody material, and therefore any hydrocarbon indicator is likely a gas-water, hydrate-gas, or hydrate-water contact. Blanking is observed in a thick sequence above the BSR in the center of the survey (Figure 9) is interpreted to signify low GH saturation. Incidences of blanking below the BSR could be from either gas saturated muds, or acoustic attenuation of the seismic wave as it passes through a thick GH zone. Drilling in the GoM demonstrated that blanking above the BSR reflects minor hydrate saturations and is not considered a prospective resource zone [47]. Thus, we do not include zones of blanking in our gas-in-place estimate. HARs appear frequently at and well beneath (100 s of meters) the BSR throughout the seismic data suggesting gas is sourced from depth. Cluster of HARs are observed along anticlinal hinges with updip strata leading to HCZ Zone-1 (Figure 5 and Figure 10), and within tilted strata and erosional feature at the seaward edge of the basin downdip of HCZ Zone-2 (Figure 5 and Figure 11). The acoustic turbidity and spatial distribution of these gas signatures suggests a broad, diffuse gas zone is present beneath the BGHS correlating with both MHCZs. We interpret this to mean there is an efficient hydrate seal above. Any gas released from hydrate dissociation following the upward shift of the BGHS will mix with this pool of underlying gas contributing to gas hydrate recycling at the BGHS.
Gas migration in marine sediments can proceed as a short-range and/or long range process [60]. Short-range migration is the mechanism by which in situ methane produced as a byproduct of microbial metabolism diffuses from one sediment layer to the next. Usually, this means from a fine-grained interval where it is difficult to form hydrates because of the Gibbs-Thomson effect on methane solubility in fine-grain sediments, to an adjacent coarse grain layer with larger pore spaces which act to lower gas solubility, creating a favorable chemical potential scenario that facilitates hydrate nucleation [86]. GH recycling is a second example of a short-range migration mechanism. In this case, gas released from GH dissociation, following a shift in the BGHS, diffuses into the newly established GHSZ and is potentially reincorporated into a new hydrate structure (in addition to any new gas produced in situ) [87]. Long-range migration involves the transfer of free-gas and gas-charged fluids into the GHSZ from depth, usually along pressure gradients via diffuse porous flow through permeable layers, or as focused advection along highly permeability outlets including faults, fractures and fluid escape structures such as mud volcanoes [88].
In the Kumano Basin data, we observe geophysical evidence for both short and long range migration as opposed to the long-range only model [86] and the short range only migration reaction-transport model [60] previously proposed for the basin. Malinverno and Goldberg’s study [60] found that in situ biogenic methane production could support a GH system at C0002, however, this process alone could not account for the large thickness of methane hydrate-bearing sands recovered from just above the BGHS. When considering the borehole data collected at C0002 and C0009 in relation to the gas proxies we have identified in the 3D seismic data, it is likely that gas migrates into the GHSZ by means of three mechanisms: (1) diffuse flow along permeable dipping strata sandwiched between less permeable clays evidenced by high amplitude reflections in sand beds where beds have been tilted ~5–8 degrees (Figure 7 and Figure 8); (2) episodically as focused fluid flow through deep cutting faults and mud volcanism at times of tectonic activity (Figure 12); and (3) by diffusion following BGHS shifts and concomitant hydrate decomposition/recycling stimulated by the interplay of sedimentation and tectonic uplift during accretion which would allow for the formation of thick GH deposits to form above the BGHS (Figure 11).
It is known that fluid flow alternates between diffuse and focused flow over time depending on changes in the stress field [18,89,90]. Hammerschmidt et al.’s [91] analysis of drilling mud gas samples at C0002 for 222RN, helium (He) concentration, and He isotope ratios supports episodic fluid flow occurs in the basin. Their research found a strong contribution of primordial helium in the upper part of the accretionary prism, but currently, fluid flow velocities are too low to support the elevated gas concentrations. The dewatering of the subducting wedge is also a transient process, and the expulsion of fluids from an over-pressured accretionary prism or fluid expulsion during seismic events could carry gas generated at depth into the GHSZ [17]. As was found at Woosley Mound in the GoM [70,92], it is likely that GHs in Kumano Basin are formed rapidly just following periods of active fluid advection [93]. The association of basement topographic highs with fault-controlled fluid flow potentially delivering basement sourced fluids, as observed by HARs in these seismic data, is a pattern also observed in the hydrate bearing region of the Makran accretionary margin [85], and in association with salt tectonics in the GoM [94]. Such transient fluid pulses could also explain the freshening pulse measured in the Cl- baseline at C0002.
Other supporting evidence that focused fluid flow in the seaward part of the basin is likely episodic includes: (1) a lack of seafloor pockmarks in the existing bathymetry data [95]; (2) generally, the BSR is not offset across the majority of the large normal faults that break the seafloor meaning that the BSR has had sufficient time to equilibrate to the current base of gas hydrate stability and (3) there is very little seismic evidence for active fluid escape structures (pipes), except for a single mud volcano at the seaward edge that breaks through the seafloor with a conical shaped dome (Figure 12). This mud volcano is deeply rooted and expresses hummocky reflections inferred to be the centralized vent. Here fluid expulsion is likely active because the BSR shoals upward, and is truncated as it approaches the vent feature. Fluids from twelve analogous mud volcanoes within the Kumano basin further landward were sampled and analyzed for hydrocarbon origins [95]. Gas hydrates were recovered from MVs 2, 4, 5, and 10 and of these, MVs 2, 4, and 10 showed molecular C1/C2 ratios >250 and stable carbon isotopic composition δ13C of methane >−40‰ V-PDB which together are diagnostic of hydrate-bound thermogenic methane originating from between 2300 and 4300 mbsf corresponding to Cretaceous to Tertiary Shimanto belt below the Pliocene/Pleistocene to recent basin sediments [95]. There are numerous examples where concentrated GHs have been found in association with submarine mud volcanoes [95,96,97,98,99,100]. It has been proposed that compensation troughs (synclines) surrounding mud volcanoes are proximal weak zones where gas from the upward expulsion can migrate laterally into the hydrate stability zone, and thus the maximum concentration of hydrates in association with MVs is found in compensation troughs [100]. Considering the seismic character of our imaged BSR across the mud volcano (not imaged) and the HARs in the compensation troughs, we propose that this seep is active or recently active and that the clustering of strong HARs extruding latterly from the vent are likely the product of gas hydrates hosting laterally extruded gas molecules.
4.2.3. Seismic Evidence for Gas and GH Traps
The structural and stratigraphic controls on the sub-surface distribution of free gas and GH is evidenced by the distribution of BSRs, variable BSR amplitude strengths and the presence of localized HARs which we pointed out both above and below the GHSZ. Gas-charged fluids are at least partially confined in stratigraphic traps under the cap of the anticlinal-shaped accreted sediments (Figure 10) and within the intercalated synclinal-shaped sediments which corresponds to the ponded slope basins in the early stages of prism growth (Figure 4, Figure 6 and Figure 7) [41].
Seismic blanking within the GHSZ is characteristic of the reduction of pore space due to low to modest gas hydrate saturation, while modest to high gas hydrate saturation will lead to strong positive amplitudes [101,102,103]. Both types of seismic responses are observed within the GHSZ in our seismic data. The logging data, pore water data, and soupy structures in sediment cores collected at Sites C0002 and C0009 have shown that both pore-filling GH in sand layers and disseminated GH in muds are present in the basin. From the drilling data at C0002, we know that hydrate-bearing sediments (traps) are turbidite sands which includes a > 3 m thick sand layer hosting the highest concentration of gas hydrates directly above the BSR at about 386 mbsf [26,78]. Previous studies analyzing ring resistivity, bit resistivity, and P-wave velocity data from Site C0002 estimated high gas hydrate saturations (>60%) in sandy layers with the presence of free gas identified at several depths [59]. These thick sand beds within the GHSZ are potential GH reservoirs.
4.3. Volumetric Gas in Place Estimate
For our gas-in-place estimate, we define the bottom of the MHCZs as the main BSR imaged in the 3D seismic volume. The upper boundary is defined by our Upper BSRs. This resource estimate provides a first-order gas-in-place estimate for the HCZ above the BSR only. Potential GH bearing zones outside of the BSR and Upper BSR envelope are not considered.
The GRV from our isopach map was determined to be 955,940 MMcf. The N/G is the assumed sand to clay ratio and values are based on core data collected from C0002. The φ and MHSh are based on shipboard moisture and density (MAD) measurements for a sand rich interval at the depth of the BSR (400 mbsf) at Site C0002 during Expedition 338 and post expedition reports respectively. The preferred φ value used here is 50% (appropriate for the depths of the BSR) but shipboard data shows that it could range from 45–60%. Post cruise hydrate saturation in the sand bed above the BSR were determined to be 71% (maximum) based on log results and with MHSh in sand beds above the BSR at ~35% using a pore filling model based on porewater results [61]. We prefer a MHSh value of 35%. The VR (164) also assumes a pore-filling hydrate model. CO is set at a mode of 0.96 based on observations from recovered natural gas hydrates collected in cores around the world but could range from 0.90–0.99. There could be large errors with extrapolating the MHSh from C0002 to the center of the basin. Given these parameters (Table 1) we conservatively estimate ~15.8 trillion cubic feet of methane is locked up in the MHCZs imaged in our seismic data. However, this value could range from ~1.9–46.3 trillion cubic feet. For comparison, the amount of methane locked up in hydrate reservoirs at the Japanese production trial in the south-eastern Nankai Trough was estimated at 40 trillion cubic feet [15,53].
5. Conclusions
This is the first study to map potential methane hydrate concentration zones, in three-dimensions, for our survey region of the Kumano Basin in order to extract a gross rock volume, and to provide a gas-in-place estimate for these MHCZs using borehole constraints. We identified gas proxies beneath the main BSR which allowed us to infer the gas migration mechanisms in the basin. Gas charged fluids migrate into basin sediments from anticlinal features in the underlying accretionary prism, migrate through the sediments as diffuse fluid flow updip permeable sands sandwiched by less permeable clays; episodically through faults and fractures; and through gas hydrate recycling following perturbation to the BGHS from uplift and rapid sedimentation. Generally, active fluid advection is not evidenced by the current BSR character. Given the previously published geochemical data, and our observed seismic indicators (HARs) in lower basin sediments, it is likely that deep fluids are episodically charging the two zones of concentrated gas hydrate deposits identified above the primary BSR. Hydrate recycling at the BSR is also evidenced by closely stacked BSRs in the center of the basin. A thick GH layer acting as a seal for gas below provides a trap for gas to accumulate and then later be incorporated into new GHs following perturbations to the base of hydrate stability conditions.
MHCZs likely occur updip of gas-charged, tilted sediments and above zones with high acoustic turbidity (indicator of gas). The principal MHCZ-1 corresponds to a thick sand unit above the BSR in the center of the basin associated with an intricate fault network, HARs in sediment down dip, and an underlying topographic high in the accretionary prism. MHCZ-2 occurs in permeable dipping strata above the BSR toward the seaward edge of the basin near the outer arc ridge.
The gross rock volume for these two MHCZs was determined to be 955,940 MMcf. Our preferred gas-in-place estimate is 15.8 trillion cubic feet based on the most likely constraints from Site C0002. However, this value could range from 1.9–46.3 trillion cubic feet.
Supplementary Materials
The following are available online at www.mdpi.com/1996-1073/10/10/1552/s1, Table S1: Summary Table of Data from Site C0009 and C0002 ([104,105]).
Acknowledgments
The authors would like to thank Stephen M. Masutani, and Gregory Ravizza for comments on earlier portions of this paper that were used in fulfillment of K. Taladay’s MS thesis, as well as two anonymous reviewers. We are grateful Paradigm Geophysical and Landmark Graphics, a subsidiary of Halliburton, for providing the software that made this work possible. Funding for this investigation was provided in part by the U.S. Office of Naval Research via Grant numbers N00014-12-1-0496 and N00014-13-1-0463. SOEST contribution # 10228.
Author Contributions
Katie Taladay conceived this research, interpreted the BSR horizons, extracted the gross rock volume, gathered the supplementary data, made the figures and wrote this manuscript. Brian Boston created the BSR maps in GMT and provided comments for edits to the manuscript. Gregory F. Moore provided access to the seismic data, comments on the manuscript and provided several figures for modification.
Conflicts of Interest
The authors declare no conflict of interest. The funding sponsor had no role in the design of the study; in the collection, analyses, or interpretation of data; in the writing of the manuscript, or in the decision to publish the results.
References
- Buffett, B.; Archer, D. Global inventory of methane clathrates: Sensitivity to changes in the deep ocean. Earth Planet. Sci. Lett. 2004, 227, 185–199. [Google Scholar] [CrossRef]
- Boswell, R. Is gas hydrate energy within reach? Science 2009, 325, 957–958. [Google Scholar] [CrossRef] [PubMed]
- Burwicz, E.B.; Rüpke, L.H.; Wallman, K. Estimation of the global amount of submarine gas hydrates formed vial microbial methane formation based on numerical reaction-transport modeling and a novel parameterization of Holocene sedimentation. Geochim. Cosmochim. Acta 2011, 75, 4562–4576. [Google Scholar] [CrossRef] [Green Version]
- Collett, T.S. Energy resource potential of natural gas hydrates. Am. Assoc. Pet. Geol. Bull. 2002, 86, 1971–1992. [Google Scholar] [CrossRef]
- Collett, T.S.; Johnson, A.; Knapp, C.; Boswell, R. Natural gas hydrates—A review. In Natural Gas Hydrates—Energy Resource Potential and Associated Geologic Hazards; Collett, T., Jonhson, A., Knapp, C., Boswell, R., Eds.; AAPG Memoir 89; AAPG: Tulsa, OK, USA, 2009. [Google Scholar]
- Boswell, R.; Saeki, T. Motivations for the geophysical investigation of gas hydrates. In Geophysical Characterization of Gas Hydrate; Riedel, M., Willoughby, E., Chopra, S., Eds.; SEG Geophysical Developments Series; Society of Exploration Geophysicists: Tulsa, OK, USA, 2010; Volume 14, pp. 23–32. [Google Scholar]
- Riedel, M.; Collett, T.S.; Kumar, P.; Sathe, A.V.; Cook, A. Seismic imaging of a fractured gas hydrate system in the Krishna-Godavari Basin offshore India. Mar. Pet. Geol. 2010, 27, 1476–1493. [Google Scholar] [CrossRef]
- Tamaki, M.; Suzuki, K.; Fujii, T.; Sato, A. Prediction and validation of gas hydrate saturation distribution in the eastern Nankai Trough, Japan: Geostatistical approach integrating well-log and 3D seismic data. Interpretation 2016, 4, SA83–SA94. [Google Scholar] [CrossRef]
- Kroeger, K.F.; Crutchley, G.J.; Hill, M.G.; Pecher, I.A. Potential for gas hydrate formation at the northwest New Zealand shelf margin—New insights from seismic reflection data and petroleum systems modelling. Mar. Pet. Geol. 2017, 83, 215–230. [Google Scholar] [CrossRef]
- Burwicz, E.; Reichel, T.; Wallmann, K.; Rottke, W.; Haeckel, M.; Hensen, C. 3-D basin-scale reconstruction of natural gas hydrate system of the Green Canyon, Gulf of Mexico. Geochem. Geophys. Geosyst. 2017, 18, 1959–1985. [Google Scholar] [CrossRef]
- Hillman, J.I.T.; Cook, A.E.; Sawyer, D.E.; Kucuk, H.M.; Goldberg, D.S. The character and amplitude of ‘discontinuous’ bottom simulating reflections in marine seismic data. Earth Planet. Sci. Lett. 2017, 459, 157–169. [Google Scholar] [CrossRef]
- Santamarina, J.C.; Dai, S.; Terzariol, M.; Jang, J.; Waite, W.F.; Winters, W.J.; Nagao, J.; Yoneda, J.; Konno, Y.; Fujii, T.; et al. Hydro-bio-geomechanical properties of hydrate-bearing sediments from Nankai Trough. Mar. Pet. Geol. 2015, 66, 1–17. [Google Scholar] [CrossRef]
- Nagakubo, S. Methane hydrate as a domestic energy resource: Japan’s methane hydrate R&D program. J. Geogr. 2009, 118, 758–775. [Google Scholar] [CrossRef]
- Fujii, T.; Noguchi, S.; Takayama, T.; Suzuki, K.; Yamamoto, K.; Saeki, T. Site selection and formation evaluation at the 1st offshore methane hydrate production test site in the eastern Nankai Trough, Japan. In Proceedings of the 75th EAGE Conference & Exhibition Incorporating SPE EUROPEC, London, UK, 10–13 June 2013. [Google Scholar]
- Fujii, T.; Suzuki, K.; Takayama, T.; Tamaki, M.; Komatsu, Y.; Konno, Y.; Yoneda, J.; Yamato, K.; Nagao, J. Geological setting and characterization of a methane hydrate reservoir distributed at the first offshore production test site on the Daini-Atsumi Knoll in the eastern Nankai Trough, Japan. Mar. Pet. Geol. 2015, 66, 310–322. [Google Scholar] [CrossRef]
- Booth, J.S.; Winters, W.J.; Dillon, W.P.; Clennell, M.B.; Rowe, M.M. Major occurrences and reservoir concepts of marine clathrates hydrates: Implications of field evidence. In Gas Hydrates: Relevance to World Margin Stability and Climate Change; Henriet, J.-P., Mienert, J., Eds.; Geological Society: London, UK, 1998; Volume 137, pp. 113–127. [Google Scholar]
- Kastner, M.; Solomon, E.A.; Harris, R.N.; Torres, M.E. Fluid origins, thermal regimes, and fluid and solute fluxes in the forearc of subduction zones. Del. Mar. Geol. 2014, 7, 671–733. [Google Scholar] [CrossRef]
- Yamada, Y.; Baba, K.; Miyakawa, A.; Matsuoka, T. Granular experiments of thrust wedges: Insights relevant to methane hydrate exploration at the Nankai accretionary prism. Mar. Pet. Geol. 2014, 51, 34–48. [Google Scholar] [CrossRef] [Green Version]
- Auguy, C.; Calves, G.; Calderon, Y.; Brusset, S. Seismic evidence of gas hydrates, multiple BSRs and fluid flow offshore Tumbes Basin, Peru. Mar. Geophys. Res. 2017, 38, 1–15. [Google Scholar] [CrossRef]
- Saffer, D.M.; Tobin, H.J. Hydrogeology and mechanics of subduction zone forearcs: Fluid flow and pore pressure. Annu. Rev. Earth Planet. Sci. 2011, 39, 157–186. [Google Scholar] [CrossRef]
- Ando, M. Source mechanism and tectonic significance of historical earthquakes along the Nankai Trough, Japan. Tectonophysics 1975, 27, 119–140. [Google Scholar] [CrossRef]
- Baba, T.; Cummins, P.R. Contiguous rupture areas of two Nankai Trough earthquakes revealed by high resolution tsunami waveform inversion. Geophys. Res. Lett. 2005, 32, L08305. [Google Scholar] [CrossRef]
- Fischer, D.; Mogollon, J.M.; Strasser, M.; Pape, T.; Bohrmann, G.; Fekete, N.; Spiess, V.; Kasten, S. Subduction zone earthquake as potential trigger of submarine hydrocarbon seepage. Nat. Geosci. 2013, 6, 647–651. [Google Scholar] [CrossRef]
- Seno, T.; Stein, S.; Gripp, A.E. A model for the motion of the Philippine Sea plate consistent with NUVEL-1 and geological data. J. Geophys. Res. 1993, 98, 17941–17948. [Google Scholar] [CrossRef]
- Taira, A.; Curewitz, D.; Hashimoto, T.; Ibusuki, A.; Kuramoto, S.I.; Okano, T.; Tanaka, H. Nankai Trough Seismogenic Site Survey: Kumano Basin Seismic Survey, Philippine Sea, Offshore Kii Peninsula, Japan. In CDEX Technical Report; Taira, A., Curewitz, D., Eds.; Japan Agency for Marine-Earth Science and Technology: Yokosuka, Japan, 2005; Volume 1, p. 64. ISSN 1880-0777. [Google Scholar]
- Strasser, M.; Dugan, B.; Kanagawa, K.; Moore, G.F.; Toczko, S.; Maeda, L. The Expedition 338 Scientists. In Proceedings of the Integrated Ocean Drilling Program (IODP), Yokohama, Japan, 1 October–13 January 2013; Volume 338. [Google Scholar]
- Moore, G.F.; Bangs, N.L.; Taira, A.; Kuramoto, S.; Pangborn, S.; Tobin, H.J. Three-dimensional splay fault geometry and implications for tsunami generation. Science 2007, 318, 1128–1131. [Google Scholar] [CrossRef] [PubMed]
- Gulick, S.P.S.; Bangs, N.L.B.; Moore, G.F.; Ashi, J.; Martin, K.M.; Sawyer, D.S.; Tobin, H.J.; Kuramoto, S.; Taira, A. Rapid forearc basin uplift and megasplay fault development from 3D seismic images of Nankai Margin off Kii Peninsula, Japan. Earth Planet. Sci. Lett. 2010, 414, 164–175. [Google Scholar] [CrossRef]
- Moore, G.F.; Boston, B.B.; Strasser, M.; Underwood, M.B.; Ratliff, R.A. Evolution of tectono-sedimentary systems in the Kumano Basin, Nankai Trough forearc. Mar. Pet. Geol. 2015, 67, 604–616. [Google Scholar] [CrossRef]
- Moore, G.F.; Boston, B.B.; Sacks, A.F.; Saffer, D.M. Analysis of normal fault populations in the Kumano Forearc Basin, Nankai Trough, Japan: 1. Multiple orientations and generations of faults from 3D coherency mapping. Geochem. Geophys. Geosys. 2013, 14, 1989–2002. [Google Scholar] [CrossRef]
- Hayman, N.W.; Byrne, T.B.; McNeill, L.C.; Kanagawa, K.; Kanamatsu, T.; Browne, C.M.; Schleicher, A.M.; Huftile, G.J. Structural evolution of an inner accretionary wedge and forearc basin initiation, Nankai margin, Japan. Earth Planet. Sci. Lett. 2012, 353–354, 163–172. [Google Scholar] [CrossRef]
- Ashi, J.; Tokuyama, H.; Taira, A. Distribution of methane hydrate BSRs and its implication for the prism growth in the Nankai Trough. Mar. Geol. 2002, 187, 177–191. [Google Scholar] [CrossRef]
- Morita, S.; Ashi, J.; Aoike, K.; Kuramoto, S. Evolution of Kumano Basin and Sources of Clastic Ejecta and Pore Fluid in Kumano Mud Volcanoes, Eastern Nanaki Trough. In Proceedings of the International Symposium on Methane Hydrates and Fluid Flow in Upper Accretionary Prisms (Prism Fluid 2004), Kyoto, Japan, 6 February–3 April 2004. [Google Scholar]
- Moore, G.F.; Strasser, M. Large mass transport deposits in Kumano Basin, Nankai Trough, Japan. In Submarine Mass Movements and Their Consequences; Lamarche, G., Mountjoy, J., Bull, S., Hubble, T., Krastel, S., Lane, E., Micallef, A., Moscardelli, L., Mueller, C., Pecher, I., et al., Eds.; Springer: Berlin/Heidelberg, Germany, 2015; pp. 371–379. [Google Scholar]
- Fergusson, C.L. Provenance of Miocene-Pleistocene Turbidite Sands and Sandstones, Nankai Trough, Ocean Drilling Program Leg 190. 2003. Available online: http://www-odp.tamu.edu/publications/190196SR/205/205_.htm (accessed on 14 November 2003).
- Clift, P.D.; Carter, A.; Nicholson, U.; Masago, H. Zircon and apatite thermochronology of the Nankai Trough accretionary prism and trench, Japan: Sediment transport in an active and collisional margin setting. Tectonics 2013, 32, 377–395. [Google Scholar] [CrossRef]
- Usman, M.O.; Masago, H.; Winkler, W.; Strasser, M. Mid-Quaternary decoupling of sediment routing in the Nankai Forearc revealed by provenance analysis of tubiditic sands. Int. J. Earth Sci. 2014, 103, 1141–1161. [Google Scholar] [CrossRef]
- Buchs, D.M.; Cukur, D.; Masago, H.; Garbe-Schonberg, D. Sediment flow routing during formation of forearc basins: Constraints from integrated analysis of detrital pyroxenes and stratigraphy in the Kumano Basin, Japan. Earth Planet. Sci. Lett. 2015, 414, 164–175. [Google Scholar] [CrossRef]
- Takano, O.; Itoh, Y.; Kusumoto, S. Variations in forearc basin configuration and basin filling depositional systems as a function of trench slope break development and strike-slip movement: Examples from the Cenozoic Ishikari-Sanriku-Oki and Tokai-Oki-Kumano-Nada forearc basins, Japan. In Mechanism of Sedimentary Basin Formation-Multidisciplinary Approach on Active Plate Margins; InTechOpen: Rijeka, Croatia, 2013; Chapter 11. [Google Scholar]
- Saffer, D.; McNeill, L.; Byrne, T.; Araki, E.; Toczko, S.; Eguchi, N.; Takahashi, K. Expedition 319 Scientists. Site C0009. In Proceedings of the Integrated Ocean Drilling Program; Integrated Ocean Drilling Program Management International, Inc.: Tokyo, Japan, 2010; Volume 319. [Google Scholar]
- Ramirez, S.G.; Gulick, S.P.S.; Hayman, N.W. Early sedimentation and deformation in the Kumano forearc basin linked with Nankai accretionary prism evolution, southwest Japan. Geochem. Geophys. Geosyst. 2015, 16, 1616–1633. [Google Scholar] [CrossRef]
- Fujii, T.; Aung, T.T.; Wada, N.; Komatsu, Y.; Suzuko, K.; Ukita, T.; Wygrala, B.; Fuchs, T.; Rottke, W.; Egawa, K. Modeling gas hydrate petroleum systems of the Pleistocene turbidic sedimentary sequences of the Daini-Atsumi area, eastern Nankai Trough, Japan. Interpretation 2016, 4, SA95–SA111. [Google Scholar] [CrossRef]
- Fujii, T.; Saeki, T.; Kobayashi, T.; Inamori, T.; Hayashi, M.; Takano, O.; Takayama, T.; Kawasaki, T.; Nagakubo, S.; Nakamizu, M.; et al. Resource assessment of methane hydrate by applying probabilistic approach in the eastern Nankai Trough, Japan (English abstract). J. Geogr. 2009, 118, 814–834. [Google Scholar] [CrossRef]
- Takano, O.; Fujii, T.; Saeki, T.; Shimoda, N.; Noguchi, S.; Nishimura, M.; Takayama, T.; Tsuji, T. Applications of sedimentological methodology to the methane-hydrate exploration project in the eastern Nankai Trough area. J. Jpn. Assoc. Petroleum Technol. 2010, 75, 30–41. [Google Scholar] [CrossRef]
- Johnson, J.E.; Phillips, S.C.; Torres, M.E.; Piñero, E.; Rose, K.K.; Giosan, L. Influence of total organic carbon deposition on the inventory of gas hydrate in the Indian continental margins. Mar. Pet. Geol. 2014, 58, 406–424. [Google Scholar] [CrossRef]
- Moore, G.F.; Park, J.-O.; Bangs, N.L.; Gulick, S.P.; Tobin, H.J.; Nakamura, Y.; Saito, S.; Tsuji, T.; Yoro, T.; Tanaka, H.; et al. Structural and seismic stratigraphic framework of the NanTroSEIZE Stage 1 transect. In Proceedings of the Integrated Ocean Drilling Program; Kinoshita, M., Tobin, H., Ashi, J., Kimura, G., Lallemant, S., Screaton, E.J., Curewitz, D., Masago, H., Moe, K.T., Eds.; The Expedition 314/315/316 Scientists; Integrated Ocean Drilling Program Management International, Inc.: College Station, TX, USA, 2009. [Google Scholar]
- Boswell, R.; Saeki, T.; Shipp, C.; Frye, M.; Shedd, B.; Collett, T.; Shelander, D.; McConnel, D. Prospecting for Gas Hydrate Resources. Department of Energy, FITI Methane Hydrate Newsletter. Interpreation 2014, 14, 9–13. [Google Scholar]
- Saeki, T.; Fujii, T.; Inamori, T.; Kobayashi, T.; Hayashi, M.; Nagakubo, S.; Takano, O. Extraction of methane hydrate concentrated zone for resource assessment in the eastern Nankai Trough, Japan. In Proceedings of the Offshore Technology Conference, Houston, TX, USA, 5–8 May 2008. [Google Scholar]
- Tsuji, Y.; Namikawa, T.; Fujii, M.; Hayashi, R.; Kitamura, M.; Nakamizu, K.; Ohbi, T.; Saeki, K.; Yamamoto, T.; Inamori, N.; et al. Methane hydrate occurrence and distribution in the eastern Nankai Trough, Japan: Findings of the Tokai-oki to Kumano-nada methane hydrate drilling program. In Natural Gas Hydrates—Energy Resource Potential and Associated Geologic Hazards; Collett, T., Jonhson, A., Knapp, C., Boswell, R., Eds.; AAPG Memoir 89; AAPG: Tulsa, OK, USA, 2009. [Google Scholar]
- Spence, G.D.; Haacke, R.R.; Hyndman, R.D. Seismic indicators of Natural Gas Hydrate and underlying free gas. In Geophysical Characterization of Gas Hydrates; Riedel, M., Willoughby, E.C., Chopra, S., Eds.; Society of Exploration Geophysicists: Tulsa, OK, USA, 2010; pp. 39–71. [Google Scholar]
- Taladay, K.T.; Moore, G.F. Concentrated Gas Hydrate Deposits in the Kumano Forearc Basin, Nankai Trough, Japan. Fire in the Ice 2015, 15, 1–4. Available online: https://www.netl.doe.gov/File%20Library/Research/Oil-Gas/methane%20hydrates/MHNews_2015_April.pdf (accessed on 15 September 2015).
- Wessel, P.; Smith, W.H.F.; Scharroo, R.; Luis, J.F.; Wobbe, F. Generic mapping tools: Improved version released. EOS Trans. Am. Geophys. Union 2013, 94, 409–410. [Google Scholar] [CrossRef]
- Fujii, T.; Saeki, T.; Kobayashi, T.; Inamori, T.; Hayashi, M.; Takano, O.; Takayama, T.; Kawasaki, T.; Nagakubo, S.; Nakamizu, M.; et al. Japan Oil, Gas and Metals National Corporation (JOGMEC) Resource Assessment of Methane Hydrate in the Eastern Nankai Trough, Japan. In Proceedings of the Offshore Technology Conference, Houston, TX, USA, 5–8 May 2008. [Google Scholar]
- Uchida, T.; Hirano, T.; Ebinuma, T.; Narita, H.; Gohara, K.; Mae, S.; Matsumoto, R. Raman spectroscopic determination of hydrate number of methane hydrates. AIChE J. 1999, 45, 2641–2645. [Google Scholar] [CrossRef]
- Bahk, J.-J.; Kim, D.-H.; Chun, J.-H.; Son, B.-K.; Kim, J-H.; Ryu, B.-J.; Torres, M.E.; Riedel, M.; Schultheiss, P. Gas hydrate occurrences and their relation to host sediment properties: Results from Second Ulleung Basin gas hydrate drilling expedition, East Sea. Mar. Pet. Geol. 2013, 47, 21–29. [Google Scholar] [CrossRef]
- Bahk, J.-J.; Kim, G.-Y.; Chun, J.-H.; Kim, J.-H.; Lee, J.Y.; Ryu, B.-J.; Lee, J.-H.; Son, B.-K. Characterization of gas hydrate reservoirs by integration of core and log data in the Ulleung Basin, East Sea. Mar. Pet. Geol. 2013, 47, 30–42. [Google Scholar] [CrossRef]
- Doan, M.-L.; Henry, P.; Conin, M.; Wiersberg, T.; Boutt, D.; Buchs, D.; Saffer, D.; McNeill, L.C.; Cukur, D.; Lin, W. Quantification of free gas in the Kumano fore-arc basin detected from borehole physical properties: IODP NanTroSEIZE drilling Site C0009. Geochem. Geophys. Geosyst. 2011, 12, Q0AD06. [Google Scholar] [CrossRef]
- Harris, R.N.; Schmidt-Schierhorn, F.; Spinelli, G. Heat Flow along the NanTroSEIZE transect: Results from IODP Expeditions 315 and 316 offshore the Kii Peninsula, Japan. Geochem. Geophys. Geosyt. 2011, 12, GC003593. [Google Scholar] [CrossRef]
- Miyakawa, A.; Saito, S.; Yamada, Y.; Tomaru, H.; Kinoshita, M.; Tsuji, T. Gas hydrate saturation at Site C0002, IODP Expeditions 314 and 315, in the Kumano Basin, Nankai Trough. Isl. Arc 2014, 23, 142–156. [Google Scholar] [CrossRef]
- Malinverno, A.; Goldberg, D.S. Testing short-term migration of microbial methane as a hydrate formation mechanism: Results from Andaman Sea and Kumano Basin drill sites and global implications. Earth Planet. Sci. Lett. 2015, 422, 105–114. [Google Scholar] [CrossRef]
- Jia, J.; Tsuji, T.; Matsuoka, T. Gas hydrate saturation and distribution in the Kumano Forearc Basin of the Nankai Trough. EG 2016, EG15127. Explor. Geophys. 2017, 48, 1–14. [Google Scholar] [CrossRef]
- Vargas-Cordero, I.; Tinivella, U.; Villar-Munoz, L.; Giustiniani, M. Gas hydrate and free gas estimation from seismic analysis offshore Chiloé island (Chile). Andean Geol. 2016, 43, 263–274. [Google Scholar] [CrossRef]
- Haacke, R.R.; Westbrook, G.K.; Hyndman, R.D. Gas hydrate, fluid flow and free gas: Formation of the bottom simulating reflector. Earth Planet. Sci. Lett. 2007, 261, 407–420. [Google Scholar] [CrossRef]
- Wang, X.; Lee, M.; Collett, T.; Yang, S.; Guo, Y.; Wu, S. Gas hydrate identified in sand-rich inferred sedimentary section using downhole logging and seismic data in Shenhu area, S. China Sea. Mar. Pet. Geol. 2014, 51, 298–306. [Google Scholar] [CrossRef]
- Shedd, W.; Boswell, R.; Frye, M.; Godfriaux, P.; Kramer, K. Occurrence and nature of “bottom simulating reflectors” in the northern Gulf of Mexico. Mar. Pet. Geol. 2012, 34, 31–40. [Google Scholar] [CrossRef]
- Pecher, I.A.; Kukowski, N.; Huebscher, C.; Greinert, J.; Bialas, J. The link between bottomsimulating reflections and methane flux into the gas hydrate stability zone-new evidence from Lima Basin, Peru Margin. Earth Planet. Sci. Lett. 2001, 185, 343–354. [Google Scholar] [CrossRef]
- Baba, K.; Yamada, Y. BSRs and associated reflections as an indicator of gas hydrate and free gas accumulation: An example of accretionary prism and forearc basin system along the Nankai Trough, off central Japan. Res. Geol. 2004, 54, 11–24. [Google Scholar] [CrossRef]
- Yoo, D.G.; Kang, N.K.; Yi, B.Y.; Kim, Y.G.; Ryu, B.J.; Lee, K.; Lee, G.H.; Riedel, M. Occurrence and seismic characteristics of gas hydrate in the Ulleung Basin, East Sea. Mar. Pet. Geol. 2013, 47, 236–247. [Google Scholar] [CrossRef]
- Cook, A.E.; Goldberg, D.; Kleinberg, R.L. Fracture-controlled gas hydrate systems in the northern Gulf of Mexico. Mar. Pet. Geol. 2008, 25, 932–941. [Google Scholar] [CrossRef]
- Simonetti, A.; Knapp, J.H.; Sleeper, K.; Lutken, C.B.; Macelloni, L.; Knapp, C. Spatial distribution of gas hydrates from high-resolution seismic and core data, Woolsey Mound, Northern Gulf of Mexico. Mar. Pet. Geol. 2013, 44, 21–23. [Google Scholar] [CrossRef]
- Collett, T.; Riedel, M.; Cochran, J.; Boswell, R.; Presley, J.; Kumar, P.; Sathe, A.; Sethi, A.; Lall, M.; NGHP Expedition Scientists. Indian National Gas Hydrate Program Expedition 01 report. In U.S. Geological Survey Scientific Investigations Report 2012–5054; USGS: Dever, CO, USA, 2015; p. 1442. [Google Scholar]
- Housen, B.A.; Musgrave, R.J. Rock magnetic signature of gas hydrates in accretionary prism sediments. Earth Planet. Sci. Lett. 1996, 139, 509–519. [Google Scholar] [CrossRef]
- Musgrave, R.J.; Bangs, L.N.; Larrasoaña, J.C.; Gràcia, E.; Hollamby, J.A.; Vega, M.E. Rise of the base of the gas hydrate zone since the last glacial recorded by rock magnetism. Geology 2006, 34, 117–120. [Google Scholar] [CrossRef]
- Kars, M.; Kodama, K. Authigenesis of magnetic minerals in gas hydrate-bearing sediments in the Nankai Trough, offshore Japan. Geochem. Geophys. Geosys. 2015, 16, 947–961. [Google Scholar] [CrossRef]
- Inamori, T.; Hato, M. Detection of methane hydrate-bearing zones from seismic data. Resour. Geol. 2004, 54, 99–104. [Google Scholar] [CrossRef]
- Boswell, R.; Collett, T.; Frye, M.; Shedd, W.; McConnell, R.; Shelander, D. Subsurface gas hydrates in the northern Gulf of Mexico. Mar. Pet. Geol. 2012, 34, 4–30. [Google Scholar] [CrossRef]
- Kida, M.; Jin, Y.; Watanabe, M.; Konno, Y.; Yoneda, J.; Egawa, K.; Ito, T.; Nakatsuka, Y.; Suzuki, K.; Fujii, T.; et al. Chemical and crystallographic characterizations of natural gas hydrate recovered from a production test site in the Eastern Nankai Trough. Mar. Pet. Geol. 2015, 66, 396–403. [Google Scholar] [CrossRef]
- Rodrigo, C.; González-Fernádez, A.; Vera, E. Variability of the bottom simulating reflector (BSR) and its association with tectonic structure in the Chilean margin between Arauco Gulf (37° S) and Valdivia (40° S). Mar. Geophys. Res. 2009, 30, 1–19. [Google Scholar] [CrossRef]
- Avseth, P.; Mukerji, T.; Mavko, G. Quantitative Seismic Interpretation: Applying Rock Physics Tools to Reduce Interpretation Risk; Cambridge University Press: Cambridge, UK, 2010; Chapter 4; pp. 168–256. ISBN 978-0-521-15135-1. [Google Scholar]
- Nyamapfumba, M.; McMechan, G.A. Gas hydrate and free gas petroleum system in 3D seismic data, offshore Angola. Geophysics 2012, 77, 55–63. [Google Scholar] [CrossRef]
- Otsuka, H.; Morita, S.; Tanahashi, M.; Ashi, J. Foldback reflectors near methane hydrate bottom simulating reflectors: Indicators of gas distribution from 3D seismic images in the eastern Nankai Trough. Isl. Arc 2015, 24, 145–158. [Google Scholar] [CrossRef]
- Brown, A.R. Interpretation of Three-Dimensional Seismic Data, 7th ed.; American Association of Petroleum Geologists: Tulsa, OK, USA, 2010. [Google Scholar]
- Jones, A.T.; Greinert, J.; Bowden, D.A.; Klaucke, I.; Petersene, C.J.; Netzeban, G.L.; Weinre, W. Acoustic and visual characterization of methane-rich seabed seeps at Omakere Ridge on the Hikurangi Margin, New Zealand. Mar. Geol. 2010, 272, 154–169. [Google Scholar] [CrossRef] [Green Version]
- Plaza-Faverola, A.; Klaeschen, D.; Barnes, P.; Pecher, I.; Henrys, S.; Mountjoy, J. Evolution of fluid expulsion and concentrated hydrate zones across the southern Hikurangi subduction margin, New Zealand: An analysis from depth migrated seismic data. Geochem. Geophys. Geosyst. 2012, 13, Q08018. [Google Scholar] [CrossRef]
- Smith, G.L.; McNeill, L.C.; Henstock, T.J.; Arraiz, D.; Spiess, V. Fluid generation and distribution in the highest sediment input accretionary margin, the Makran. Earth Planet. Sci. Lett. 2014, 403, 131–143. [Google Scholar] [CrossRef]
- Daigle, H.; Dugan, B. Capillary controls on methane hydrate distribution and fracturing in advective systems. Geochem. Geophys. Geosyst. 2011, 12, Q01003. [Google Scholar] [CrossRef]
- Paull, C.K.; Dillion, W.P. Natural Gas Hydrates Occurrence, Distribution, and Detection; Geophysical Monograph; American Geophysical Union: Washington, DC, USA, 2001; p. 315. ISBN 9781118668412. [Google Scholar]
- Hyndman, R.D.; Davis, E.E. A mechanism for the formation of methane hydrate and seafloor bottom simulating reflectors by vertical fluid expulsion. J. Geophys. Res. 1992, 97, 7025–7041. [Google Scholar] [CrossRef]
- Saffer, D.M.; Screaton, E.J. Fluid flow at the toe of convergent margins: Interpretation of sharp pore-water geochemical gradients. Earth Planet. Sci. Lett. 2003, 213, 261–270. [Google Scholar] [CrossRef]
- Solomon, E.A.; Kastner, M.; Wheat, G.; Jannasch, H.W.; Robertson, G.; Davis, E.E.; Morris, J.D. Long-term hydrogeochemical records in the oceanic basement and forearc prism at the Costa Rica subduction zone. Earth Planet. Sci. Lett. 2009, 282, 240–251. [Google Scholar] [CrossRef]
- Hammerschmidt, S.B.; Wiersberg, T.; Heuer, V.B.; Wendt, J.; Erzinger, J.; Kopf, A. Real-time drilling mud gas monitoring for qualitative evaluation of hydrocarbon gas composition during deep sea drilling in the Nankai Trough Kumano Basin. Geochem. Trans. 2014, 15, 1–15. [Google Scholar] [CrossRef] [PubMed]
- Macelloni, L.; Lutken, C.B.; Garg, S.; Simonettie, A.; D’Emidio, M.; Wilson, R.M.; Sleeper, K.; Lapham, L.L.; Lewis, T.; Pizzi, M.; et al. Heat-flow regimes and the hydrate stability zone of a transient thermogenic, fault-controlled hydrate system (Woolsey Mound Northern Gulf of Mexico). Mar. Pet. Geol. 2015, 59, 491–504. [Google Scholar] [CrossRef]
- Wood, W.T.; Gettrust, J.F.; Chapman, N.R.; Spence, G.D.; Hyndman, R.D. Decreased stability of methane hydrates in marine sediments owing to phase-boundary roughness. Nature 2002, 420, 656–660. [Google Scholar] [CrossRef] [PubMed]
- Haines, S.S.; Hart, P.E.; Collett, T.S.; Shedd, W.; Frye, M.; Weimer, P.; Boswell, R. High-resolution seismic characterization of the gas and gas hydrate system at Green Canyon 955, Gulf of Mexico, USA. Mar. Pet. Geol. 2017, 82, 220–237. [Google Scholar] [CrossRef]
- Pape, T.; Geprags, P.; Hammerschmidt, S.; Wintersteller, P.; Wei, J.; Fleischmann, T.; Bohrmann, G.; Kopf, A.J. Hydrocarbon seepage and its sources at mud volcanoes of the Kumano forearc basin, Nankai Trough subduction zone. Geochem. Geophys. Geosyst. 2014, 15, 2180–2194. [Google Scholar] [CrossRef]
- Reed, D.L.; Silver, E.A.; Tagudin, J.E.; Shipley, T.H.; Vrolijk, P. Relations between mud volcanoes, thrust deformation, slope sedimentation and gas hydrates, offshore north Panama. Mar. Pet. Geol. 1990, 7, 44–54. [Google Scholar] [CrossRef]
- Milkov, A.V. Worldwide distribution of submarine mud volcanoes and associate gas hydrates. Mar. Geol. 2000, 167, 29–42. [Google Scholar] [CrossRef]
- Mazurenko, L.L.; Soloviev, V.A.; Gardner, J.M.; Ivanov, M.K. Gas hydrates in the Ginsburg and Yuma mud volcano sediments (Moroccan Margin): Results of chemical and isotopic studies of pore water. Mar. Geol. 2003, 195, 201–210. [Google Scholar] [CrossRef]
- Ben-Avraham, Z.; Reshef, M.; Smith, G. Seismic signature of gas hydrate and mud volcanoes of the South African continental margin. In Mud Volcanoes, Geodynamics and Seismicity; Martinelli, G., Panahi, B., Eds.; Springer: Berlin/Heidelberg, Germany, 2005; pp. 17–27. [Google Scholar]
- Shnyukov, E.F. Mud Volcanoes of the Black Sea as a prospecting Indicator of methane hydrates. Lith. Min. Resour. 2013, 48, 114–121. [Google Scholar] [CrossRef]
- Boswell, R.; Collett, T.S. Current perspectives on gas hydrate resources. Energy Environ. Sci. 2011, 4, 1206–1215. [Google Scholar] [CrossRef]
- Shelander, D.; Dai, J.; Bunge, G.; Singh, S.; Eissa, M.; Fisher, K. Estimating saturation of gas hydrates using conventional 3-D data, Gulf of Mexico Joint Industry Project Leg II. Mar. Pet. Geol. 2012, 34, 96–110. [Google Scholar] [CrossRef]
- Fohrmann, M.; Pecher, I.A. Analyzing sand-dominated channel systems for potential gas-hydrate-reservoirs using an AVO seismic inversion technique on the Southern Hikurangi Margin, New Zealand. Mar. Pet. Geol. 2012, 38, 19–34. [Google Scholar] [CrossRef]
- Toki, T.; Uehara, Y.; Kinjo, K.; Ijiri, A.; Tsunogai, U.; Tomaru, H.; Ashi, J. Methane production and accumulation in the Nankai accretionary prism: Results from IODP Expedition 345 and 316. Geochem. J. 2012, 46, 89–106. [Google Scholar] [CrossRef]
- Kinoshita, M.; Tobin, H.; Ashi, J.; Kimura, G.; Lallemant, S.; Screaton, E.J.; Curewitz, D.; Masago, H.; Moe, K.T.; the Expedition 314/315/316 Scientists. Expedition 315 Site C0002. In Proceedings of the Integrated Ocean Drilling Program; Integrated Ocean Drilling Program Management International, Inc.: Washington, DC, USA, 2009; Volume 314/315/316, pp. 1–76. [Google Scholar]
Figure 1.
(A) The Nankai Trough is formed by the oblique subduction of the Philippine Sea Plate beneath the Eurasian Plate at a rate of about 4.0–6.5 cm/year [24]. Sediments are delivered to the basin by submarine channels (red arrows) and are being incorporated into the underlying thickening accretionary prism [25,26]. Our study site perimeter is bounded by the red box and drill sites C0002, C0009 are indicated by red dots. The blue dot marks the location of the Atsumi Knoll drill site; (B) Kumano Basin bathymetry. The survey perimeter is indicated by the dashed black line; (C) Arbitrary seismic line through Sites C0002 and C0009 for sediment and drilling depth reference.

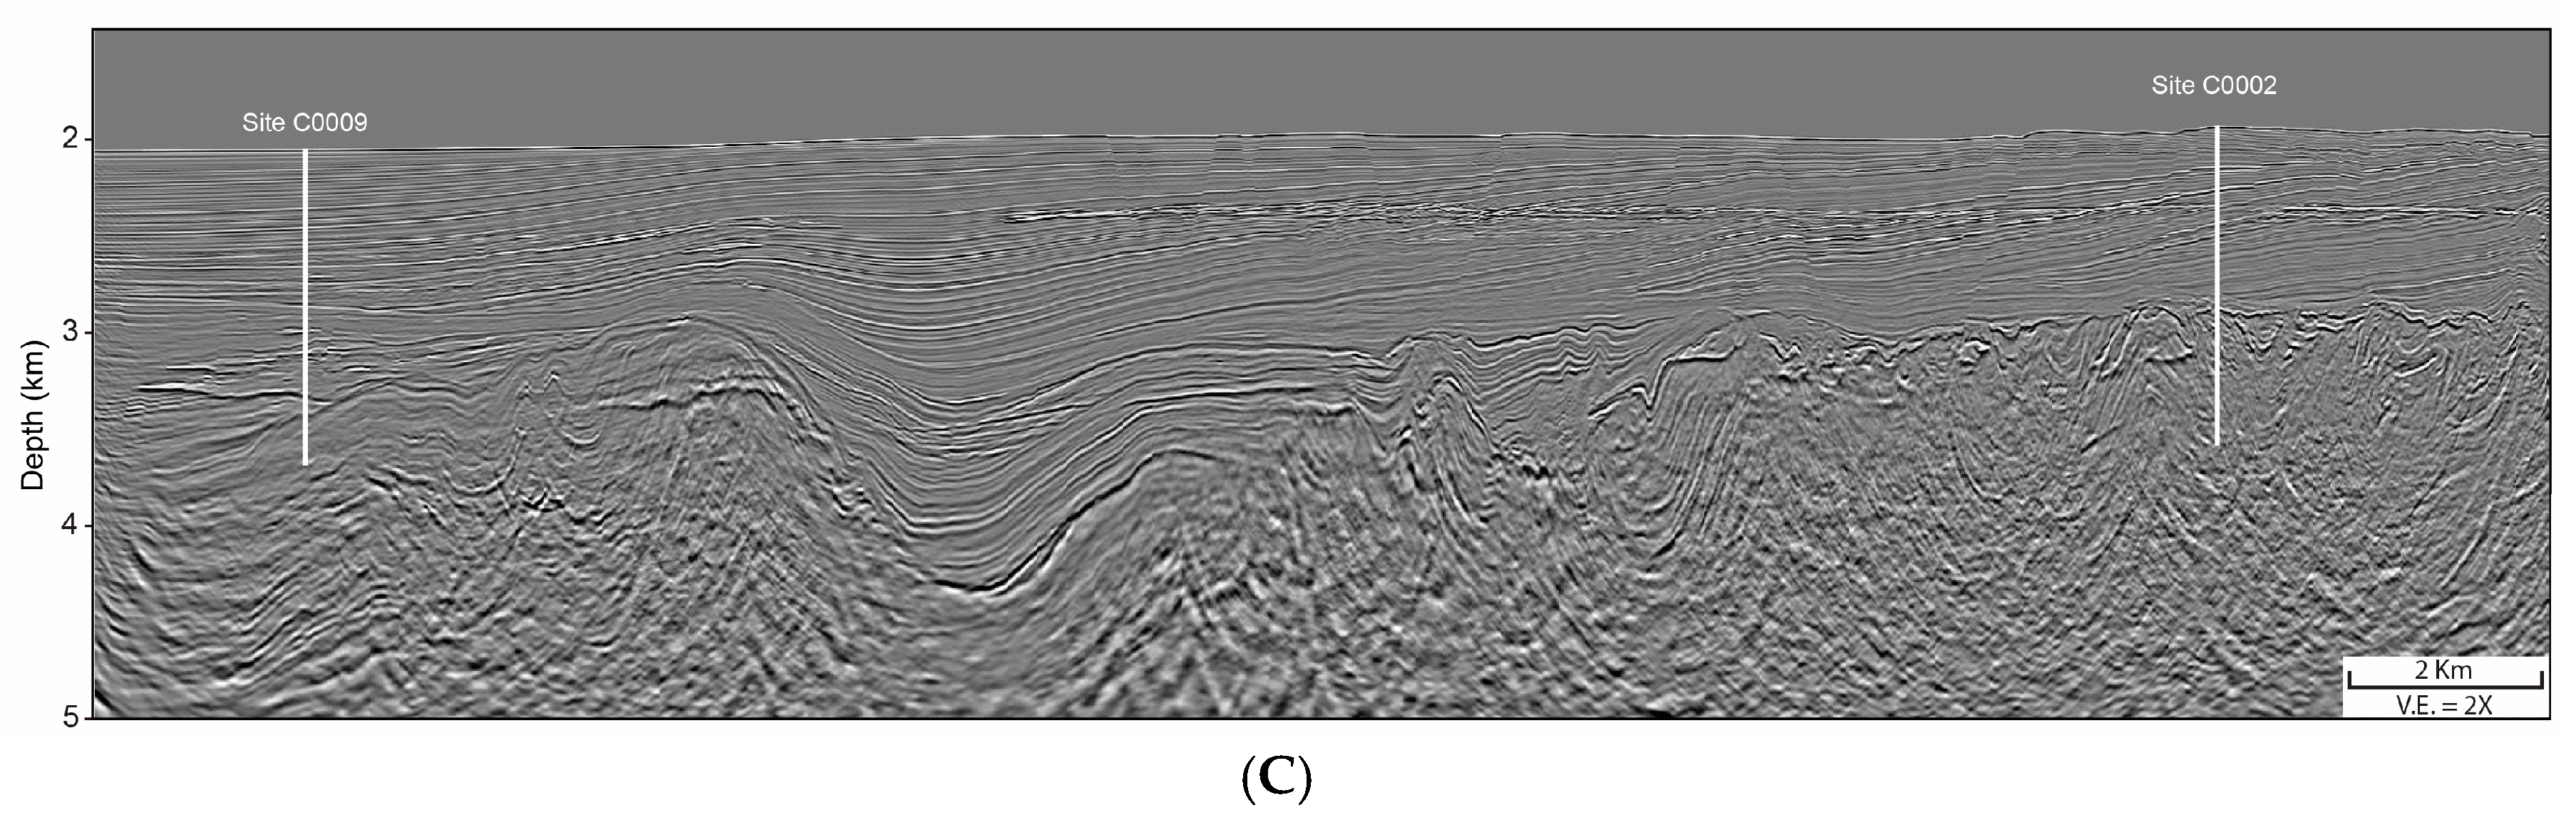
Figure 2.
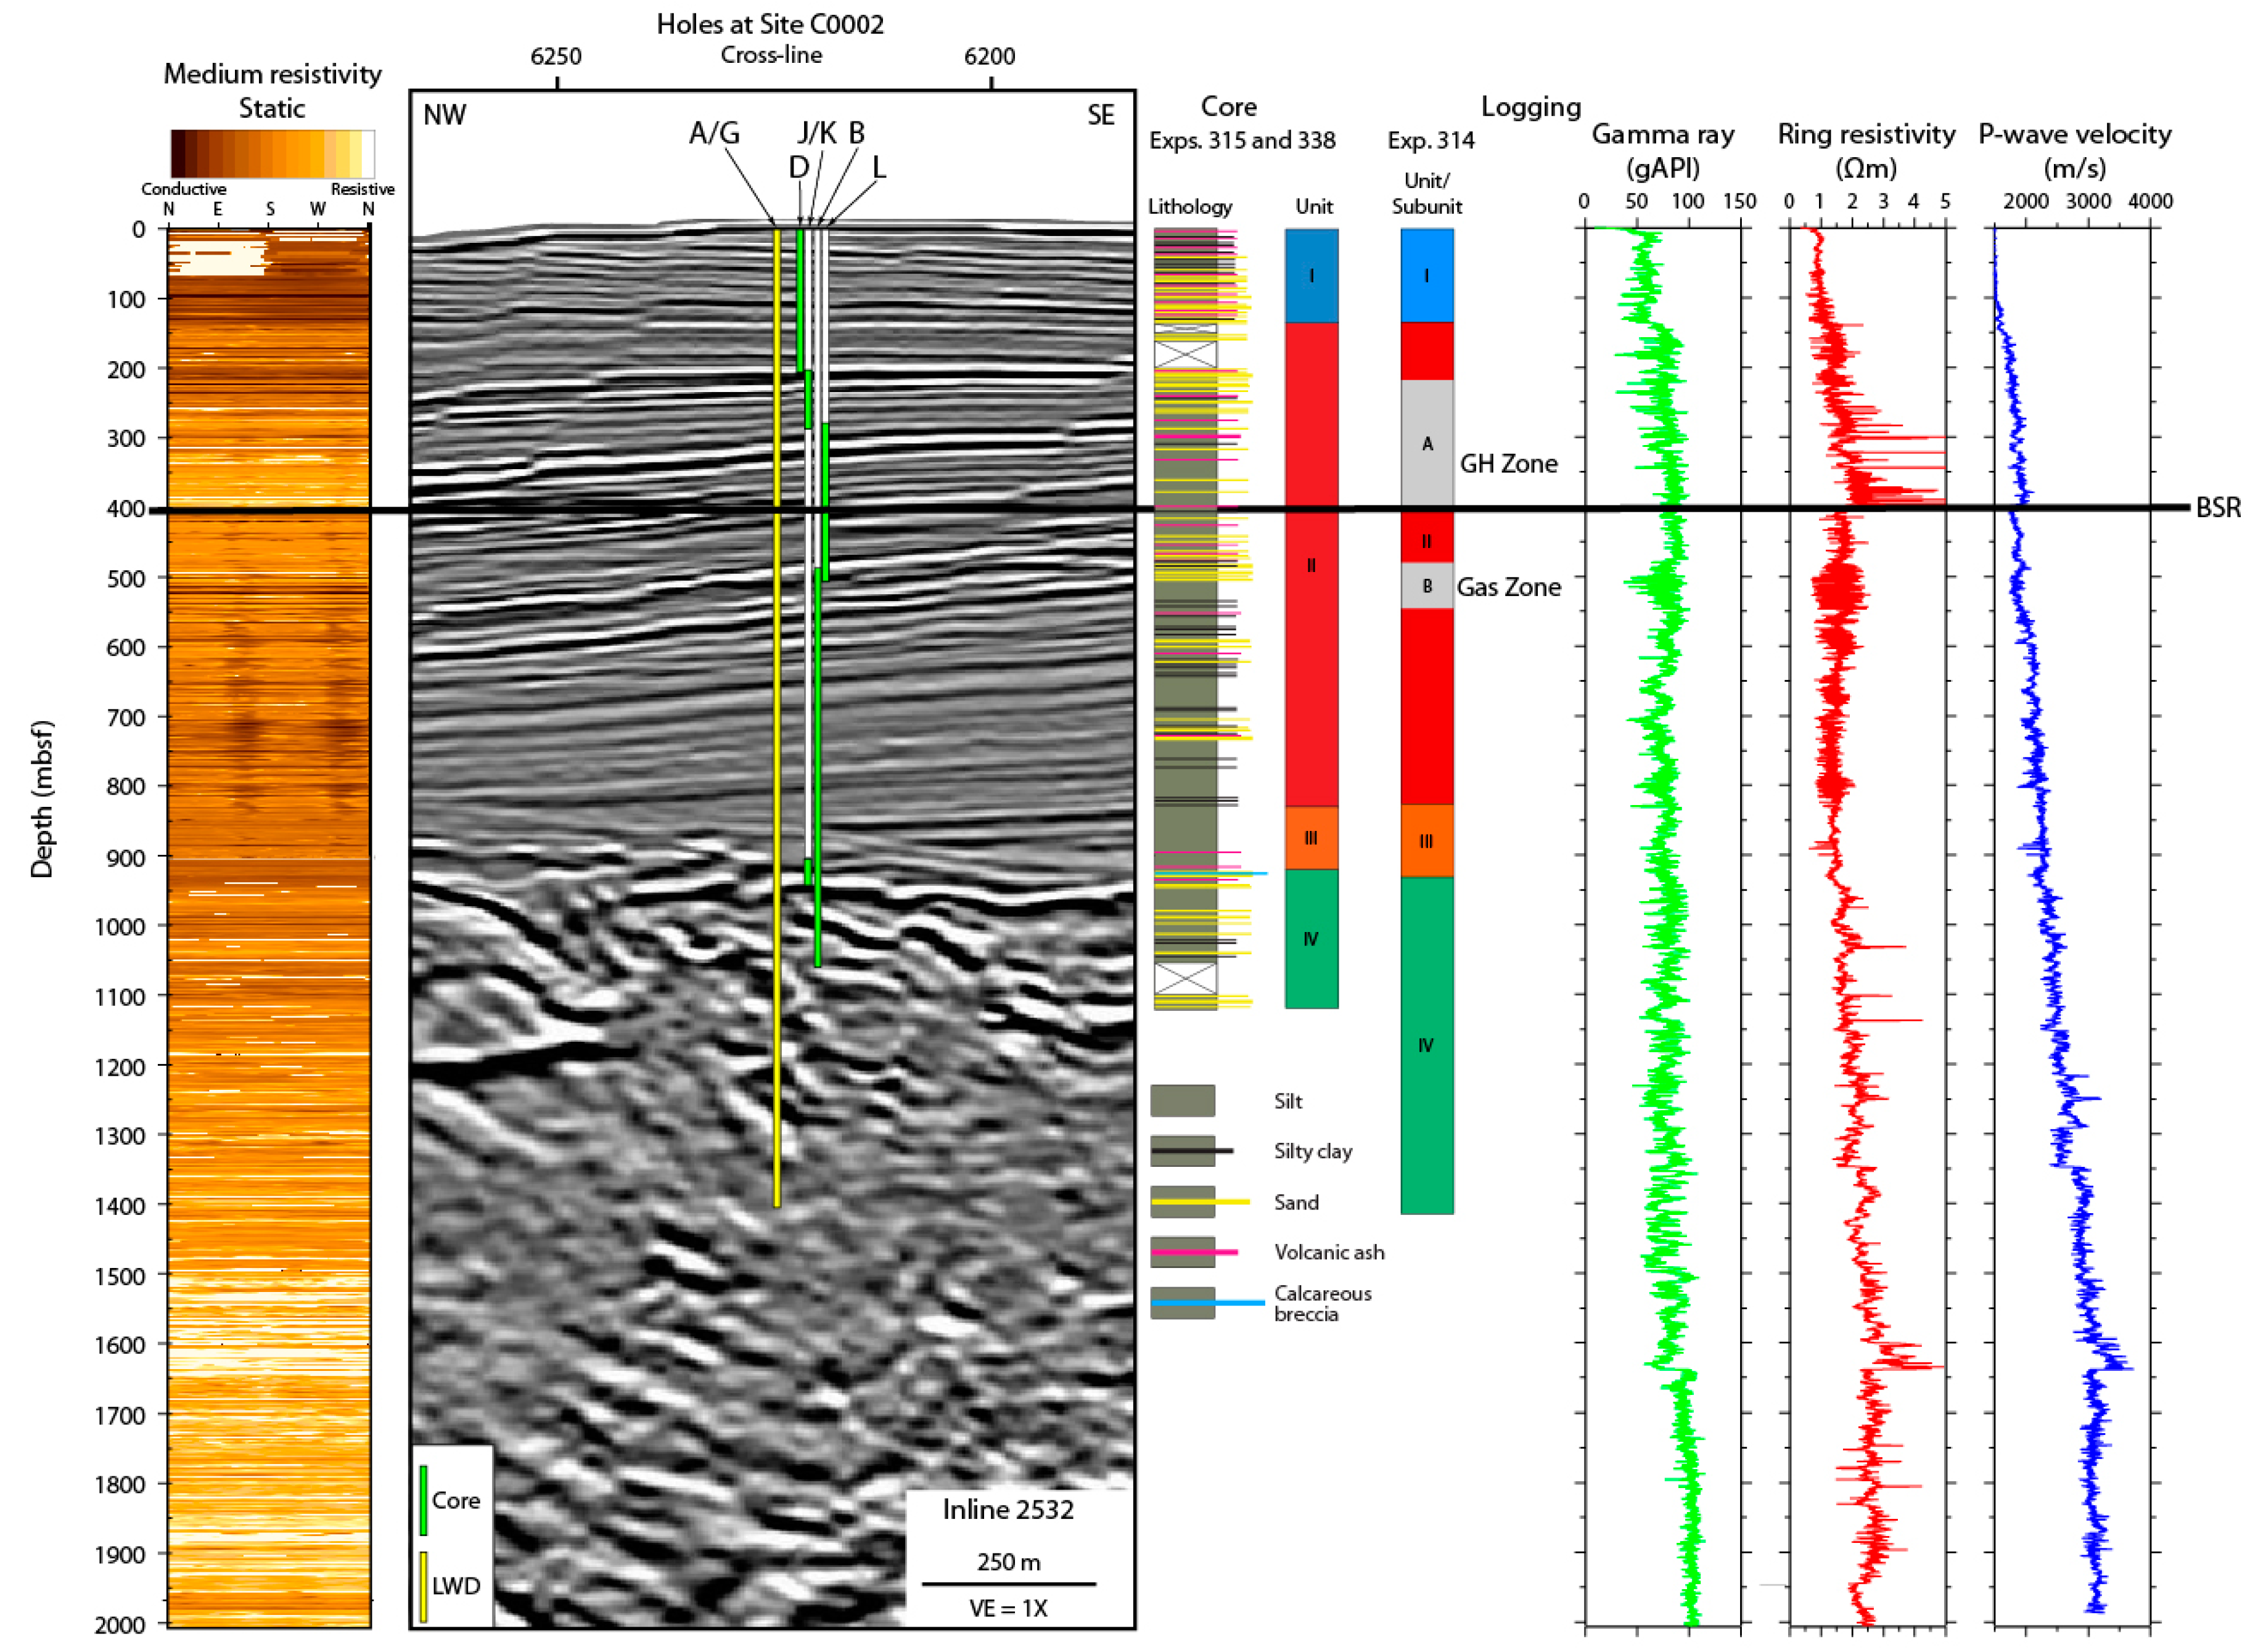
Core-log-seismic integration at Site C0002 showing composite medium button static resistivity, composite core lithology, logging units and composite logging-while-drilling (LWD) data. The BSR occurs at ~400 mbsf. High resistivity spikes are present above the BSR. Subunit A was noted to have high gas hydrate occurrences and Subunit B was a gas saturated zone. Figure modified from [26].
Figure 2.
Core-log-seismic integration at Site C0002 showing composite medium button static resistivity, composite core lithology, logging units and composite logging-while-drilling (LWD) data. The BSR occurs at ~400 mbsf. High resistivity spikes are present above the BSR. Subunit A was noted to have high gas hydrate occurrences and Subunit B was a gas saturated zone. Figure modified from [26].

Figure 3.
(A) Bathymetric map of the study zone for reference; (B) BSR depth map in meters below sea-level. Red triangles represent drill Sites C0009 and C0002. The BSR generally mirrors the seafloor behavior and is continuous across the large normal faults. Blank zones in the BSR map within the survey regions are areas where BSRs were not imaged in the seismic data.
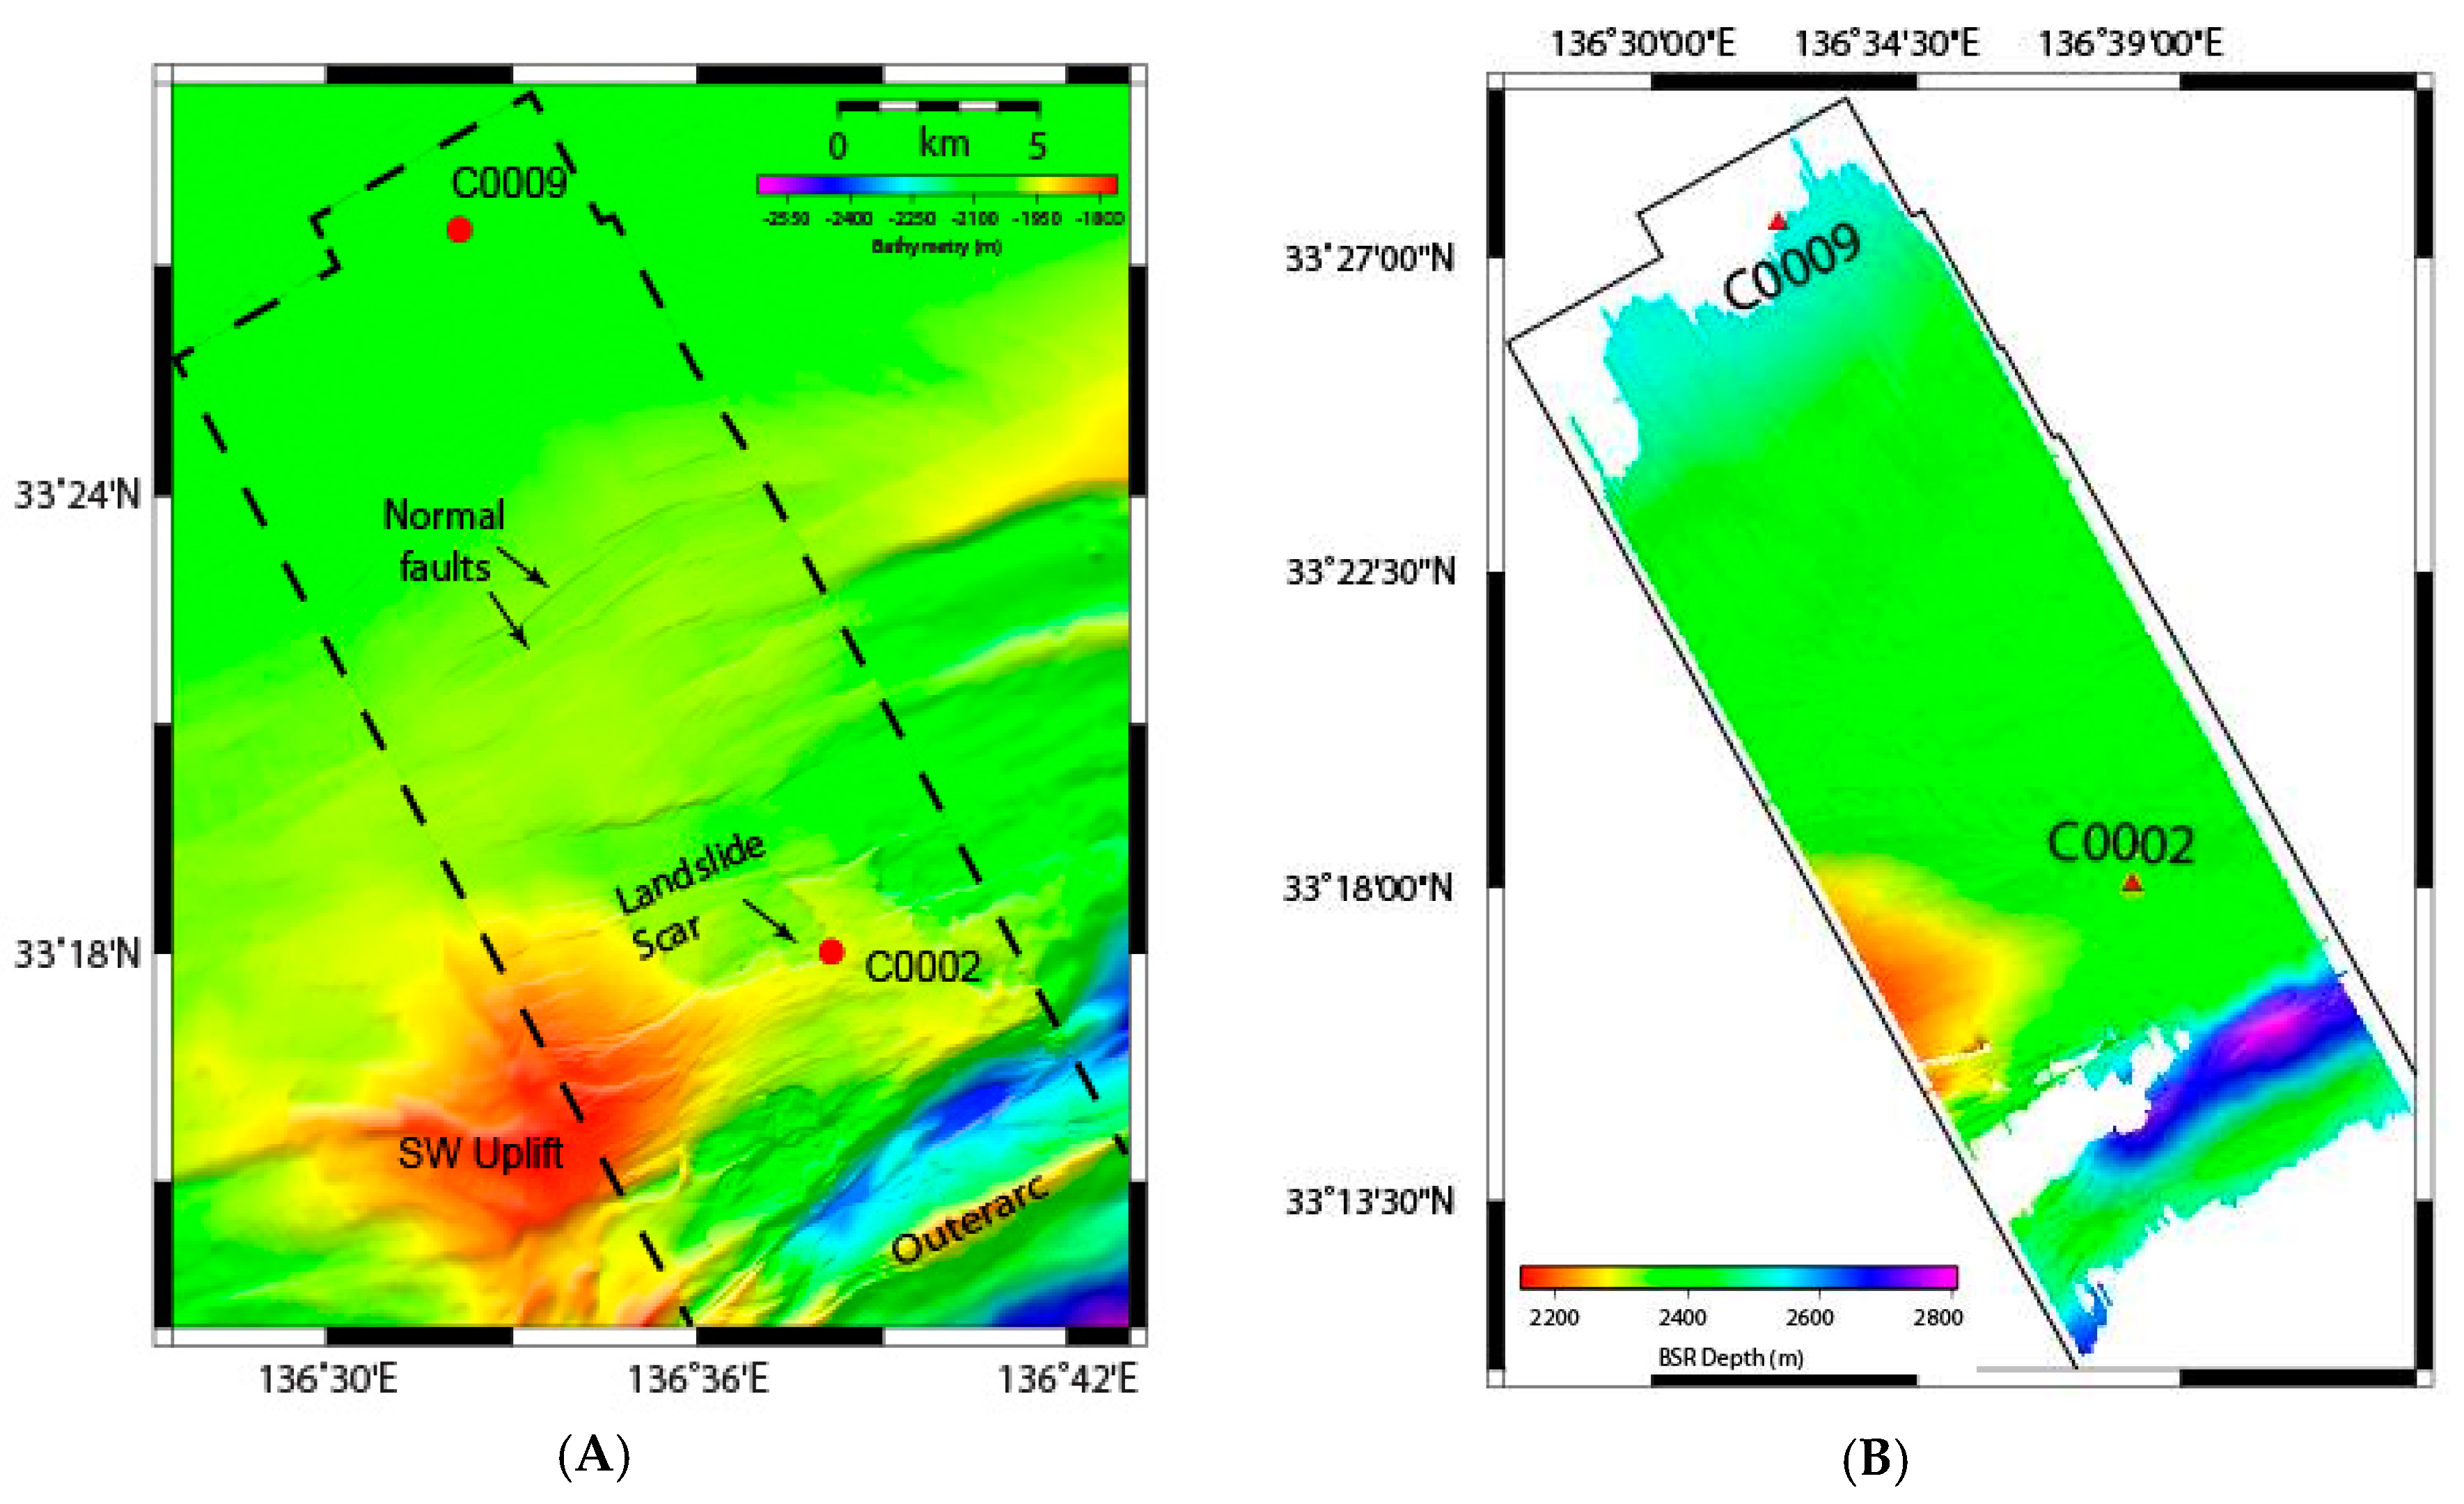
Figure 4.
(A) Seismic Inline 2577 displaying an example of BSR amplitude strengths across sandy units (strong) and clay rich units (weaker). HARs below BSR indicate presence of gas saturated sands. Many dipping beds change polarity across the BSR and the BSR is continuous across the large normal faults. (B) Bathymetric map of the study zone with the extent of IL 2577 shown for reference.

Figure 5.
(A) Distribution of Upper BSRs. The isopach thicknesses range from 10–100 m with an average value of 40 m. This thickness map is the thickness of hydrate concentration zones; (B) Bathymetric map of the study zone for reference.
Figure 5.
(A) Distribution of Upper BSRs. The isopach thicknesses range from 10–100 m with an average value of 40 m. This thickness map is the thickness of hydrate concentration zones; (B) Bathymetric map of the study zone for reference.
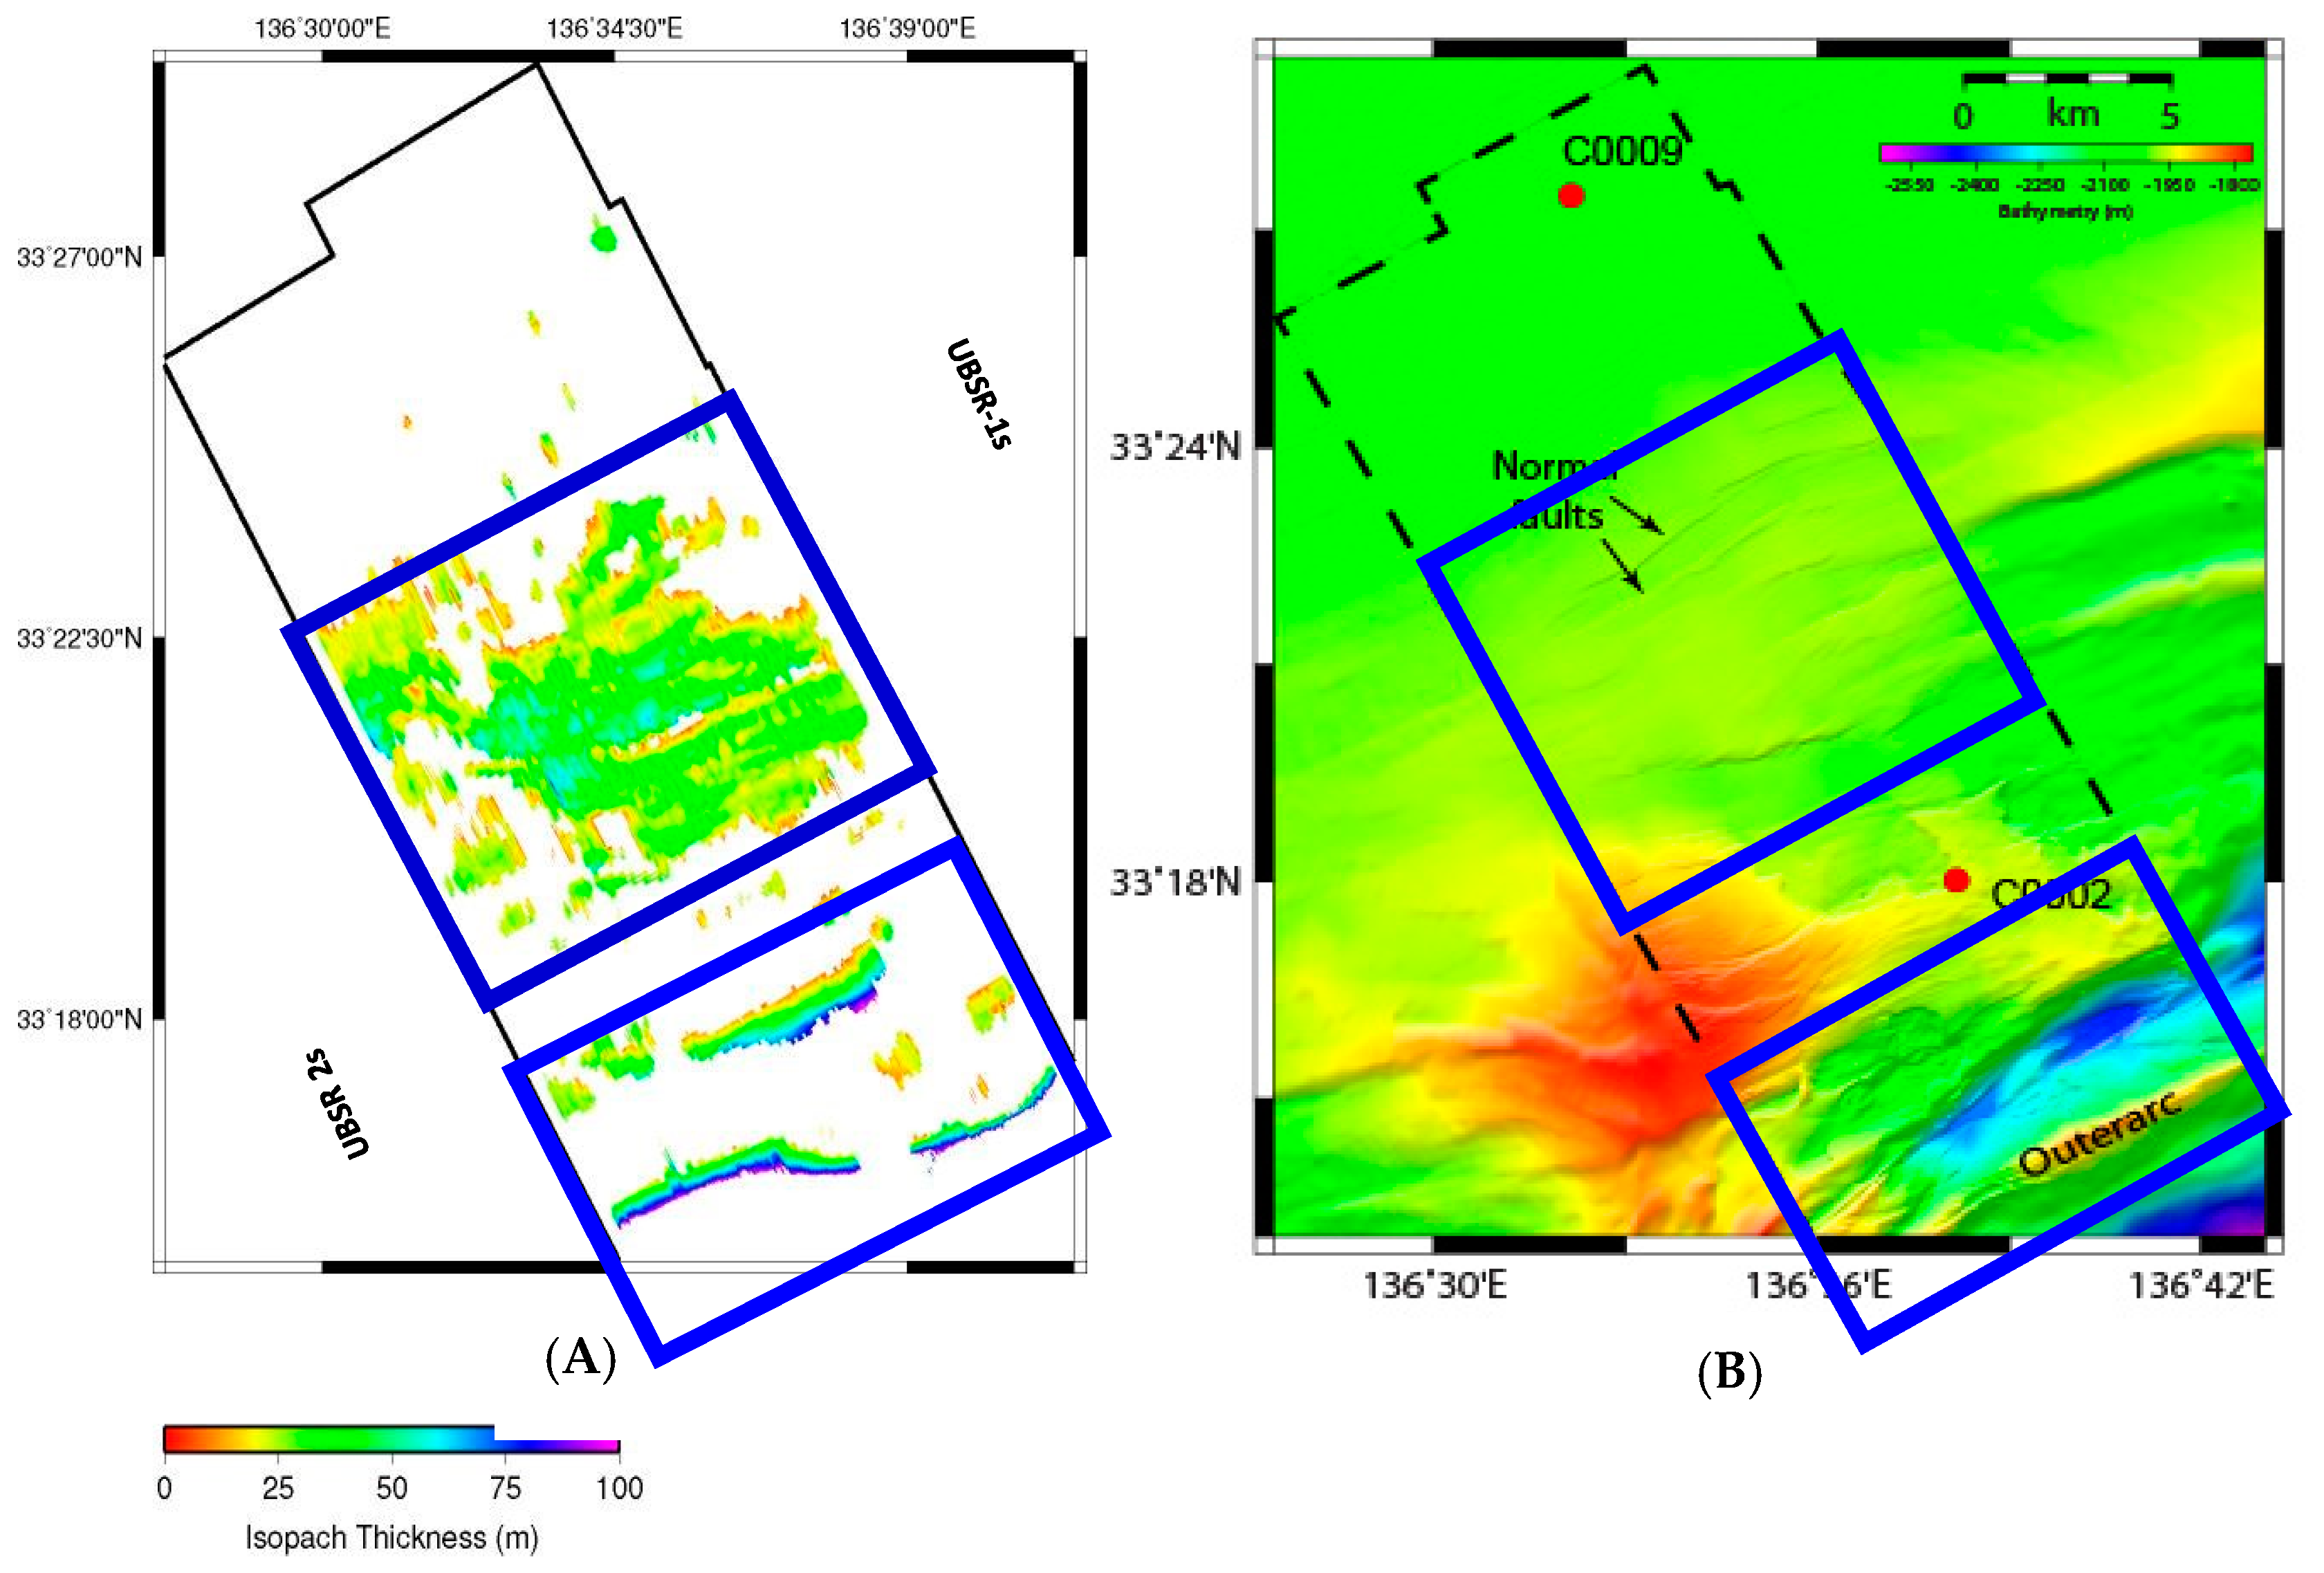
Figure 6.
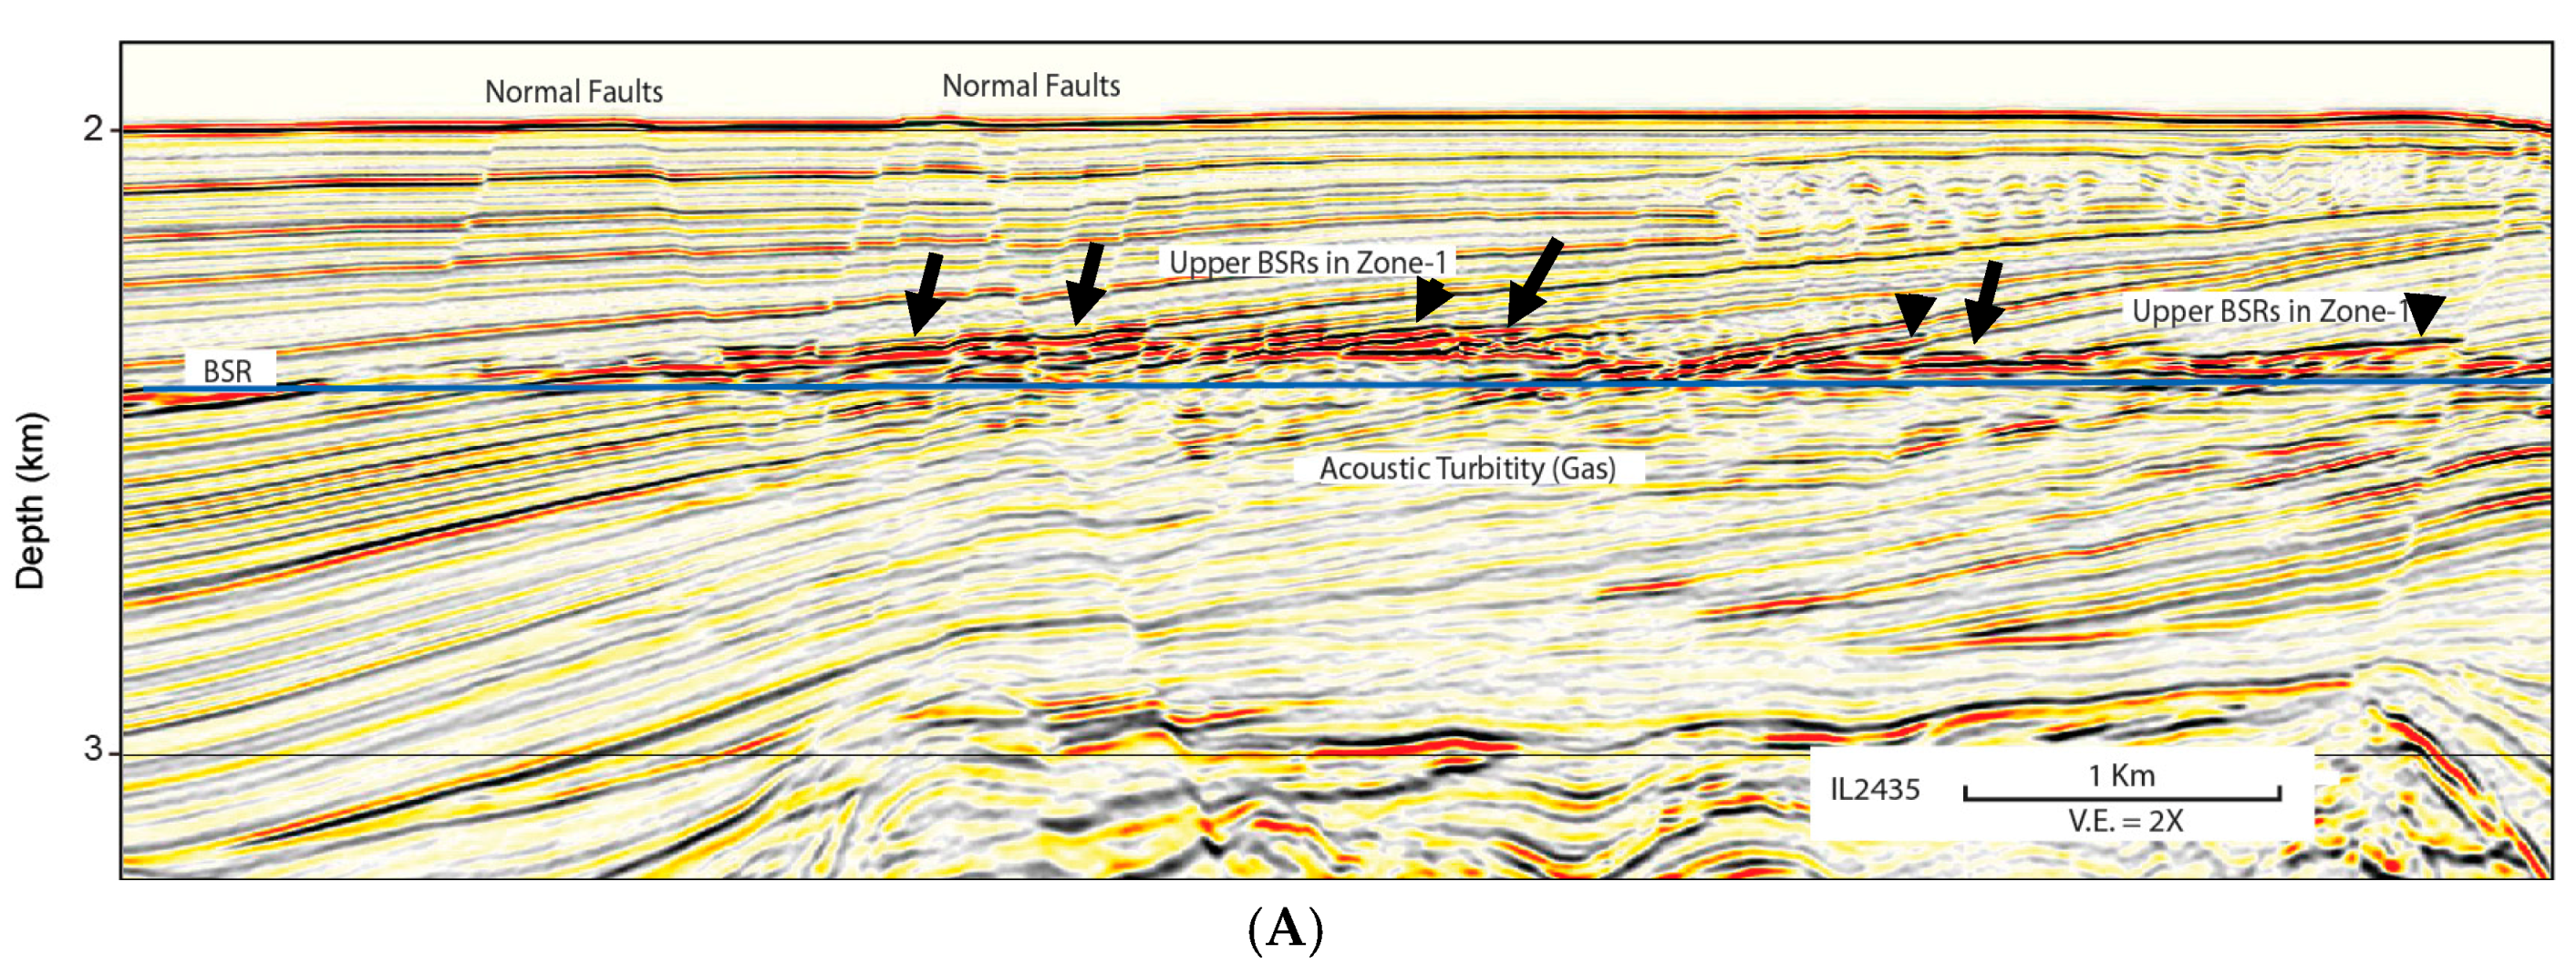
(A) Inline 2435 showing representative cross section through the Upper BSRs in Zone-1. Note termination pattern against the normal faults, a strong BSR (interpreted blue line) and indicators of gas beneath. (B) Bathymetric map of the study zone with the extent of IL 2435 shown for reference.
Figure 6.
(A) Inline 2435 showing representative cross section through the Upper BSRs in Zone-1. Note termination pattern against the normal faults, a strong BSR (interpreted blue line) and indicators of gas beneath. (B) Bathymetric map of the study zone with the extent of IL 2435 shown for reference.

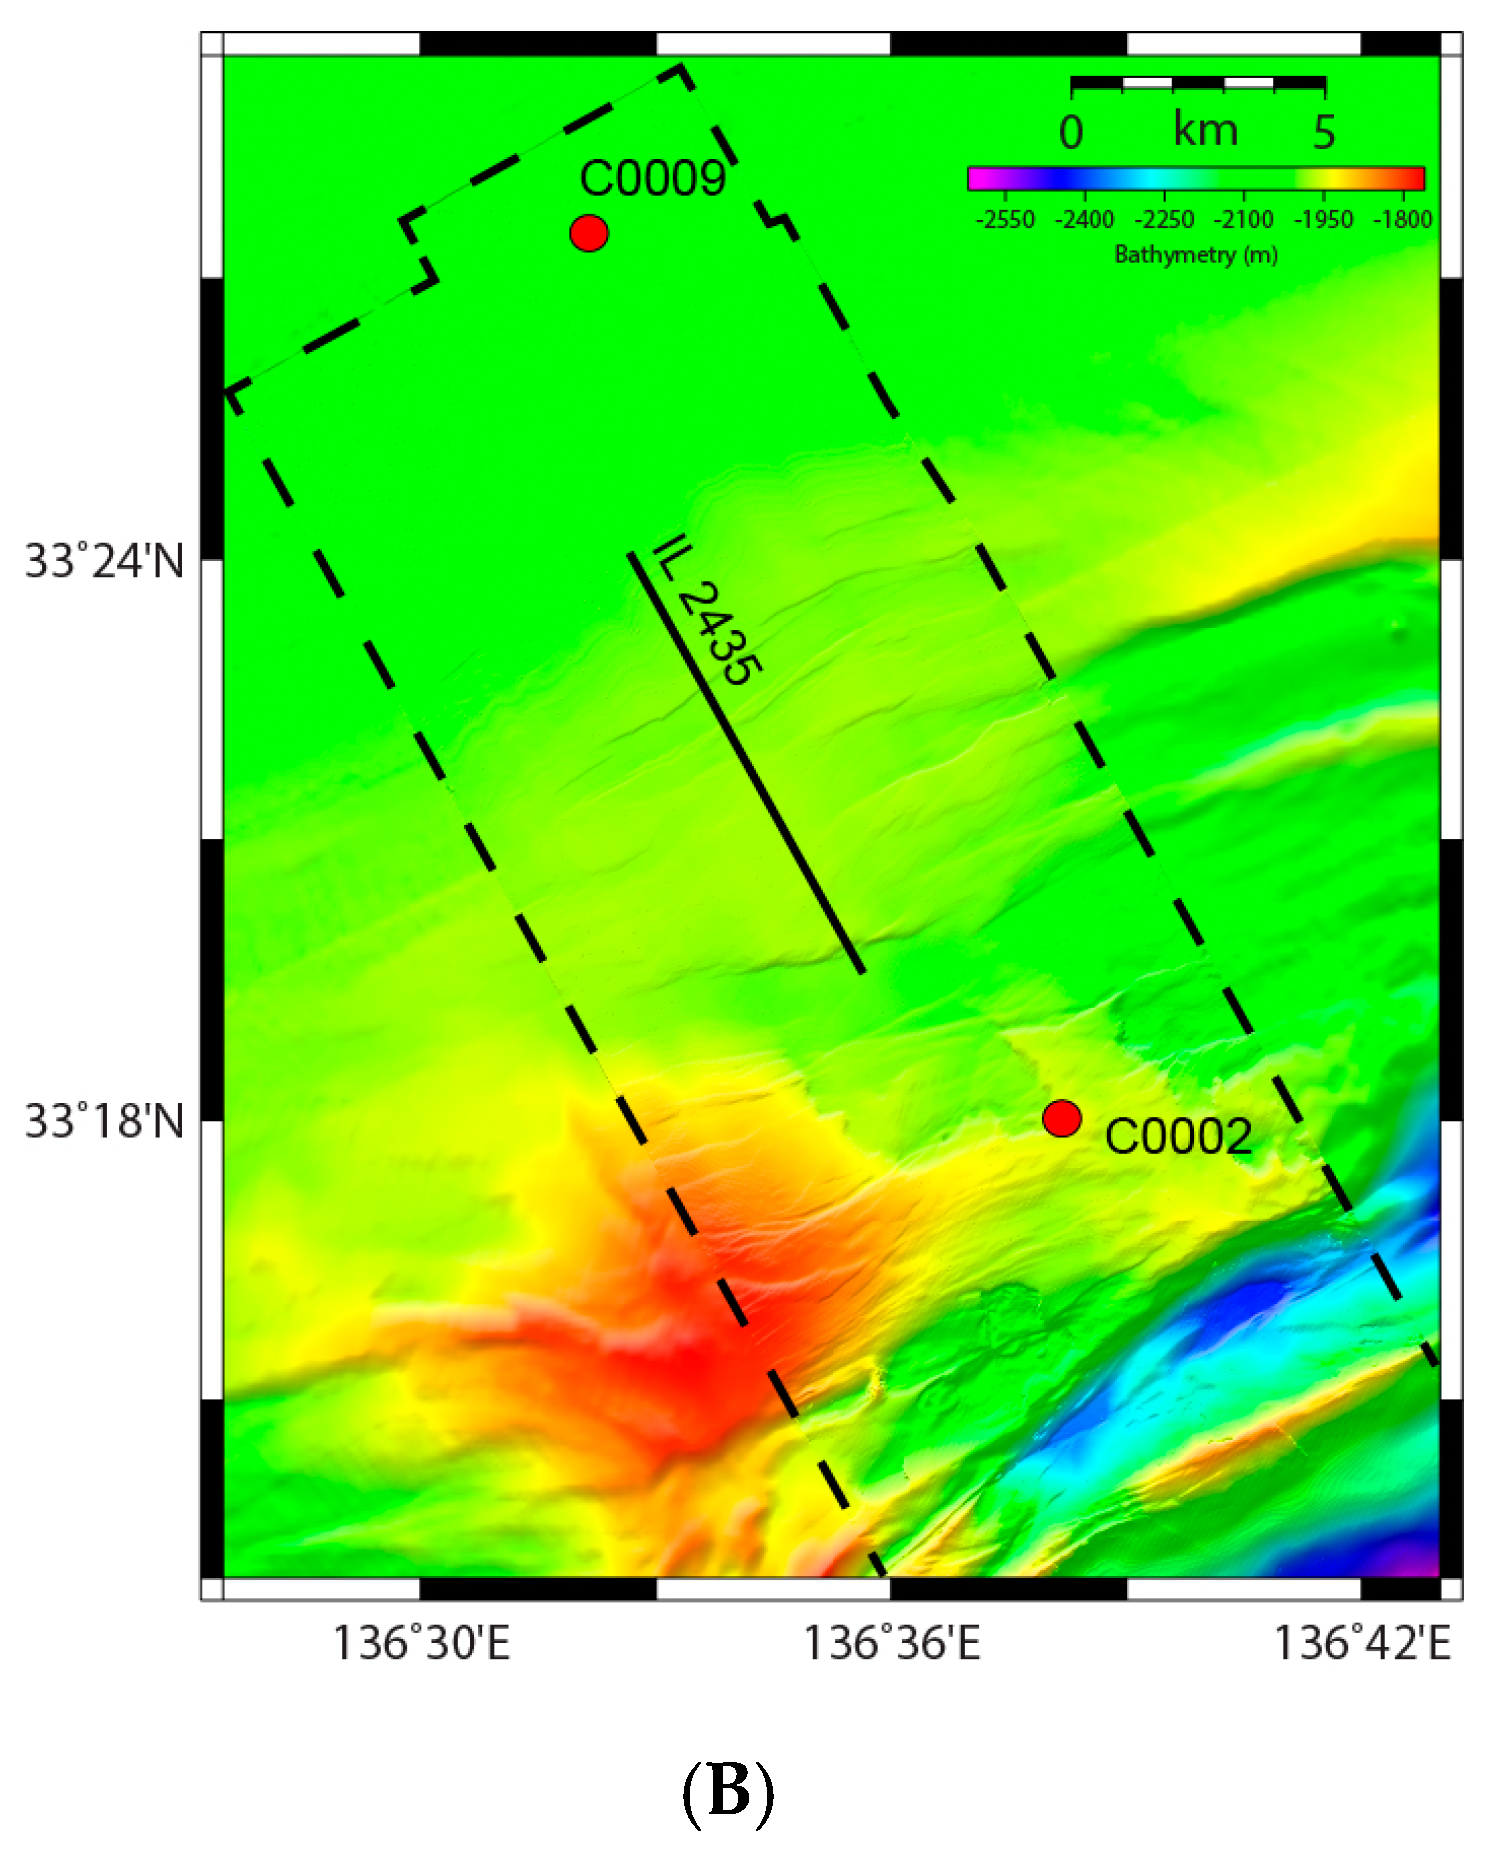
Figure 7.
(A) Inline 2693 showing representative cross section of the Upper BSRs in Zone-2. These BSRs appear as strong, patchy, positive polarity crosscutting reflections. (B) Bathymetric map of the study zone with the extent of IL 2693 shown for reference.
Figure 7.
(A) Inline 2693 showing representative cross section of the Upper BSRs in Zone-2. These BSRs appear as strong, patchy, positive polarity crosscutting reflections. (B) Bathymetric map of the study zone with the extent of IL 2693 shown for reference.
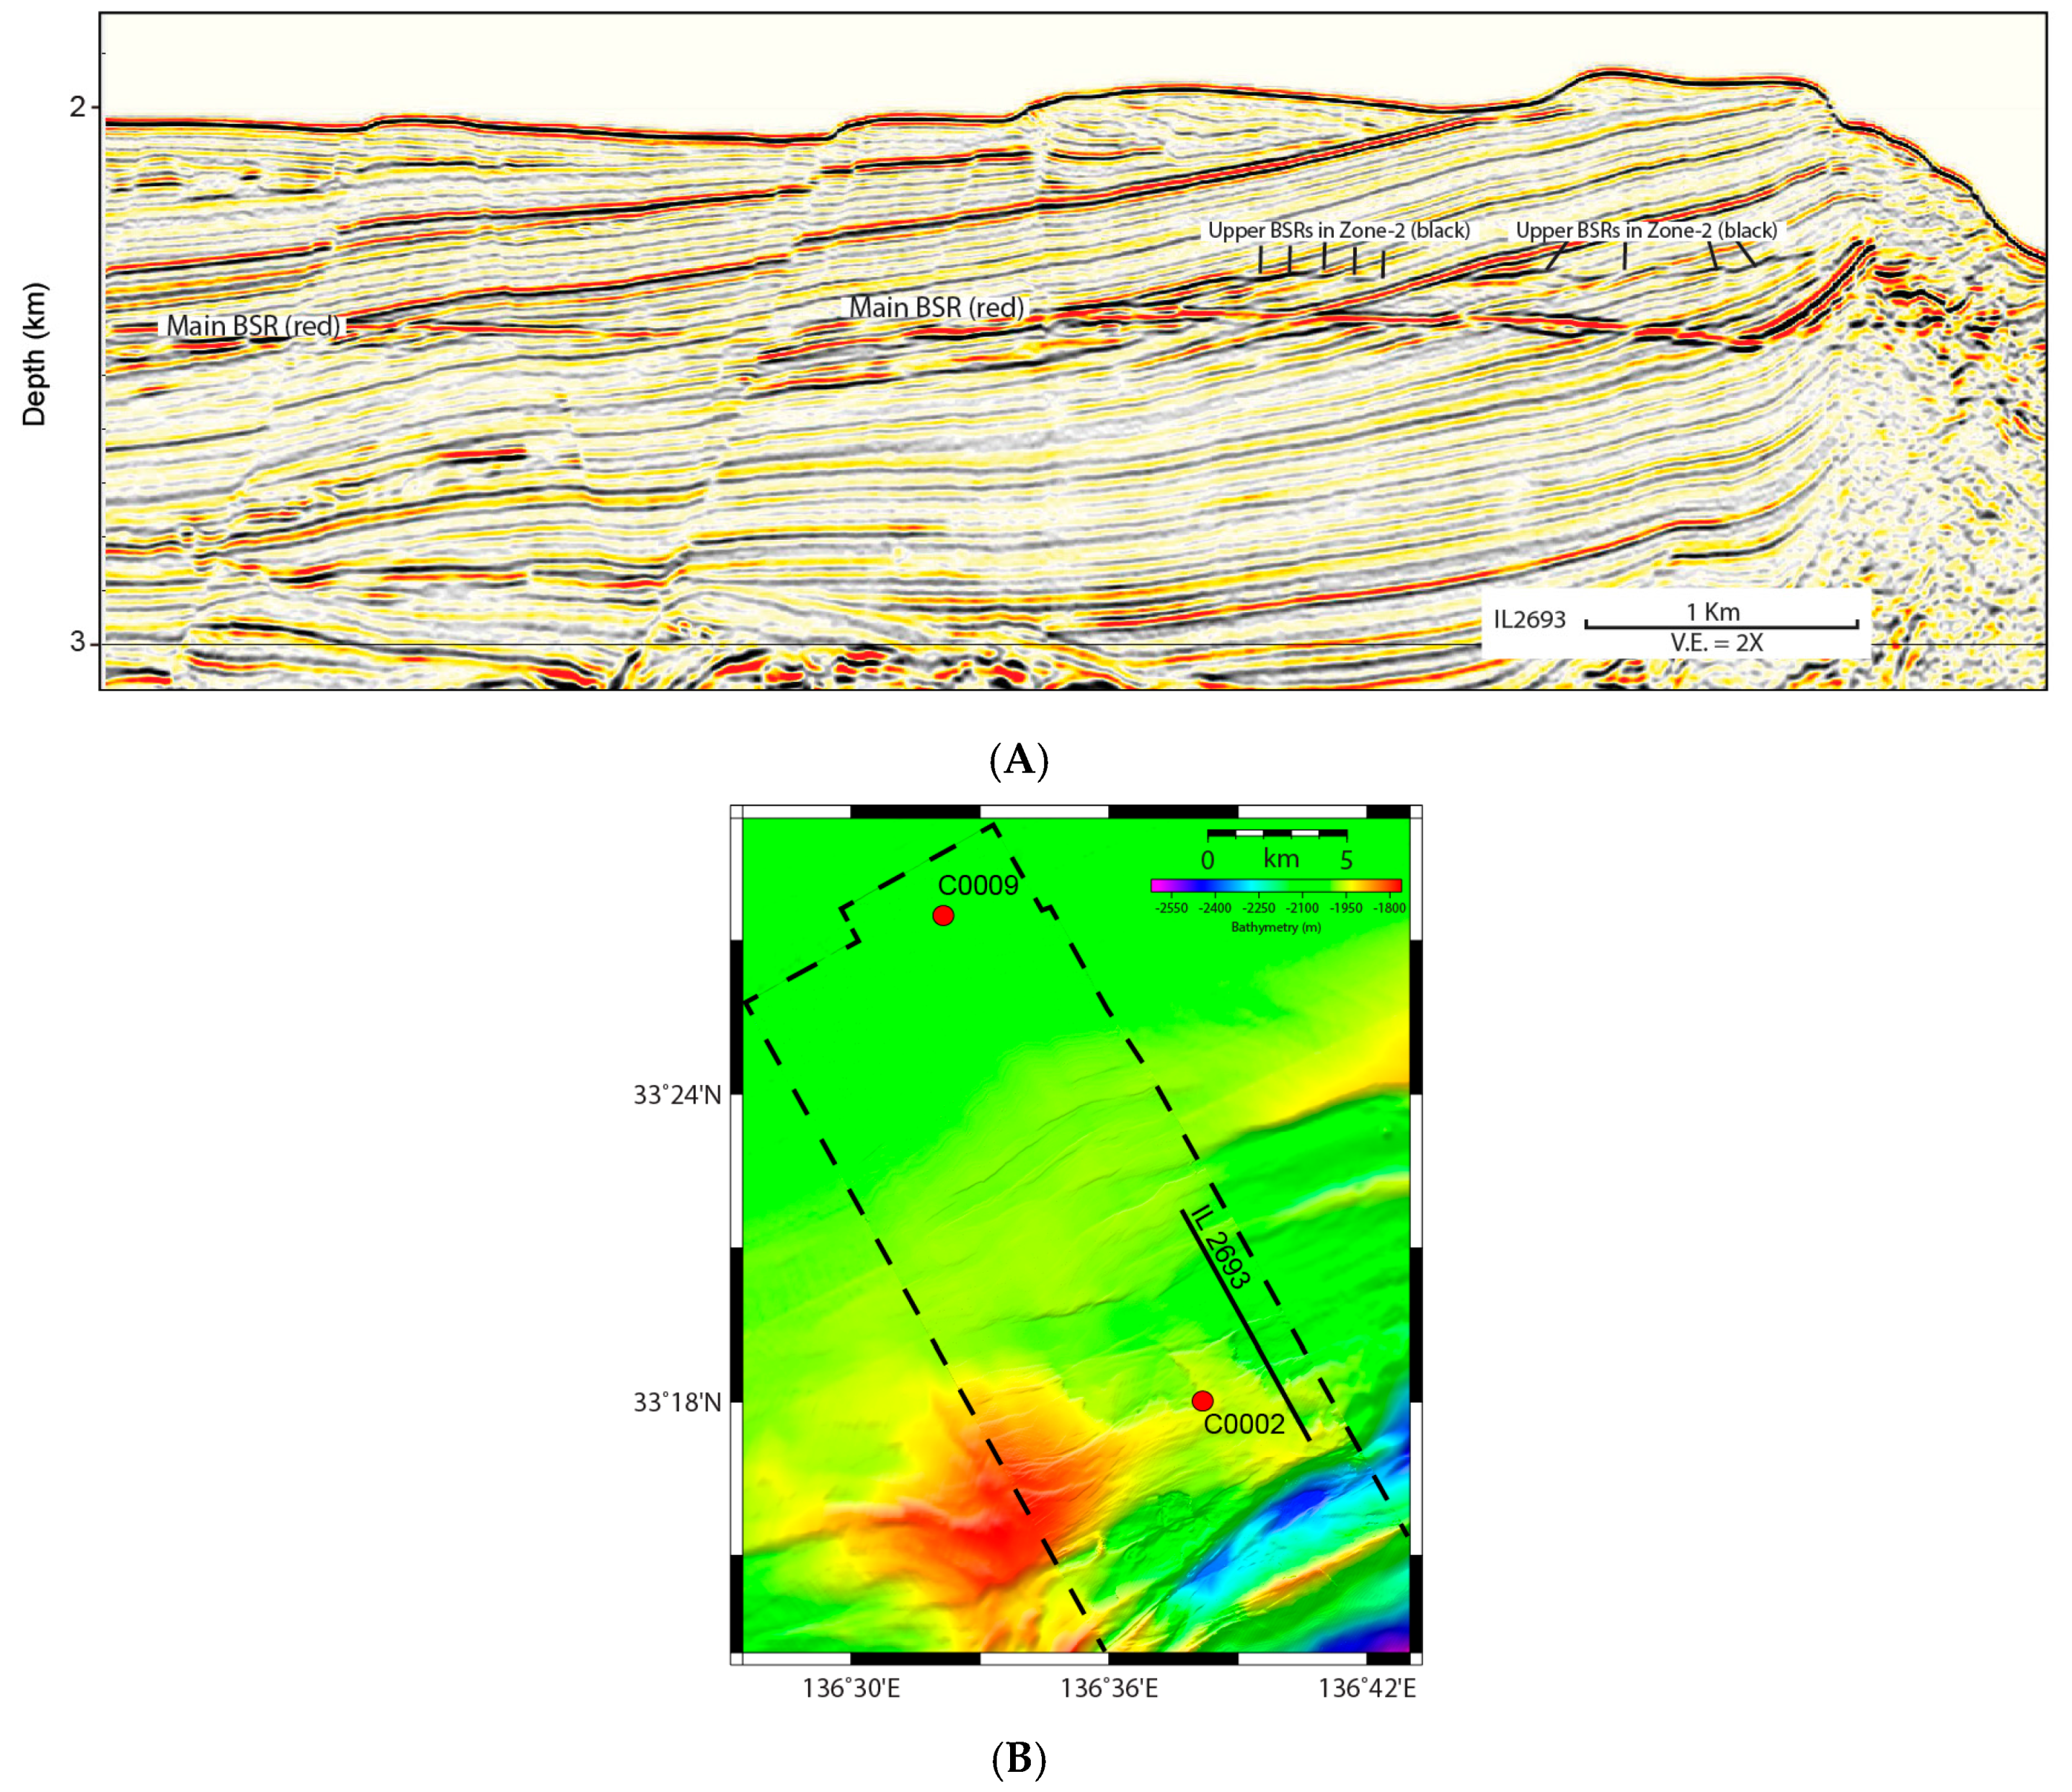
Figure 8.
(A) Inline 2374 showing HARs beneath the BSR correlates with Site C0002 gas-charged Zone-B (Figure 3). Strong HARs within the erosional channel feature are interpreted to be gas saturated sands. A strong BSR is observed. HARs above the BSR in tilted strata likely indicate high GH saturation. (B) Bathymetric map of the study zone with the extent of IL 2374 shown for reference.
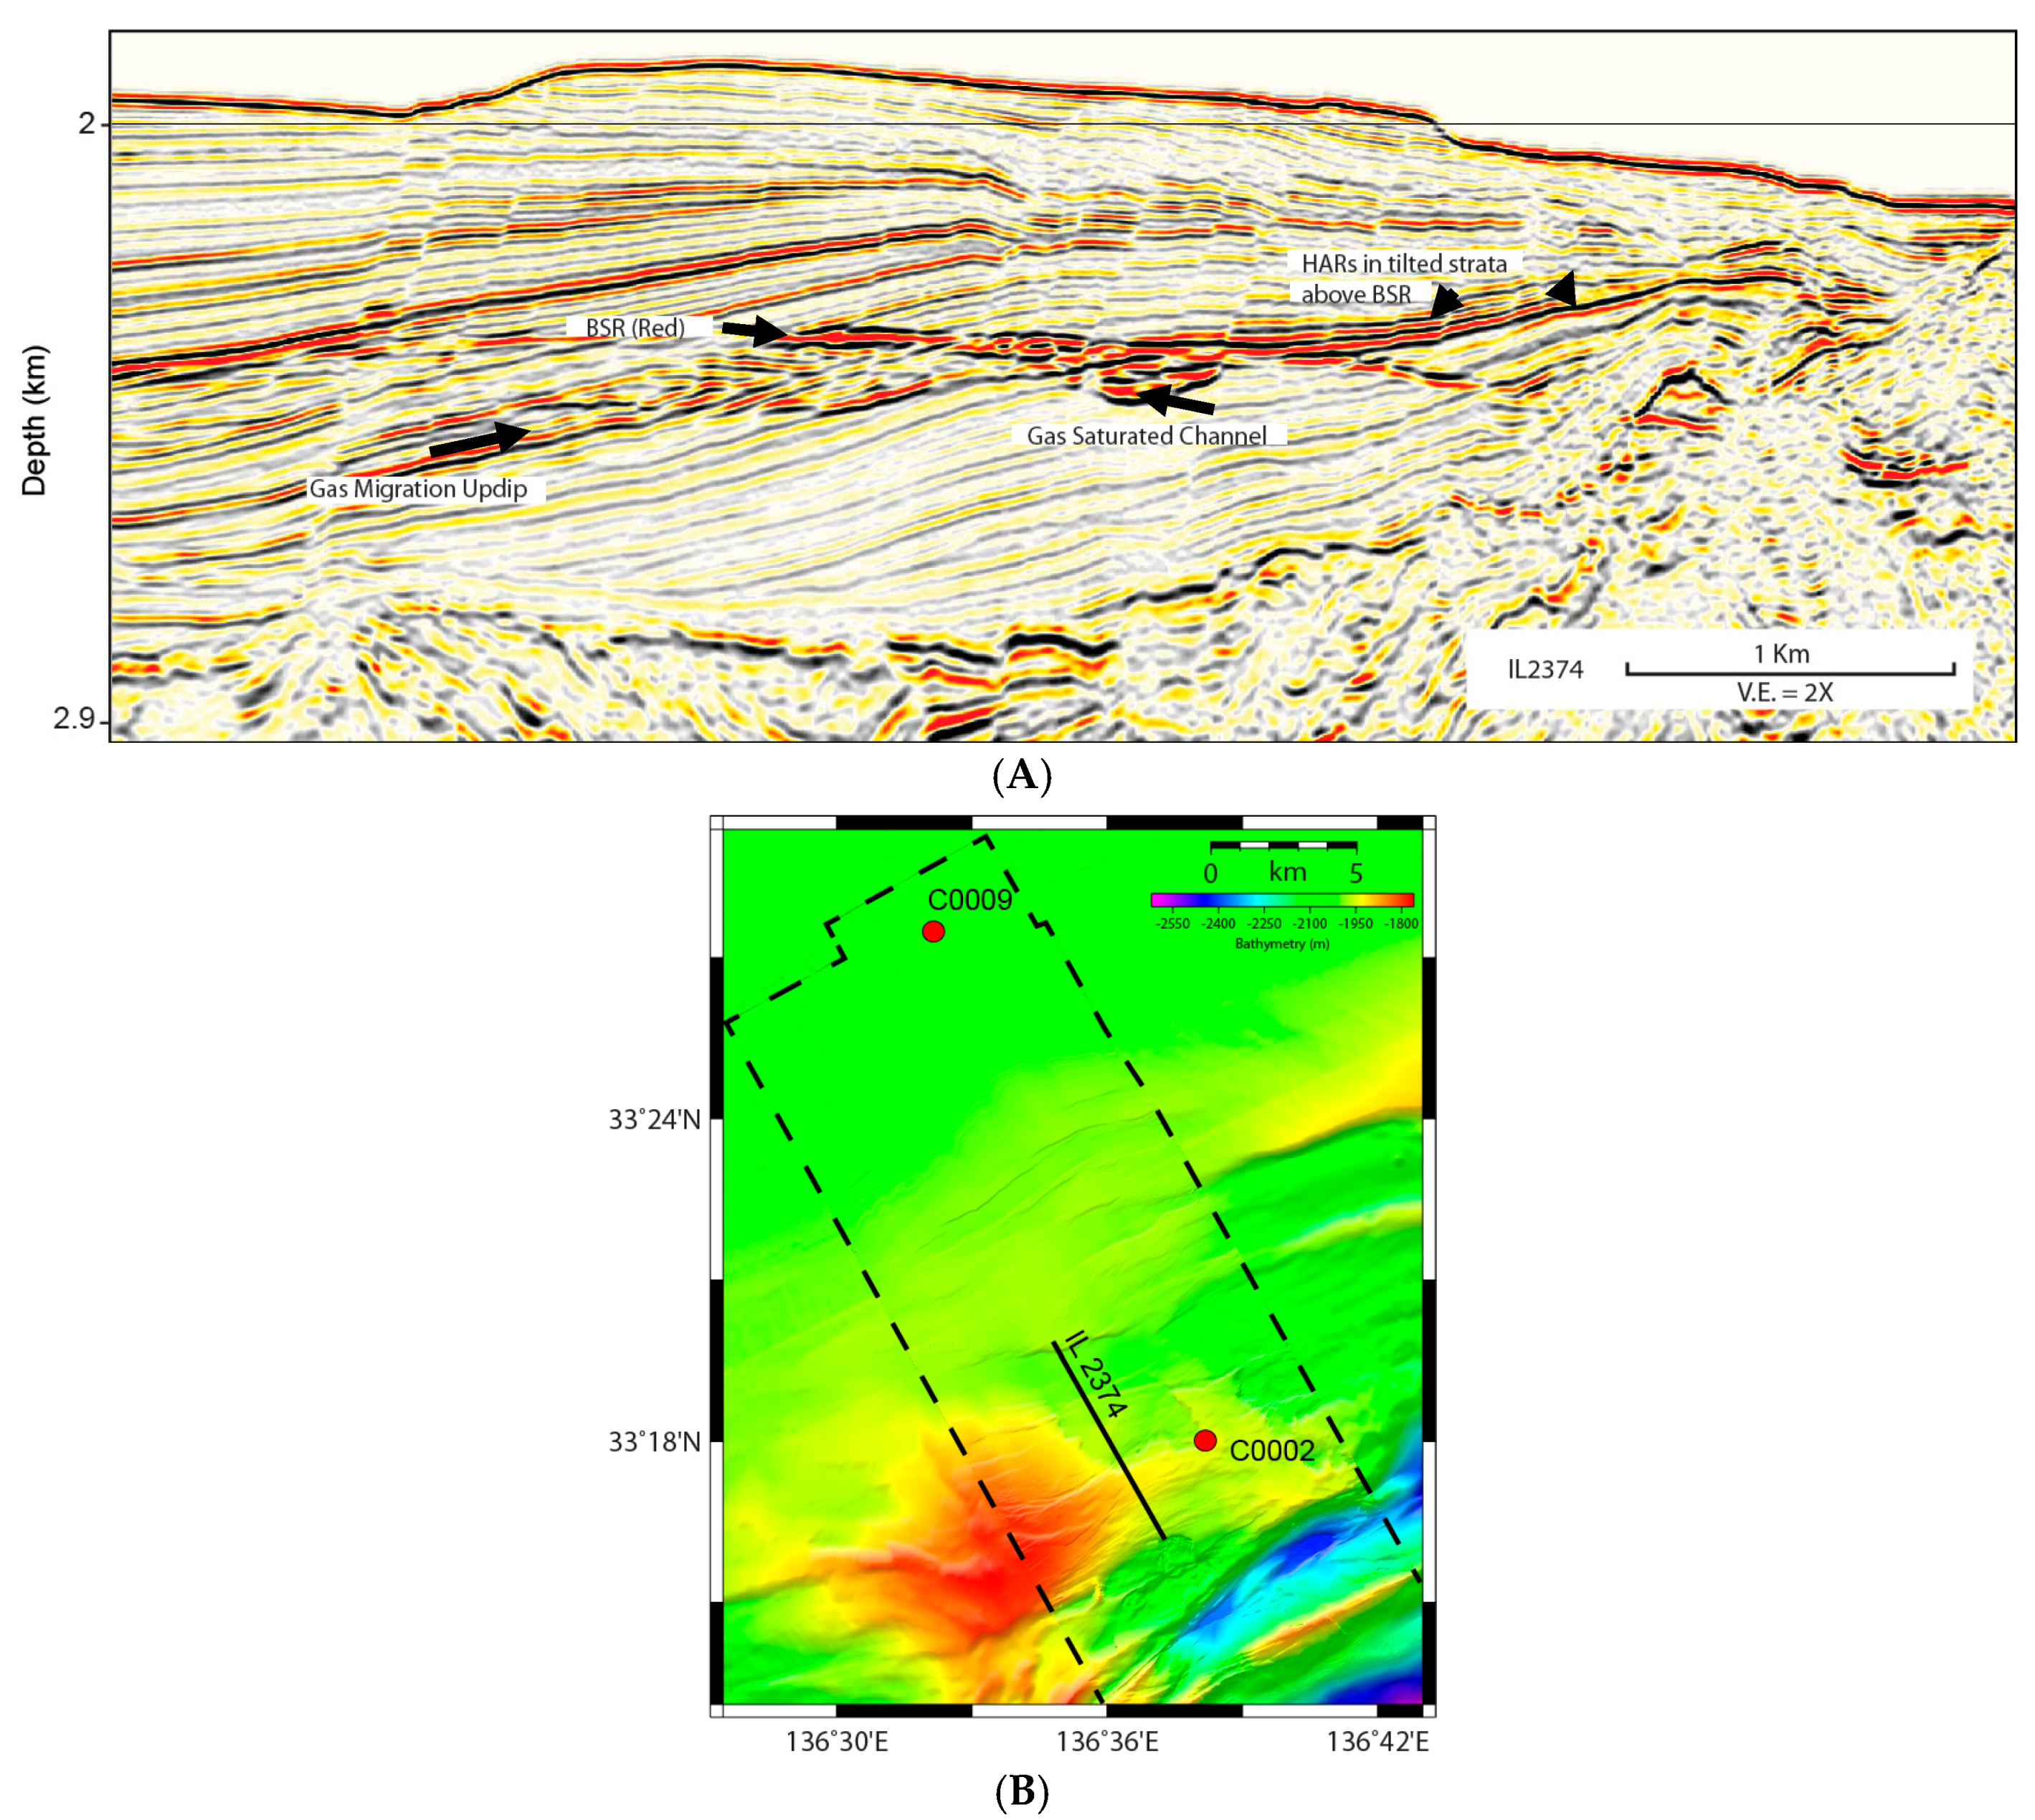
Figure 9.
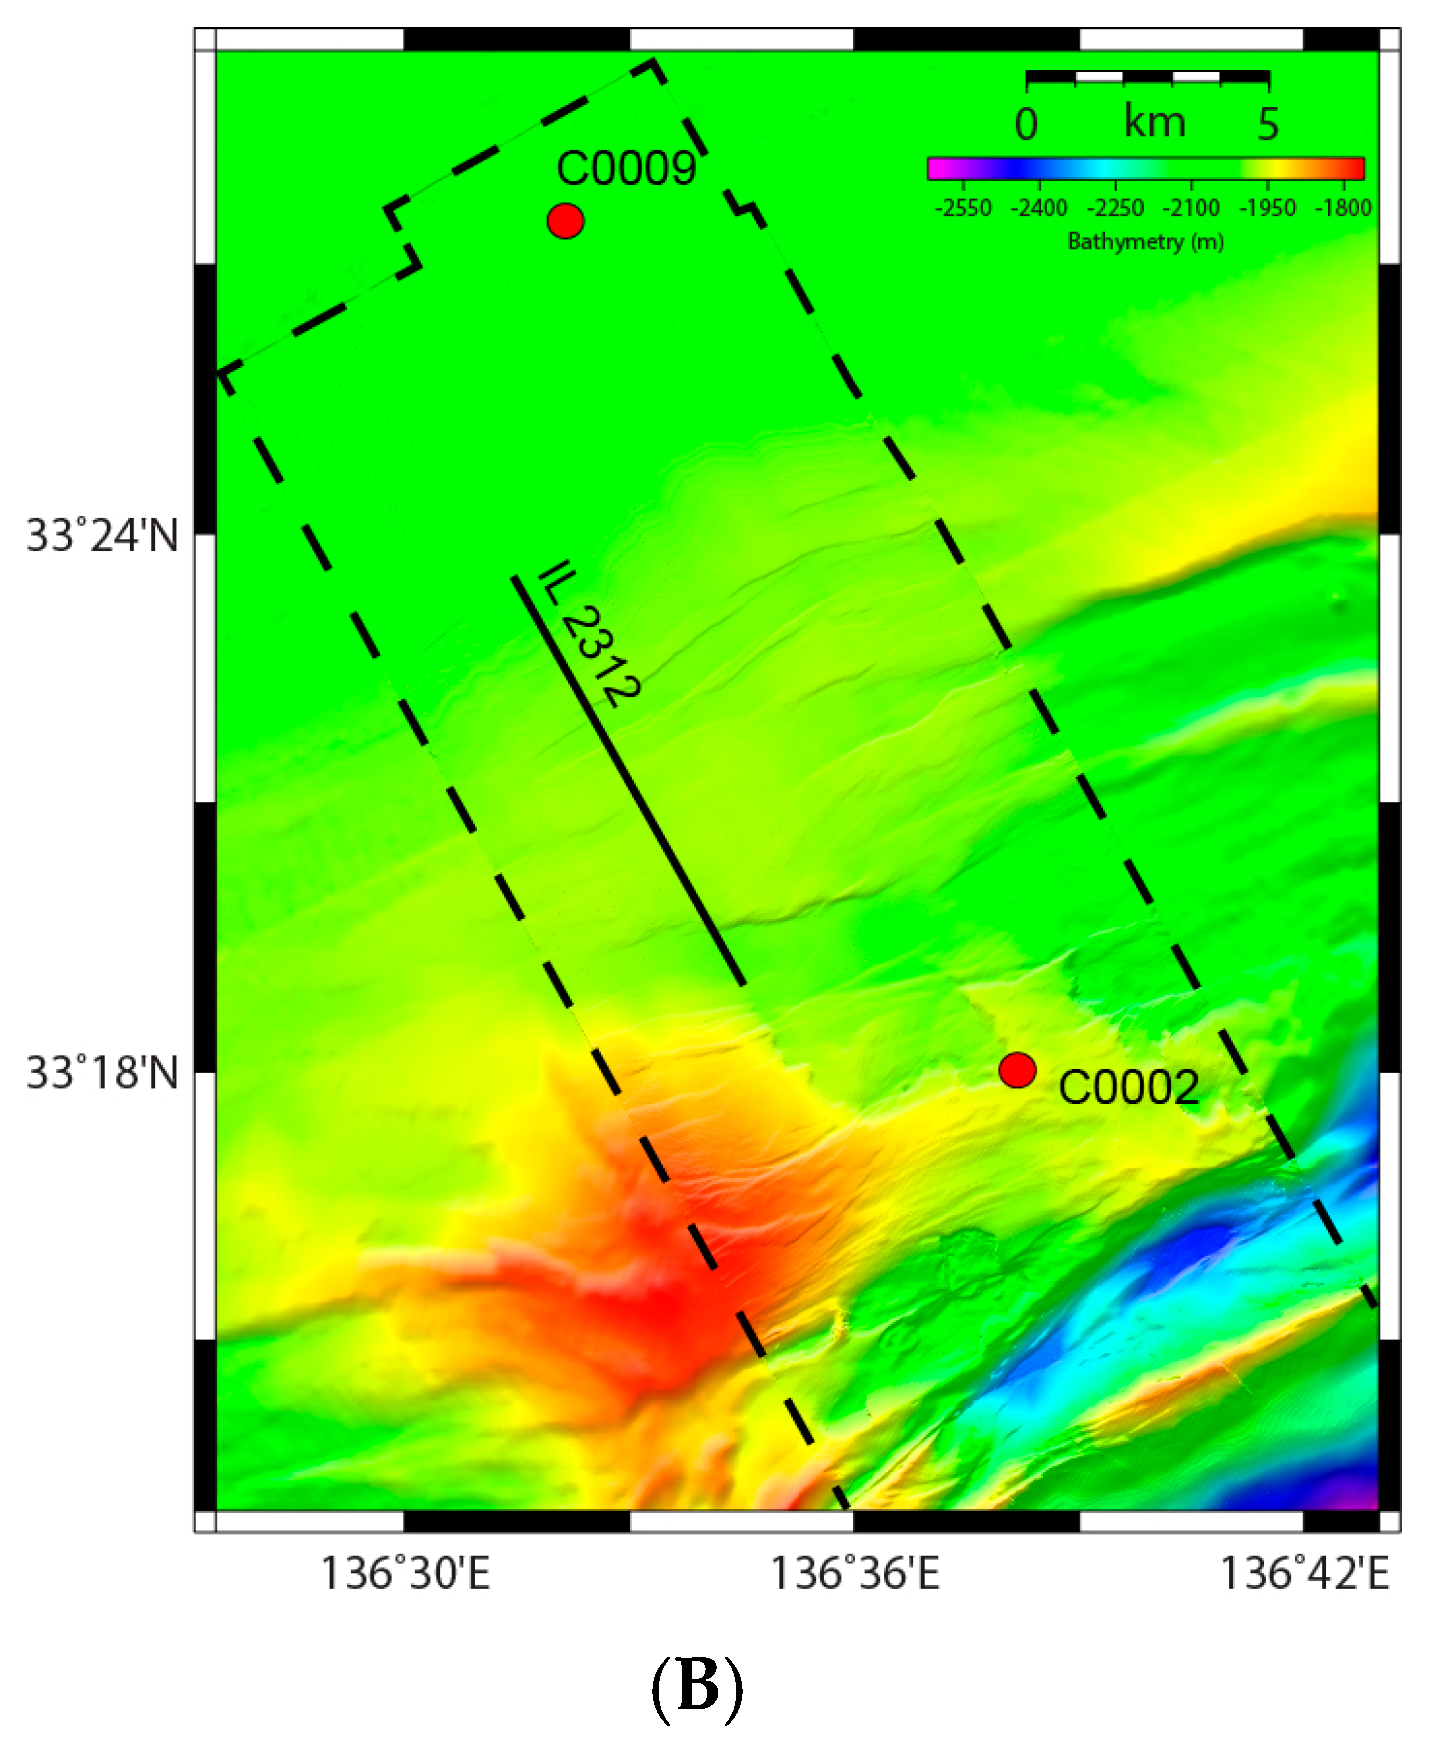
(A) Inline 2312 Acoustic blanking above the BSR in the center of the survey is attributed to low gas hydrate saturations. The BSR interpretation is presented (blue line). Arrows pointing to the upper BSRs likely marking the top of concentrated gas hydrates above the BSR. Acoustic turbidity and numerous bright spots below the BSR are signs of gas saturated sediments. (B) Bathymetric map of the study zone with the extent of IL 2312 shown for reference.
Figure 9.
(A) Inline 2312 Acoustic blanking above the BSR in the center of the survey is attributed to low gas hydrate saturations. The BSR interpretation is presented (blue line). Arrows pointing to the upper BSRs likely marking the top of concentrated gas hydrates above the BSR. Acoustic turbidity and numerous bright spots below the BSR are signs of gas saturated sediments. (B) Bathymetric map of the study zone with the extent of IL 2312 shown for reference.
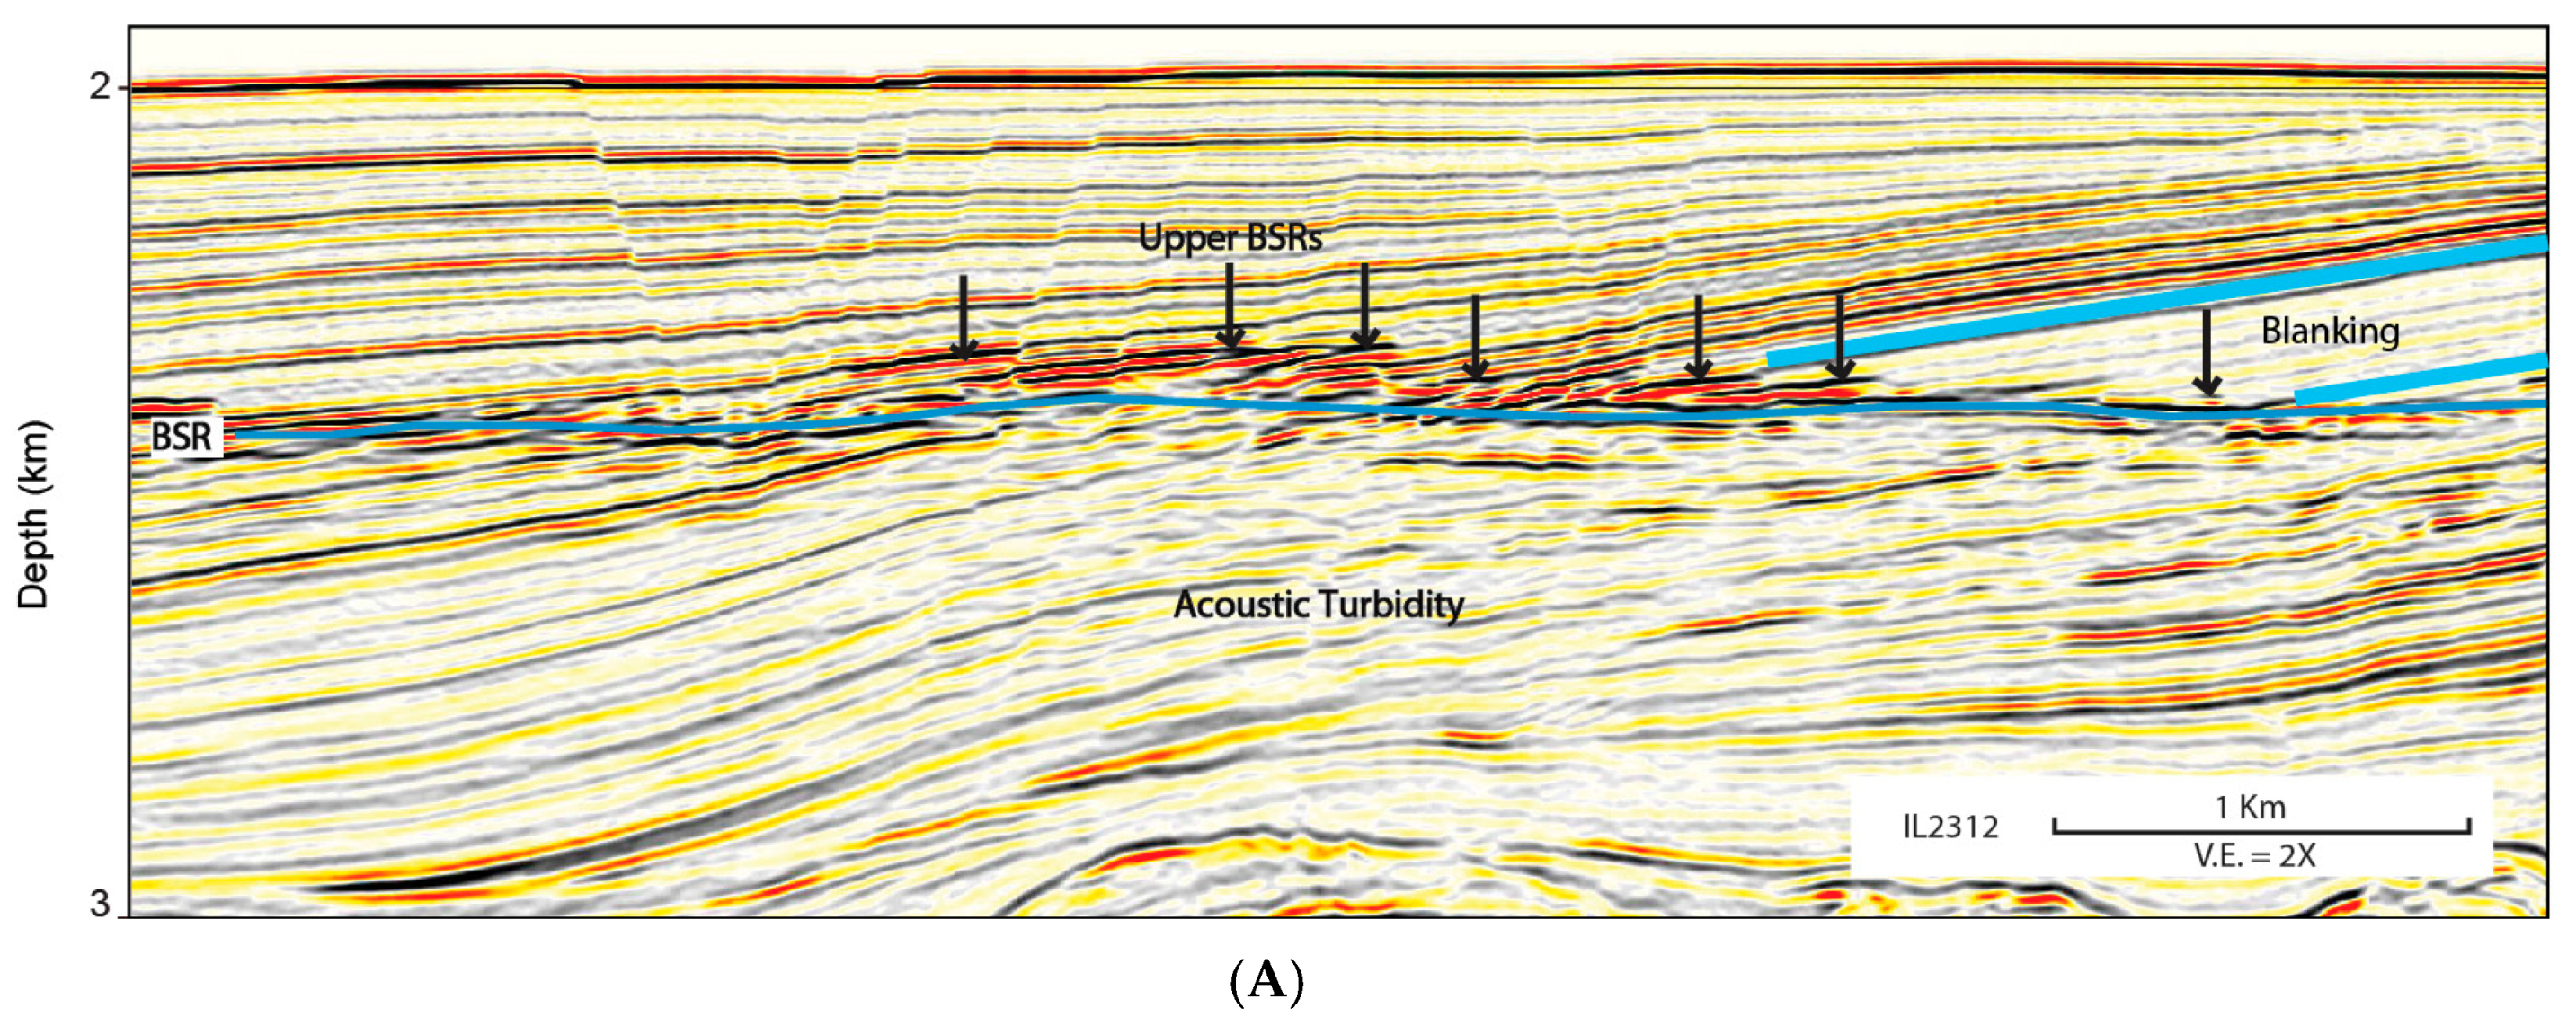

Figure 10.
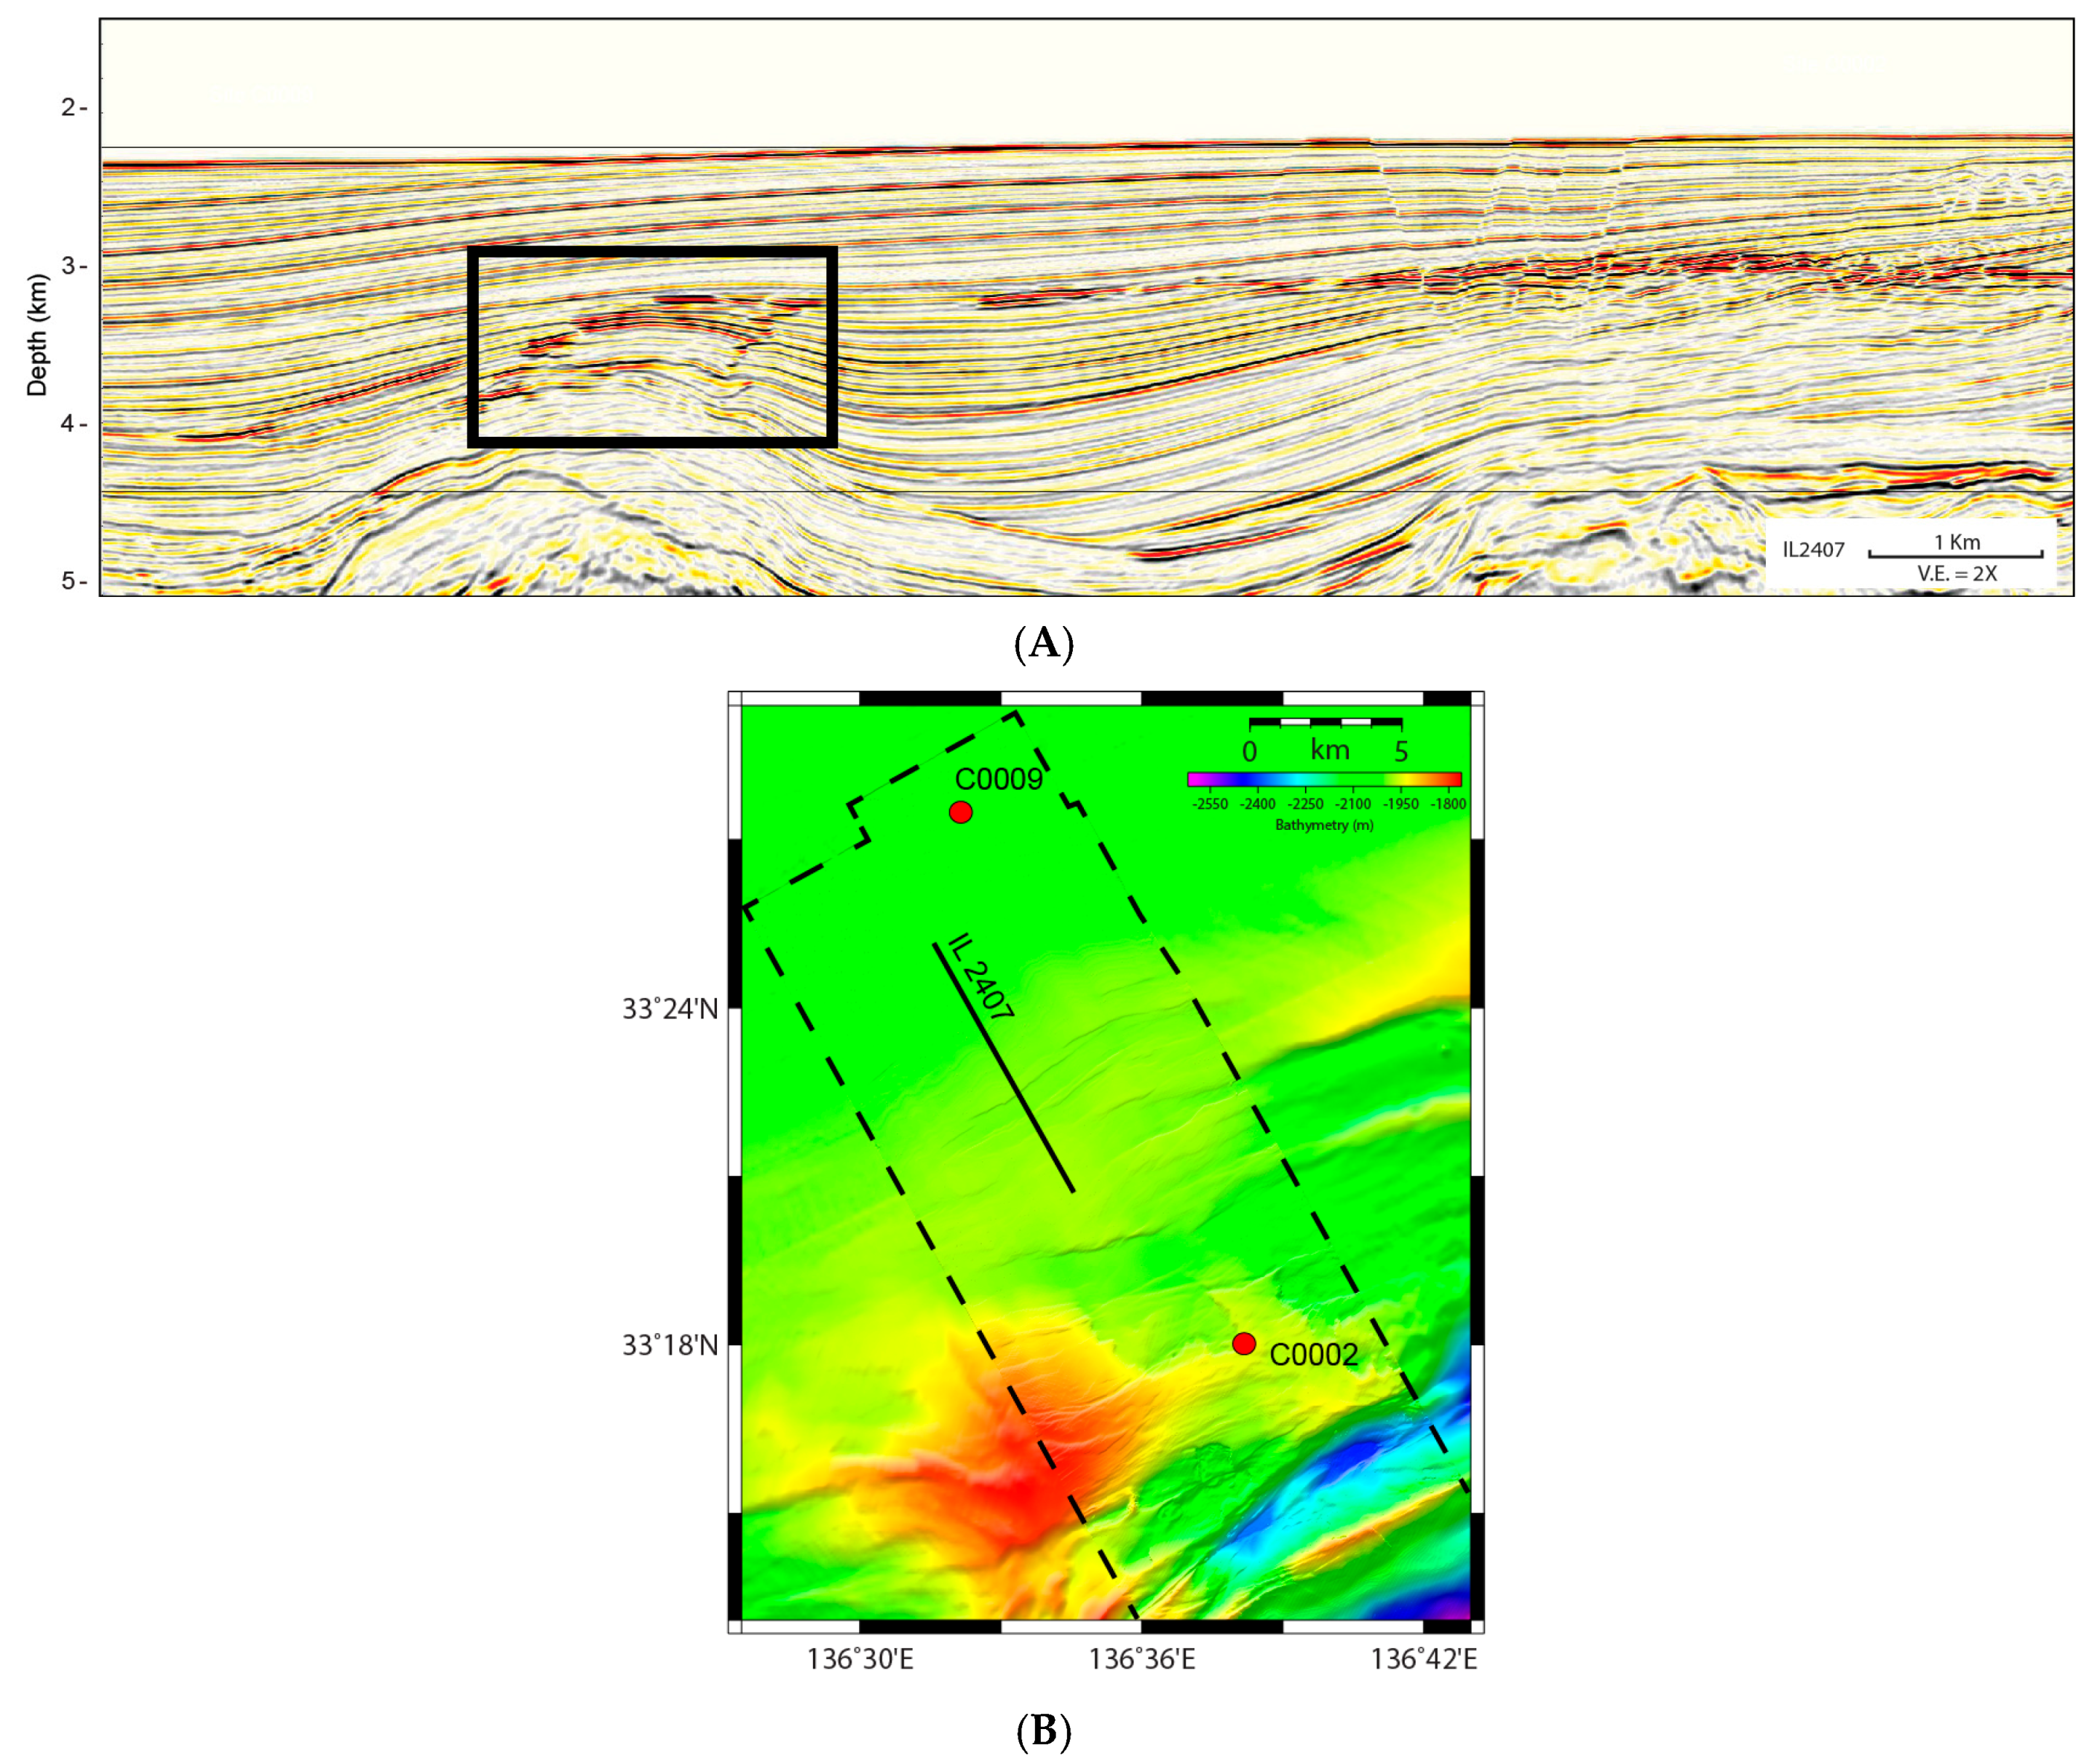
(A) Inline 2407. Gas traps along anticlinal hinges above an underlying topographic high in the accretionary prism. Similar HARS along anticlinal hinges have also been observed in the gas hydrate-bearing regions of the Hikurangi [84] and the Makran [85] margins. (B) Bathymetric map of the study zone with the extent of IL 2407 shown for reference.
Figure 10.
(A) Inline 2407. Gas traps along anticlinal hinges above an underlying topographic high in the accretionary prism. Similar HARS along anticlinal hinges have also been observed in the gas hydrate-bearing regions of the Hikurangi [84] and the Makran [85] margins. (B) Bathymetric map of the study zone with the extent of IL 2407 shown for reference.

Figure 11.
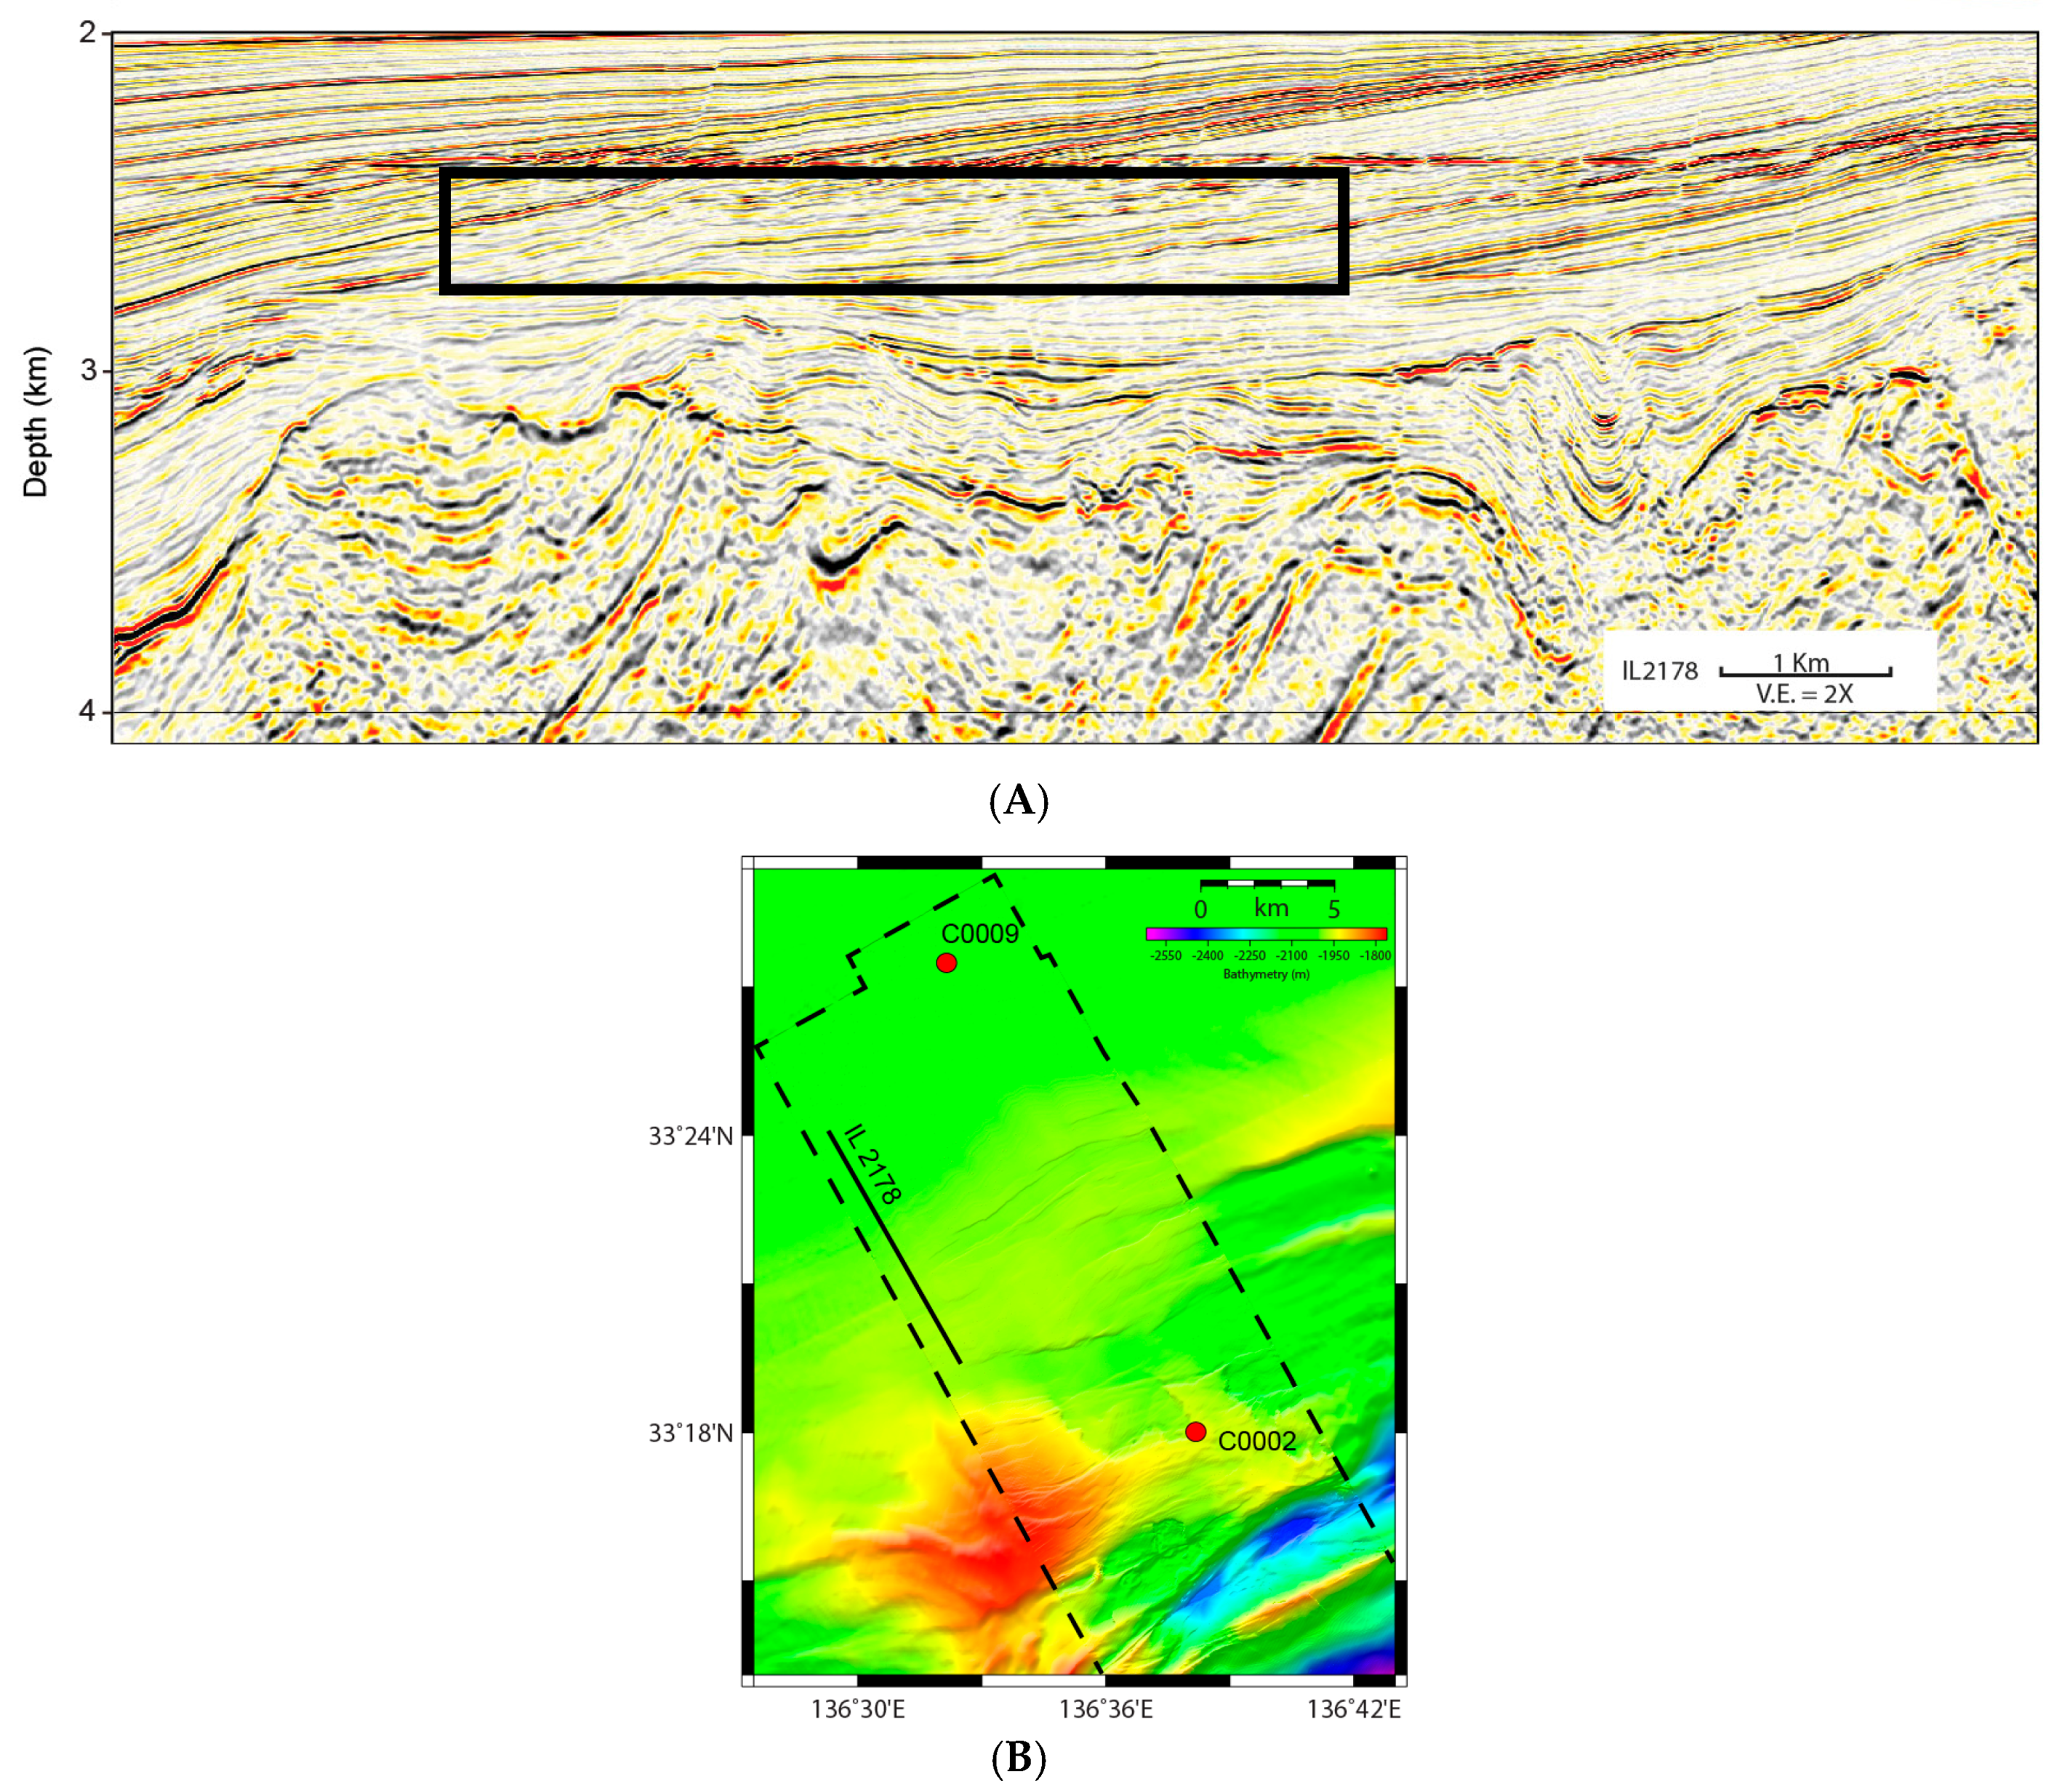
(A) Inline 2178. Example of acoustic turbidity (reflectors inside the box) signifying gas beneath the BSR. HARs are abundant directly above the BSR and are likely GH formed by GH recycling. (B) Bathymetric map of the study zone with the extent of IL 2178 shown for reference.
Figure 11.
(A) Inline 2178. Example of acoustic turbidity (reflectors inside the box) signifying gas beneath the BSR. HARs are abundant directly above the BSR and are likely GH formed by GH recycling. (B) Bathymetric map of the study zone with the extent of IL 2178 shown for reference.

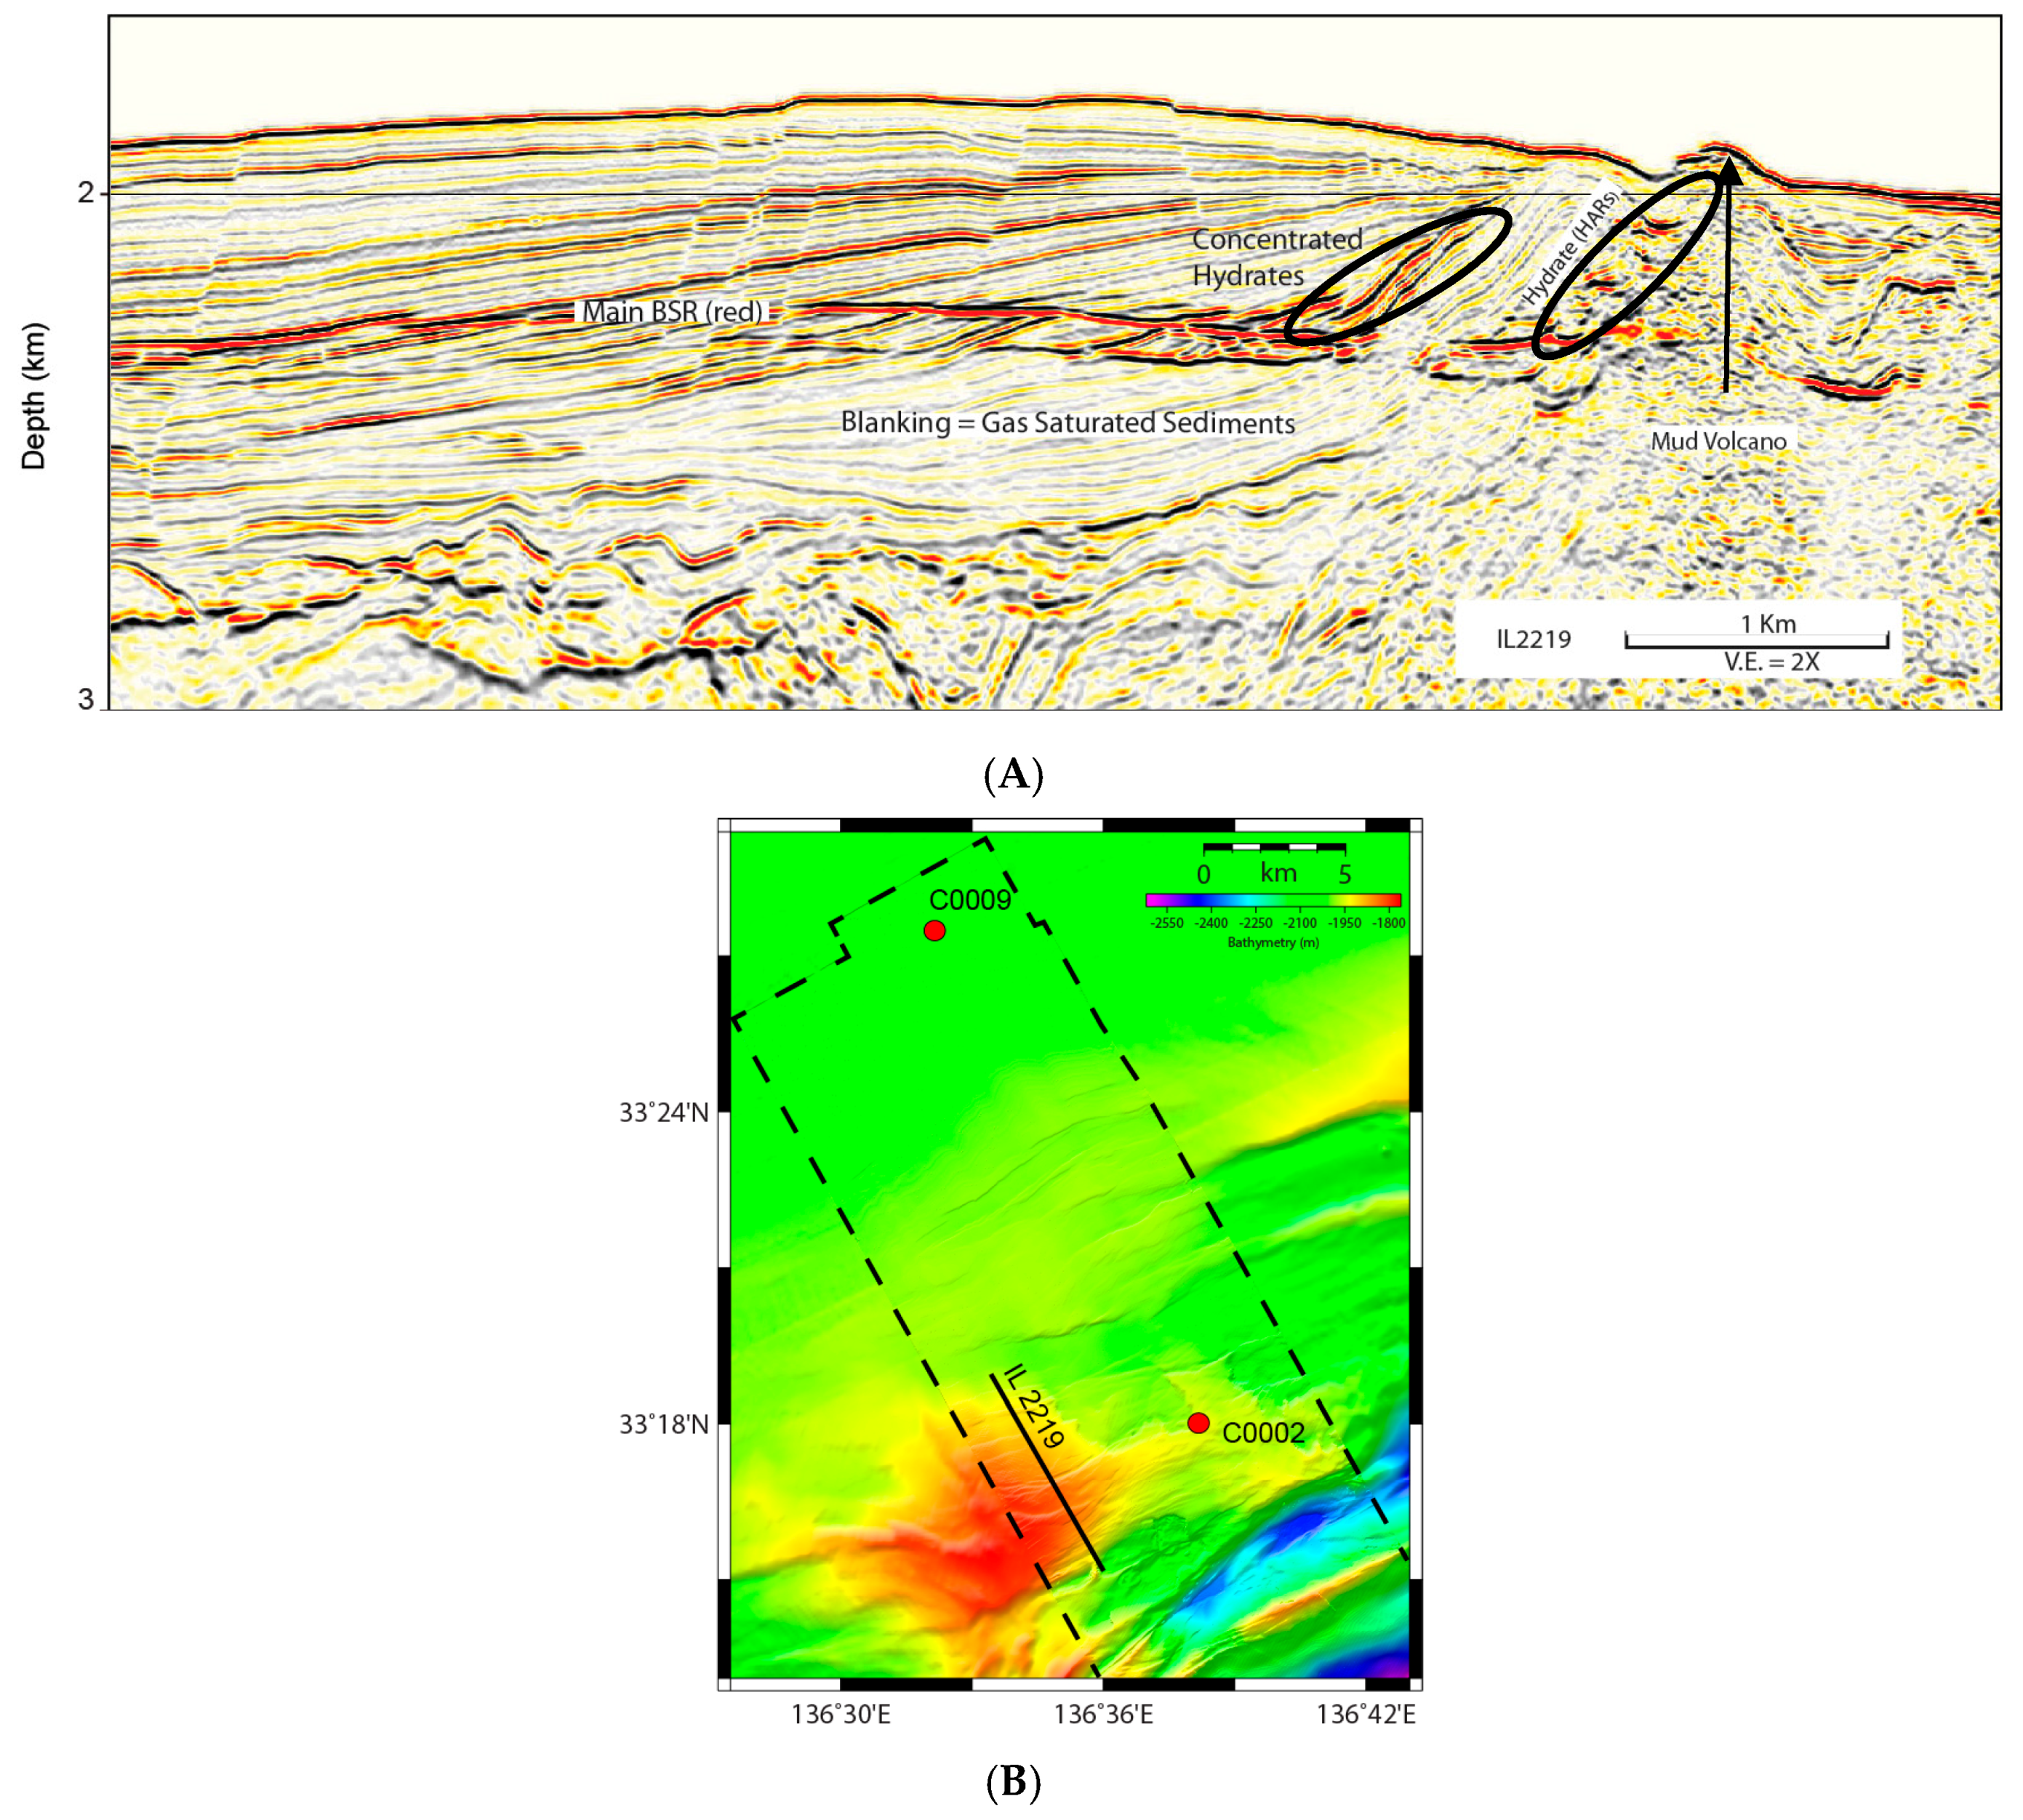
Figure 12.
(A) Seismic IL 2219 HARs above the BSR (circled) are associated with underlying gas migration routes, strong main BSR, and zones of blanking beneath the BSR. We interpret the circled regions to host highly concentrated gas hydrates. The main-BSR is not offset across the deep cutting normal faults and there are no pockmarks in the seafloor bathymetry. The mud volcano breaches the seafloor and lacks a BSR suggesting it is likely active or recently active. (B) Bathymetric map of the study zone with the extent of IL 2219 shown for reference.

Table 1.
Minimum, preferred, and maximum GIP estimates. The gross rock volume is obtained from our seismic interpretation of the thicknesses of the MHCZs. The net-to-gross ratio, porosity, and methane hydrate saturation values are obtained from C0002 borehole constraints. The void ratio assumes a pore filling GH structure, and the cage occupancy possibilities is from field observations around the world with 0.96 being most common.
| Parameters | GRV (MMcf) | N/G (%) | Φ (%) | MHSh (%) | VR | CO (%) | GIP (Trillion ft3) |
|---|---|---|---|---|---|---|---|
| Minimum | 955,940 | 0.30 | 0.45 | 0.10 | 164 | 0.90 | ~1.9 |
| Preferred | 955,940 | 0.60 | 0.50 | 0.35 | 164 | 0.96 | ~15.8 |
| Maximum | 955,940 | 0.70 | 0.60 | 0.71 | 164 | 0.99 | ~46.3 |
© 2017 by the authors. Licensee MDPI, Basel, Switzerland. This article is an open access article distributed under the terms and conditions of the Creative Commons Attribution (CC BY) license (http://creativecommons.org/licenses/by/4.0/).
Share and Cite
MDPI and ACS Style
Taladay, K.; Boston, B.; Moore, G.F. Gas-In-Place Estimate for Potential Gas Hydrate Concentrated Zone in the Kumano Basin, Nankai Trough Forearc, Japan. Energies 2017, 10, 1552. https://doi.org/10.3390/en10101552
AMA Style
Taladay K, Boston B, Moore GF. Gas-In-Place Estimate for Potential Gas Hydrate Concentrated Zone in the Kumano Basin, Nankai Trough Forearc, Japan. Energies. 2017; 10(10):1552. https://doi.org/10.3390/en10101552
Chicago/Turabian StyleTaladay, Katie, Brian Boston, and Gregory F. Moore. 2017. "Gas-In-Place Estimate for Potential Gas Hydrate Concentrated Zone in the Kumano Basin, Nankai Trough Forearc, Japan" Energies 10, no. 10: 1552. https://doi.org/10.3390/en10101552
Note that from the first issue of 2016, this journal uses article numbers instead of page numbers. See further details here.