Multi-Variable Optimization of Building Thermal Design Using Genetic Algorithms

1
Faculty of Energy and Environmental Engineering, The Silesian University of Technology, Konarskiego 18, 44-100 Gliwice, Poland
2
Faculty of Civil Engineering, The Silesian University of Technology, Akademicka 5, 44-100 Gliwice, Poland
*
Author to whom correspondence should be addressed.
Energies 2017, 10(10), 1570; https://doi.org/10.3390/en10101570
Submission received: 10 September 2017
/
Revised: 27 September 2017
/
Accepted: 6 October 2017
/
Published: 11 October 2017
Abstract
:The building sector is one of the largest energy consumers in the world, comprising about 40% of the total energy consumption in numerous countries. Early design decisions have a significant impact on the energy performance of buildings. The paper presents the multi-variable optimization of the selected design parameters in a single-family building in temperate climate conditions. The influence of four types of windows, their size, building orientation, insulation of external wall, roof and ground floor and infiltration on the life cycle costs (LCC) is analyzed. Optimal selection of the design parameters is carried out using genetic algorithms by coupling the building performance simulation program EnergyPlus with optimization environment. The simulations were conducted for seven optimization cases. The analysis is performed for two variants of a building with heating and cooling systems and with a heating system only. Depending on the analyzed case, the life cycle costs decreased from 7% to 34% LCC value of the reference building. In the case of temperate climate, the building optimization (in terms of heat demand only) substantially reduces the heating costs, yet the summer thermal comfort conditions deteriorate significantly.
1. Introduction
Energy consumption in buildings accounts for a considerable part of the total worldwide energy consumption. According to the literature, in developed and developing countries it constitutes about 40% of the total energy consumption [1,2,3,4,5,6,7,8]. Residential buildings are responsible for a major part of the energy consumption of the building sector [9].
Therefore, as energy consumption is rapidly increasing due to the population growth, urbanization and industrialization, energy conservation in buildings has become an important part of national energy strategies in multiple countries [10]. This led to the development of building energy efficiency regulations. These regulations introduce a minimum of energy efficiency requirements that need to be met by all new buildings and retrofitted buildings [11]. An example of such regulations is the Energy Performance of Buildings Directive (EPBD) [12] in Europe (implemented as a regulation at a national level in EU Member States).
In many cases those requirements call for higher insulation performance for all envelope building surfaces and the most effective thermal insulating glazing systems, characterized by low solar transmittance [13]. However, increasing a building’s thermal energy efficiency can be achieved not only by increasing insulation thickness and installing high performance windows. Several other design parameters have a significant effect on heating and cooling thermal loads of buildings, such as a building shape and orientation, wall and roof construction, window sizes and shading, as well as the characteristics of heating, ventilating, and air conditioning systems (type, efficiency, and operation settings) [14,15]. For that reason building designers should take into account the best combination of these parameters, which can minimize energy use over the lifespan of a building. Energy-efficient solutions are oftentimes costly, therefore economic factors should be introduced to determine the best configuration of building design features. The optimum balance must be found between the initial investment and the energy savings during the building life cycle [14,16].
It is essential to develop methodologies that allow building designers to identify the combinations of design variables that, while ensuring the achievement of the energy and environmental targets established, also have near-optimal lowest life cycle costs, or lowest investment costs, or a good compromise between investment costs and life cycle costs [7].
With advances in computer science, designers and researchers are now well-equipped with building simulation tools that can predict the effects of design variables on building energy consumption. Traditionally, this type of analysis has been carried out through parametric runs using a building simulation tool. For example, in the papers of Jaber and Ajib [8,17], Gasparella et al. [13], Cheung et al. [18], Ruiz and Romero [19], Chastas et al. [20] and Yu el al. [21], the effects of different types of glazing systems, windows orientation and windows size on winter and/or summer energy demand were studied considering energetic and/or economic and environmental point of view. The studies have been performed for residential buildings and for one or different climates using TRNSYS, EnergyPlus or DOE-2 simulation program. On the other hand, Rodrigues and Freire [16,22,23] presented an integrated approach that combines life cycle assessment and thermal dynamic simulation using EnergyPlus program to assess alternative insulation thicknesses for the roof and external walls of a single-family house and an apartment. Multi-variant analyses using ESP-r simulation program to find energy-saving solutions for cooling systems in office building are presented by Ferdyn-Grygierek and Baranowski [24].
However, these parametric analyses are often based on assessing the impact of only one or a limited number of parameters. Changing one parameter while leaving others constant can potentially miss important interactive effects, and full parametric studies are usually infeasible. Yet when such simulation engines are coupled with mathematical optimization algorithms, combinations of chosen variables can be interactively evaluated relative to each other, to find a minimum for a given objective function such as life cycle cost, annual operating costs or annual energy use [14,15,25].
Most commonly used optimization algorithms in building performance optimization are derivate-free, simulation-based ones, which provide the iterative improvement of the solution until the fulfillment of a stop criterion. Among these methods, the dominant ones are the meta-heuristic stochastic population-based algorithms, such as particle swarm optimization, differential evolution, and genetic algorithms [26].
Some investigations limit their optimization to a few parameters (e.g., one or two). For example, Ko in his paper [27] presented an optimization method to design a solar water heating system based on life cycle cost where a genetic algorithm was employed to optimize its configuration and sizing as the optimization technique. Additionally, Król and Białecki [28] applied a genetic algorithm to optimization of a window frame.
A lot of studies, however, have employed optimization algorithms to solve the multi-variable optimization problems [7,14,15,29,30,31,32,33,34,35]. In particular, Tuhus-Dubrow and Krarti [14], Znouda et al. [29], Han et al. [30], Hasan et al. [31] who developed and applied an optimization–simulation environment using a genetic algorithm. This was used in order to select optimal values of a comprehensive list of parameters associated with different envelope features (orientation, wall, roof and foundation insulation, window area, glazing type, air leakage level and thermal mass) to minimize life cycle costs for residential or office buildings.
A more comprehensive optimization was performed by Bichiou and Krarti [15], Ihm and Krarti [32] and Ferrara et al. [35]. In their works the authors applied building performance simulation program with optimization environment using a genetic algorithm to optimize HVAC system and many design variables in the construction of single-family detached houses. In the first two works the authors also analyzed the building in several locations. The objective function of the studies was to minimize the life cycle costs.
Some researches apply multi-objective [2,5,6,25,26,36,37,38,39,40] or multi-criterion [41,42] optimization models. In the study conducted by Ascione et al. [39], a procedure that combines EnergyPlus simulation and a genetic algorithm was implemented to determine the best solutions for the HVAC system control in a residential building. The objective of this study was to minimize the primary energy demand and investment cost. Azari et al. [40] utilized a multi-objective optimization algorithm to explore optimum building envelope design with respect to energy use and life cycle contribution to the impacts on the environment in a low-rise office building in Seattle. The simulation tool eQuest was used to assess the operational energy use. A hybrid genetic algorithm and artificial neural net-works was used for the optimization.
The optimization of the insulation thickness of a house considering both economic and environmental concerns is presented by Carreras et al. [36]. The authors proposed a systematic framework for the design of buildings that combines a rigorous objective reduction method with a surrogate optimization model. In turn, Ascione et al. [26] proposed a new multi-stage framework for cost-optimal analysis by multi-objective optimization and artificial neural networks, called CASA. A genetic algorithm and EnergyPlus simulation allowed to select recommended retrofit packages by minimizing energy consumption and thermal discomfort. The same energy simulation software and a heuristic algorithm was used by Mostavi et al. [38]. The effect of 65 different building construction materials was analyzed by the authors. The multi-objective design optimization model to minimize life cycle cost and life cycle emission, and maximize occupant satisfaction level in a typical commercial building was developed.
Optimization of building energy performance is more complex in the case of temperate climates (Mediterranean or continental). While in some cold regions only heating energy consumption is usually considered, the temperate climate makes it essential to consider both heating and cooling energy uses. Varying some parameters of the building over their ranges of practical values can have counterproductive effects on heating and cooling energy consumptions. It is evident, for example, that an insulated building envelope helps in reducing heating demand. But in summer, the outdoor night temperature being lower than the required indoor temperature, uninsulated walls allow leading to the reduction of air-conditioning need [29]. Therefore, in climates where both heating and cooling throughout the year are required, the optimization of the design parameters in buildings should take into account the cost of both heating and cooling.
The paper presents the multi-variable optimization of chosen design parameters in a single-family building in Polish climate conditions. Poland is located in transitional climate (between continental and Atlantic climates) with relatively cold winters and warm summers. Throughout a year external temperature varies from approximately −20 °C to over +30 °C. In order to provide thermal comfort for their occupants, such external conditions require buildings to be both heated and cooled. Although the amount of energy consumed in detached houses built nowadays is much lower than in older ones, they still consume a considerable portion of energy. In Poland, for heating, it is about 37% [43].
The influence of four types of windows, their size, building orientation, insulation of external walls, roof and ground floor and intensity of infiltration on annual energy consumption is analyzed in the paper. Optimal selection of these parameters for reduction the life cycle costs was carried out by the tool which combines the optimization method (genetic algorithms) and the dynamic building simulation program (EnergyPlus), in which both internal and external loads were taken into consideration.
Polish investors argue that high initial investment (above the required standard) pays off in the long run when using a building. The paper aims to determine optimum solutions that will enable maximum energy and economic benefits during the lifetime of the building. Regrettably, no papers exist which analyze the problem in question for Polish temperate climate conditions. The vast majority of models are optimized for warmer climates (Mediterranean or warm). Additionally, many of the above quoted papers used grand simplifications: thermal zones included several rooms or the analyses only one zone, the same casual gains assumed in the whole building, window size defined by the window-to-wall ratio. In this study a detailed analysis of the selected building using self-adaptive genetic algorithm has been performed. The rooms are modeled as separate zones with scheduled casual gains. The constructed algorithm individually selects optimum values from discreet sets for each design variable as well as automatically selects an external wall for a window in each room. Only such an algorithm enables to determine optimum design solutions for the optimized building.
2. Methods
Multi-variable optimizations by coupling the building performance simulation program with optimization environment using a genetic algorithms (GAs) were performed to determine the best path to minimize life cycle costs while reducing the energy use of a typical single-family house in Poland.
The energy modelling tool EnergyPlus [44], which allows integrated calculations of the transfer of mass and energy inside the building, taking into account heating and air-conditioning systems and the strategy of control was used for simulation of the heating and cooling demand. In addition, EnergyPlus makes it possible to carry out parallel simulations and consequently to accelerate the optimization process. The multi-zone model, containing all the heated and unheated rooms, was built in a simulation program. For simplicity’s sake, the rooms without external walls (a hall and a bathroom) were joined into one zone. Internal heat gains were assumed according to the literature [45,46] for occupants, two computers, a TV set and kitchen equipment and lighting. An hourly schedule for the presence of occupants and for the use of lighting and equipment was adopted in each room (Table 1). The duration of the lighting operation (10 W/m2) was additionally dependent on the solar radiation (according to climatic data). The simulations were performed using reference weather data for Katowice [47]. The simulations were run with a fifteen-minute time step.
In the model there is the ground floor. The method of ground heat transfer modelling affect internal temperature, and consequently heating and cooling demand in a building. It was confirmed in the study performed by Mateus et al. [48]. In our paper a simplified 1-D conduction ground model (“Site ground temperature: building surface” [44]) was introduced to the simulation model. Monthly profile of ground temperature was imported from ESP-r program (see Section 2.5). Such a simplification had little influence on the final results (life cycle cost, energy saving) since the difference between the reference and optimized building in the study was analyzed and the same assumption was taken into account in any cases.
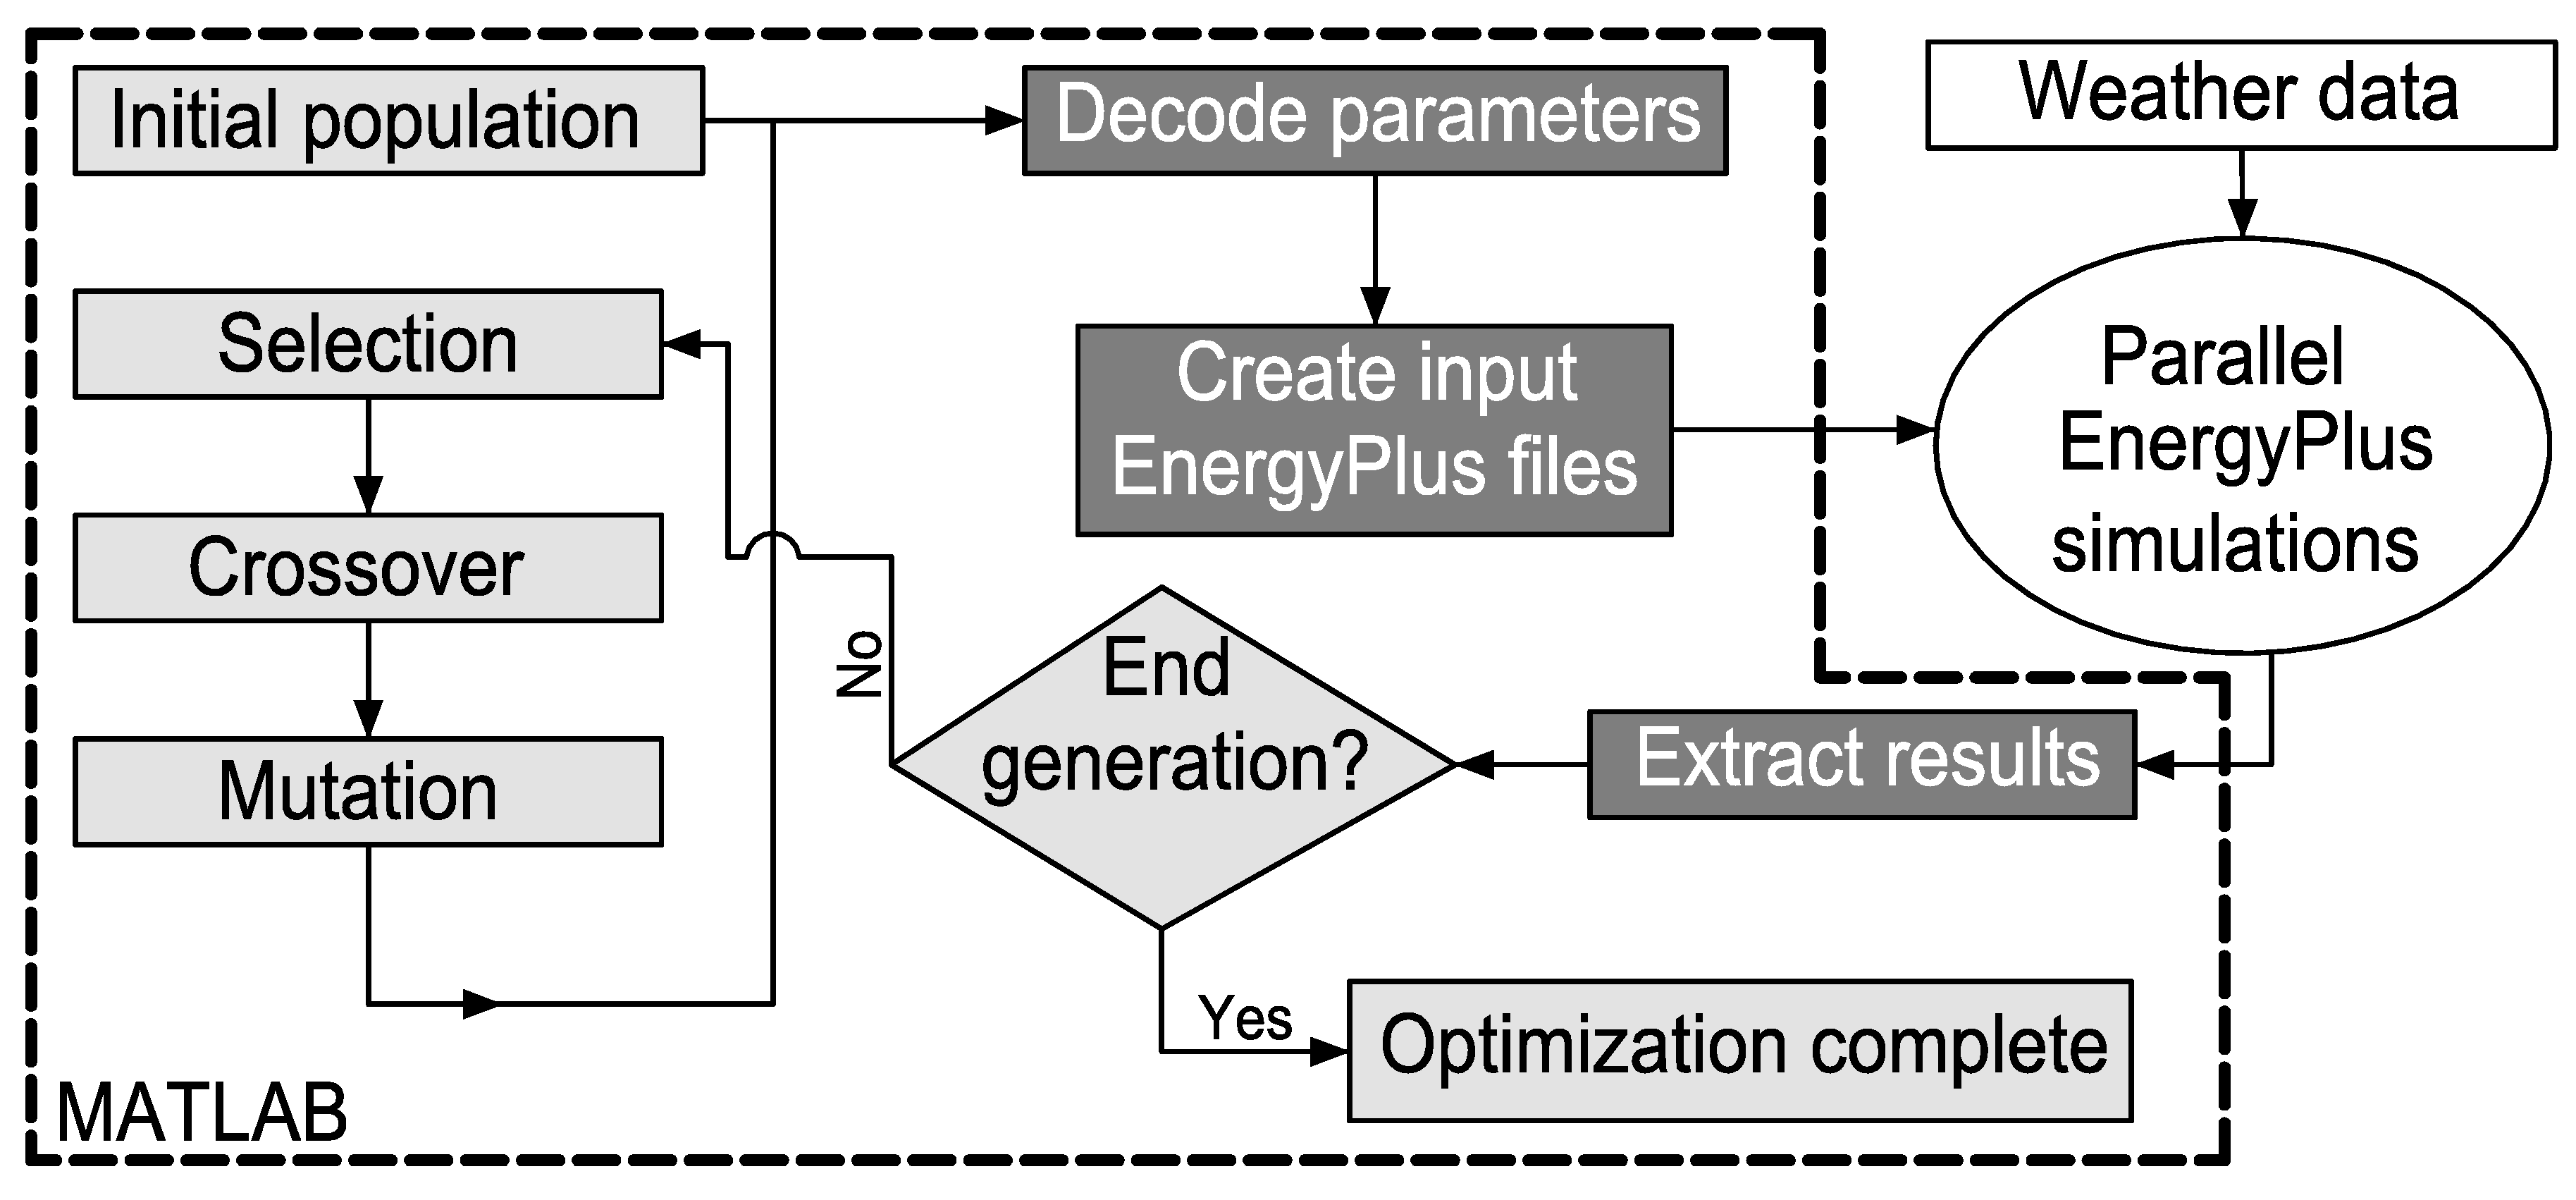
The genetic algorithm method and all procedures to exchange data between the simulation and the optimization tool were implemented in MATLAB (R2017a, The MathWorks Inc., Natick, MA, USA) language. Figure 1 shows the structure of the simulation and optimization environment.
2.1. Building Description
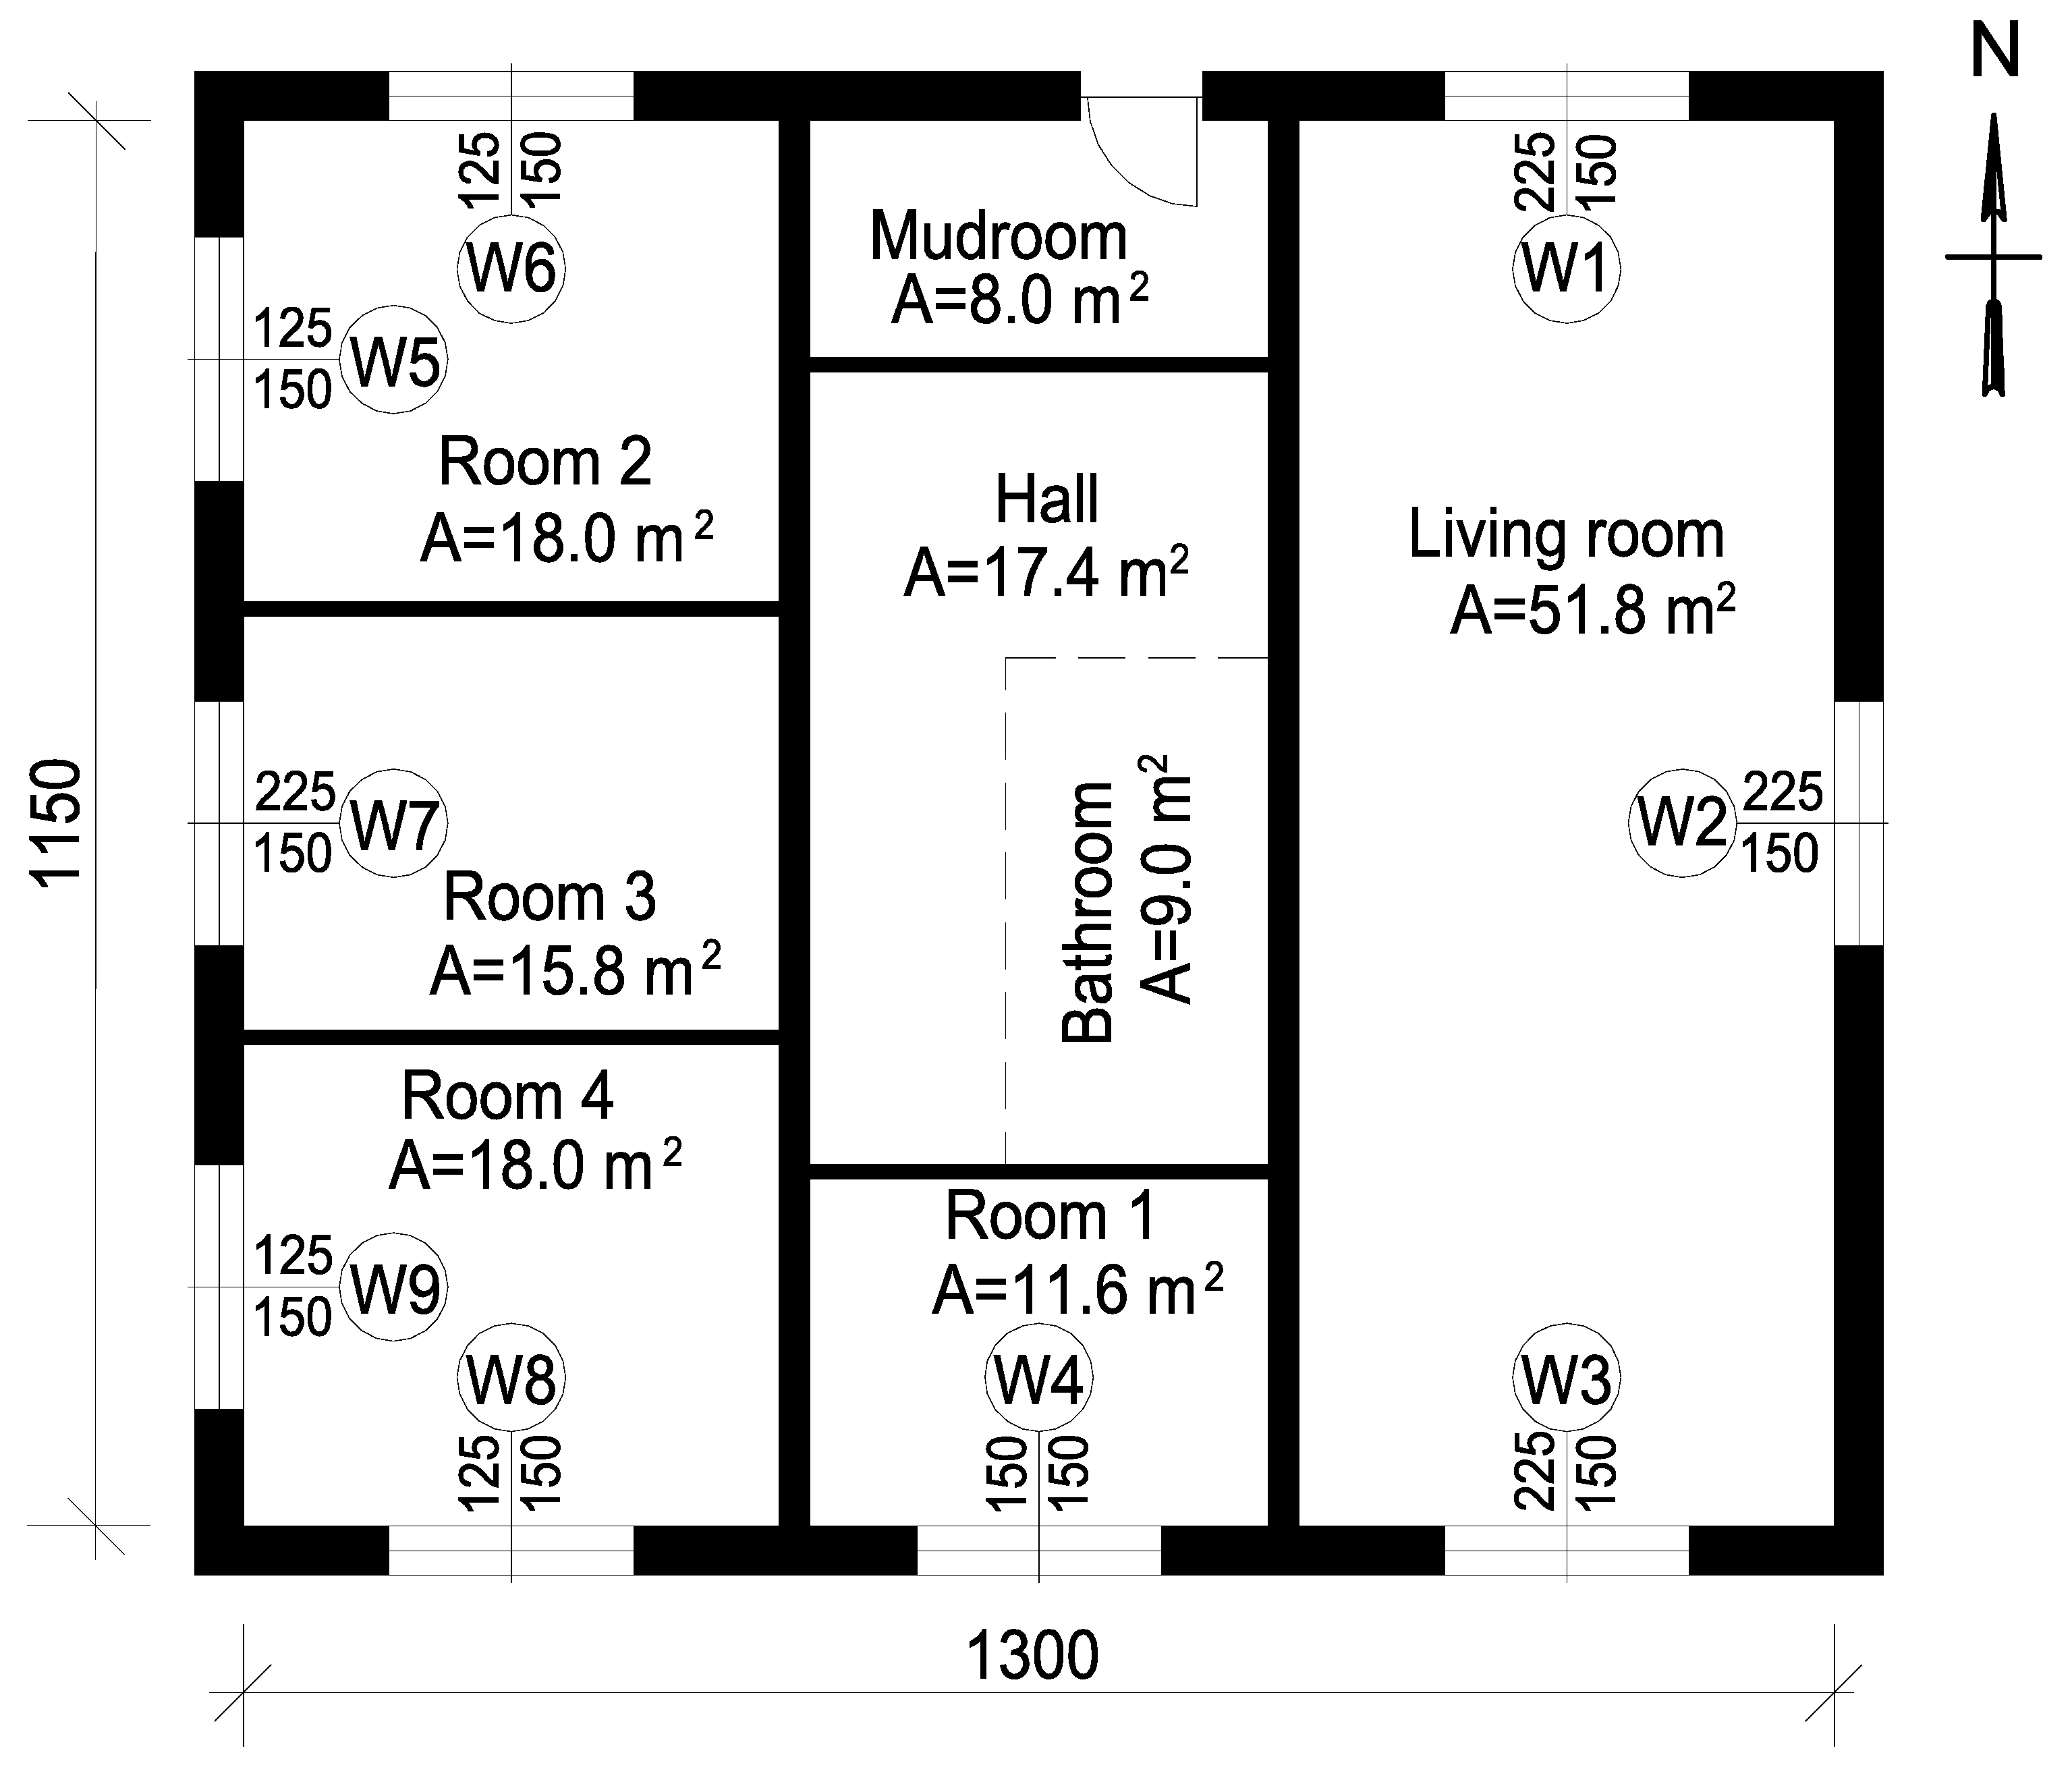
The single-family detached house without a cellar and with unused attic was chosen for the research. The ground floor of the building is shown on Figure 2. Table 2 summarizes the basic characteristics of the reference building.
The house has four bedrooms and an open space kitchen and a living room. The building is air conditioned (split system) and equipped with a hot water central heating system. A natural gas boiler is utilized to generate the hot water supplied to radiators. The cooling set point is kept at 24 °C and heating set point at 20 °C during the whole year. The building uses natural ventilation only. In Poland, the minimum ventilation air flow is set by PN-83/B-03430/Az3:2000 standard [49]. For the analyzed house such minimum air flow is 120 m3/h (it is about 0.3 air change per hour). But according to other Polish standard PN-EN 12831:2006 [50] for the calculation of the design heat load, the air change rate in residential buildings should amount to 0.5 h−1. Therefore, this value is taken as the base value for the calculation. For infiltration simulation “Design Flow Rate” model [44] was chosen, which is based on environmental conditions modifying a design flow rate. The design flow rate is modified by temperature differences and wind speed.
2.2. Design Variables
In optimization analysis the most common design options available in Poland are chosen as design variables. A brief description of these variables is presented below:
- Glazing type characterized by three parameters of the glazing, i.e., heat transfer coefficient (U), solar heat gain coefficient (SHGC) and visible transmittance (Tvis). The optimization was performed for four different types of glazing (Table 3). In the Table 4 the reference value (bold characters) and cost of the glass are shown.
- Windows area (glazing + frame) defined by the sixteen discrete value of windows size (Table 4). Depending on the size of the window the frame surface is automatically calculated for each window.
- External walls, ground floor and ceiling to the unheated attic defined by the thickness of polystyrene and mineral wool. Six options for all kinds of partition are considered.
- Air leakage level defined by infiltration change rate (four various values).
- Orientation defined by the azimuth angle between the north and the front of the house. Sixteen options for the orientation are considered (Table 4).
All possible values of the design variables are summarized in Table 4. Glazing systems were prepared with using Window 7.4 software [51]. Glass types were chosen from the Saint Gobain Glass library [52].
Newly-constructed buildings in Poland must meet Technical Conditions [53]. The partitions’ structure (Table 2) in a reference building (RB) (which will be used in the comparison) was determined so that heat transfer coefficients of external partitions would be according to these requirements. The details of insulation thickness in the partitions are specified in Table 4. Technical Conditions [53] also specify the minimum ratio of glazed area of the windows to the floor area of the rooms they are located in. It should be minimum 1:8. Such a minimum glass area in the analyzed building is 14.4 m2. In the reference building the glazing area amounts to 15.7 m2. The overestimated value results from the adopted assumptions: there are all windows in each room (Figure 2), they have the same surface area and are selected from the allowable options (Table 4). Figure 2 shows the windows’ dimensions in the reference building (they are the overall dimensions with a frame).
2.3. Economic Analysis
Objective functions are the selected simulation results which vary depending on the parametric input combinations, and are the values to be minimized by the optimization algorithm. The simulation-optimization environment can consider a various objective function to perform the optimization analysis. In this study, the cost function is selected as the life cycle cost (LCC).
According to Hasan et al. [31], “the life-cycle cost LCC is the sum of the present value of investment and operating costs for the building and service systems, including those related to maintenance and replacement, over a specified lifespan”.
In terms of economic benefits of energy retrofits, life cycle cost analysis is one of the most common tools used to compare the initial investments and the future benefits of retrofit alternatives in building energy efficiency. LCC, which sums all costs during a certain period of time, provides a criterion for finding the best solution, when the LCC is as low as possible [54].
During a building lifetime the economic factors, e.g., the inflation rate, can change, which affects the discount rate and hence affects the time value of money. The choice of a discounting rate has a large impact on the LCC results [55]. A review of LCC in residential building projects revealed that the discount rate ranged from 2% to 8%. However, it is highlighted that the selection of an appropriate discount rate is the major challenge in LCC [56].
Typically, the widely accepted building lifetime is 25–50 years [15,26,30]. In this paper, the analysis period and building life cycle is considered to be 30 years, according to European Commission Delegated Regulation and its Guidelines for residential buildings [12,57]. The lifespan of a new PCV window is about 30 years [58], the lifespan of the other analyzed components is longer [59] therefore replacement costs have not been taken into account in this study.
In the study life cycle cost was defined by Equation (1). The investment costs of the analyzed design variables have been used for calculations. The remaining investment costs are equal in each case and do not affect the optimization result. Only extra investment costs involved in the reference building that result from the changes introduced in each optimization option have been analyze:
where dIC—the differences between sum of investment cost for implementing all the design and operating features in the reference and optimized case of the building. In this study it is the cost (material and labour) of external walls, ceiling and floor insulation, cost of windows and external walls structural material. Table 4 provides the cost data for various design and operating options. EC—the annual energy cost (heating and cooling) to maintain indoor temperature within the building for the selected design, from Equation (2), a—discount factor which takes into account the effect of inflation and escalation of energy price:
where QH—annual heating demand, kWh; QC—annual cooling demand, kWh; ηH—annual efficiency of heating system; ηC—annual efficiency of cooling system; PH(gas)—price of energy from natural gas, according to the applicable tariffs; PC(el.)—price of electrical energy, according to the applicable tariffs.
LCC = dIC + a(re, N)∙EC
For calculating the operational energy, the energy prices and its escalation rates were obtained. The discount factor was calculated from Equation (3) [31,32,60]:
where re is the real interest rate including the effect of escalation of energy price, and N is the number of years under study. The real interest rate is calculated from:
where r is the real interest rate and e is the escalation in energy price. The real interest rate r is calculated from:
where i is the nominal interest rate and f is the inflation rate.
The following data are assumed for the LCC calculations:
- Efficiency of heating system ηH = 0.78 [61],
- Efficiency of cooling system ηC = 3.79 [61],
- Price of energy from natural gas PH(gas) = 0.0394 €/kWh at 1 September 2017,
- Price of electrical energy PC(el.) = 0.1294 €/kWh at 1 September 2017,
- Investment costs (Table 4),
- Nominal interest rate i = 7% and inflation rate f = 2%. Accordingly, the real interest rate r = 4.9%,
- Escalation in energy price e = 2%,
- Lifespan N = 30 years.
2.4. Optimization Algorithm
The energy performance of a building depends on a great number of parameters and is further influenced by external conditions and internal gains. In order to improve the energy performance of a building the correct parameters should be determined, which requires the right optimization tool. Bearing in mind a great number of variables which can be combined we might end up facing a vast number of combinations while the building itself will not be so complex. It is of vital importance to choose the right tool to solve such a complex problem [29].
Genetic algorithm (GA) [62] is a popular meta-heuristic method that is particularly well suited for the optimal design problems and has been proved to be a good method to solve large scale and combinatorial optimization problems [5]. The advantages of GAs, as well as population-based meta-heuristic algorithms, are the ability to deal with discrete set of design variables, no need for derivatives of objective functions, and the global convergence. GAs are search algorithms based on ideas of natural selection and genetics (selection, crossover, mutation). Although GAs do not guarantee finding the global optimum, they have become advanced optimization tool for a wide range of problems. GAs were further applied in a number of the papers quoted in the introduction of this paper [2,5,14,15,29,30,31,32,33,35,36,38,40,41,42].
Due to their stochastic nature, GAs are faced with two problems: the optimizing capability and convergence speed. To improve the efficiency of GAs, self-adaptive genetic algorithm method (SGA) based on fuzzy arithmetic was applied. SGA was applied simultaneously in the selection of chromosomes and to control basic parameters of genetic algorithm.
The following were applied in the SGA:
- value encoding,
- self-adaptive rank-based roulette wheel selection with power scaling (k),
- self-adaptive uniform crossover with probability (Pc),
- self-adaptive mutation realized by adding some number (S) to or subtracting it from mutated gene with probability (Pm).
GA tries to maintain appropriate balance between exploitation and exploration. On the one hand, good solution should be improved—exploitation, and on the other hand, new solution should also search new regions of potential extremes—exploration. The correct balance is maintained with the use of appropriate parameters (among others mentioned above: k, Pc, S, Pm) entered into the algorithm. In a classic GA all these parameters are fixed and defined before the start of the algorithm. In SGA these parameters are calculated automatically during the run of the algorithm. These parameters depend on many factors (in this paper adopted: chromosomes diversity, the stage of the simulation and the number of generations with no improvement in results) and relationships between these factors and parameters and their impact on optimizing capability and convergence speed of genetic algorithm are very complex. The lack of precise mathematical formulas between input and output variables is the reason why fuzzy logic was used to calculate these parameters. The use of fuzzy control system in SGA significantly accelerates the convergence of the algorithm and improves results as shown in the studies of Grygierek [63,64]. Therefore this type of GA was used in the optimization process. All detailed information about a fuzzy logic controller (membership function, rule base, defuzzification method) was presented in the article [64].
Fifty individuals and eighty populations were assumed in the simulations. A relatively small number of individuals and populations is a compromise between the simulation duration and the quality of the obtained results.
2.5. Model Validation
Prior to the main research (optimization), numerical verification of the constructed model was performed. The hourly, daily and the annual heating and cooling demand for building were verified. The results obtained in EnergyPlus program for the reference building were compared to the results obtained in an alternative energy simulation program: ESP-r [65]. The ESP-r software and energy multizone models were repeatedly validated with experimental data by the authors [66,67,68]. In both programs the models are based on the same assumptions.
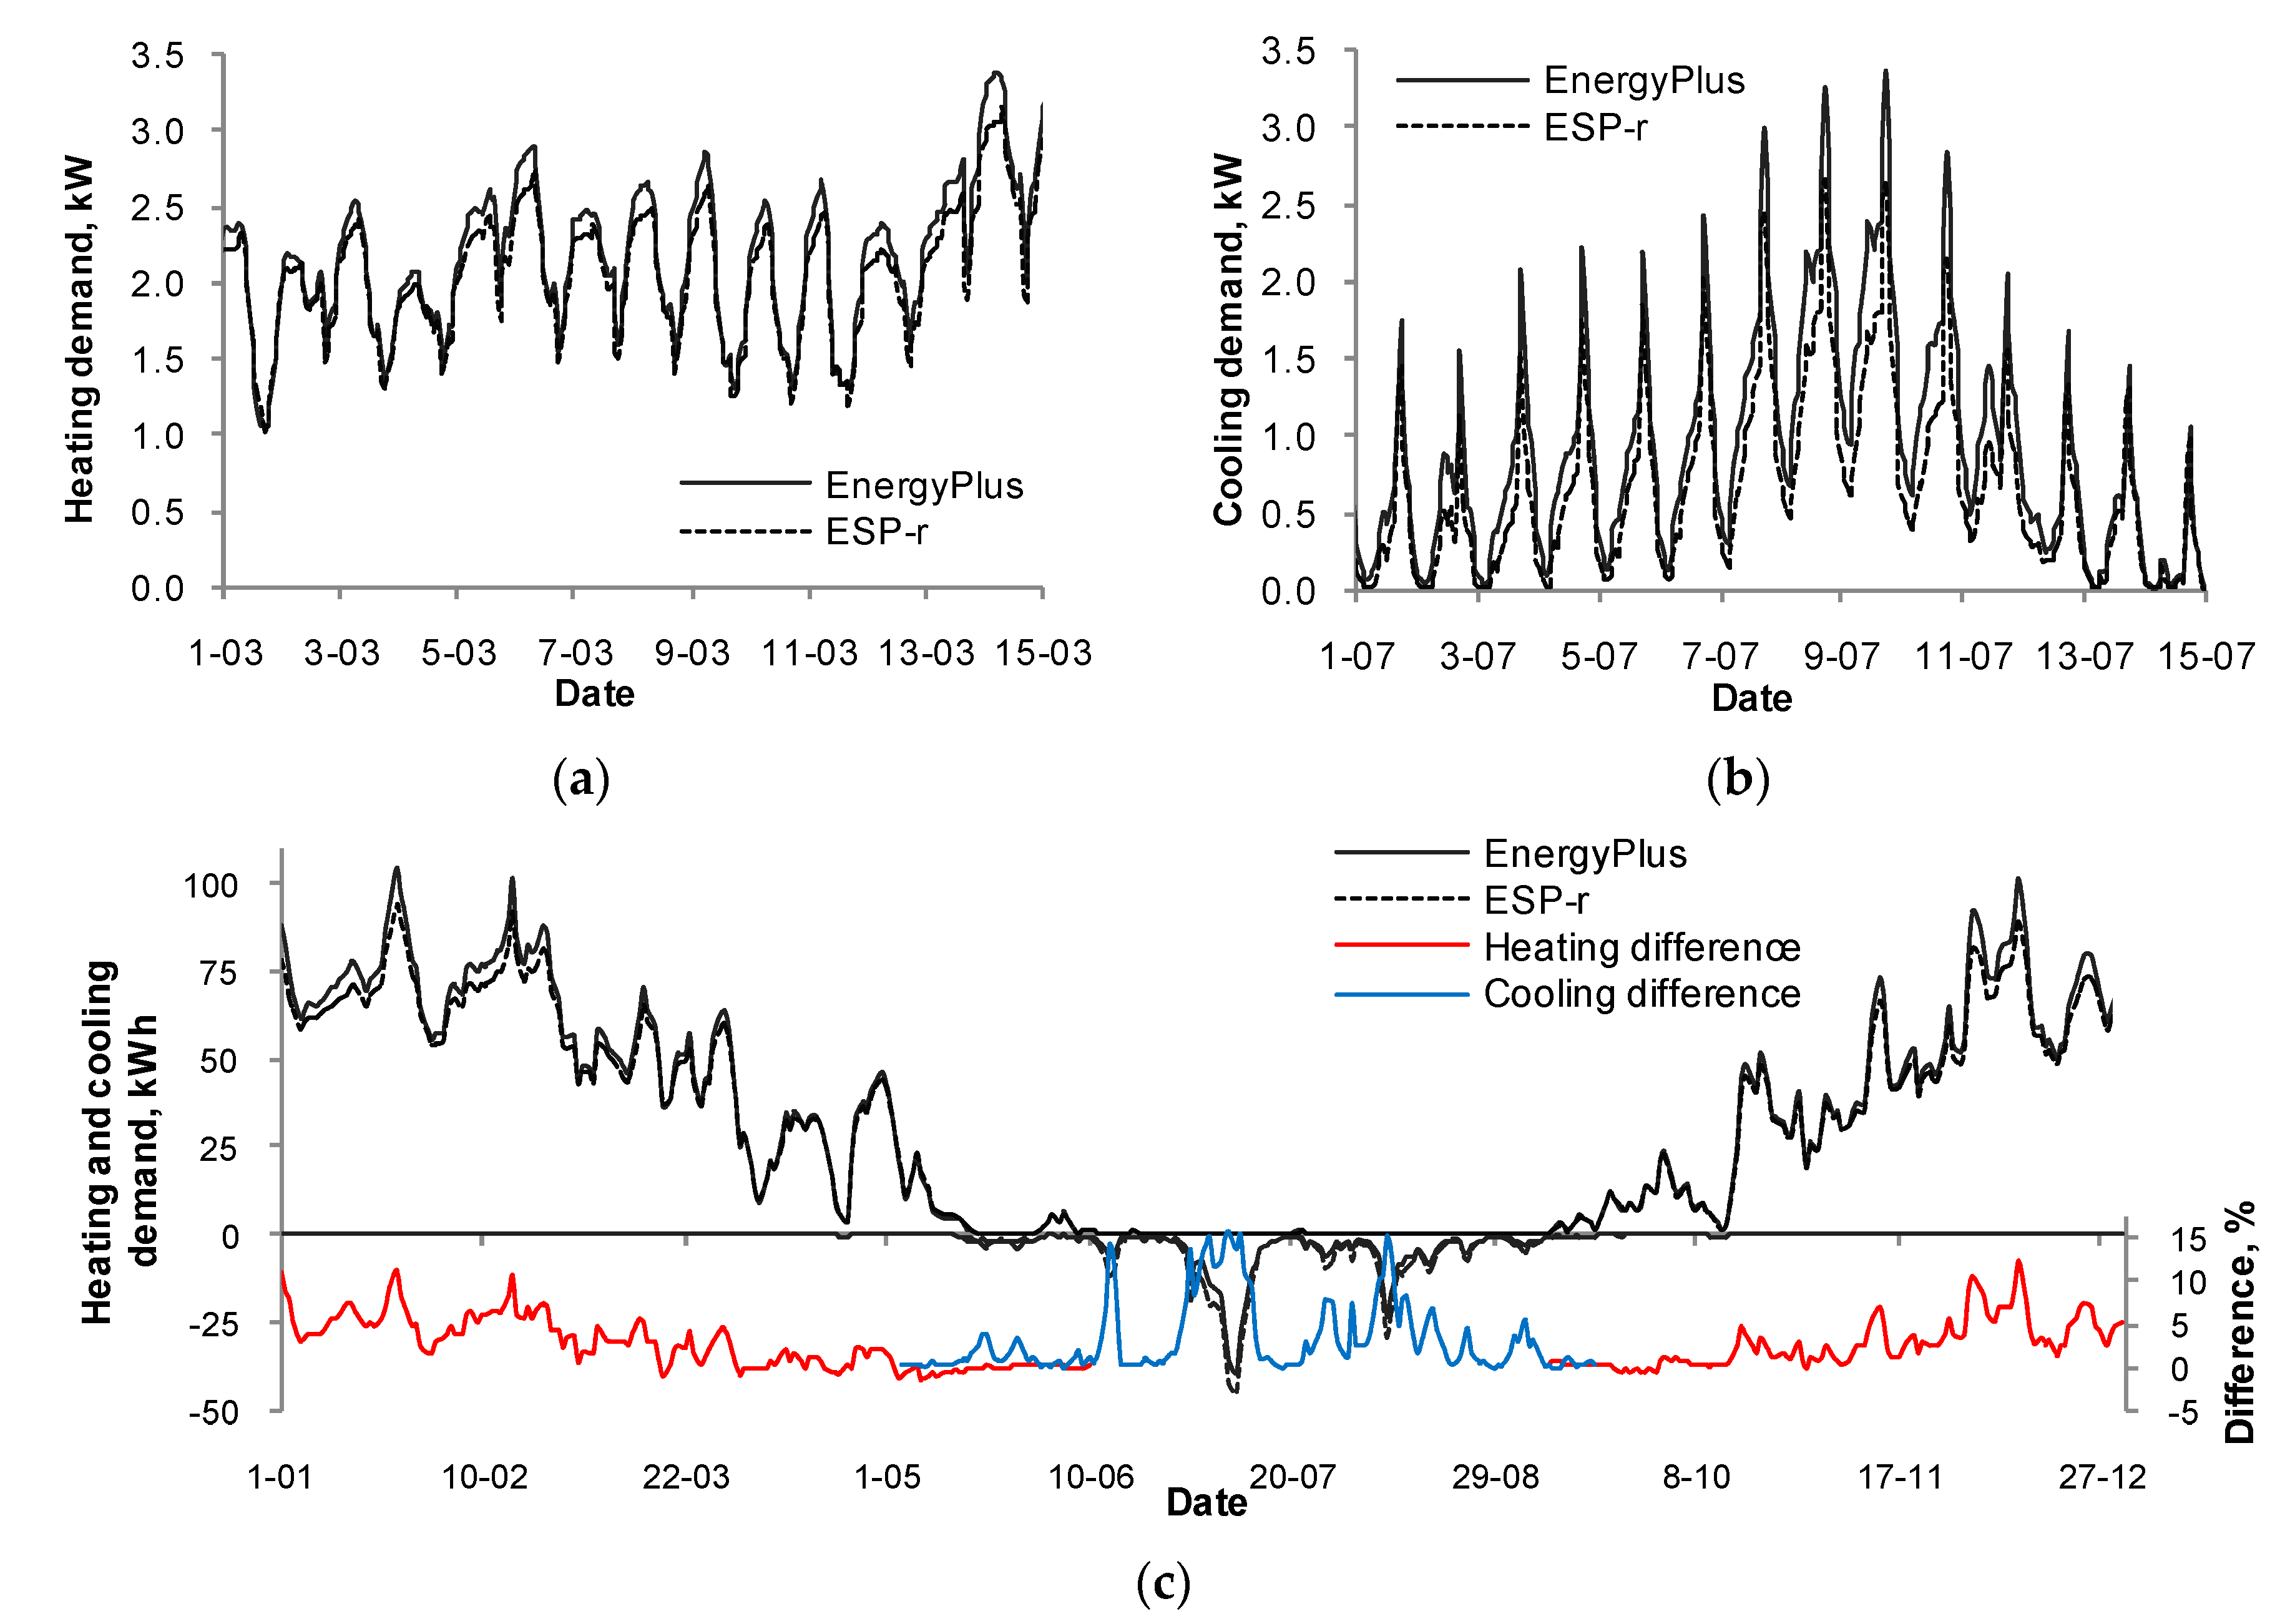
The numerical verification regarding heating and cooling demand makes the results of the simulation calculations reliable—relative difference is small. Figure 3a,b present the comparison of hourly variation of heating and cooling demand for the building obtained by simulations using EnergyPlus and ESP-r for the selected periods of the year. Figure 3c presents comparison and percentage differences for daily values of heating and cooling demand during the whole year. The percentage difference is calculated from Equation (6):
The courses are characterized by large convergence. Correlation coefficients are very high and reach 0.99 for hourly and daily values. For daily values for 77% of the time, the difference does not exceed 5%, and for 94% of the time—10%. For hourly values it is, respectively 80% and 95% of time. The difference in annual energy demand (heating + cooling) calculated in both programs is 8%. The results obtained from EnergyPlus are mostly higher, however similar results were obtained in others studies [69]. Based on this analysis it can be stated that the presented model is characterized by sufficient accuracy and can be used for thermal calculations of the building.
3. Results
Simulations were conducted for seven cases. Table 5 presents the optimized design variables for each case. As a cooling system in detached houses has not yet become a standard (in Poland neither), additional simulations for a building without a cooling system were also conducted (cases with WC extension). The result analysis will be carried out for individual cases.
The results will be compared to the reference building. This is the building which complies with the Polish law [53] for newly-constructed buildings. The design variables for the building have been specified in Table 4. The aim of the simulations is to determine whether higher investments costs that improve the thermal performance of a building are cost-effective for an investor.
The analysis does not include a beneficial influence of reduced energy consumption on natural environment protection. Table 6 presents heating and cooling demand and LCC values for the reference building.
3.1. Cases 1 and 2 (Optimization of Windows Area and Windows Area + Azimuth)
In case 1 the window area was optimized for each glazing type. Additionally, the orientation of the building in case 2 was optimized. It was assumed that there must be at least one window in each of the rooms and two windows in the living room. In the simulations it was assumed that the minimum glazing area is at least 1:8 of the floor area in the room (according to Technical Conditions [53]). The glazing area was calculated automatically in optimization program depending on the total area of the window.
The optimal results for four window types are shown in Table 7 and Table 8 for cases 1 and 2 respectively. Furthermore, they present the best result for cases WC. These tables list LCC costs, heating and cooling demand and saving for optimal results of design variables and for each glazing type. The best result (minimal LCC) has been bolded (it does not include cases WC).
It can be seen that for glazing G10, G08 and G06, G05, the same values for design variables were obtained in cases with and without cooling. Exactly the same windows and orientation of the building were chosen.
3.1.1. Building with Cooling
Maximum LCC savings for cases 1 and 2 amount to 5.9% and 6.8% respectively (window G06). They are relatively small ones, 2% bigger than the savings for window G10 (also used in the RB). In this case (G10), the performance improvement was due to the reduction in the total window area and an increase in the windows size on the southern side (different assumptions regarding the location of the windows for the RB and optimal buildings). One can notice that the optimum results for the windows with higher U value (G10, G07) are achieved when a total window area complies with the one specified in Technical Conditions [53]. When analyzing the results for G06 and G05, it can be observed that it is not right to cling on to the minimum value given in Technical Conditions. For example, in case 1 the surface area of glazing (G06, G05) accounts for 130% of the minimum permissible value.
The reduction of the energy costs is obtained by the proper location of the windows in the building, not by reducing their area. In this case the windows that face the south account for 55% of all windows. The biggest energy savings of 8.6% and 9.0% respectively have been achieved for a window G05 (cases 1 and 2). The high price of such windows, however, makes LCC worse than in windows G06 or even G07 (the most expensive windows). A significantly larger cooling demand can be observed in those two windows, which is the result of a high SHGC value. As in the case of the analyzed building, the costs of 1 kWh of cooling are approximately twice as low as 1 kWh heating costs, overall (LCC) better results are obtained. The optimization of a building orientation gives approximately 1% in LCC savings as well as a slightly lower heat demand.
3.1.2. Building without Cooling
In the case of WC 13.3% and 15.5% in LCC savings were achieved as well as 19.5% and 23.4% savings in energy demand for cases 1 and 2 respectively. The optimum results were obtained for the most expensive G07 window. Furthermore, best results were obtained for the window surface area that amount to 158% (case 1WC) and 182% (case 2WC) of the required minimum according to Technical Conditions [53]. The high SHGC value of window G07 increases solar gains as a result leads to lower heat demand. A deeply-rooted belief held by investors that windows of the smallest surface area and U value need to be chosen, is misguided. In case of WC buildings the energy consumption was largely determined by SGHC value.
3.2. Cases 3 and 4 (Optimization of Insulations and Insulations + Azimuth)
In the following cases the insulation of external walls (IEW), ground floor (IGF) and ceiling to unheated attic (ICA) was optimized. Table 9 presents the optimum design variables and optimum LCC results as well as energy demand for the building with and without cooling.
The optimized design building features allow for the building with cooling to reduce the LCC value by approximately 11% and energy demand by approximately 18%. The orientation optimization improves the results by less than 1%. The benefits in case of WC are considerably bigger: 20% and 35% respectively. As it might have been expected, thicker insulation is optimum for WC. The cost of insulation appears to be the only limitation when increasing the insulation thickness. In case of a building with cooling, thicker insulation increases cooling demand. The optimization of the isolation itself gives 5% more in savings than the optimization of windows only.
3.3. Cases 5 and 6 (Optimization of Glazing Type, Windows Area and Insulations (5) + Azimuth(6))
Table 10 shows the optimum results for these cases.
3.3.1. Building with Cooling
LCC savings in both cases amount to approximately 16%, and energy demand for cases 5 and 6, 25% and 27% respectively. As in the previous cases, the orientation optimization brought little benefit (0.5%). The optimum insulation thickness yield values that are identical with the ones in cases 3 and 4. As the previous optimizations show, the right choice of insulation gives a better result than windows’ optimization.
The comparison of optimum windows and the results for cases 1 and 2 shows that the window area in the analyzed options is significantly smaller (windows G06 and G05). Additionally, the insulated building is characterized by low heat demand, so in these cases the windows with low SHGC values were chosen (G05 and G06) so that solar gains would be insignificant (less cooling). The low U value further limits the heat demand, and a small window area—the initial investment costs.
3.3.2. Building without Cooling
In this case LCC savings amount to 30%. Compared to the building with cooling, the insulation thickness of the floor was increased and the windows were replaced by G07 windows (high SHGC value). One can also notice that the windows area is considerably larger. All the changes were meant to maximize solar gains and consequently, to reduce heat demand. The heating demand for the optimum case 5WC amounts to 82% of the heating demand for the optimum case 5. In case of 6WC the value is much lower, only 78%.
Such an optimization option results in a drastic indoor temperature rise in the summer. The simulations showed that the indoor temperature without additional ventilation in case 6WC exceeds 30 °C (on average in the rooms with windows) during about 30% of the year, which means all the period from the end of May till the beginning of September. The maximum temperature recorded in the living room is 43 °C. It shows that the considerable energy benefits were obtained at the expense of thermal comfort during summer season. The indoor temperature above 30 °C in the living room of the reference building occurs only about 2% of the time. This time period does not exceed 0.5% of the year in other rooms. The maximum indoor temperature is almost 10 K lower when compared to 6WC.
3.4. Case 7 (All Variable)
This case shows how important is infiltration for heating demand in Polish climate (temperate, transitional). LCC savings amount to 34% and 50% respectively for cases 7 and 7WC (Table 10). The optimum results of design variables are consistent with the results obtained in 6 and 6WC, thus the result conclusions are the same as previously described. As expected, the lowest possible infiltration rate of 0.3 h−1 is optimal. Lowering infiltration rates by 0.2 h−1 in well-insulated buildings (cases 6 and 7) results in lowering LCC by 21%, and total heat demand by 30%.
As it has already been mentioned, air change rate of 0.3 h−1 is only the minimum acceptable air exchange in the analyzed building resulting from Polish ventilation standard PN-83/B-03430/Az3: 2000 [49]. Thus, in this case energy savings were obtained at the expense of deteriorated indoor air quality. There is a conflict between energy savings and indoor air quality. The research on ventilation and its impact on indoor air quality and energy consumption was carried out, inter alia, in the studies by Ferdyn-Grygierek [70] and Popiołek and Ferdyn-Grygierek [71]. The subject is widely discussed in the paper Gennaro et al. [72]. The investment costs should not be considered only from an economical point of view but most importantly, form occupants’ point of view as well as their health and comfort. The presented model does not account for this particular aspect. It requires further research that will employ, inter alia, the different objective function in the optimization model.
3.5. Summary
Proper design of the external partitions of buildings, such as windows, walls, ground floor and roof, prevents excessive heat loss in winter as well as too high heat gains from the sun in summer. The location and climate of Poland determine the need to heat buildings for a significant part of the year, typically from September to May. The demand for cooling constitutes a smaller part of the total energy demand. In the analyzed building, depending on the optimization case, the cooling demand amounts to about 11–32% of the heating demand. But for smaller infiltration in a building, cooling demand is even 45% of heating demand.
The study showed that the investment above the Polish required standard is cost-effective during the lifetime of the building. Depending on the analyzed case, as the results of the optimization, the life cycle costs in building with cooling and heating systems decrease from about 700 € to over 3800 € (Table 11). It is from 7% to 34% LCC value of the reference building. The optimal design variables for all cases with heating and cooling systems are summarized in Table 11.
A reduction of air exchange in the building with well-insulated external partitions to the minimum permitted by regulations allows for considerable reductions in heating costs (in the analyzed building by about 30%). The need for cooling, however, rises by about 16%. Air exchange optimization control in a building may become an inexpensive way to reduce heating costs, which we will consider in our future research.
The simulation results for the analyzed building may be applied to every detached house in a similar climate. However, in order to achieve maximum LCC reduction such complex and time-consuming calculations need to be performed for each building separately.
4. Conclusions
The paper presents the methodology and the tool aimed at supporting the choice of economically effective building solutions. The detailed multi-zone model of a building and the gains that are attributed to the relevant zones contributed to maximize the obtained results (reduced LCC). In many works on this subject, the size of the windows is determined only by the ratio of their area to the façade area [15]. The window optimization tool built in this study analyses each window separately and allows to remove windows that overstate the energy consumption.
The conducted research and analyses allowed the elaboration of the following main conclusions:
- The cheapest way to reduce the energy consumption for heating and cooling is to locate windows on the southern side of the building. This applies especially to rooms with smaller internal gains.
- Selecting windows should not be based solely on the heat transfer coefficient (which is a widespread practice with investors). Solar optical properties of windows also significantly affect the cost of the energy consumption, especially in case without cooling system.
- The optimum glazing area for buildings with cooling is highly dependent on external walls insulation. The simulation results showed that the windows area varies from the minimum norm value to 130% of this value. In order to achieve minimum LCC in a building without cooling (WC), the windows area should be tens of percent larger than the requirements set out in the Standards.
- In case of limited investment costs optimization regarding only insulation of external partitions is more effective than optimization of windows only (due to LCC). In the analyzed building it is 5%.
- When determining the design parameters of a building in transitional climates, both cooling and heating costs should be considered. The optimization of a building from the heating point of view greatly reduces heating costs, however, the thermal comfort in summer deteriorates dramatically.
- One should make decisions about having or not having a cooling system installed prior to determining optimum qualities of a building. Without a cooling system, apart from life cycle cost, extra objective functions e.g., a thermal comfort index need to be employed.
The developed simulation environment can also be used to optimize other building parameters. The simulation environment can easily be extended to other types of buildings. In further research the optimization environment will be used to optimize air exchange control in a building, where increasing/reducing the number of air exchanges depending on the heating and cooling needs will be possible. This environment will also be used for multi-objective optimization where the objective function will be the cost of energy consumption and thermal comfort indices which are, as mentioned, of great importance in buildings without a cooling system.
Acknowledgments
The work was performed within Statutory works BK-282/RIE1/2017 and BK-238/RB-8/2017, funded by the Ministry of Science and Higher Education.
Author Contributions
Joanna Ferdyn-Grygierek prepared the thermal model of the building, performed the dynamic energy simulation and its results’ analysis and contributed to writing the manuscript. Krzysztof Grygierek defined the mathematical model of the optimization algorithm, performed the simulations, analyzed the results and contributed to writing the manuscript.
Conflicts of Interest
The authors declare no conflict of interest.
References
- Moran, P.; Goggins, J.; Hajdukiewicz, M. Super-insulate or use renewable technology? Life cycle cost, energy and global warming potential analysis of nearly zero energy buildings (NZEB) in a temperate oceanic climate. Energy Build. 2017, 139, 590–607. [Google Scholar] [CrossRef]
- Schwartz, Y.; Raslan, R.; Mumovic, D. Implementing multi objective genetic algorithm for life cycle carbon footprint and life cycle cost minimisation: A building refurbishment case study. Energy 2016, 97, 58–68. [Google Scholar] [CrossRef]
- Liu, L.; Rohdin, P.; Moshfegh, B. LCC assessments and environmental impacts on the energy renovation of a multi-family building from the 1890s. Energy Build. 2016, 133, 823–833. [Google Scholar] [CrossRef]
- Atmaca, A.; Atmaca, N. Comparative life cycle energy and cost analysis of post-disaster temporary housings. Appl. Energy 2016, 171, 429–443. [Google Scholar] [CrossRef]
- Ko, M.J.; Kim, Y.S.; Chung, M.H.; Jeon, H.C. Multi-objective optimization design for a hybrid energy system using the genetic algorithm. Energies 2015, 8, 2924–2949. [Google Scholar] [CrossRef]
- Wang, B.; Xia, X.; Zhang, J. A multi-objective optimization model for the life-cycle cost analysis and retrofitting planning of buildings. Energy Build. 2014, 77, 227–235. [Google Scholar] [CrossRef]
- Kapsalaki, M.; Leal, V.; Santamouris, M. A methodology for economic efficient design of Net Zero Energy Buildings. Energy Build. 2012, 55, 765–778. [Google Scholar] [CrossRef]
- Jaber, S.; Ajib, S. Thermal and economic windows design for different climate zones. Energy Build. 2011, 43, 3208–3215. [Google Scholar] [CrossRef]
- Takano, A.; Pal, S.K.; Kuittinen, M.; Alanne, K. Life cycle energy balance of residential buildings: A case study on hypothetical building models in Finland. Energy Build. 2015, 105, 154–164. [Google Scholar] [CrossRef]
- Kaynakli, O. A study on residential heating energy requirement and optimum insulation thickness. Renew. Energy 2008, 33, 1164–1172. [Google Scholar] [CrossRef]
- Crawford, R.H.; Bartak, E.L.; Stephan, A.; Jensen, C.A. Evaluating the life cycle energy benefits of energy efficiency regulations for buildings. Renew. Sustain. Energy Rev. 2016, 63, 435–451. [Google Scholar] [CrossRef]
- EU Commission and Parliament. Directive 2010/31/EU of the European Parliament and the Council of the European Union of the 19 May 2010 on the Energy Performance of Buildings; Official Journal of the European Communities, European Parliament, the Council of the European Union: Brussels, Belgium, 2010; pp. 13–35. [Google Scholar]
- Gasparella, A.; Pernigotto, G.; Cappelletti, F.; Romagnoni, P.; Baggio, P. Analysis and modelling of window and glazing systems energy performance for a well insulated residential building. Energy Build. 2011, 43, 1030–1037. [Google Scholar] [CrossRef]
- Tuhus-Dubrow, D.; Krarti, M. Genetic-algorithm based approach to optimize building envelope design for residential buildings. Build. Environ. 2010, 45, 1574–1581. [Google Scholar] [CrossRef]
- Bichiou, Y.; Krarti, M. Optimization of envelope and HVAC systems selection for residential buildings. Energy Build. 2011, 43, 3373–3382. [Google Scholar] [CrossRef]
- Rodrigues, C.; Freire, F. Building retrofit addressing occupancy: An integrated cost and environmental life-cycle analysis. Energy Build. 2017, 140, 388–398. [Google Scholar] [CrossRef]
- Jaber, S.; Ajib, S. Optimum, technical and energy efficiency design of residential building in Mediterranean region. Energy Build. 2011, 43, 1829–1834. [Google Scholar] [CrossRef]
- Cheung, C.K.; Fuller, R.J.; Luther, M.B. Energy-efficient envelope design for high-rise apartments. Energy Build. 2005, 37, 37–48. [Google Scholar] [CrossRef]
- Ruiz, M.C.; Romero, E. Energy saving in the conventional design of a Spanish house using thermal simulation. Energy Build. 2011, 43, 3226–3235. [Google Scholar] [CrossRef]
- Chastas, P.; Theodosiou, T.; Kontoleon, K.J.; Bikas, D. The effect of embodied impact on the cost-optimal levels of Nearly Zero energy buildings: A case study of a residential building in Thessaloniki, Greece. Energies 2017, 10, 740. [Google Scholar] [CrossRef]
- Yu, J.; Yang, C.; Tian, L. Low-energy envelope design of residential building in hot summer and cold winter zone in China. Energy Build. 2008, 40, 1536–1546. [Google Scholar] [CrossRef]
- Rodrigues, C.; Freire, F. Integrated life-cycle assessment and thermal dynamic simulation of alternative scenarios for the roof retrofit of a house. Build. Environ. 2014, 81, 204–215. [Google Scholar] [CrossRef] [Green Version]
- Rodrigues, C.; Freire, F. Environmental impact trade-offs in building envelope retrofit strategies. Int. J. Life Cycle Assess. 2017, 22, 557–570. [Google Scholar] [CrossRef]
- Ferdyn-Grygierek, J.; Baranowski, A. Energy-saving solutions for the cooling of the office buildings. Rynek Energii 2009, 1, 46–52. (In Polish) [Google Scholar]
- Tokarik, M.S.; Richman, R.C. Life cycle cost optimization of passive energy efficiency improvements in a Toronto house. Energy Build. 2016, 118, 160–169. [Google Scholar] [CrossRef]
- Ascione, F.; Bianco, N.; De Stasio, C.; Mauro, G.M.; Vanoli, G.P. CASA, cost-optimal analysis by multi-objective optimisation and artificial neural networks: A new framework for the robust assessment of cost-optimal energy retrofit, feasible for any building. Energy Build. 2017, 146, 200–219. [Google Scholar] [CrossRef]
- Ko, M.J. Analysis and optimization design of a solar water heating system based on life cycle cost using a genetic algorithm. Energies 2015, 8, 11380–11403. [Google Scholar] [CrossRef]
- Król, M.; Białecki, R. Optimization of a window frame by BEM and genetic algorithm. Int. J. Numer. Methods Heat Fluid Flow 2003, 13, 565–580. [Google Scholar] [CrossRef]
- Znouda, E.; Ghrab-Morcos, N.; Hadj-Alouane, A. Optimization of Mediterranean building design using genetic algorithms. Energy Build. 2007, 39, 148–153. [Google Scholar] [CrossRef]
- Han, G.; Srebric, J.; Enache-Pommer, E. Variability of optimal solutions for building components based on comprehensive life cycle cost analysis. Energy Build. 2014, 79, 223–231. [Google Scholar] [CrossRef]
- Hasan, A.; Vuolle, M.; Siren, K. Minimisation of life cycle cost of a detached house using combined simulation and optimization. Build. Environ. 2008, 43, 2022–2034. [Google Scholar] [CrossRef]
- Ihm, P.; Krarti, M. Design optimization of energy efficient residential buildings in Tunisia. Build. Environ. 2012, 58, 81–90. [Google Scholar] [CrossRef]
- Ruiz, A.; de la Flor, S.; Felix, M.; Lissen, S.; Martín, G. Applying the HVAC systems in an integrated optimization method for residential building’s design. A case study in Spain. Energy Build. 2016, 119, 74–84. [Google Scholar] [CrossRef]
- Kim, H.Y.; Kang, H.J. A study on development of a cost optimal and energy saving building model: Focused on industrial building. Energies 2016, 9, 181. [Google Scholar] [CrossRef]
- Ferrara, M.; Fabrizio, E.; Virgone, J.; Filippi, M. A simulation-based optimization method for cost-optimal analysis of nearly Zero Energy Buildings. Energy Build. 2014, 84, 442–457. [Google Scholar] [CrossRef]
- Carreras, J.; Pozo, C.; Boer, D.; Guillén-Gosálbez, G.; Caballerod, J.A.; Ruiz-Femeniad, R.; Jiménez, L. Systematic approach for the life cycle multi-objective optimization of buildings combining objective reduction and surrogate modeling. Energy Build. 2016, 130, 506–518. [Google Scholar] [CrossRef]
- Ascione, F.; Bianco, N.; De Stasioa, C.; Mauro, G.M.; Vanoli, G.P. A new methodology for cost-optimal analysis by means of the multi-objective optimization of building energy performance. Energy Build. 2015, 88, 78–90. [Google Scholar] [CrossRef]
- Mostavi, E.; Asadi, S.; Boussaa, D. Development of a new methodology to optimize building life cycle cost, environmental impacts, and occupant satisfaction. Energy 2017, 121, 606–615. [Google Scholar] [CrossRef]
- Ascione, F.; Bianco, N.; De Stasio, C.; Mauro, G.M.; Vanoli, G.P. Simulation-based model predictive control by the multi-objective optimization of building energy performance and thermal comfort. Energy Build. 2016, 111, 131–144. [Google Scholar] [CrossRef]
- Azari, R.; Garshasbi, S.; Amini, P.; Rashed-Ali, H.; Mohammadi, Y. Multi-objective optimization of building envelope design for life cycle environmental performance. Energy Build. 2016, 126, 524–534. [Google Scholar] [CrossRef]
- Wright, J.A.; Loosemore, H.A.; Farmani, R. Optimization of building thermal design and control by multi-criterion genetic algorithm. Energy Build. 2002, 34, 959–972. [Google Scholar] [CrossRef]
- Król, M.; Król, A. Multi-criteria numerical analysis of factors influencing the efficiency of natural smoke venting of atria. J. Wind Eng. Ind. Aerodyn. 2017, 170, 149–161. [Google Scholar] [CrossRef]
- Stolarski, M.J.; Krzyżaniak, M.; Warmiński, K.; Niksa, D. Energy consumption and costs of heating a detached house with wood briquettes in comparison to other fuels. Energy Convers. Manag. 2016, 121, 71–83. [Google Scholar] [CrossRef]
- EnergyPlus™; version 8.7; Documentation, Engineering Reference; U.S. Department of Energy: Washington, DC, USA, 2016. Available online: https://energyplus.net/sites/all/modules/custom/nrel_custom/pdfs/pdfs_v8.7.0/EngineeringReference.pdf (accessed on 9 October 2017).
- American Society of Heating, Refrigerating and Air Conditioning Engineers. ASHRAE Handbook, Fundamentals, SI ed.; American Society of Heating, Refrigerating and Air Conditioning Engineers: Atlanta, GA, USA, 1997; ISBN 978-1883413453. [Google Scholar]
- Recknagel, H.; Schramek, E.R. Handbook. Heating, Air Conditioning, Domestic Hot Water, Refrigerator Technology; Omni Scala: Wrocław, Poland, 2008; ISBN 978-83-926833-6-0. (In Polish) [Google Scholar]
- EnergyPlus Weather File. Available online: https://energyplus.net/weather-location/europe_wmo_region_6/POL/POL_Katowice.125600_IMGW (accessed on 9 October 2017).
- Mateus, N.M.; Pinto, A.; Carrilho da Graca, G. Validation of EnergyPlus thermal simulation of a double skin naturally and mechanically ventilated test cell. Energy Build. 2014, 75, 511–522. [Google Scholar] [CrossRef]
- Polish Standard PN-83/B-03430/Az3:2000 Ventilation in Dwellings and Public Utility Buildings; Polish Committee for Standardization: Warsaw, Poland, 2000. (In Polish)
- Polish Standard PN-EN 12831:2006 Heating Systems in Buildings. Method for Calculation of the Design Heat Load; Polish Committee for Standardization: Warsaw, Poland, 2006. (In Polish)
- THERM 6.3/WINDOW 6.3 NFRC Simulation Manual, Lawrence Berkeley National Laboratory. July 2013. Available online: https://windows.lbl.gov/sites/default/files/Downloads/nfrcsim6-3-2013-07-manual.pdf (accessed on 9 October 2017).
- Saint Gobain Glass. Available online: http://pl.saint-gobain-glass.com/ (accessed on 9 October 2017).
- Polish Ministry of Infrastructure. Regulation of the Minister of Infrastructure of 12 April 2002 on the Technical Conditions That Should Be Met by Buildings and Their Location; Journal of Laws of the Republic of Poland No 75, item. 690, (with recast); Polish Ministry of Infrastructure: Warsaw, Poland, 2002. (In Polish)
- Jafari, A.; Valentin, V. An optimization framework for building energy retrofits decision-making. Build. Environ. 2017, 115, 118–129. [Google Scholar] [CrossRef]
- Kovacic, I.; Zoller, V. Building life cycle optimization tools for early design phases. Energy 2015, 92, 409–419. [Google Scholar] [CrossRef]
- Zuoa, J.; Pullen, S.; Rameezdeen, R.; Bennetts, H.; Wang, Y.; Mao, G.; Zhou, Z.; Du, H.; Duan, H. Green building evaluation from a life-cycle perspective in Australia: A critical review. Renew. Sustain. Energy Rev. 2017, 70, 358–368. [Google Scholar] [CrossRef]
- EU Commission. Commission Delegated Regulation (EU) No 244/2012 of 16 January 2012 Supplementing Directive 2010/31/EU of the European Parliament and of the Council on the Energy Performance of Buildings by Establishing a Comparative Methodology Framework for Calculating Cost-Optimal Levels of Minimum Energy Performance Requirements for Buildings; Official Journal of the European Union 55; EU: Brussels, Belgium, 2012; pp. 18–36. [Google Scholar]
- EU Commission. Life Cycle Assessment of PVC and of Principal Competing Materials—Final Report; EU Commission: Brussels, Belgium, 2004; Available online: http://www.pvc.org/upload/documents/PVC-final-report-lca.pdf (accessed on 9 October 2017).
- Udawattha, C.; Halwatura, R. Life cycle cost of different Walling material used for affordable housing in tropics. Case Stud. Constr. Mater. 2017, 7, 15–29. [Google Scholar] [CrossRef]
- Niemelä, T.; Kosonen, R.; Jokisalo, J. Cost-optimal energy performance renovation measures of educational buildings in cold climate. Appl. Energy 2016, 183, 1005–1020. [Google Scholar] [CrossRef]
- Polish Ministry of Infrastructure. Regulation of the Minister of Infrastructure of 27 February 2015 on the Methodology for Calculating the Energy Performance of a Building or Part of a Building and Energy Performance Certificates; Journal of Laws of the Republic of Poland, item. 376; Polish Ministry of Infrastructure: Warsaw, Poland, 2015. (In Polish)
- Goldberg, D.E. Genetic Algorithms in Search, Optimization and Machine Learning; Addison-Wesley Publishing Company, Inc.: Boston, MA, USA, 1989; ISBN 978-0201157673. [Google Scholar]
- Grygierek, K. Self-adaptive method of genetic algorithm in optimization of spatial truss structures. Modelowanie Inżynierskie 2014, 21, 80–86. (In Polish) [Google Scholar]
- Grygierek, K. Optimization of trusses with self-adaptive approach in genetic algorithms. Archit. Civ. Eng. Environ. 2016, 9, 67–78. [Google Scholar]
- University of Strathclyde Energy Systems Research Unit. The ESP-r System for Building Energy Simulation; User Guide Version 10 Series; ESRU Manual U02/1; University of Strathclyde Energy Systems Research Unit: Glasgow, UK, 2002. [Google Scholar]
- Ferdyn-Grygierek, J. Indoor environment quality in the museum building and its effect on heating and cooling demand. Energy Build. 2014, 85, 32–44. [Google Scholar] [CrossRef]
- Ferdyn-Grygierek, J.; Baranowski, A. Internal environment in the museum building Assessment and improvement of air exchange and its impact on energy demand for heating. Energy Build. 2015, 92, 45–54. [Google Scholar] [CrossRef]
- Baranowski, A.; Ferdyn-Grygierek, J. Heat demand and air exchange in a multifamily building—Simulation with elements of validation. Build. Serv. Eng. Res. Technol. 2009, 30, 227–240. [Google Scholar] [CrossRef]
- Equa Simulation AB. Technical Report: Validation of IDA Indoor Climate and Energy4.0 build 4 with respect to ANSI/ASHRAE Standard 140-2004; Equa Simulation AB: Solna, Sweden, 2010. [Google Scholar]
- Ferdyn-Grygierek, J. Impact of ventilation systems on indoor air quality and annual energy consumption in school buildings. In Proceedings of the 25th AIVC Conference Ventilation and retrofitting, Prague, Czech Republic, 15–17 September 2004; International Energy Agency: Brussels, Belgium, 2014; pp. 255–260. [Google Scholar]
- Popiołek, Z.; Ferdyn-Grygierek, J. Efficiency of heating and ventilation in school buildings before and after retrofitting. In Proceedings of the 3rd International Seminar Healthy Buildings, Sofia, Bulgaria, 18 November 2005; Official Seminar within the EC Program Centers of Excellence EC Contract No ENK6-CT-2002-80661. Center for Research and Design in Human Comfort, Energy and Environment (CERDECEN), Technical University of Sofia: Sofia, Bulgaria, 2005; pp. 67–76. [Google Scholar]
- De Gennaro, G.; Dambruoso, P.R.; Demarinis Loiotile, A.; Di Gilio, A.; Giungato, P.; Tutino, M.; Marzocca, A.; Mazzone, A.; Palmisani, J.; Porcelli, F. Indoor air quality in schools. Environ. Chem. Lett. 2014, 12, 467–482. [Google Scholar] [CrossRef]
Figure 1.
Flowchart diagram for the developed simulation/optimization tool.

Figure 2.
Ground floor view, dimensions are in cm.

Figure 3.
Variation of the calculated (using ESP-r and EnergyPlus software) hourly values of heating demand in March (a) and cooling demand in July (b) and daily heating (positive values) and cooling (negative values) demand in the whole year (c).
Figure 3.
Variation of the calculated (using ESP-r and EnergyPlus software) hourly values of heating demand in March (a) and cooling demand in July (b) and daily heating (positive values) and cooling (negative values) demand in the whole year (c).


Table 1.
Internal heat gains schedule.
| Room | Weekdays | Weekends | ||
|---|---|---|---|---|
| Occupant | Equipment | Occupant | Equipment | |
| Living room | 6 a.m. to 7 a.m. (4) * 4 p.m. to 6 p.m. (4) 6 p.m. to 10 p.m. (1) | 4 p.m. to 6 p.m. (cook.) 4 p.m. to 10 p.m. (TV) all day (fridge) | 8 a.m. to 11 a.m. (4) 1 p.m. to 4 p.m. (2) 4 p.m. to 6 p.m. (4) 6 p.m. to 10 p.m. (2) | 4 p.m. to 6 p.m. (cook.) 4 p.m. to 10 p.m. (TV) all day (fridge) |
| Room 1 | 6 p.m. to 6 a.m. (1) | 6 p.m. to 10 p.m. (PC) | 8 p.m. to 8 a.m. (1) | 8 p.m. to 10 p.m. (PC) |
| Room 2 | 6 p.m. to 10 p.m. (1) | 6 p.m. to 10 p.m. (PC) | - | - |
| Room 3 | 10 p.m. to 6 a.m. (2) | - | 10 p.m. to 8 a.m. (2) | - |
| Room 4 | 6 p.m. to 6 a.m. (1) | - | 8 p.m. to 8 a.m. (1) | - |
* Number of occupants.
Table 2.
Characteristics of the reference building.
| Parameters | Value |
|---|---|
| Number of Occupants | 4 |
| Number of Heated Floors | 1 |
| Area of Heated Floor | 150 m2 |
| Floor-to-floor Height | 2.6 m |
| External Wall Construction | Brick with polystyrene insulation, U = 0.22 W/m2·K |
| Ceiling Construction | Ferroconcrete with mineral wool insulation, U = 0.18 W/m2·K |
| Roof Construction | Covered with ceramic tiles and uninsulated |
| Ground Floor Construction | Concrete with polystyrene insulation, U = 0.29 W/m2·K |
| Windows Construction | Double glazed, PCV frame, Uwindow = 1.13 W/m2·K |
| External Door Construction | Wood, U = 1.50 W/m2·K |
| Opaque External Wall | 102.15 m2 |
| Window Area | 23.25 m2 |
| Ventilation | Natural |
| Cooling System | Split system air conditioner (electricity) |
| Heating System | Central heating with radiators (natural gas) |
Table 3.
Visible and solar energy parameters of the glazing.
| Type of Glazing | Glazing Construction | Uglass, W/m2 K | Uframe *, W/m2 K | Uwindow **, W/m2 K | SHGC | Tvis |
|---|---|---|---|---|---|---|
| Glazing G10 | Planiclear 4 mm | 1 | 1.35 | 1.13 | 0.49 | 0.72 |
| Argon 16 mm | ||||||
| Planitherm ONE 4 mm | ||||||
| Glazing G07 | Planitherm LUX 4 mm | 0.68 | 1.35 | 0.9 | 0.61 | 0.73 |
| Argon 16 mm | ||||||
| Planiclear 4mm | ||||||
| Argon 16 mm | ||||||
| Planitherm LUX 4 mm | ||||||
| Glazing G06 | Planitherm XN 4 mm | 0.61 | 1.35 | 0.85 | 0.51 | 0.74 |
| Argon 16 mm | ||||||
| Planiclear 4 mm | ||||||
| Argon 16 mm | ||||||
| Planitherm XN 4 mm | ||||||
| Glazing G05 | Planitherm XN 4 mm | 0.52 | 1.35 | 0.78 | 0.43 | 0.65 |
| Argon 16 mm | ||||||
| Planiclear 4 mm | ||||||
| Argon 16 mm | ||||||
| Planitherm ONE 4 mm |
* Taking into account U-edge of window; ** for window 1.5 m × 1.5 m.
Table 4.
Cost data for design variables and options used for the optimization analysis.
| Design Variable | Options | Cost * |
|---|---|---|
| Glazing Type for Window | G10 | 34.4 €/m2 |
| G07 | 64.7 €/m2 | |
| G06 | 53.5 €/m2 | |
| G05 | 57.9 €/m2 | |
| Windows area | Height: 1.5 m | 0 € for all options |
| Width: 0 and 0.75 m–4.25 m with step 0.25 m | ||
| Windows area for RB: 23.25 m2 | ||
| Insulation | ||
| Ground floor: polystyrene (λ = 0.031 W/mK) | 5, 6, 8, 10, 12, 15 cm (thickness) | 51.9 €/m3 |
| External wall: polystyrene (λ = 0.031 W/mK) | 12, 15, 18, 20, 22, 25 cm (thickness) | 46.0 €/m3 |
| Ceiling to unheated attic: mineral wool (λ = 0.038 W/mK) | 20, 22, 25, 28, 30, 35 cm (thickness) | 0.3 €/m2 for 1 cm of thickness |
| Air infiltration level | 0.3, 0.5, 0.7, 1.0 h−1 | 0 € for all options |
| Azimuth (orientation of the building relatively to the north) | 0–337.5 with step 22.5 | 0 € for all options |
| Additionally included the costs of window frame and installation and cost of external wall construction. | ||
* 1 € = ~4.30 PLN.
Table 5.
Optimization cases.
| Case Study | Glazing Type | Windows Area | Insulation | Infiltration | Azimuth |
|---|---|---|---|---|---|
| 1, 1WC | + | ||||
| 2, 2WC | + | + | |||
| 3, 3WC | + | ||||
| 4, 4WC | + | + | |||
| 5, 5WC | + | + | + | ||
| 6, 6WC | + | + | + | + | |
| 7, 7WC | + | + | + | + | + |
Table 6.
Life cycle cost and heating and cooling demand and for reference building. In second line the results for building without cooling (case WC) are presented.
Table 6.
Life cycle cost and heating and cooling demand and for reference building. In second line the results for building without cooling (case WC) are presented.
| LCC, € | Heating Demand, kWh/m2 | Cooling Demand, kWh/m2 |
|---|---|---|
| 11,236 | 69.2 | 7.7 |
| 10,416 | 69.0 | - |
Table 7.
Optimal results for case 1.
| Case | 1 | 1 | 1 | 1 | 1WC | |
|---|---|---|---|---|---|---|
| Type of Glazing | G10 | G07 | G06 | G05 | G07 | |
| Window Area, m2 | W1 | 3.000 | 3.000 | 2.250 | 2.250 | 0 |
| W2 | 0 | 0 | 1.125 | 1.125 | 6.375 | |
| W3 | 6.375 | 6.375 | 6.375 | 6.375 | 6.375 | |
| W4 | 2.250 | 2.250 | 4.125 | 4.125 | 5.625 | |
| W5 | 3.375 | 3.375 | 3.375 | 3.375 | 4.125 | |
| W6 | 0 | 0 | 0 | 0 | 0 | |
| W7 | 3.375 | 3.375 | 3.375 | 3.375 | 4.125 | |
| W8 | 4.125 | 4.125 | 6.375 | 6.375 | 6.375 | |
| W9 | 0 | 0 | 0 | 0 | 0 | |
| Sum of Windows Area, m2 | 22.50 | 22.50 | 27.00 | 27.00 | 33.00 | |
| Sum of Glazing Area, m2 | 15.57 | 15.57 | 18.79 | 18.79 | 23.43 | |
| LCC, € | 10,801 | 10,616 | 10,574 | 10,684 | 9034 | |
| LCC Savings, % | 3.9 | 5.5 | 5.9 | 4.9 | 13.3 | |
| Heating demand, kWh/m2 | 66.8 | 61.1 | 61.8 | 63.3 | 55.5 | |
| Cooling demand, kWh/m2 | 7.5 | 9.5 | 9.1 | 7.0 | - | |
| Total energy savings, % | 3.3 | 8.1 | 7.9 | 8.6 | 19.5 | |
Table 8.
Optimal results for case 2.
| Case | 2 | 2 | 2 | 2 | 2WC | |
|---|---|---|---|---|---|---|
| Type of Glazing | G10 | G07 | G06 | G05 | G07 | |
| Window area, m2 | W1 | 3.000 | 3.000 | 6.375 | 6.375 | 3.000 |
| W2 | 0 | 0 | 0 | 0 | 0 | |
| W3 | 6.375 | 6.375 | 3.000 | 3.000 | 6.375 | |
| W4 | 2.250 | 2.250 | 2.250 | 2.250 | 5.625 | |
| W5 | 3.375 | 3.375 | 5.625 | 5.625 | 5.625 | |
| W6 | 0 | 0 | 0 | 0 | 0 | |
| W7 | 3.375 | 3.375 | 4.125 | 4.125 | 4.875 | |
| W8 | 4.125 | 4.125 | 0 | 0 | 6.375 | |
| W9 | 0 | 0 | 4.125 | 4.125 | 5.625 | |
| Building orientation, deg * | 337.5 | 337.5 | 247.5 | 247.5 | 292.5 | |
| Sum of windows area, m2 | 22.50 | 22.50 | 25.50 | 25.50 | 37.50 | |
| Sum of glazing area, m2 | 15.57 | 15.57 | 17.85 | 17.85 | 26.20 | |
| LCC, € | 10,691 | 10,515 | 10,475 | 10,566 | 8800 | |
| LCC savings, % | 4.9 | 6.4 | 6.8 | 6.0 | 15.5 | |
| Heating demand, kWh/m2 | 65.7 | 59.9 | 61.0 | 62.6 | 52.8 | |
| Cooling demand, kWh/m2 | 8.1 | 10.4 | 9.7 | 7.4 | – | |
| Total energy savings, % | 4.0 | 8.6 | 8.1 | 9.0 | 23.4 | |
* Clockwise.
Table 9.
Optimal results for cases 3 and 4.
| Case | 3 | 4 | 3WC | 4WC | |
|---|---|---|---|---|---|
| Insulation, cm | IEW | 18 | 18 | 20 | 20 |
| IGF | 12 | 12 | 15 | 15 | |
| ICA | 28 | 28 | 30 | 30 | |
| Building Orientation, deg * | - | 337.5 | - | 292.5 | |
| LCC, € | 10,050 | 9989 | 8402 | 8240 | |
| LCC Savings, % | 10.6 | 11.1 | 19.3 | 20.9 | |
| Heating Demand, kWh/m2 | 48.8 | 48.1 | 44.9 | 43.8 | |
| Cooling Demand, kWh/m2 | 14.5 | 14.9 | - | - | |
| Total Energy Savings, % | 17.7 | 18.1 | 34.9 | 36.5 | |
* Clockwise.
Table 10.
Optimal results for cases 5, 6 and 7.
| Case | 5 | 6 | 7 | 5WC | 6WC | 7WC | |
|---|---|---|---|---|---|---|---|
| Type of Glazing | G06 | G05 | G05 | G07 | G07 | G07 | |
| Window Area, m2 | W1 | 0 | 0 | 0 | 0 | 3.000 | 3.000 |
| W2 | 3.000 | 3.000 | 3.000 | 4.125 | 0 | 0 | |
| W3 | 6.375 | 6.375 | 6.375 | 6.375 | 6.375 | 6.375 | |
| W4 | 2.250 | 2.250 | 2.250 | 5.625 | 5.625 | 5.625 | |
| W5 | 2.250 | 2.250 | 2.250 | 4.125 | 5.625 | 5.625 | |
| W6 | 1.500 | 1.500 | 1.500 | 0 | 0 | 0 | |
| W7 | 3.375 | 3.375 | 3.375 | 4.125 | 4.125 | 4.125 | |
| W8 | 3.750 | 3.375 | 3.750 | 6.375 | 6.375 | 6.375 | |
| W9 | 0 | 0 | 0 | 0 | 0 | 0 | |
| Building Orientation, deg * | - | 337.5 | 337.5 | - | 315.0 | 292.5 | |
| Insulation, cm | IEW | 18 | 18 | 18 | 18 | 18 | 18 |
| IGF | 12 | 10 | 12 | 15 | 15 | 15 | |
| ICA | 28 | 28 | 28 | 28 | 28 | 28 | |
| Infiltration, h−1 | - | - | 0.3 | - | - | 0.3 | |
| Sum of Windows Area, m2 | 22.50 | 22.50 | 22.13 | 30.75 | 31.13 | 31.13 | |
| Sum of Glazing Area, m2 | 15.48 | 15.48 | 15.17 | 21.78 | 21.87 | 21.87 | |
| LCC, € | 9417 | 9363 | 7390 | 7266 | 7110 | 5093 | |
| LCC savings, % | 16.2 | 16.7 | 34.2 | 30.2 | 31.7 | 51.1 | |
| Heating demand, kWh/m2 | 43.3 | 43.9 | 30.5 | 34.8 | 33.6 | 20.2 | |
| Cooling demand, kWh/m2 | 14.0 | 11.9 | 13.9 | – | – | – | |
| Total energy savings, % | 25.5 | 27.5 | 42.3 | 49.6 | 51.3 | 70.7 | |
* Clockwise.
Table 11.
Life cycle cost savings in optimized cases of the building with heating and cooling systems.
Table 11.
Life cycle cost savings in optimized cases of the building with heating and cooling systems.
| Case | RB | 1 | 2 | 3 | 4 | 5 | 6 | 7 | |
|---|---|---|---|---|---|---|---|---|---|
| Type of Glazing | G10 | G06 | G06 | G10 | G10 | G06 | G05 | G05 | |
| Sum of windows area, m2 | 23.25 | 27.00 | 25.50 | 23.25 | 23.25 | 22.50 | 22.50 | 22.13 | |
| South-facing windows, % | 32 | 63 | 54 | 32 | 32 | 53 | 55 | 56 | |
| Building orientation, deg * | 0 | 0 | 247.5 | 0 | 337.5 | 0 | 337.5 | 337.5 | |
| Insulation, cm | IEW | 12 | 12 | 12 | 18 | 18 | 18 | 18 | 18 |
| IGF | 5 | 5 | 5 | 12 | 12 | 10 | 12 | 12 | |
| ICA | 20 | 20 | 20 | 28 | 28 | 28 | 28 | 28 | |
| Infiltration, h−1 | 0.5 | 0.5 | 0.5 | 0.5 | 0.5 | 0.5 | 0.5 | 0.3 | |
| LCC savings, € | 0 | 663 | 761 | 1187 | 1247 | 1820 | 1873 | 3846 | |
| LCC savings, % | 0 | 5.9 | 6.8 | 10.6 | 11.1 | 16.2 | 16.7 | 34.2 | |
* Clockwise.
© 2017 by the authors. Licensee MDPI, Basel, Switzerland. This article is an open access article distributed under the terms and conditions of the Creative Commons Attribution (CC BY) license (http://creativecommons.org/licenses/by/4.0/).
Share and Cite
MDPI and ACS Style
Ferdyn-Grygierek, J.; Grygierek, K. Multi-Variable Optimization of Building Thermal Design Using Genetic Algorithms. Energies 2017, 10, 1570. https://doi.org/10.3390/en10101570
AMA Style
Ferdyn-Grygierek J, Grygierek K. Multi-Variable Optimization of Building Thermal Design Using Genetic Algorithms. Energies. 2017; 10(10):1570. https://doi.org/10.3390/en10101570
Chicago/Turabian StyleFerdyn-Grygierek, Joanna, and Krzysztof Grygierek. 2017. "Multi-Variable Optimization of Building Thermal Design Using Genetic Algorithms" Energies 10, no. 10: 1570. https://doi.org/10.3390/en10101570
Note that from the first issue of 2016, this journal uses article numbers instead of page numbers. See further details here.