
Natural Contamination and Surface Flashover on Silicone Rubber Surface under Haze–Fog Environment


1
Department of Electrical Engineering, Shandong University, Jinan 250061, China
2
Shandong Provincial Key laboratory of UHV Transmission Technology and Equipments, #17923 Jingshi Road, Jinan 250061, China
*
Author to whom correspondence should be addressed.
Energies 2017, 10(10), 1580; https://doi.org/10.3390/en10101580
Submission received: 18 September 2017
/
Revised: 9 October 2017
/
Accepted: 9 October 2017
/
Published: 12 October 2017
(This article belongs to the Section F: Electrical Engineering)
Abstract
:Anti-pollution flashover of insulator is important for power systems. In recent years, haze-fog weather occurs frequently, which makes discharge occurs easily on the insulator surface and accelerates insulation aging of insulator. In order to study the influence of haze-fog on the surface discharge of room temperature vulcanized silicone rubber, an artificial haze-fog lab was established. Based on four consecutive years of insulator contamination accumulation and atmospheric sampling in haze-fog environment, the contamination configuration appropriate for RTV-coated surface discharge test under simulation environment of haze-fog was put forward. ANSYS Maxwell was used to analyze the influence of room temperature vulcanized silicone rubber surface attachments on electric field distribution. The changes of droplet on the polluted room temperature vulcanized silicone rubber surface and the corresponding surface flashover voltage under alternating current (AC), direct current (DC) positive polar (+), and DC negative polar (−) power source were recorded by a high speed camera. The results are as follows: The main ion components from haze-fog atmospheric particles are NO3−, SO42−, NH4+, and Ca2+. In haze-fog environment, both the equivalent salt deposit density (ESDD) and non-soluble deposit density (NSDD) of insulators are higher than that under general environment. The amount of large particles on the AC transmission line is greater than that of the DC transmission line. The influence of DC polarity power source on the distribution of contamination particle size is not significant. After the deposition of haze-fog, the local conductivity of the room temperature vulcanized silicone rubber surface increased, which caused the flashover voltage reduce. Discharge is liable to occur at the triple junction point of droplet, air, and room temperature vulcanized silicone rubber surface. After the deformation or movement of droplets, a new triple junction point would be formed, which would seriously reduce the dielectric strength of room temperature vulcanized silicone rubber.
1. Introduction
Insulator flashover accident is one of the important influencing factors to the safety and stability of power grid. Since 2013, haze-fog appears in a large area of China, India, Malaysia, and other developing countries. Haze-fog increases the equivalent salt deposit density (ESDD) and non-soluble deposit density (NSDD) on the surface of insulator, which would reduce the pollution flashover voltage and pose a threat to the power system [1,2].
The haze-fog is a mixture of haze and fog, but the difference between haze and fog is great. Haze is composed of dust, sulfuric acid, nitric acid, organic hydrocarbons, and other particles in the air. Fog is an aerosol system consisting of a large number of tiny droplets or ice crystals suspended in near-surface air [3]. The occurrence of flashover under haze-fog environment is related with insulator pollution degree, haze component, haze particle size, fog-water conductivity, and so on. It is even more complicated than other pollution flashover [4,5,6,7,8]. Guo et al. proposed that the fog-water conductivity is the key parameter to characterize the effect of the haze-fog on the outdoor insulation performance. With the fog-water conductivity increasing from 25.3 to 3000 μS/cm, the flashover voltage may decrease up to 27.5% [2]. Arshad et al. proved that Arc inception and flashover voltages decreased by 50% and 52%, respectively, as the value of ESDD was changed from 0.035 to 0.4 mg/cm2 [9]. Studies found that silicone rubber surface attached with the droplets will lead to electric field distortion. Consequently, the initial discharge voltage of the corona is decreased and the life of insulating materials is shortened. Joneidi et al. simulated the electric field of 20 kV composite insulators with Comsol. With the influence of droplets, the electric field intensity is basically maintained at 0.1 kV/mm. The electric field intensity floats in the range of 0.01–0.24 kV/mm without the influence of droplets [10]. Souza studied the effect of droplet conductivity on corona initial voltage. With the increase of conductivity, the initial discharge voltage is reduced by an average of 30%. Besides, it is believed that for composite insulators, corona discharge is easier to occur in humid and polluted environments [11]. Xie et al. proposed that the initial discharge voltage and the temperature variations for two salt droplets closely correlated with the ionization degree of the salt, as well as the interfacial electrochemical reactions near the electrodes [12]. Li et al. proved that when applying a tangential electric field, water droplet on super hydrophobic surface tended to a self-propelled motion while it tended to elongate and break up on Room Temperature Vulcanized (RTV) silicone rubber surface [13]. However, the characteristics of the deposition on the RTV surface of transmission lines in the haze-fog environment are still unknown. The flashover performance of silicone rubber surface under haze-fog environment also needs to be studied in further.
In this paper, the conditions of contamination and atmosphere for the insulators coated with RTV in transmission lines were sampled in the spring of year 2014–2017. ESDD, NSDD, contaminant particle size and fog contained inorganic ions were obtained from the field sampling data. Ansys Maxwell was used to analyze the influence of the droplets on the electrical filed strength of coated surface. Finally, by a high speed camera, the changes of the droplet attached on the surface of contaminated silicone rubber and the corresponding flashover voltage were recorded in AC field and positive (negative) polarity DC field, respectively. The research results may provide a reference for the study of the surface discharge characteristics of silicone rubber in haze-fog environment.
2. Onsite Measurements and Experimental Setup
2.1. Atmospheric Sample Collection
PM2.5 and PM10 are the main parameters of haze-fog. PM2.5 and PM10 refers to the particles with a kinetic diameter less than or equal to 2.5 μm and 10 μm, respectively [14]. The atmospheric particle flow sampler TH-150 was used to sample PM2.5 and PM10. The horizontal sampling distance from the tower is no more than 100 m, and the average sampling rate is 100 L/min.
2.2. Natural Contamination Test
In the spring of year 2014–2017, natural pollution test was carried out on the RTV-coated suspension insulators in the HVDC and HVAC transmission lines of Shandong province where annual average ground-level PM2.5 at 60–90 μg/m3 [15,16].
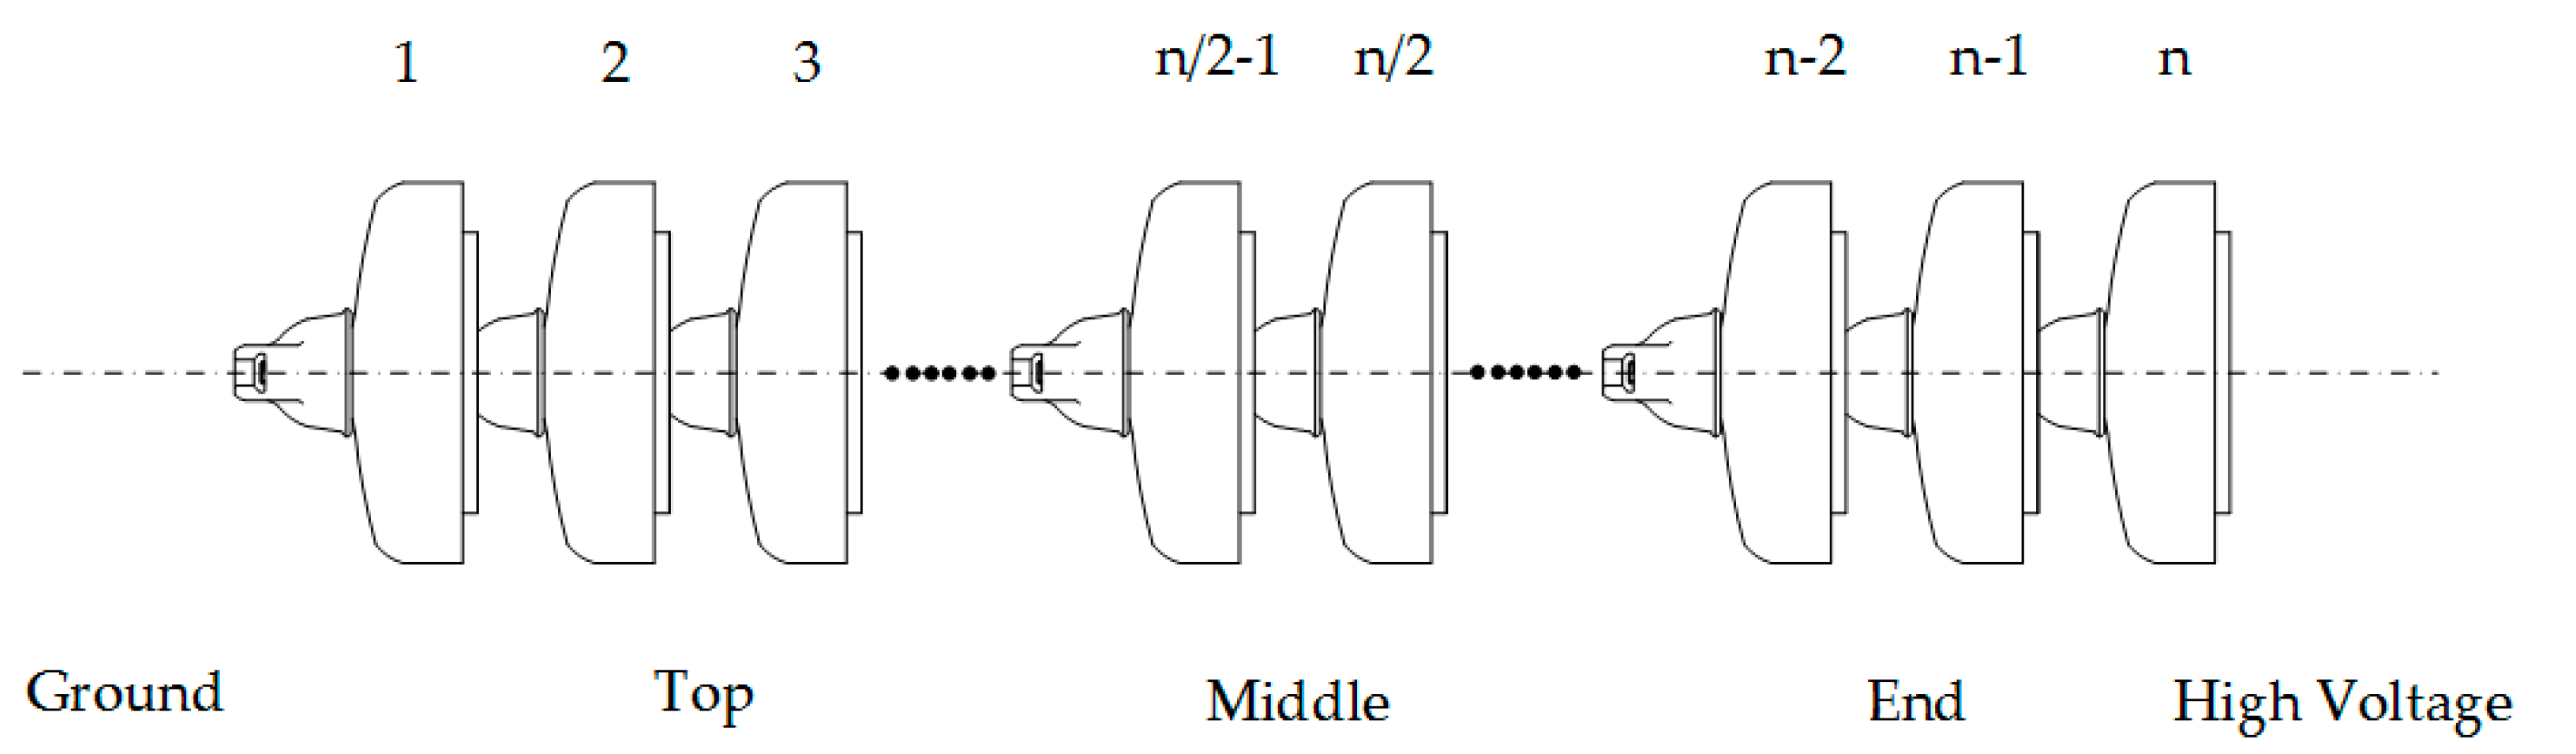
The parameters of the suspension insulators are shown in Table 1. As the contamination degree of the insulators is not uniform [17], each insulator string is numbered from 1 to n according to its potential. The sampling diagram of suspension insulators is shown in Figure 1.
In order to reduce the measurement error, the insulators were removed to the ground, using non–woven (with a small amount of ethanol solution) to wipe all of the contamination [18]. The method introduced in [19] was used to measure the ESDD, NSDD of each insulator. Using the remaining dry samples after NSDD test, the anions and cations in the sample were analyzed by ion chromatography [20].
2.3. Experiment Facilities and Procedure
A test chamber was set up for simulating the haze-fog artificially. When considering the relative humidity, fog conductivity, and the surface-attached particle size, the realistic haze-fog environment was simulated. Then, the influence of various factors on the surface discharge characteristics of the RTV coating was analyzed.
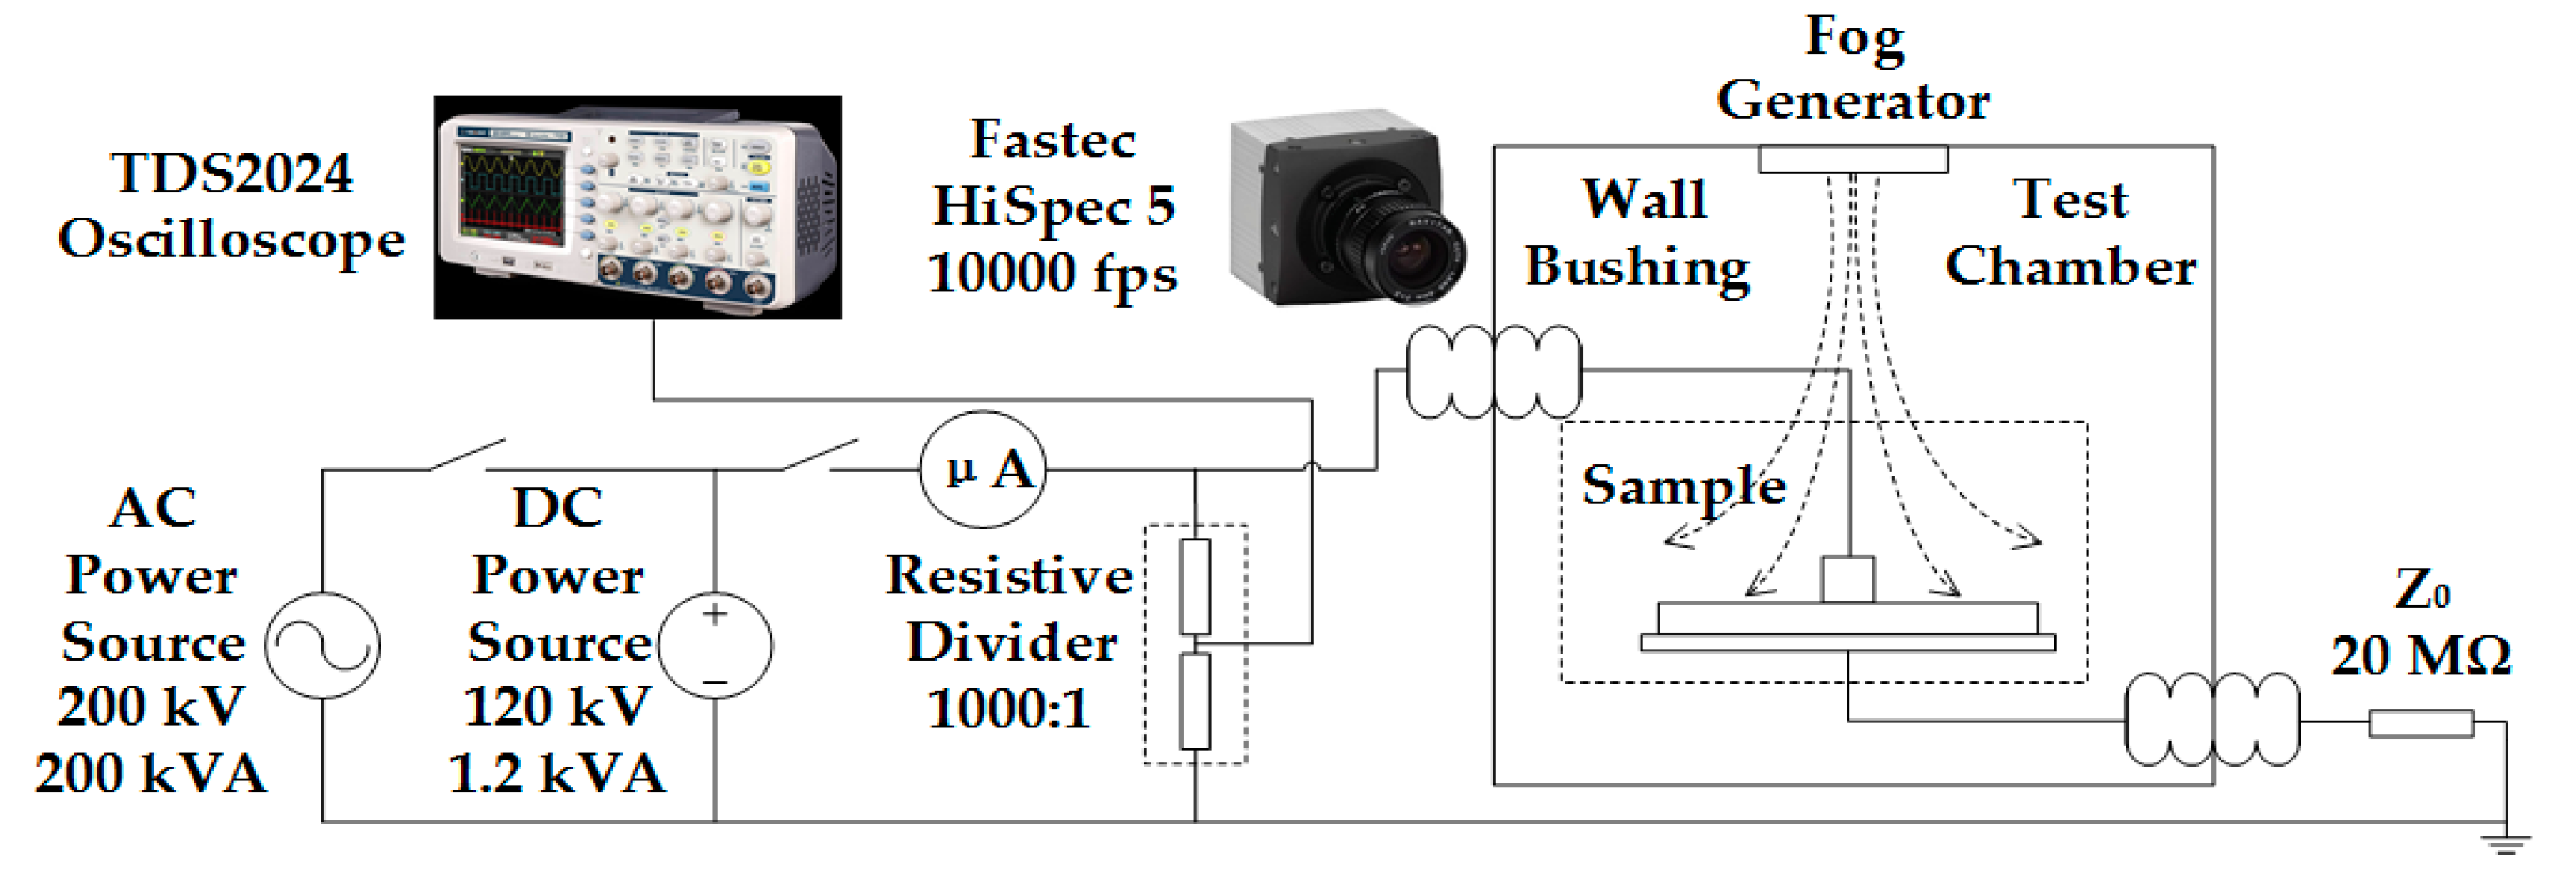
The test circuit of surface discharge is shown in Figure 2. The rated capacity, rated current, and output voltage of AC high voltage source is 200 kVA, 1 A and 0–150 kV, respectively. The rated capacity, rated current, and output voltage of DC high voltage source is 1.2 kVA, 10 mA, and 0–120 kV, respectively. The divider ratio of capacitance-resistance divider is 1000:1. The leakage current is recorded by a microamp ammeter. A 20 MΩ protection resistor is connected to the sample externally. The salt solution of different components was added to the fog generator to simulate the salt fog of the different salt components. Since the particle sizes of kieselguhr are not uniform [2] and the particles are irregular in shape, in order to better simulate the contamination characteristics in haze-fog environment, SiO2 is proposed to replace kieselguhr for simulating the NSDD with different particle size. By switching-on and off different source circuit-breakers, the surface discharge test could be performed under AC power source or positive (negative) polarity DC power source.
The discharge model of RTV-coated surface is shown in Figure 3. The high voltage electrode is made of copper and cylinder-shape, which is fully in touch with the test RTV-coated plate. This model uses coaxial cylinders, which is consistent with the actual electric field distribution of insulator. The fog is ejected from the center of the plate, which could solve the problem of uneven moisture distribution on the RTV-coated surface. The discharge model is totally set in a hermetic chamber, which is made of high transparency plexiglass, to ensure that the discharge process could be recorded clearly. The thickness of RTV coating is d = 2 mm. The creepage distance are r = 1, 2, 5 cm on the plate, respectively. The applied voltage was increased uniformly with a speed of 1 kV/s [21,22].
3. Natural Contamination Results
3.1. Inorganic Ion Data
The analysis of water-soluble inorganic ions from haze-fog atmospheric particles includes five kinds of cations: Na+, NH4+, K+, Mg2+, Ca2+, and three kinds of anions: NO3−, SO42−, Cl−. The concentrations of water-soluble inorganic ions from atmospheric particles are counted as shown in Table 2.
It can be seen from Table 2 that the concentration of water-soluble ions from PM2.5 can be arranged from large to small as NH4+ > NO3− > SO42− > Ca2+ > Cl− > K+ > Na+ > Mg+. The secondary ions (NH4+, NO3−, and SO42−) account for 29.16%, 28.18%, and 23.19% of the total water-soluble ions, respectively, together account for 80.53% of the total water-soluble ions. Primary ions account for 19.47% of the total water-soluble ions. The concentration of water-soluble ions from PM10 can be arranged from large to small as NO3− > SO42− > NH4+ > Ca2+ > Cl− > K+ > Na+ > Mg2+. The secondary ions (NO3−, SO42−, and NH4+) account for 33.98%, 32.57%, 11.15% of the total water-soluble ions, respectively, together account for 77.70% of the total water-soluble ions. Primary ions account for 22.3% of the total water-soluble ions. From the proportion of NO3−, SO42, NH4+, and Ca2+ from PM10 and PM2.5, it can be seen that they could together account for over 70% of the total water-soluble ions, which illustrates that these three kinds of ions are the main water-soluble ions from the sampled atmospheric particles.
3.2. Particle Size of Contamination
The particle size of the contamination are shown in Table 3, where D50 refers to the particle size corresponding to the 50% cumulative probability distribution, P<3 refers to the cumulative probability of the particle size smaller than 3 μm.
It can be seen from Table 3 that in haze-fog environment, the average D90 of contamination particles in DC(+), DC(−), and AC are 34.41 μm, 33.37 μm, and 57.88 μm, respectively. In HVDC transmission lines, regardless of the polarity, most of the contamination particle sizes on insulators are less than 35 μm, however, the contamination particle sizes on insulators in HVAC transmission lines are 65% larger than that in HVDC transmission lines. According to the D50 shown in Table 3, the average particle size of contamination on DC transmission line is about 13 μm, and 34 μm on AC transmission lines, the average contamination particle sizes of AC are generally larger than that of DC transmission lines.
In the range of 0–3 μm, the P<3 of DC(+), DC(−) and AC are 2.56%, 2.88% and 2.25% respectively. The amount of particles whose size is less than 3 μm in DC(−) transmission lines is more than that in DC(+) transmission lines and AC transmission lines. It is easier for negative polar DC transmission lines to accumulate the contamination with small particles. As to the cumulative probability of the particle size less than 40 μm, the average P < 40 of the contamination in DC(+), DC(−) and AC are 93.90%, 94.25% and 84.35%, respectively. The amount of the large particles whose size is in the range of 20–40 μm in AC transmission lines is more than that in DC transmission lines. The polarity of DC transmission lines has no significant influence on the distribution of contamination particle size.
3.3. ESDD and NSDD
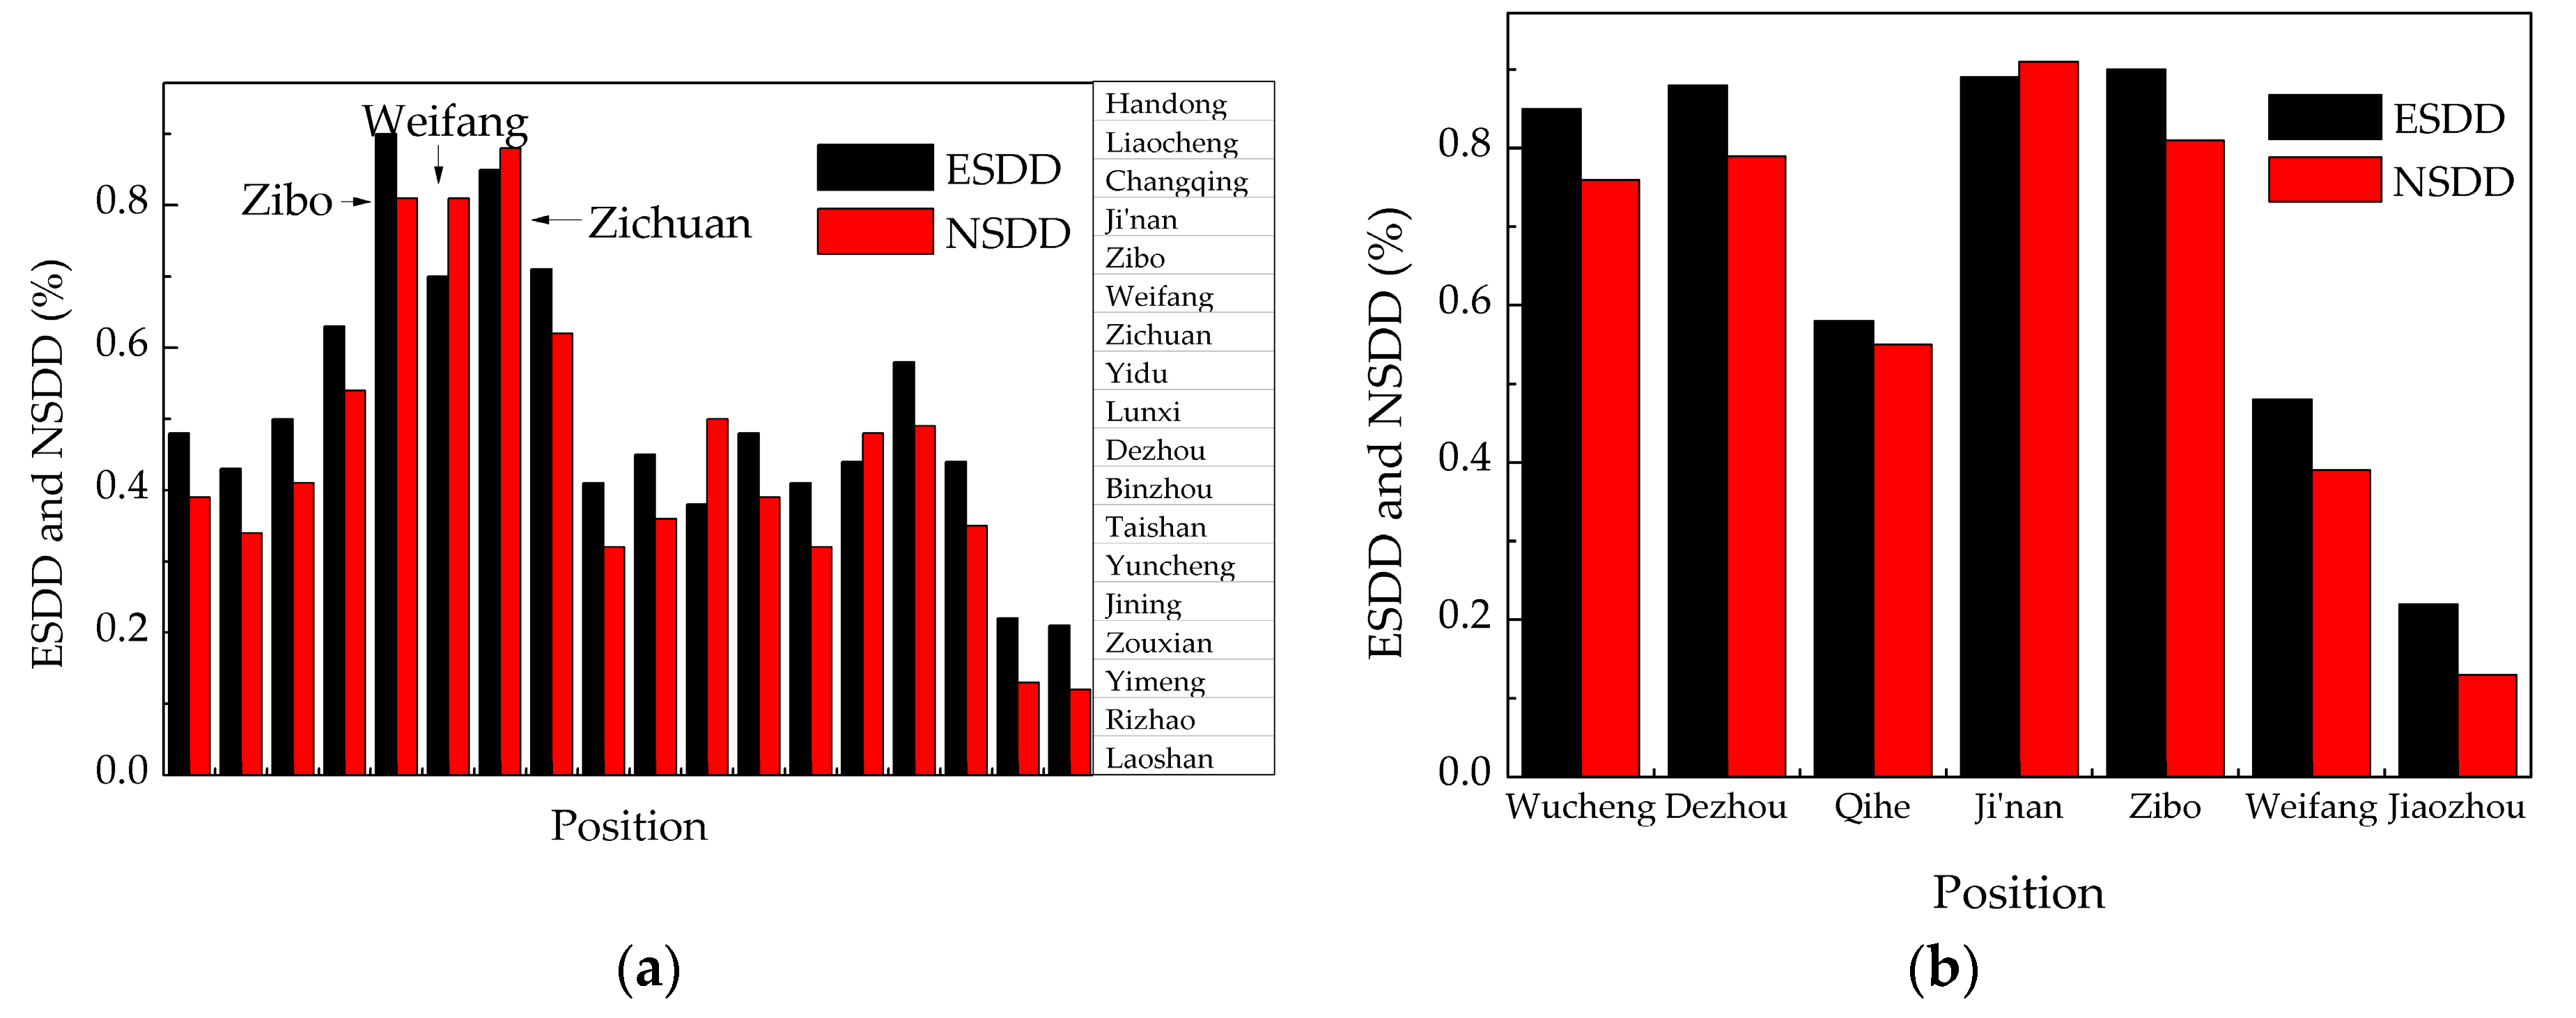
A sampling point was set in each city (district) crossed by the transmission lines, and the sampling distribution is shown in Figure 4. The site sampling is shown in Figure 5, A are insulator strings, B are disassemble crews, and C are site sampling crews. The whole sampling process includes: 1. Determine the position of the insulator, 2. Remove the insulators to the ground, 3. Sample the contamination on the insulator surface on site.
The contamination accumulation results of 2014 and 2015 are averaged, the mean value of each sampling point is divided by the maximum value of all sampling points, and the percentage distribution diagram of contamination can be drawn as shown in Figure 6. It can be seen from Figure 6a that Zibo, Weifang, and Zichuan are three serious pollution areas. It can also be seen from Figure 6b that Dezhou, Jinan, and Zibo, which are crossed by DC transmission lines, are three serious pollution areas. Thus, the above six sites are selected as the research areas to do the sampling in 2016 and 2017.
The contamination accumulation results in four years are investigated. The total amount of sampling towers is 53 and the total amount of valid samples is 379. At Jinan, Zibo, and Zichuan, 149 samples are obtained from 21 towers on AC transmission lines. At Dezhou, Jinan and Zibo, 230 samples are obtained from 32 towers on DC transmission lines.
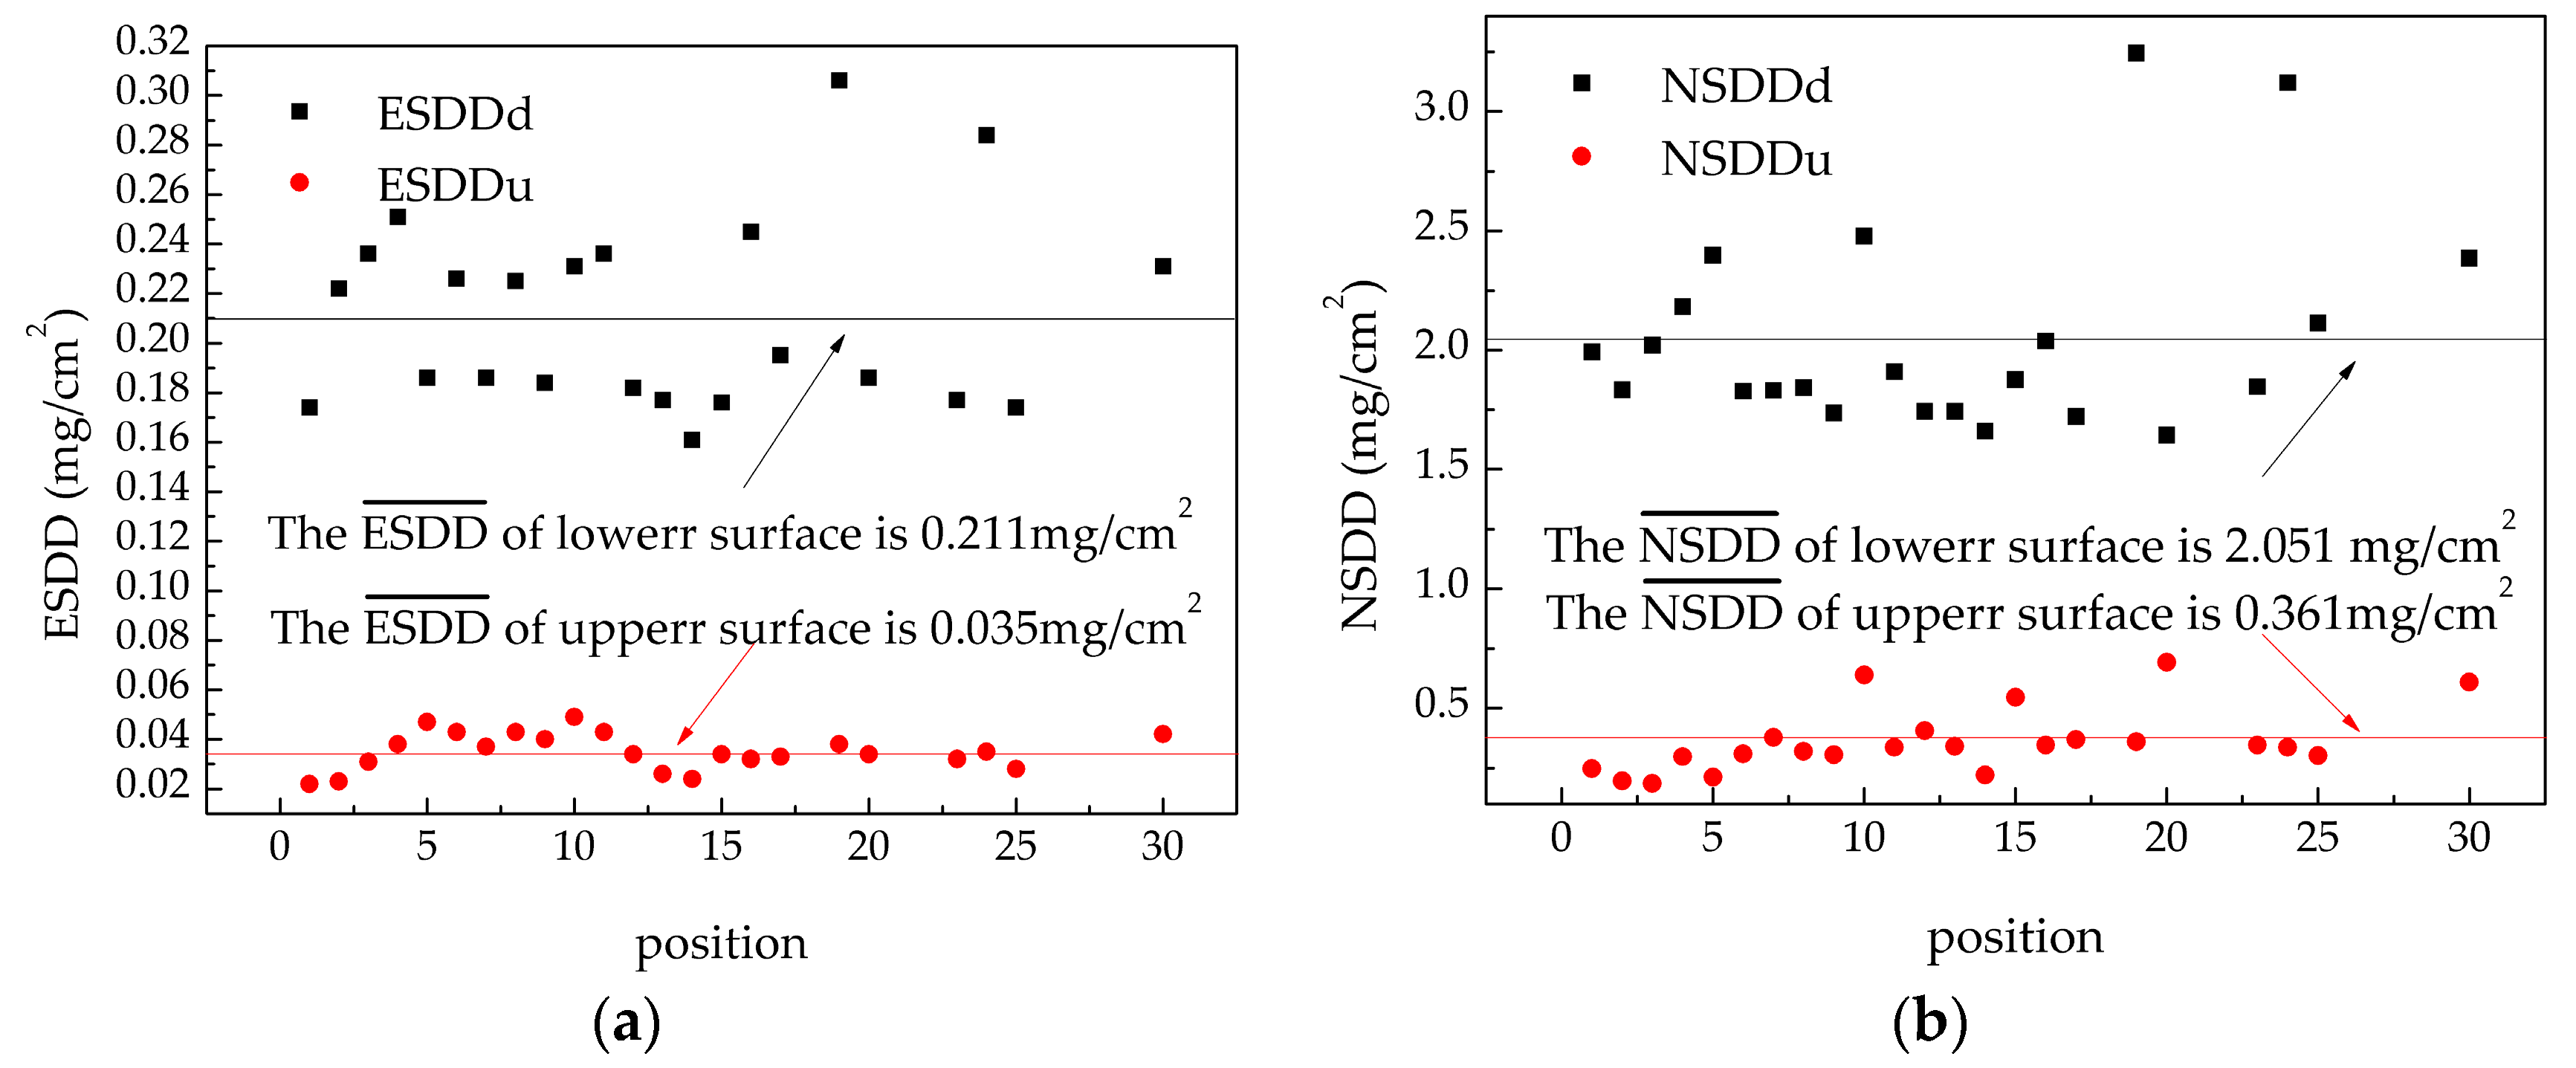
The ESDD and NSDD of the insulators in the positive polar of DC transmission line are shown in Figure 7a,b.
It can be seen from the figures that there is obvious difference in the contamination accumulation between the upper and lower surfaces of the insulators. The average ESDD and NSDD of the upper surface are 0.035 mg/cm2 and 0.361 mg/cm2, respectively; the average ESDD and NSDD of the lower surface are 0.211 mg/cm2 and 2.052 mg/cm2, respectively. Thus, the contamination accumulation condition of the lower surface of insulator is more serious than that of the upper surface in haze-fog environment. When considering the unevenness of contamination accumulation, the standard deviation of ESDD and NSDD of the upper surface are 0.007 mg/cm2 and 0.138 mg/cm2, respectively, the standard deviation of ESDD and NSDD of the lower surface are 0.038 mg/cm2 and 0.426 mg/cm2, respectively. Thus, the unevenness degree of NSDD is much greater than that of ESDD in haze-fog environment.
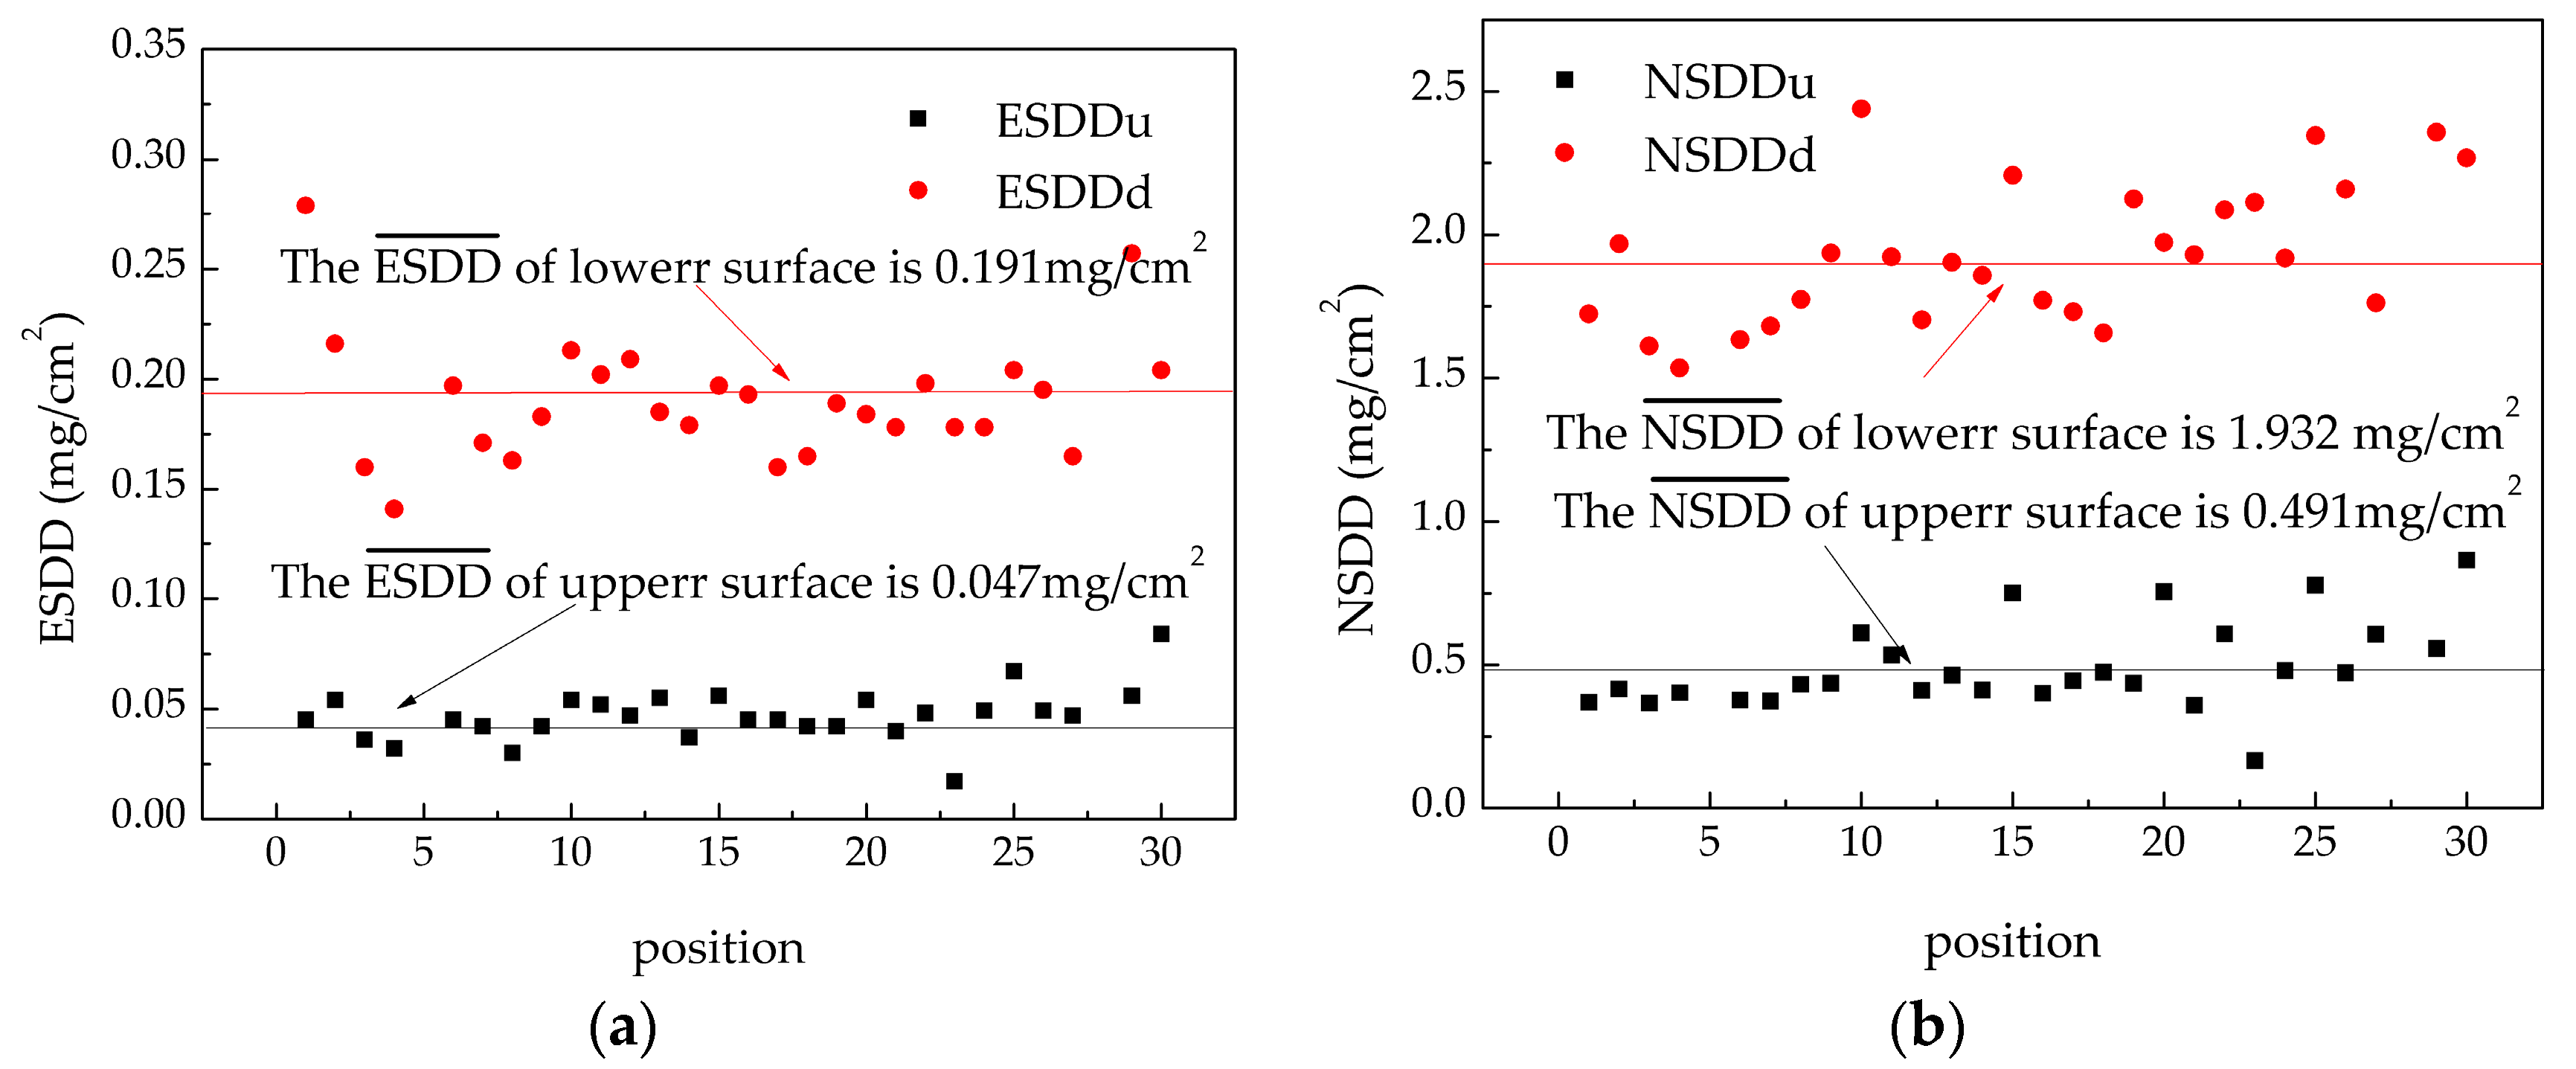
The ESDD and NSDD of the insulators in the negative polar of DC transmission line are shown in Figure 8a,b. The average ESDD and NSDD of the upper surface are 0.047 mg/cm2 and 0.491 mg/cm2 respectively, the average ESDD and NSDD of the lower surface are 0.191 mg/cm2 and 1.932 mg/cm2, respectively. The standard deviation of ESDD and NSDD of the upper surface are 0.012 and 0.153, respectively, the standard deviation of ESDD and NSDD of the lower surface are 0.028 and 0.248, respectively. By comparing the results from positive and negative polarity of DC transmission line, it can be seen that in haze-fog environment, although the polarity has no significant influence on the contamination accumulation of insulators, the contamination accumulation on the insulator of negative polarity of DC transmission line is more uniform.
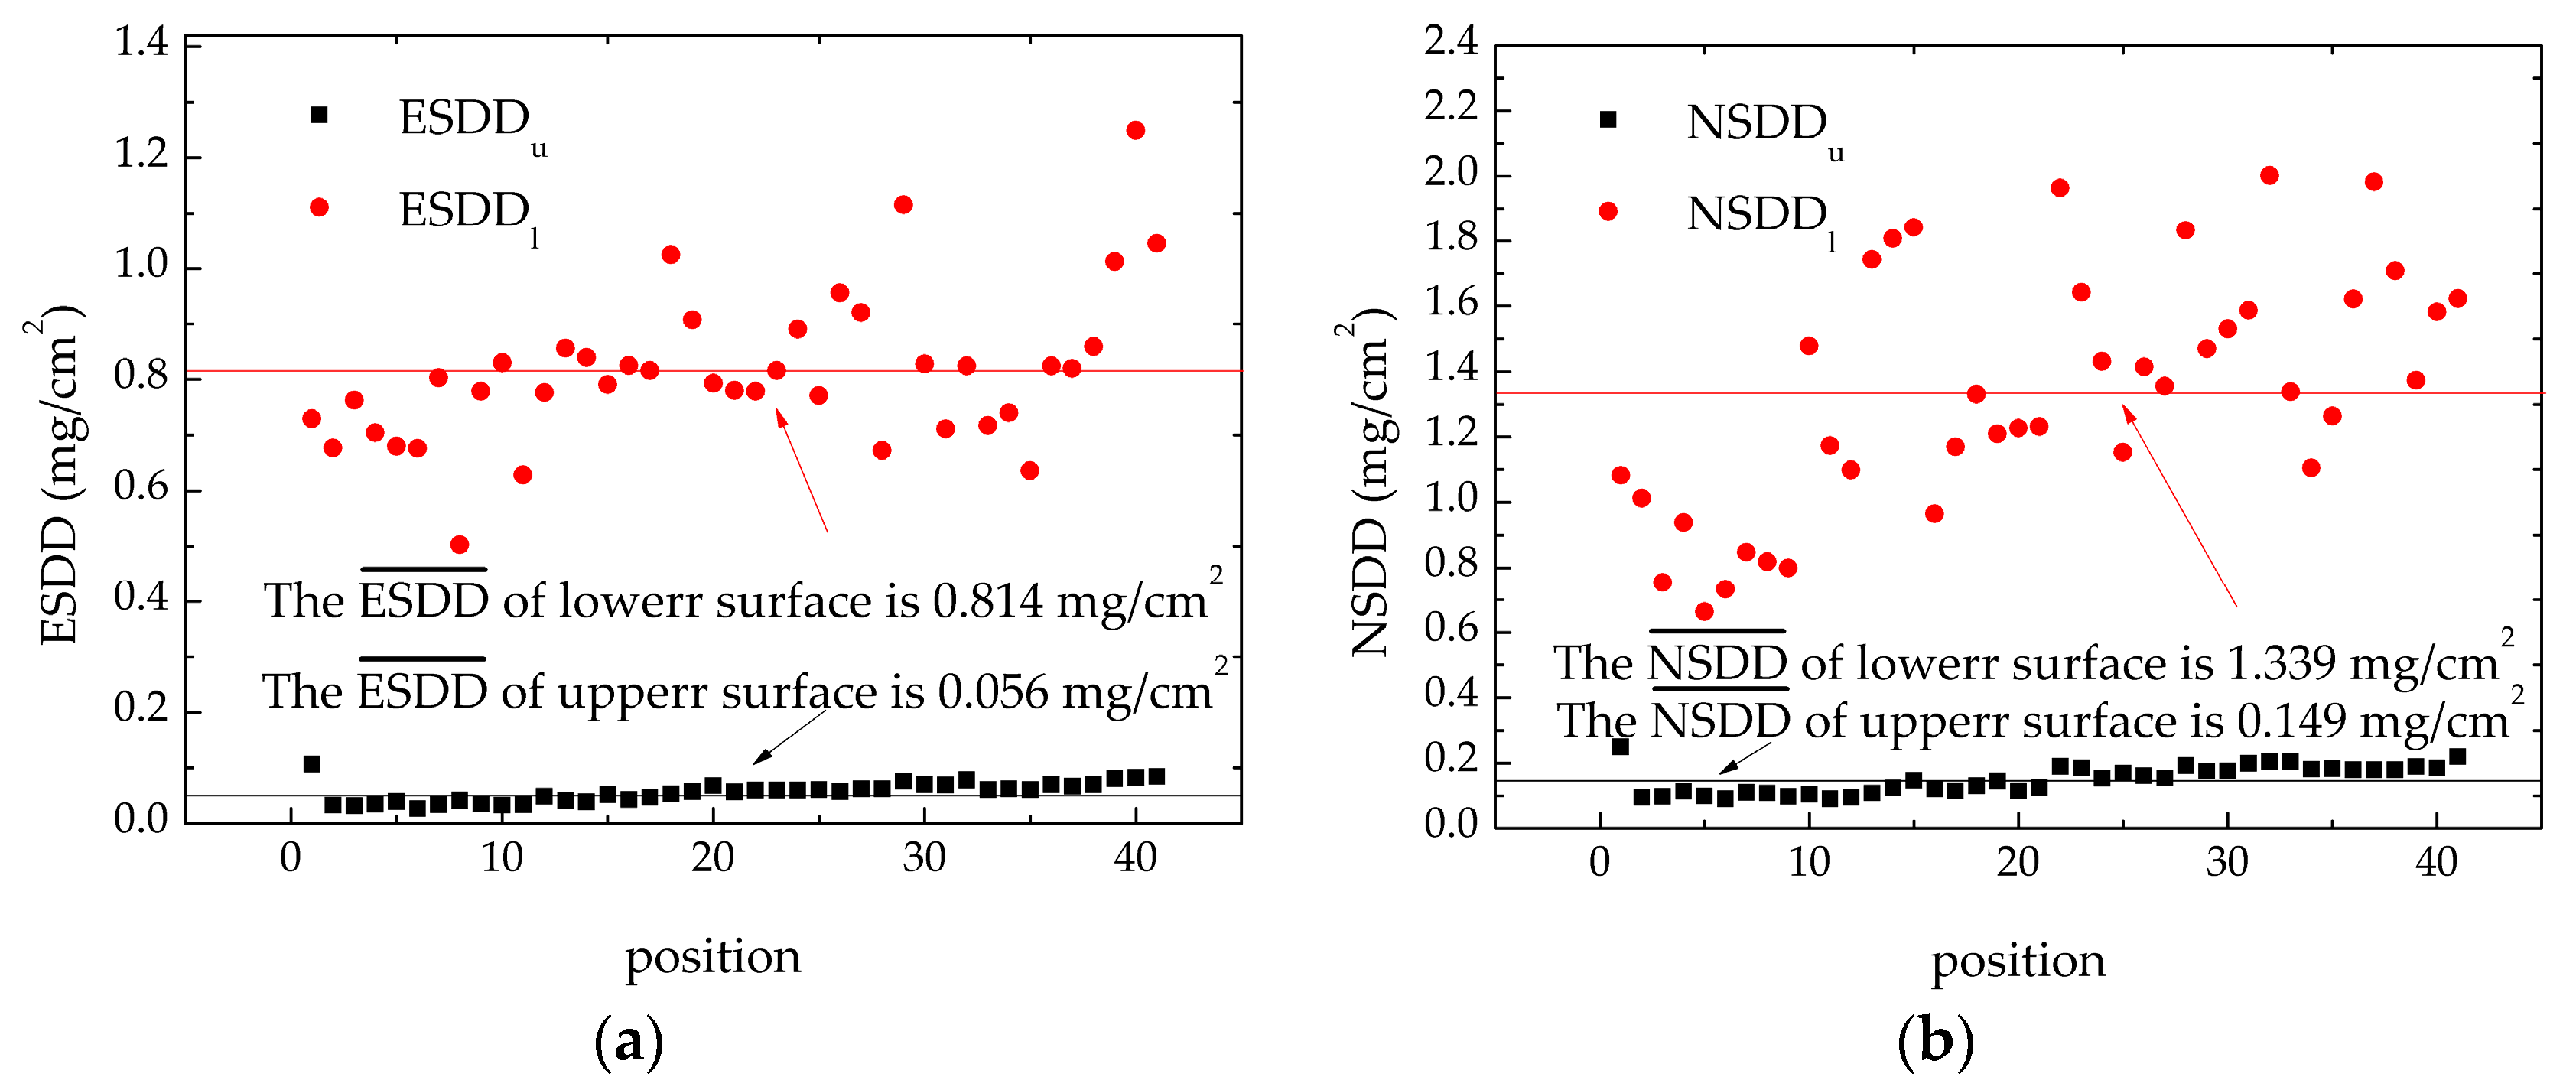
It can be seen from Figure 9a that the contamination accumulation characteristics of the insulator on AC transmission lines are similar to that on DC transmission lines. The average ESDD and NSDD of the upper surface are 0.056 mg/cm2 and 0.149 mg/cm2, respectively; the average ESDD and NSDD of the lower surface are 0.814 mg/cm2 and 1.339 mg/cm2, respectively. The standard deviation of ESDD and NSDD of the upper surface are 0.012 and 0.159, respectively, the standard deviation of ESDD and NSDD of the lower surface are 0.034 and 0.342, respectively. It is obvious that it is easier for the lower surface to accumulate contamination, and the NSDD of the lower surface is more dispersive.
The average ESDD and NSDD and the standard deviation of the upper surface and lower surfaces of the insulators are calculated, as shown in Table 4. Previous studies have shown that, in the general environment, the ESDD of insulators coated with RTV range from 0.006 to 0.014 mg/cm2, and the NSDD are range from 0.059 to 0.323 mg/cm2 [23,24]. When comparing Figure 7, Figure 8 and Figure 9 and Table 4, the conclusions of insulator contamination accumulation in haze-fog environment can be drawn: Firstly, ESDD and NSDD under haze-fog are higher than that in general environment, the of DC(+), DC(−) and AC are 0.141 mg/cm2, 0.133 mg/cm2 and 0.111 mg/cm2, respectively, the of DC(+), DC(−) and AC are 1.376 mg/cm2, 1.356 mg/cm2 and 1.124 mg/cm2, respectively. Secondly, it is easier for DC transmission lines to accumulate contamination than the AC transmission lines, which is quite obvious in the contamination accumulation characteristics of lower surface. Finally, the average NSDD of the lower surface of the insulators on AC transmission lines is approximately two times larger than that of DC transmission lines, but the ESDD of them are basically the same.
3.4. The Simulation of Haze-Fog
The composition of contamination under haze-fog environment is different from the general environment through the above statistical analysis. In order to better simulate the haze-fog environment, the soluble substances are prepared, according to Formula (1)–(4) [19], by NH4NO3, and CaSO4. The names and units of the variables in the formulas are conductivity (μS/cm), solution temperature θ (°C), volume V (cm3), and surface area A (cm2).
SiO2 is used to simulate the insoluble substance with different particle sizes. Through calculation, the contamination parameters of surface pollution flashover test are shown in Table 5.
4. Surface Flashover Analysis
In this chapter, the experimental results in 3.4 are compared with conventional NaCl and kieselguhr simulated contamination [19]. ANSYS-MAXWELL was used to analyze the electric field distribution of the discharge model as shown in Figures 12 and 13. The influence of gravels and droplets on the electric field distortion of RTV coating was studied. The droplets were added on the surface of RTV coating, and the dynamic characteristics of the droplets under different kinds of power source were observed.
4.1. Comparison with Conventional Pollution Flashover Test
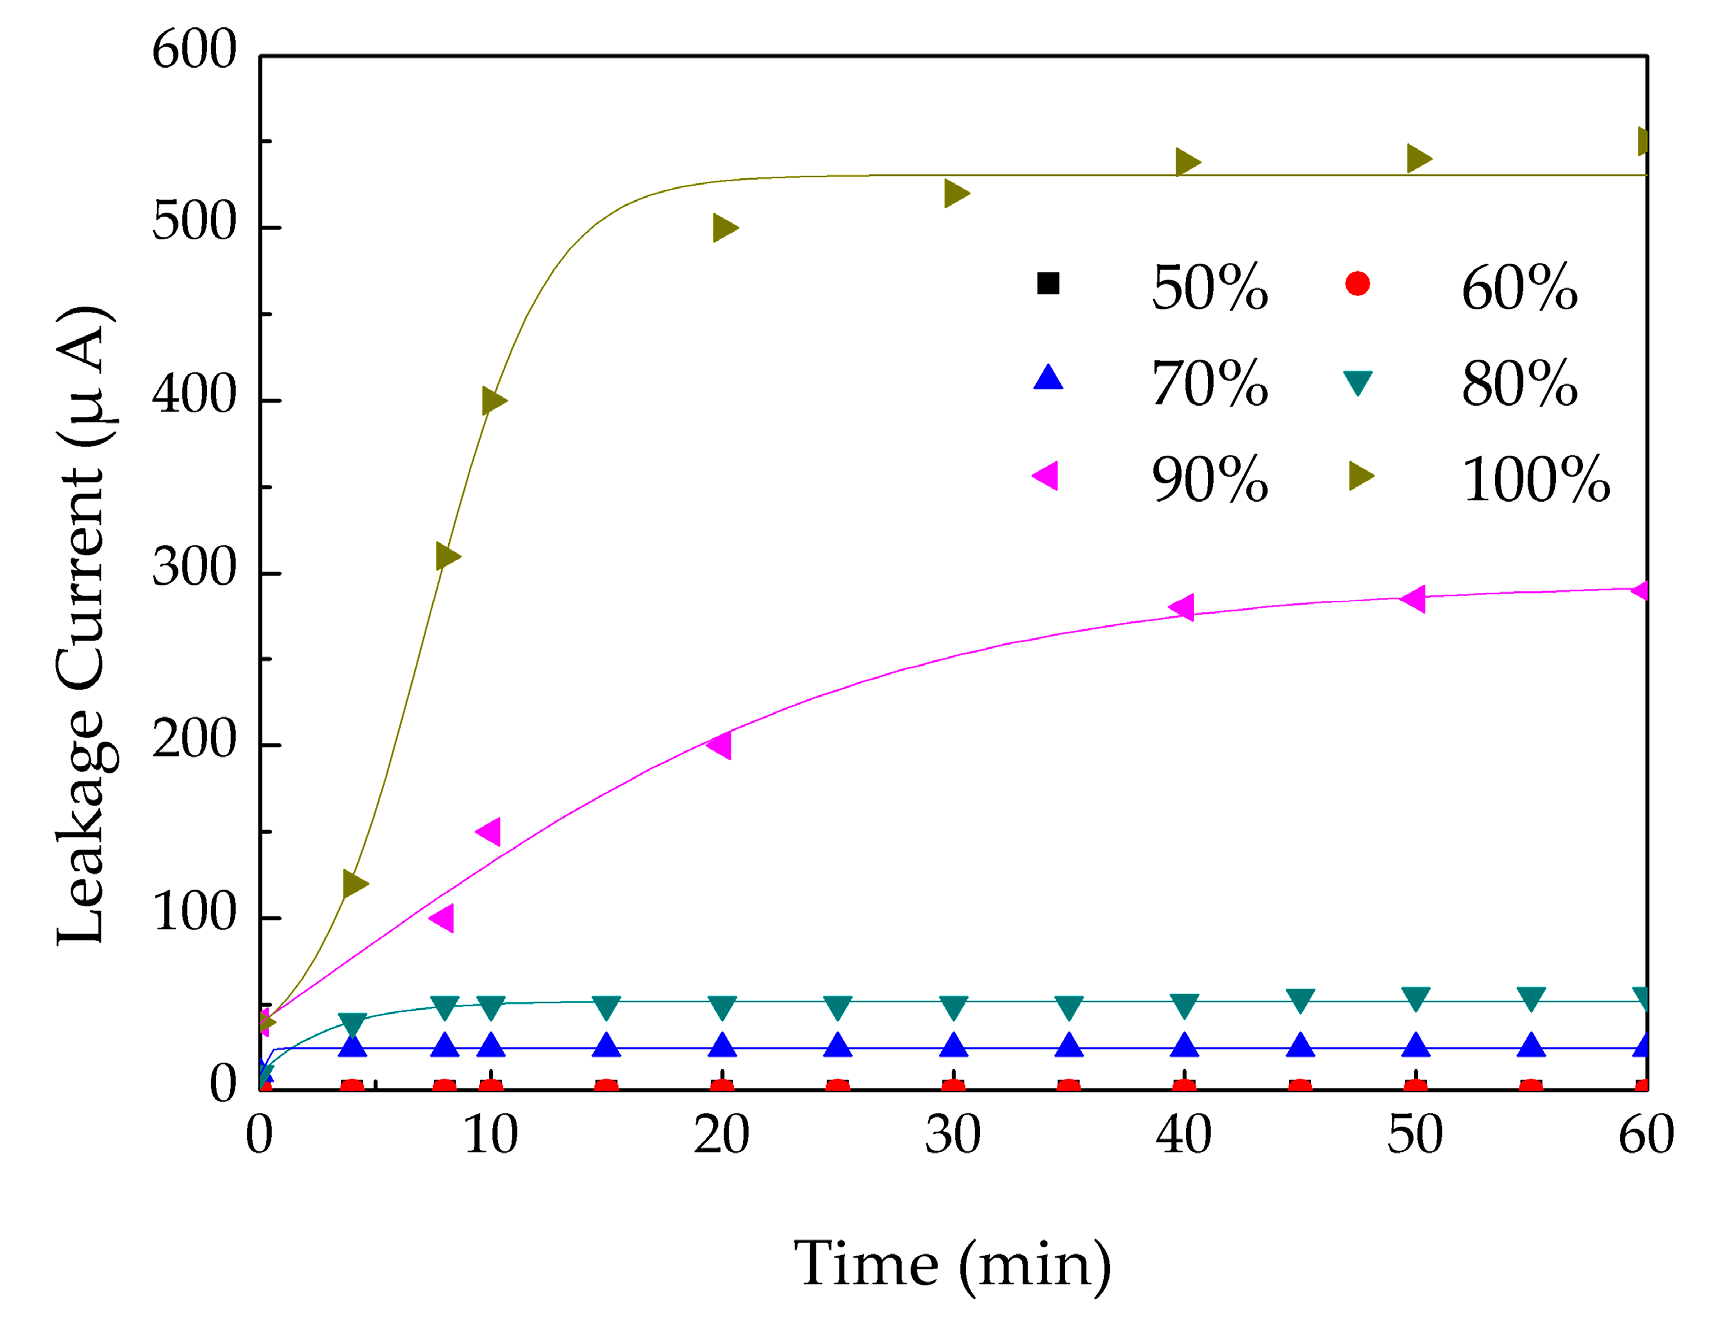
When fogging up, the voltage of 1.2 kV was applied on the tested sample and the trend of leakage current was recorded in different relative humidity. Two preconditions should be met before performing the flashover test: (1) The pollution layer of all the samples (different relative humidity) should be fully wet; and, (2) The suspended particles in haze-fog environment affecting all of the pollution layers should be the same. It can be seen from Figure 10 that when the wetting time is longer than 40 min, the above two preconditions could be fully met. Therefore, the wetting time is assumed with 40 min for the flashover test in this paper. The HiSpec 5 high speed camera is used for shooting. The temperature during the test is constant at about 25 °C.
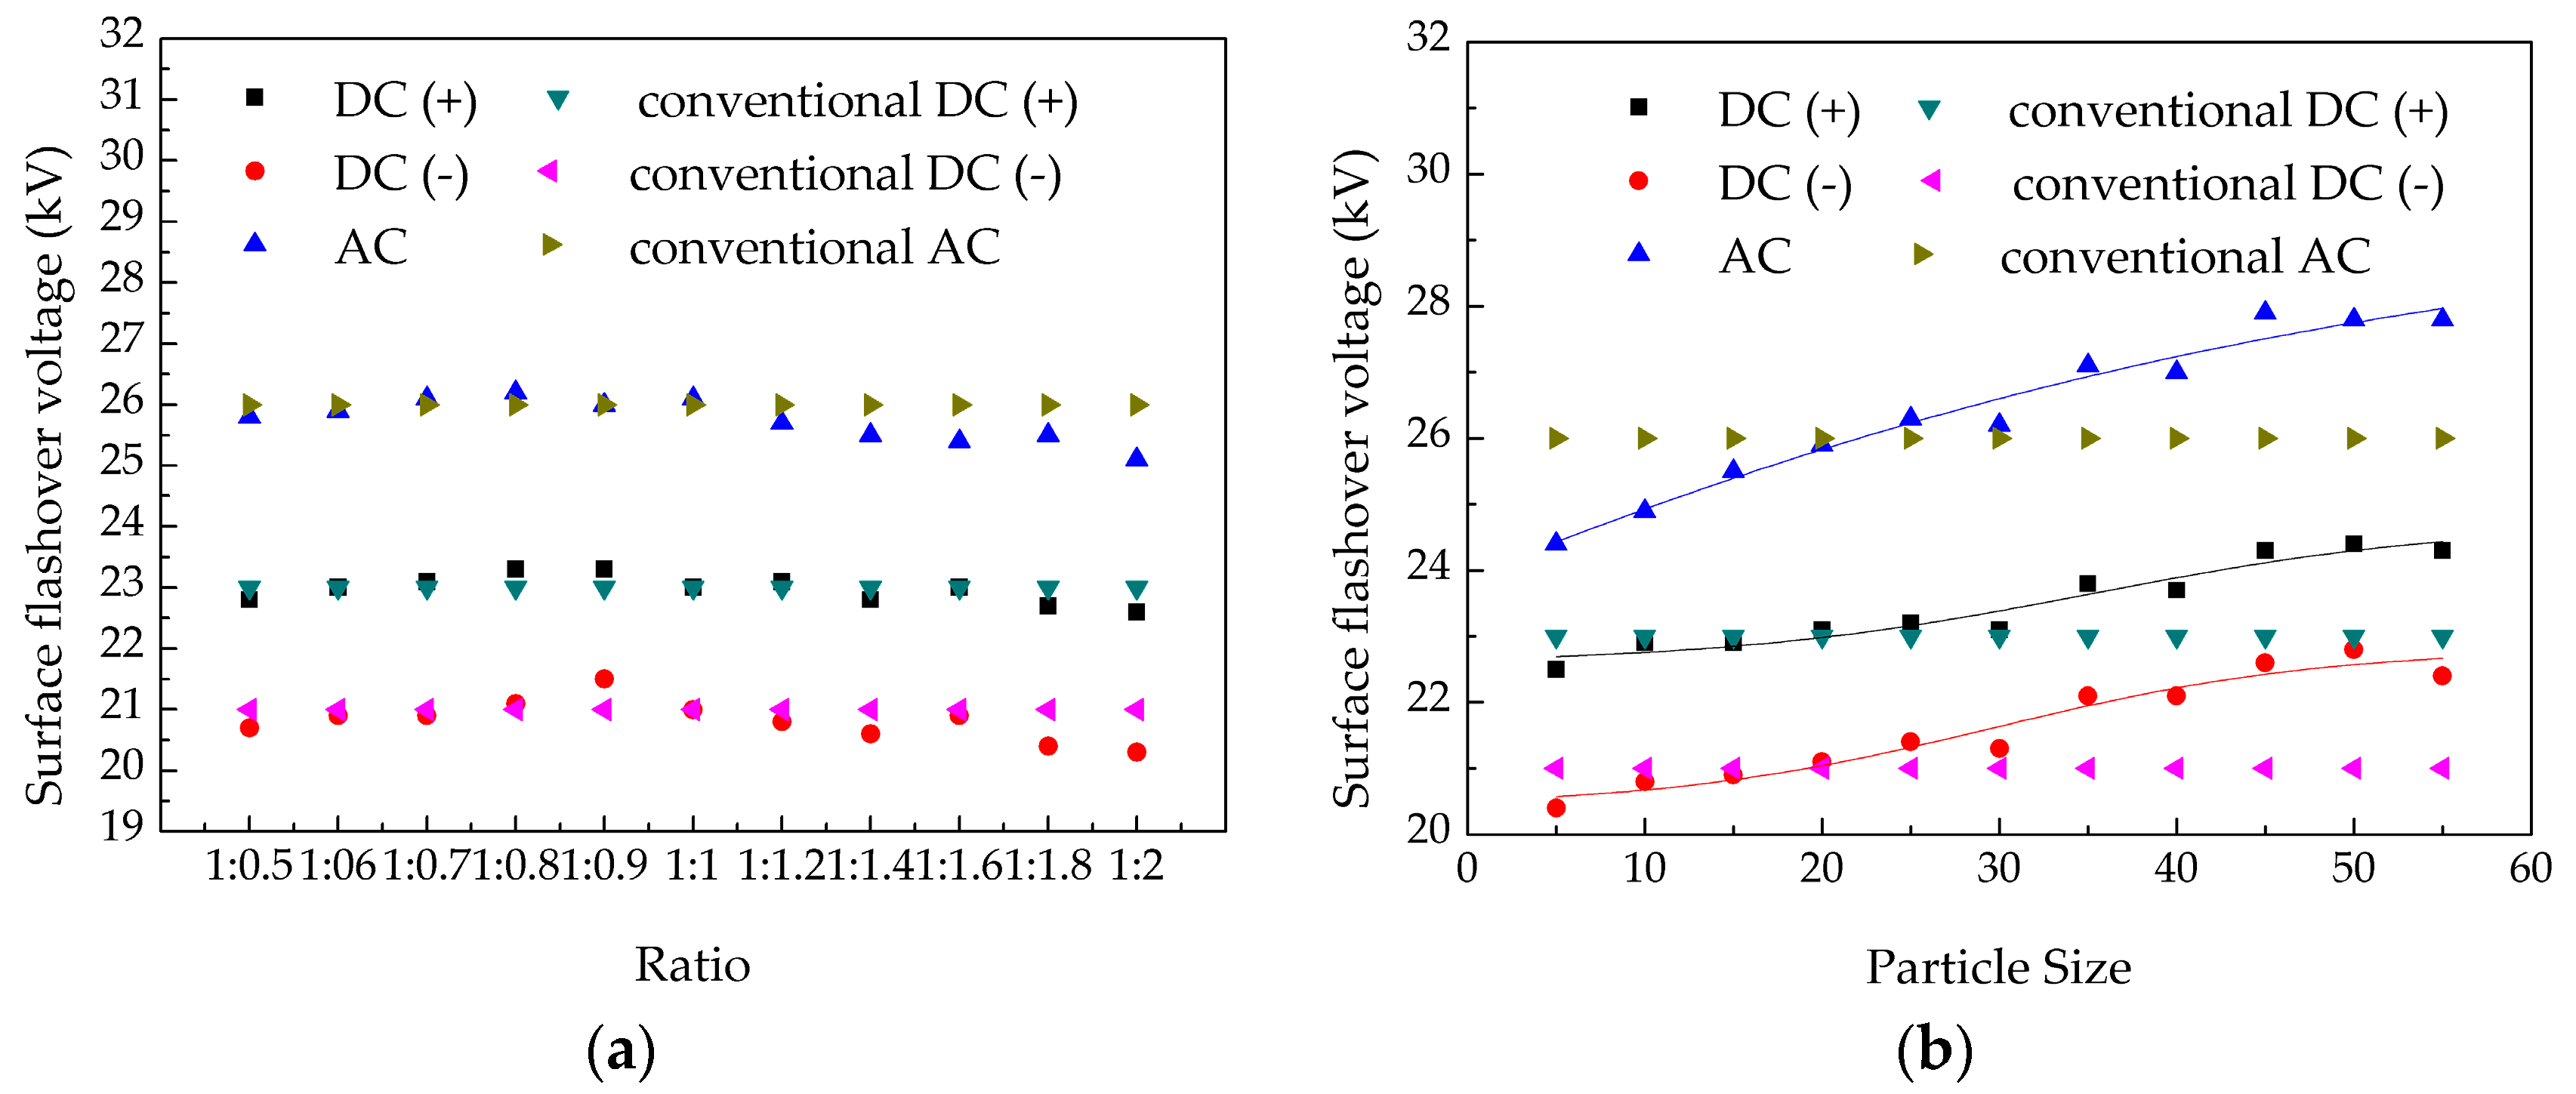
Referring to Table 5, the DC(+) surface flashover test of RTV coating was performed with ESDD = 0.141 mg/cm2 (corresponding = 1380 μS/cm) and NSDD = 1.376 mg/cm2 (creepage distance = 5 cm, insoluble contents = 108.1 mg). The DC(−) surface flashover test of RTV coating was performed with ESDD = 0.133 mg/cm2 (corresponding = 1250 μS/cm) and NSDD = 1.356 mg/cm2 (creepage distance = 5 cm, insoluble contents = 106.4 mg). The AC surface flashover test of RTV coating was performed with ESDD = 0.111 mg/cm2 (corresponding = 950 μS/cm) and NSDD = 1.124 mg/cm2 (creepage distance = 5 cm, insoluble contents = 88.2 mg). NH4NO3 and CaSO4 were used to prepare the solution of 2 mL each with the above three different conductivities, a certain amount of SiO2 was smeared on the RTV coating as the test group. NaCl was used to prepare the solution of 2 mL with the same conductivity, and the kieselguhr, which has the same quality as SiO2, was smeared on the RTV coating as the control group. The simulating contamination was smeared uniformly on the RTV coating to conduct the flashover test. The ambient humidity is 80% and the temperature is 25 °C, the test results are shown in Figure 11a. It can be seen from Figure 11a that although the preparation of NH4NO3 and CaSO4 are not the same, the flashover voltages are the same when the conductivities of them are the same. When the ratio of NH4NO3 and CaSO4 is larger than 1:1, the flashover voltage of insulator surface are slightly lower than that with conventional contamination. Owing to CaSO4 is slightly soluble and NH4NO3 is lyotrope, when the ratio of NH4NO3 and CaSO4 becomes larger, the content of CaSO4 increases, and the conductivity increases slowly. When the surface of RTV coating is fully wet, the actual conductivity is a little higher than the conductivity of the original solution, which leads to the slight decrease of flashover voltage. The proposed method with two soluble matters to simulate haze-fog could better reflect the influence of different sault composition on the surface flashover characteristic of RTV coating, which could overcome the disadvantage of using NaCl as the single soluble matter in the conventional pollution flashover test.
Keeping and NSDD constant, the comparisons of surface flashover voltage between conventional NaCl and the proposed kieselguhr methods with different particle sizes of SiO2 are shown in Figure 11b. It can be seen from Figure 11b that there was a positive correlation between the particle size and the surface flashover voltage. The larger the particle size is, the higher the flashover voltage is. When NSDD is constant at a certain value, the smaller the insoluble particle size is, the more the number of particle is. With the increase of the particle number, the moisture absorption ability of contamination becomes stronger and the electrolyte dissolves more fully, which could improve local conductivity. As compared to the conventional pollution flashover method [19], the proposed method could better simulate the surface discharge characteristics of the RTV coating in haze-fog environment. Conclusions can be drawn from the test that the sault type of the contamination on insulator surface in haze-fog environment would influence the surface conductivity. The increase of the particle size of contamination would lead to the increase of surface flashover voltage.
4.2. Electric Field Distribution and Distortion
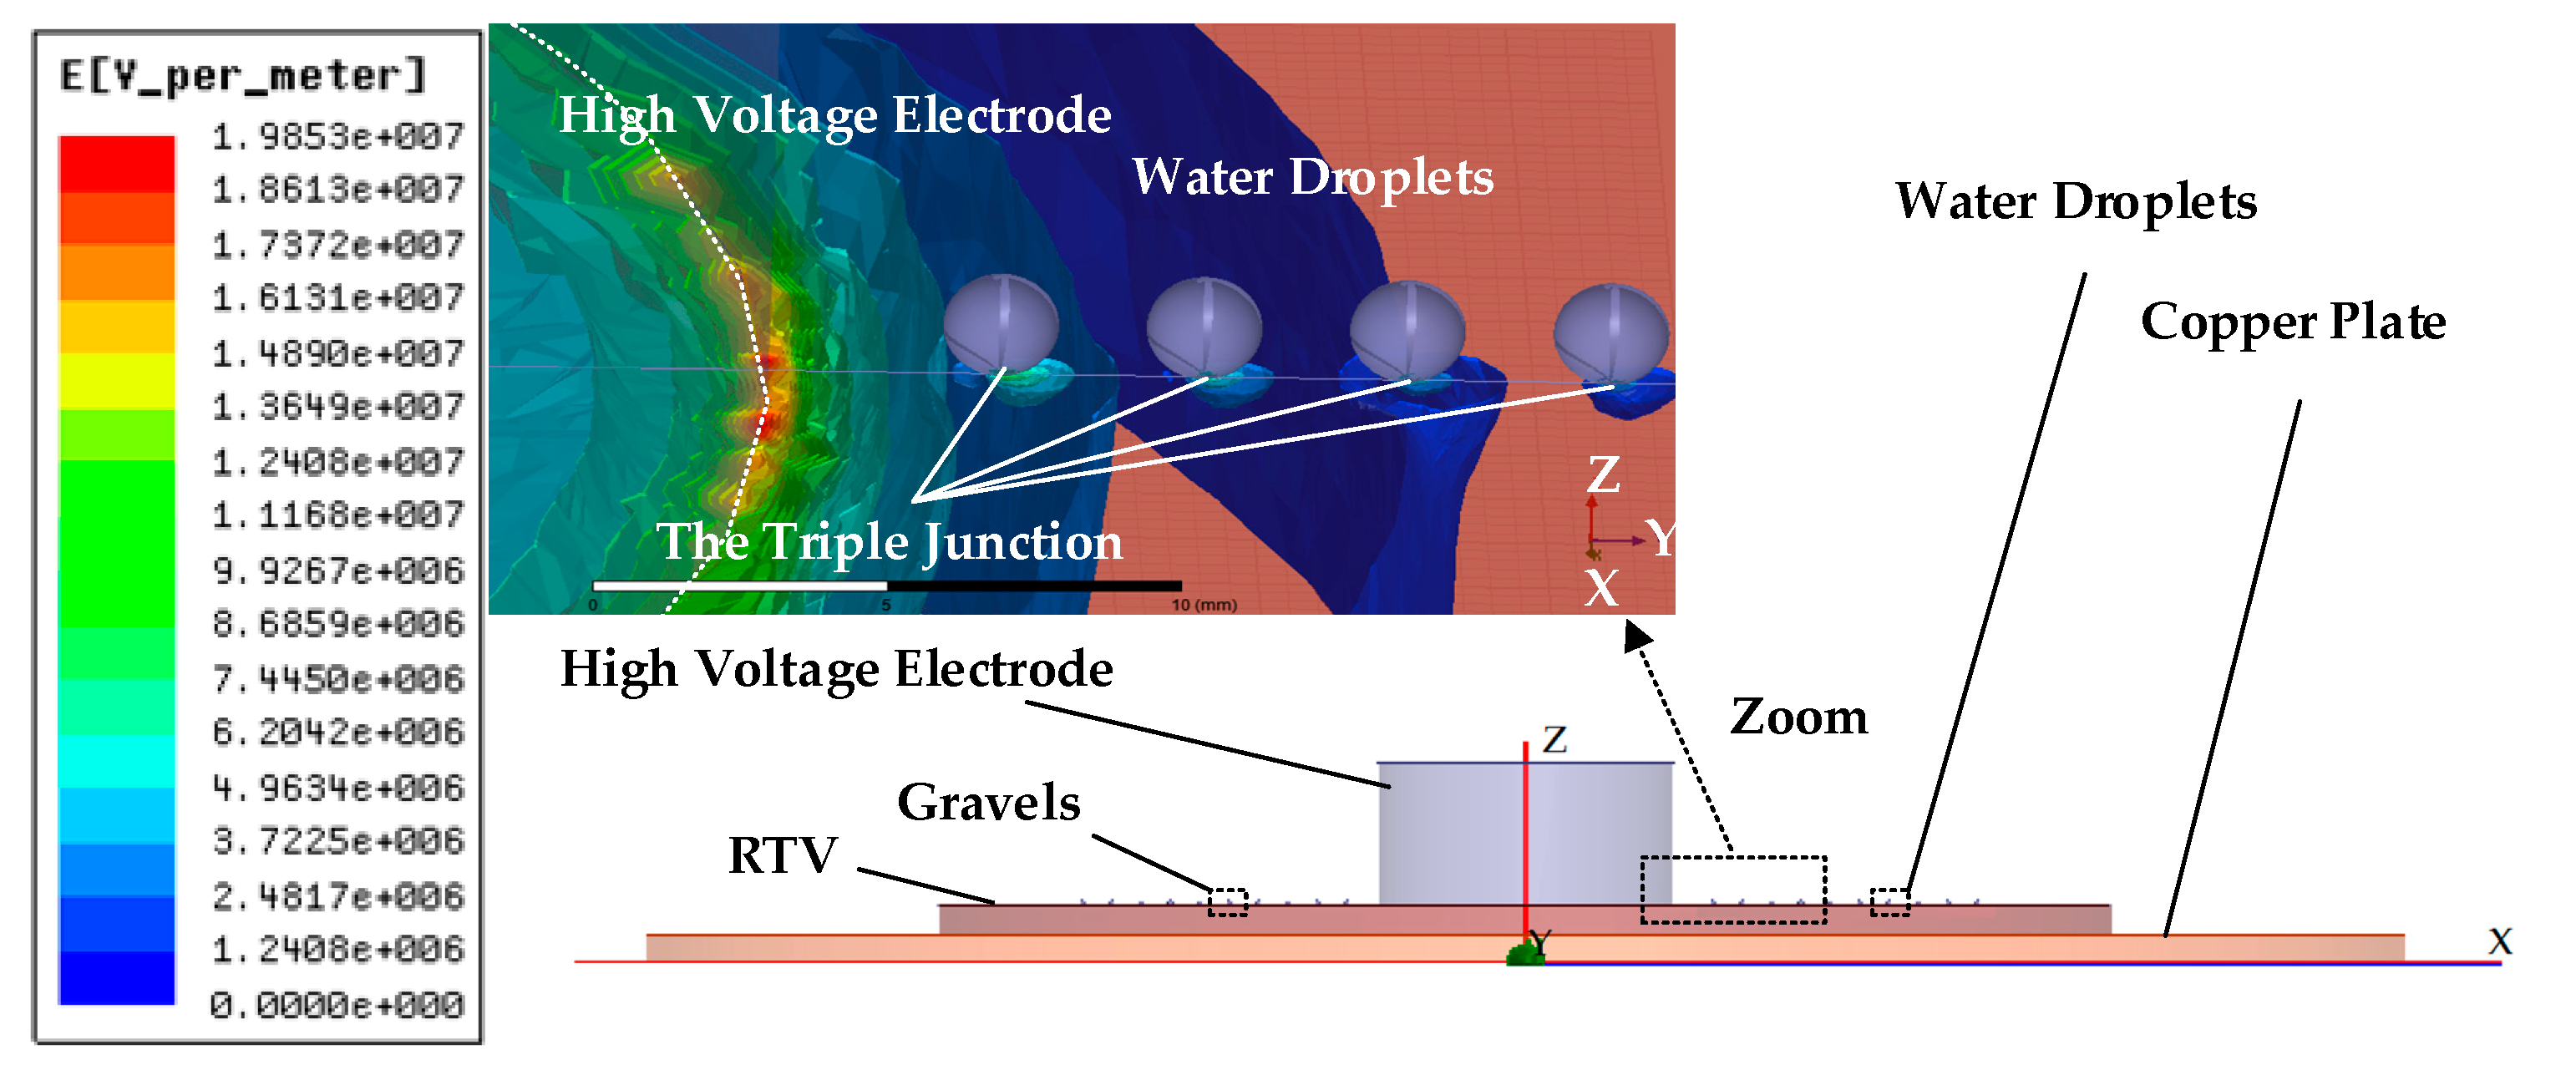
As shown in Figure 12, the droplets and gravels were used to simulate the sediments under haze-fog environment, and ANSYS Maxwell was used to analyse the electric field distribution of the RTV coating. The droplets and gravels were attached to the RTV coating surface around the high voltage electrode uniformly. The volume conductance of droplet and gravel are 4 μS/cm and 0 μS/cm, respectively.
Assuming that the droplets and gravels are sphere and tangent to the RTV coating surface, the distribution of electric field by simulation is shown in Figure 12. It can be seen from Figure 12 that there was severe distortion of electric field intensity at the juncture of high electrode and RTV coating. In addition, at the juncture of droplets and RTV coating, there was distortion of electric field intensity, which was most obvious at the triple junction point of droplet, air, and RTV coating. The presence of droplets would result in the distortion of electric field intensity at the triple junction point of droplet, air, and RTV coating and lead to the decrease of dielectric strength on insulator surface.
The electric field distribution along the Y-axis, which passes through the symmetry axis of the high voltage electrode, is shown in Figure 13. The green curve shows the electric field distribution of clean RTV coating surface and the red curve shows the electric field distribution of RTV coating surface with droplets and gravels (water droplets are on the right, while the gravels are on the left).
It can be seen from the Figure 13 that obvious distortion occurred at the junction of the RTV coating and droplets on the Y-axis when the droplets and gravels were attached to the RTV coating, and on both sides of the high voltage electrode, the maximum electric field intensity increased obviously. The electric field intensity reached a maximum when the second droplet was added. After adding the second droplet, the maximum electric field intensity decreased in turn with the increase of distance, indicating that the influence of the added droplets on electric field intensity was related with the distance from the high voltage electrode. As the corona discharge occurred around the first droplet, making the electric field intensity become uniform, the electric field intensity around the first droplet was weaker than that around the second droplet.
Distortion also occurred at the left side of the added gravel, the maximum of electric field intensity increased obviously. But the increment of electric field intensity on insulator surface with the added gravel was smaller than that with the added droplet.
4.3. Dynamic Behavior of Droplets
The entire test chamber will be filled with continuous salt spray, leading to very poor visibility, which makes it difficult to shoot dynamic droplet behaviour. Thus, only after the deposition of salt spray, the dynamic behavior of droplets could be shot, and the droplet was 1 μL deionized water. HiSpec 5 high speed camera was used for shooting, its framing rate is 1000 fps. The environment temperature was 25 °C and the relative humidity was 80%. The kinds of applied voltage source include AC, DC positive polar, and DC negative polar power source. The simulating haze-fog includes salt spray, which is composed of NH4NO3 and CaSO4 in the ratio of 1:1, as well as SiO2 whose particle size is 25 μm and NSDD is 2.052 mg/cm2.
4.3.1. Positive DC Source
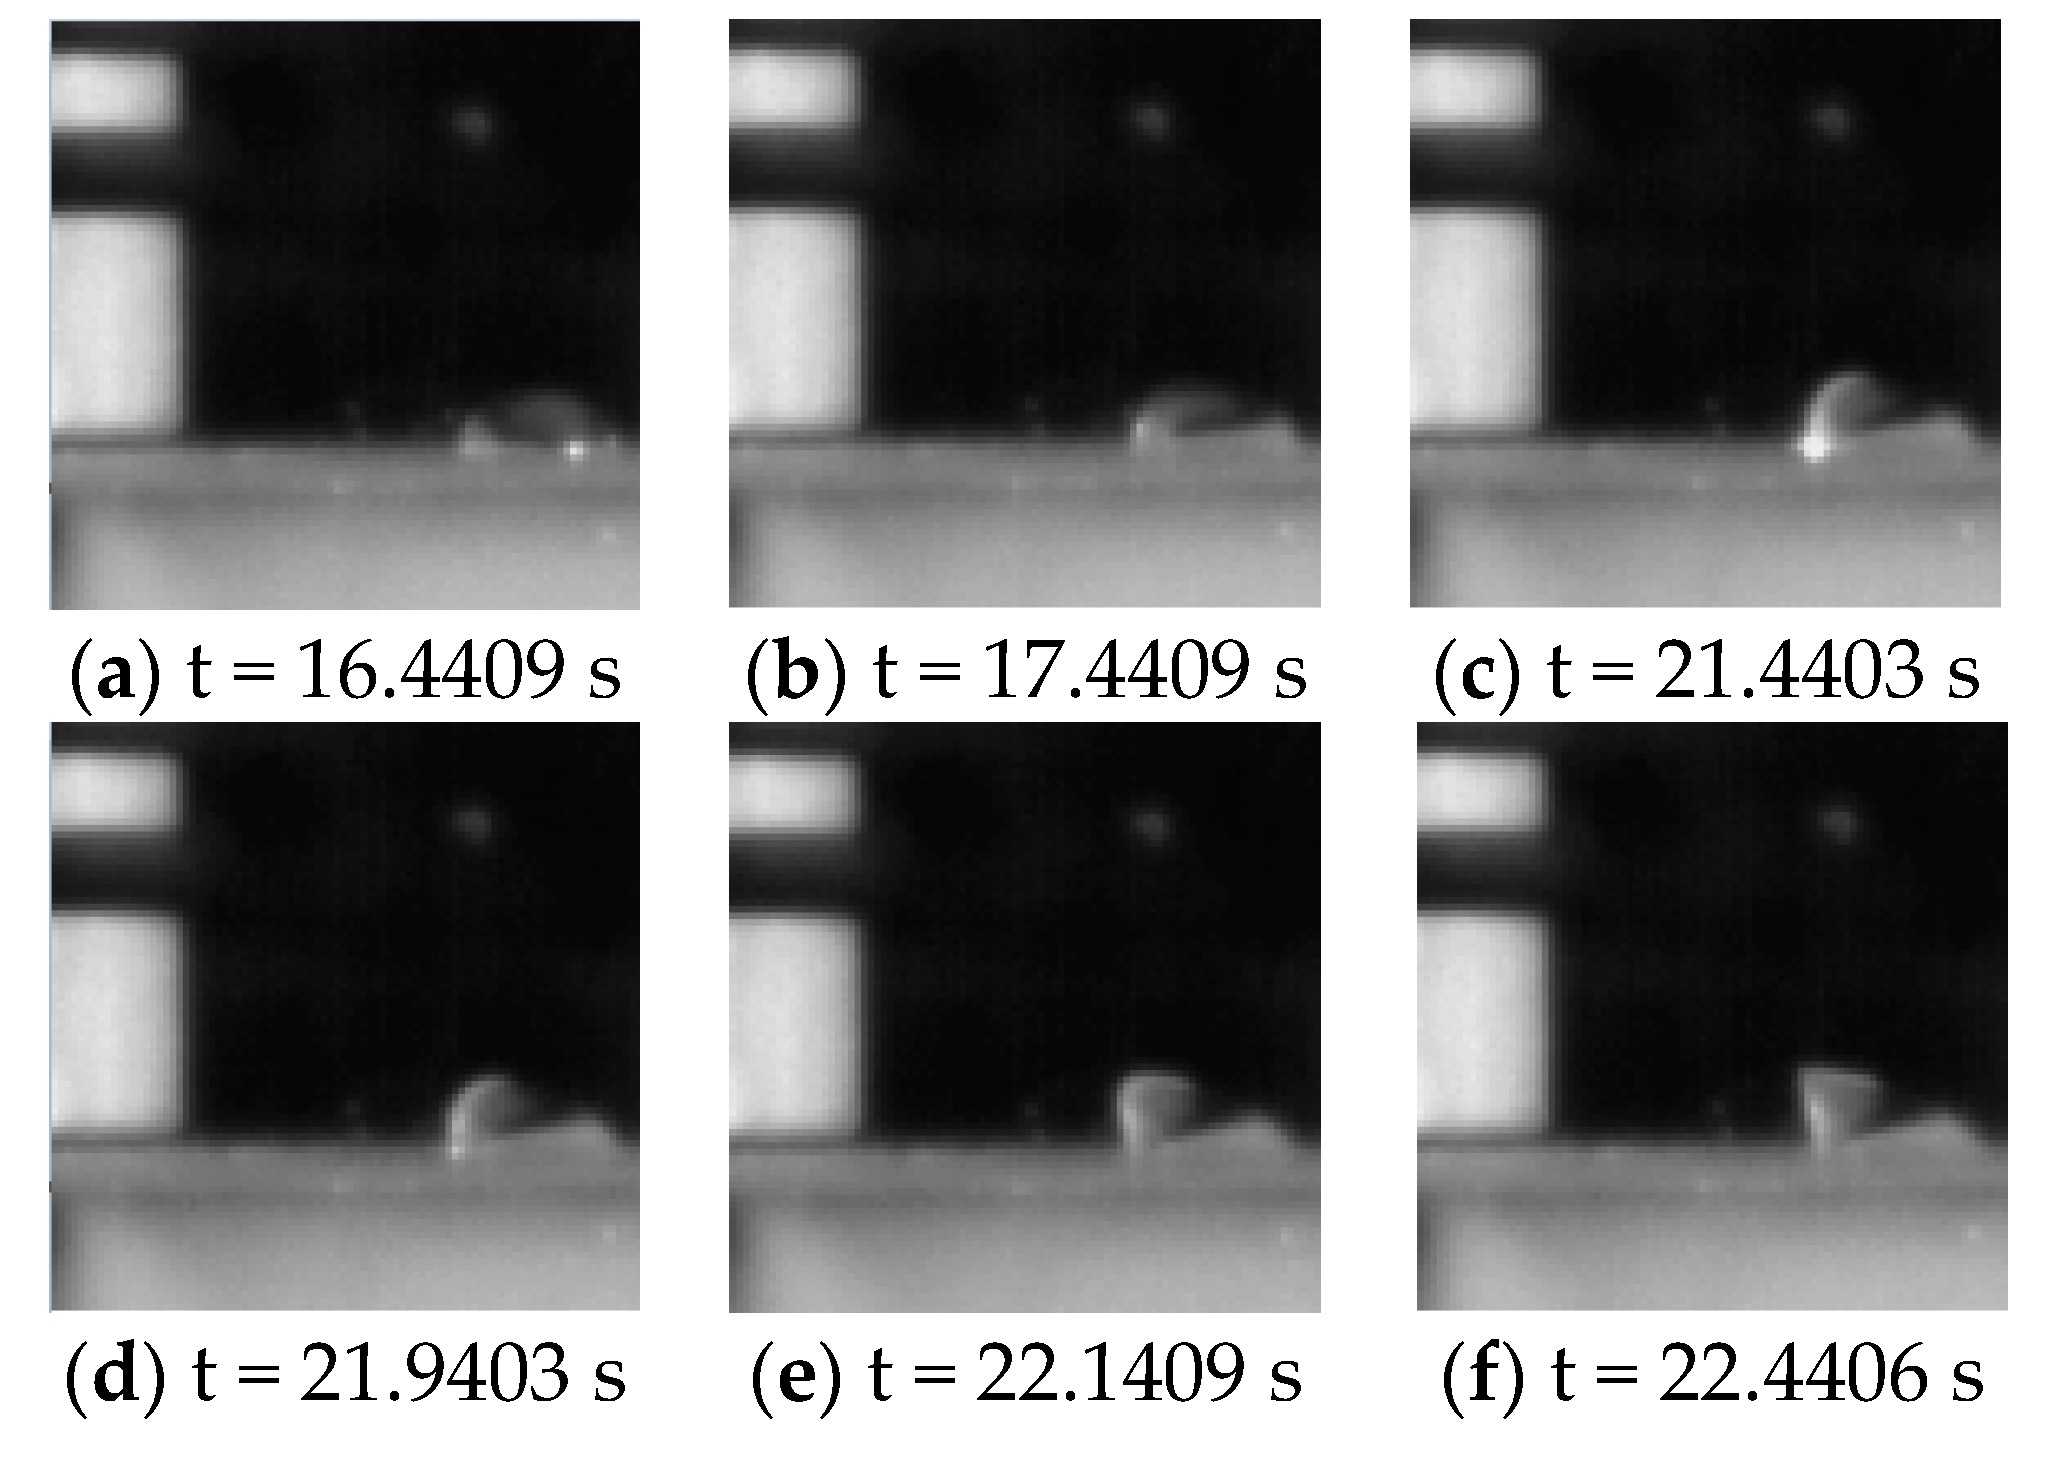
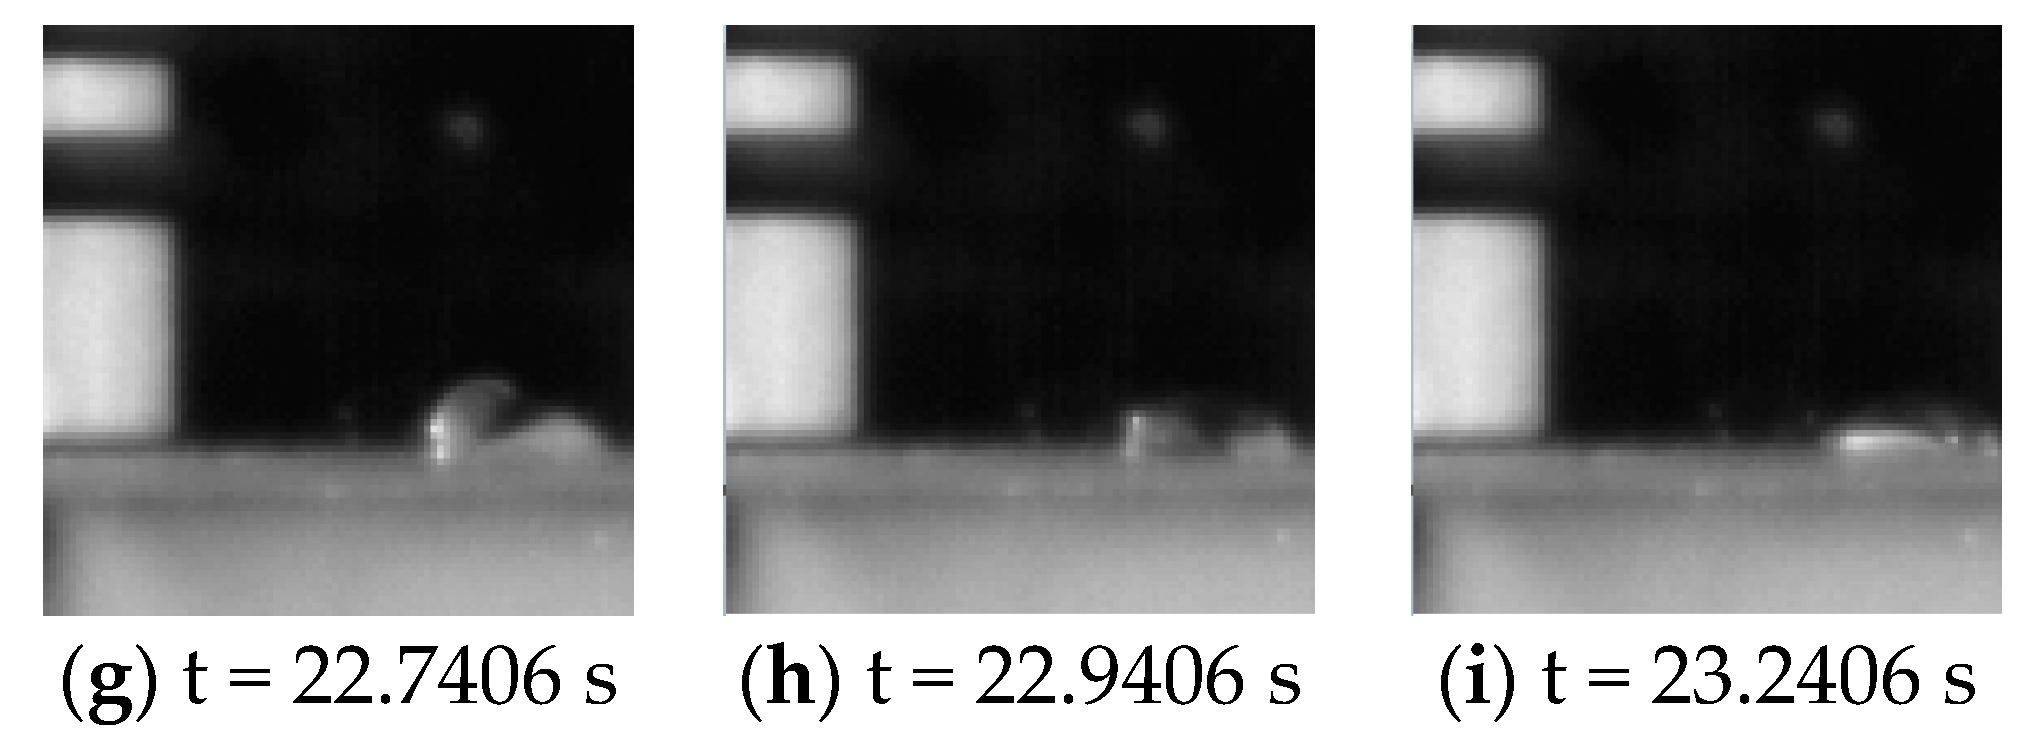
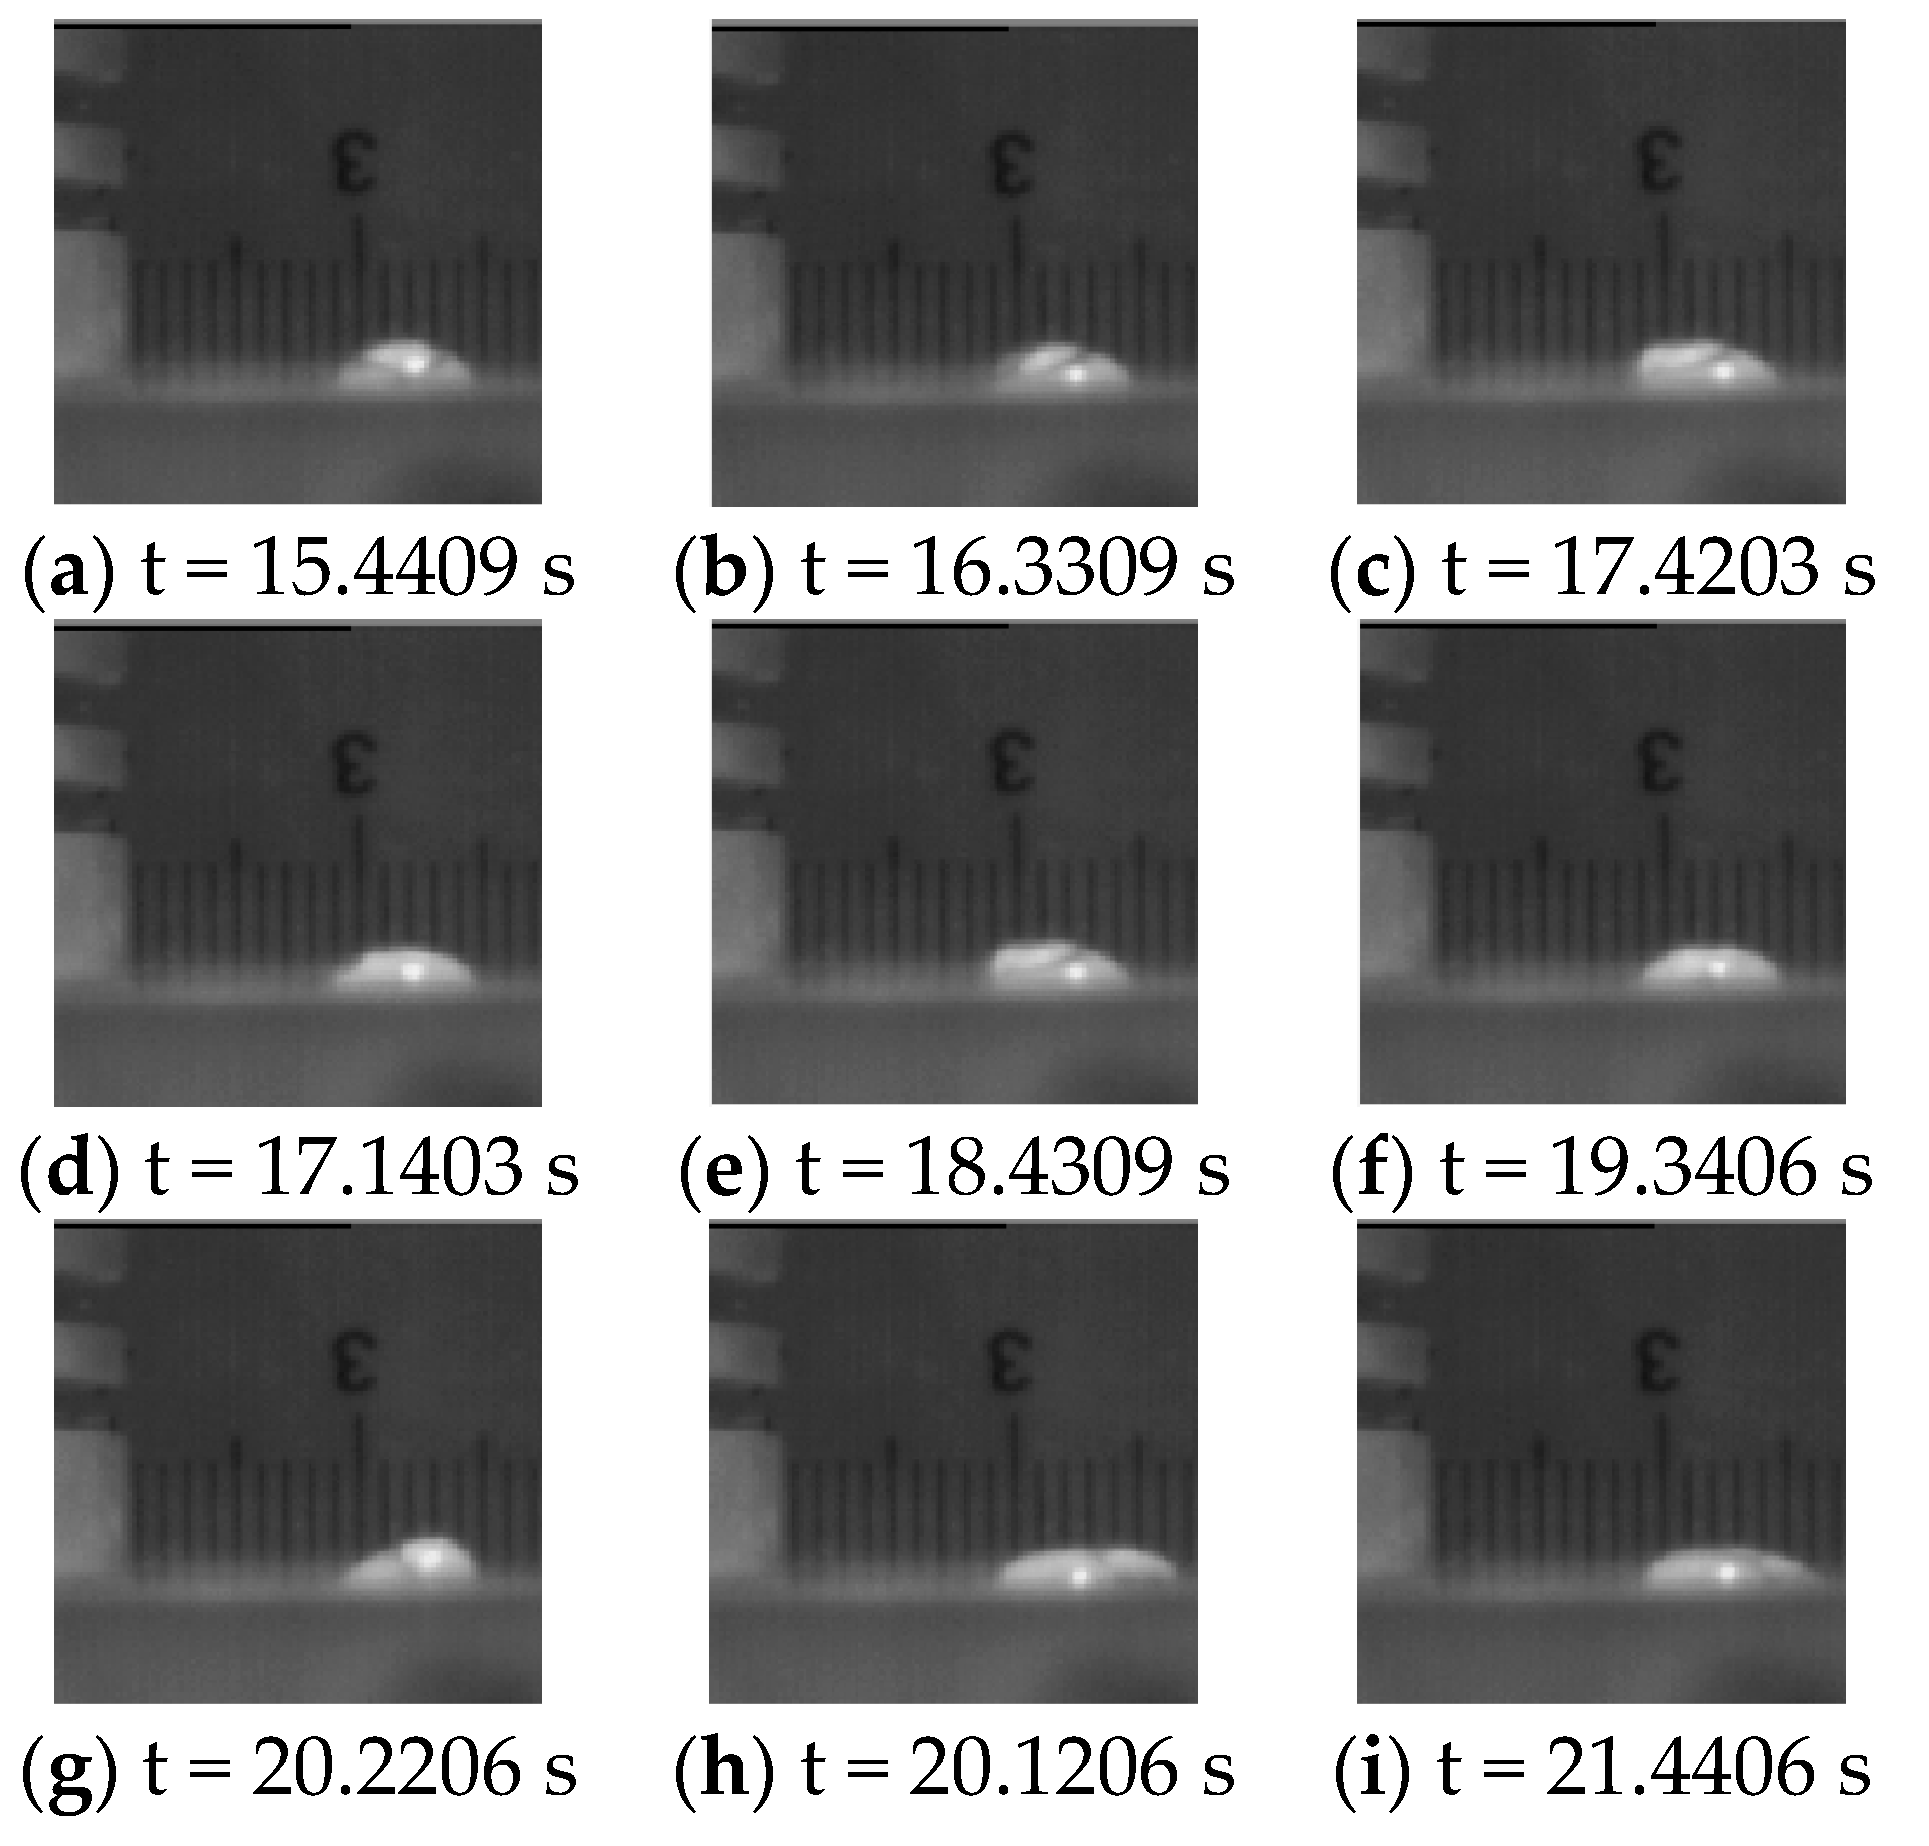
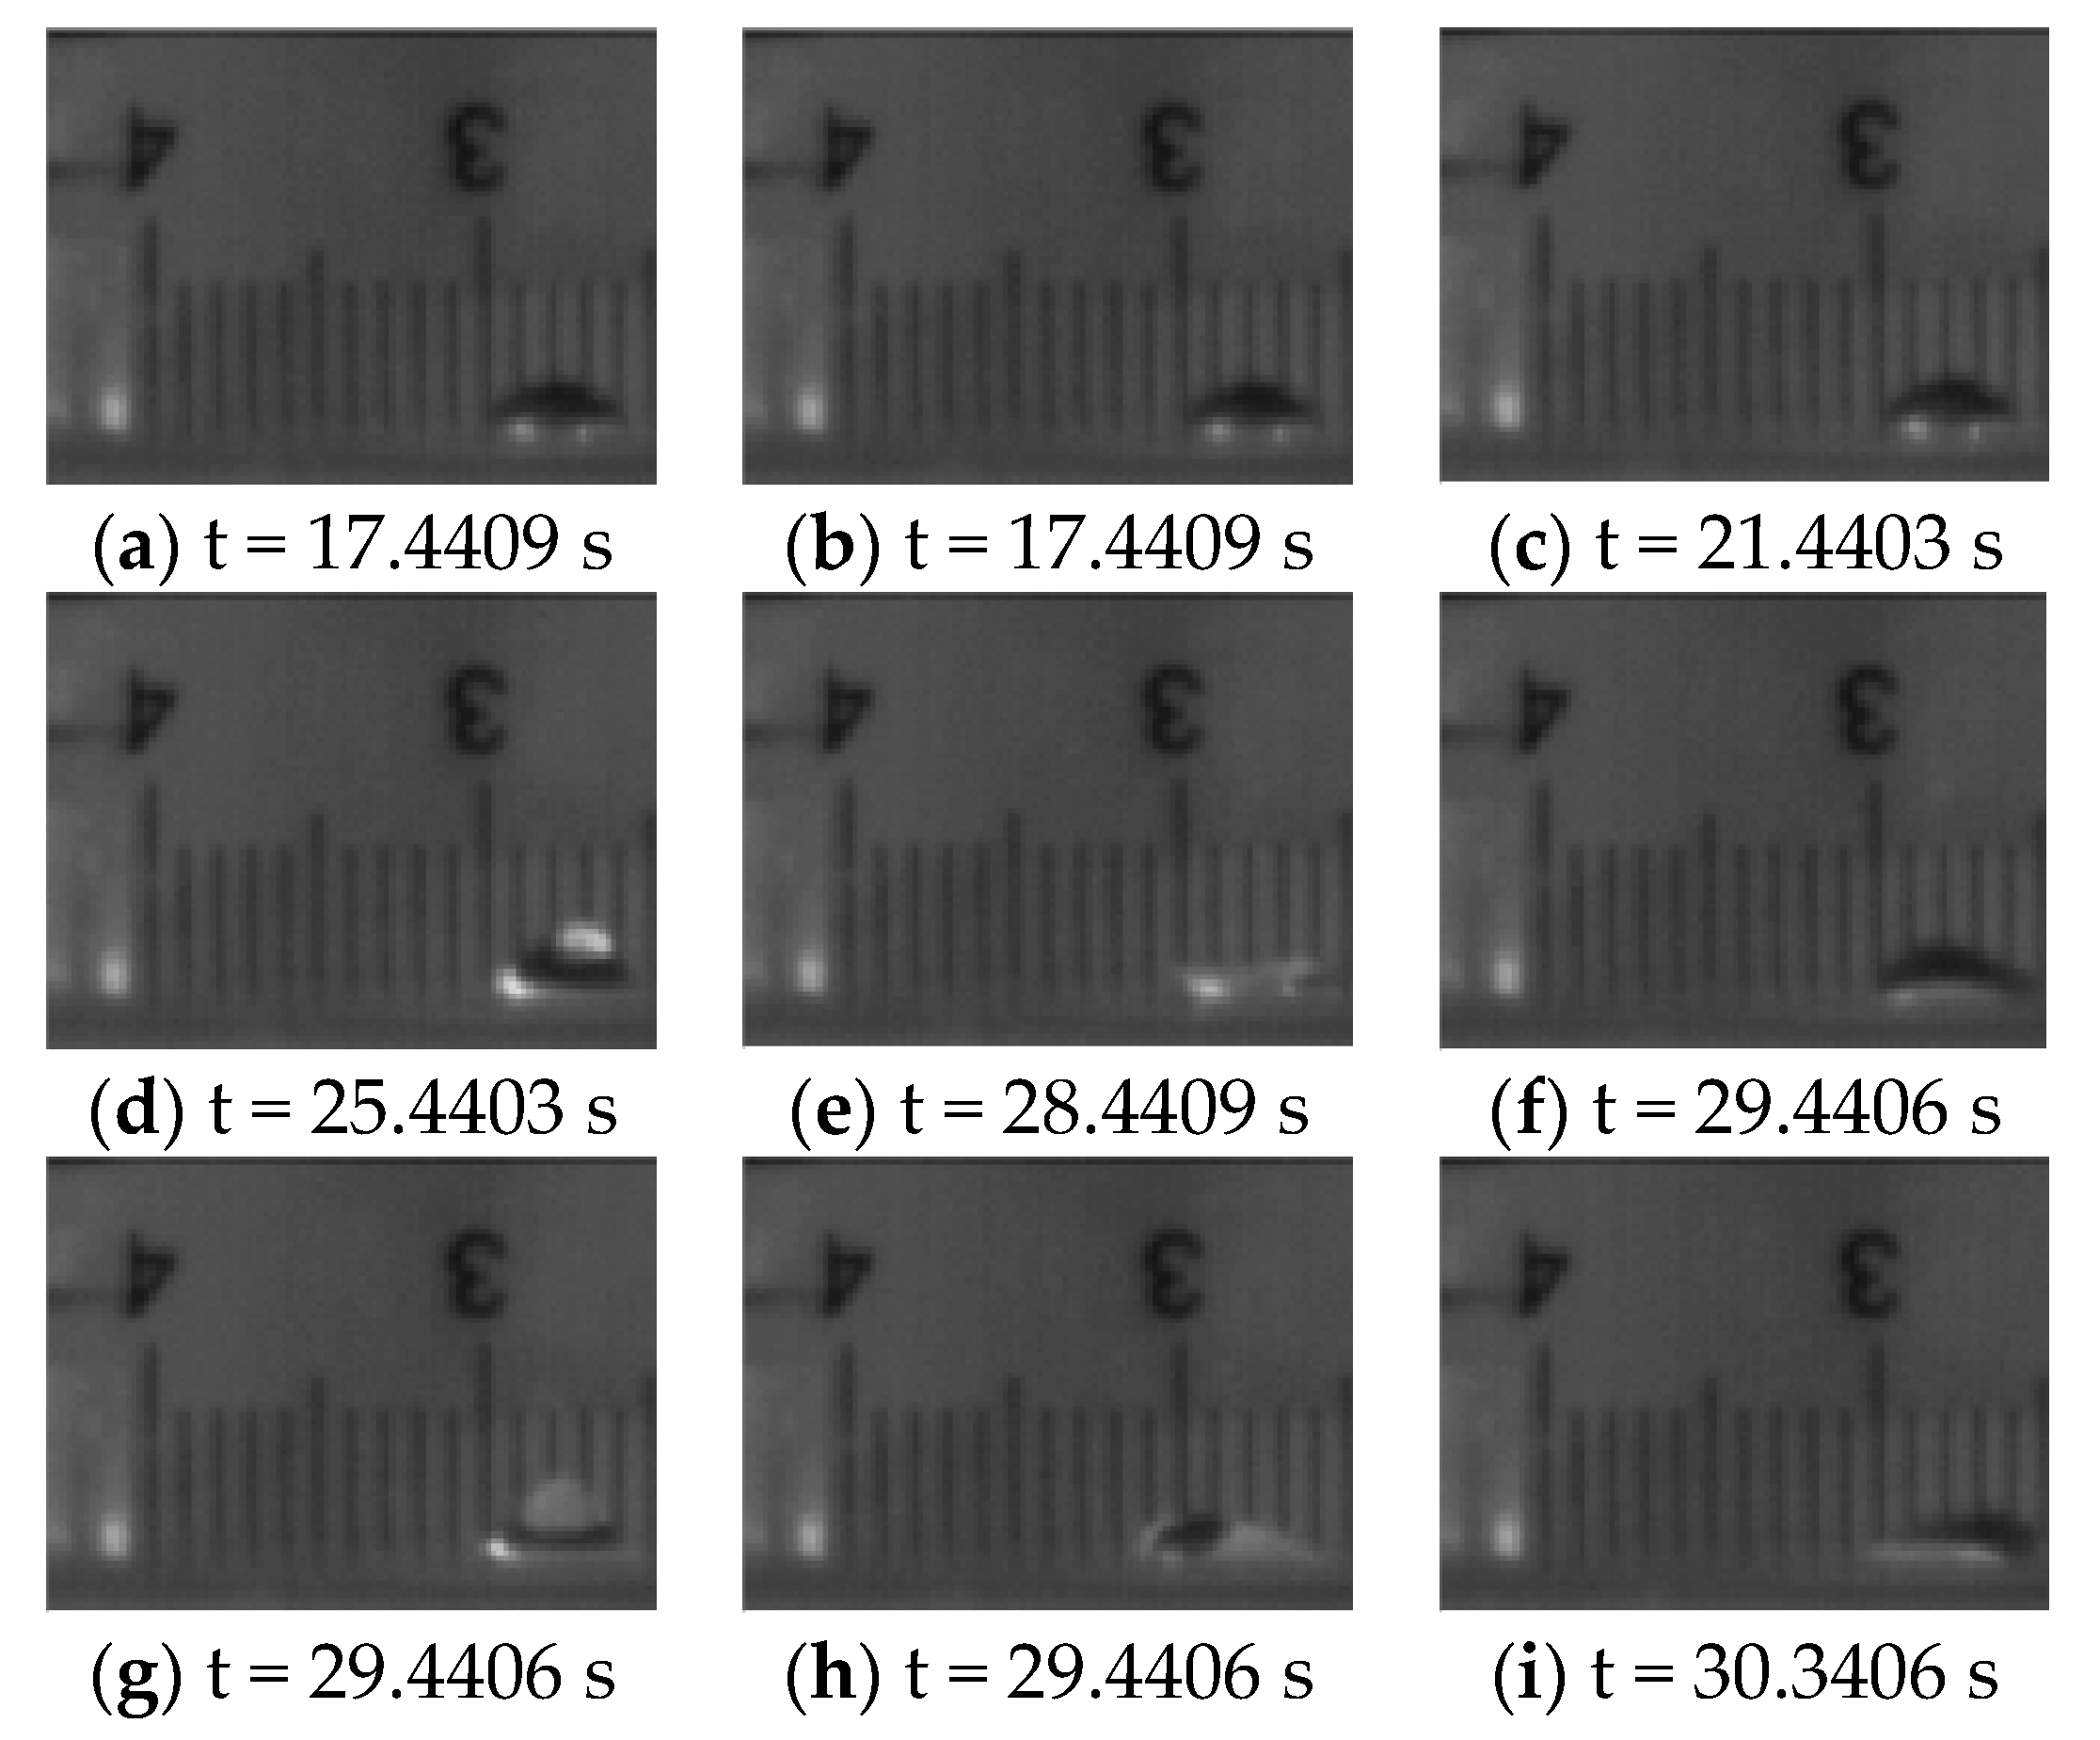
When the applied voltage reached 17 kV, there was an obvious deformation of the droplet under the DC positive polar power source. The droplet spread out and changed from the original sphere to a flat shape. At the same time, the upper part of the droplet began to tilt to the high voltage electrode, as shown in Figure 14b–f. When the applied voltage reached 21 kV, obvious discharge spot appeared at the triple junction point of droplet, air, and RTV coating, as shown in Figure 14c. The deformation of droplet reached its maximum when the applied voltage reached 22.4 kV, as shown in Figure 14f, but the bottom of the droplet did not move. With the continuous increasing of applied voltage, the deformation of the droplet top tilting to the high voltage electrode began to recover, as shown in Figure 14g,h. When the applied voltage reached 23.2 kV, the droplet began to move away from the high voltage electrode, as shown in Figure 15.
4.3.2. Negative DC Source
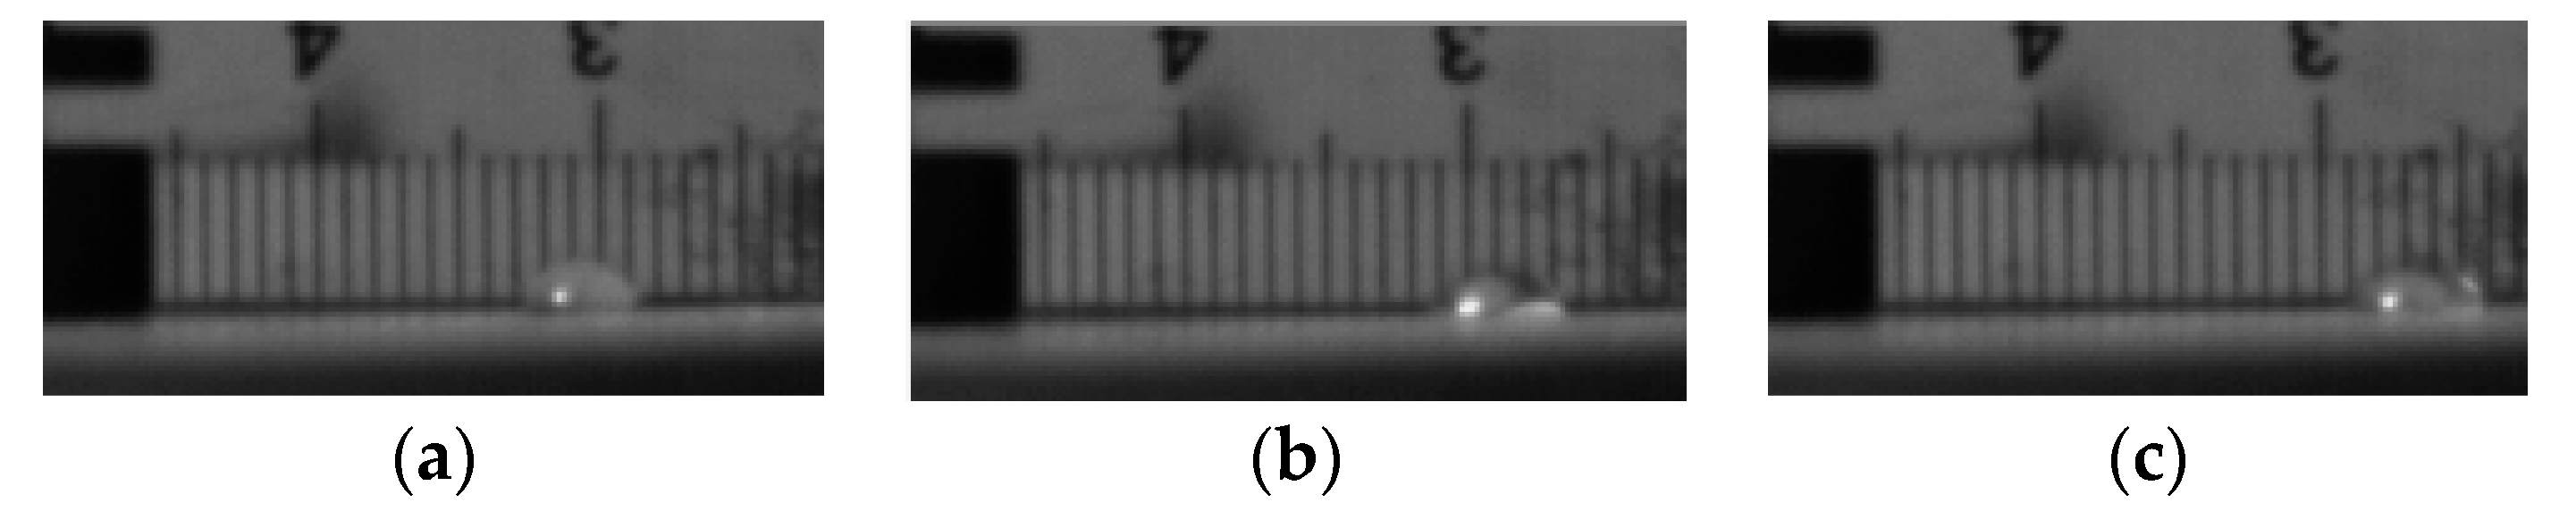
Under DC negative polar power source, the droplet deformation was not as obvious as that under positive polar case. The top of the droplets shakes left and right, as shown in Figure 16a–g. When the applied voltage reached 20 kV, the droplet spread out, as shown in Figure 16h,i. With the continuous increasing of applied voltage, the droplet began to move away from the high voltage electrode, which is consistent with that under positive polar case, as shown in Figure 17.
4.3.3. AC Source
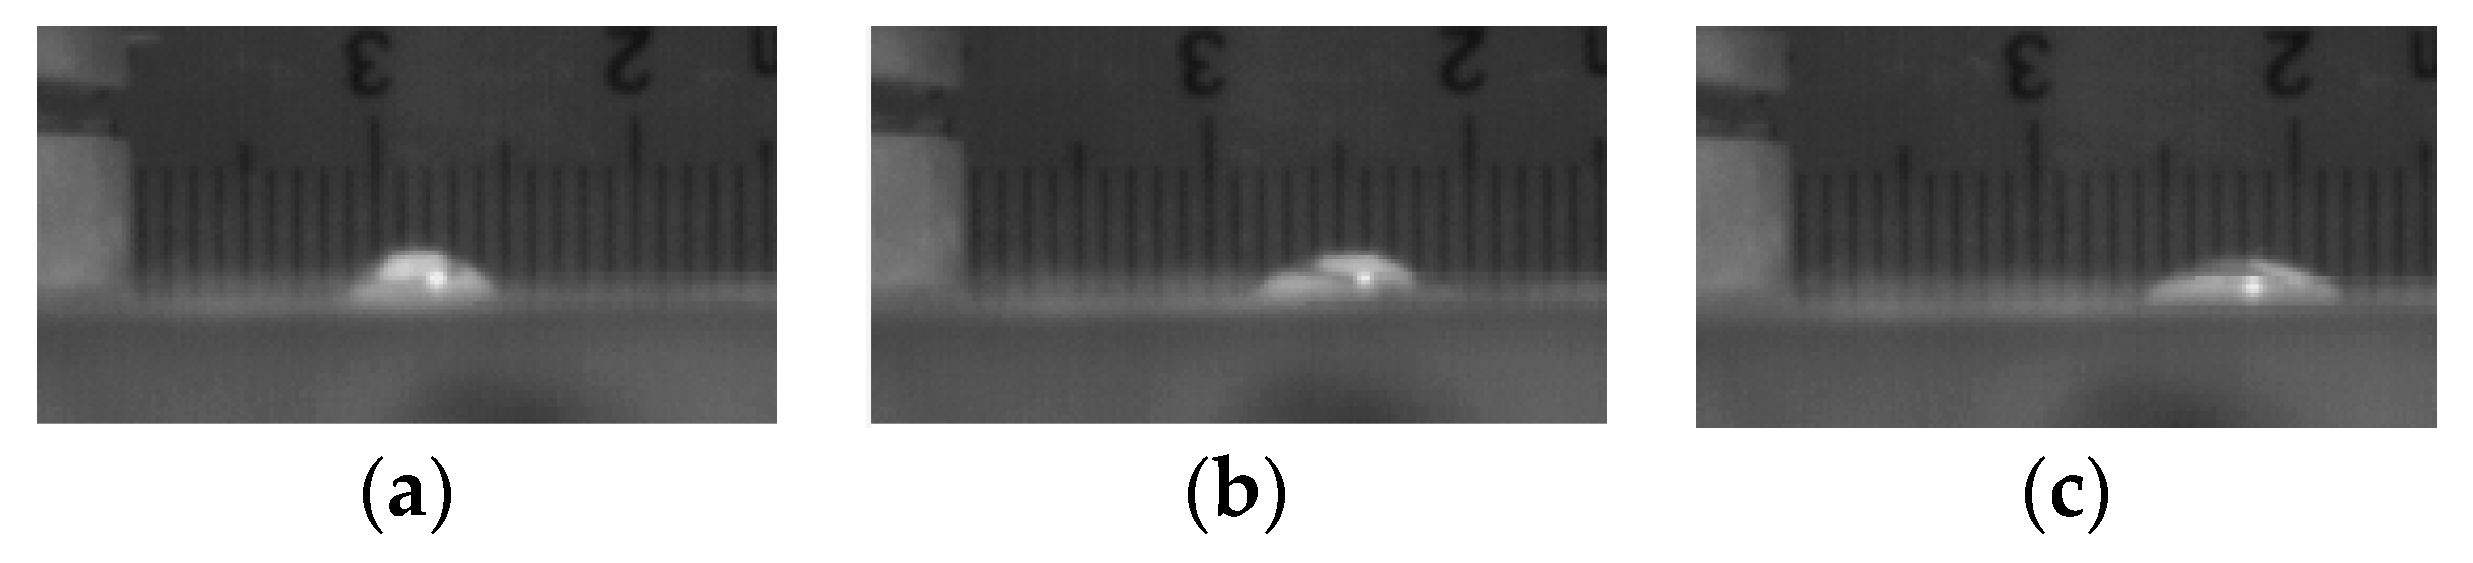
The morphological characteristics of droplet under AC power source are different with that under DC case. When the applied voltage reached 17 kV, there was a small amount of shaking up and down on the upper surface of the droplet, and the shaking frequency was consistent with the power frequency (50 Hz), as shown in Figure 18a–c. When the applied voltage reached 25 kV, the shaking amplitude of the droplet increased significantly, and the trend of moving around appeared on the upper of the droplet, as shown in Figure 18d,e. With the continuous increasing of applied voltage, the shaking amplitude of the droplet increased gradually, accompanied by moving up and down. When the applied voltage reached 29 kV, the droplet was displaced, firstly moved towards the high voltage electrode slightly and then moved away from the high voltage electrode, as shown in Figure 18f–i.
In conclusion, the droplet on the RTV-coated surface in haze-fog environment would be deformed or moved due to the electric field. There were white burning marks on the RTV coating after the discharge. The discharge is liable to occur at the triple junction point of droplet, air, and RTV coating, which would damage the RTV coating. After the deformation or movement, a new triple junction point would be formed, which would seriously reduce the life and the dielectric strength of RTV coating.
4.4. Surface Pollution Flashover
4.4.1. The Influence of Conductivity
The influence of the contamination conductivity on flashover voltage is analysed in this section. The average value and standard deviation formulas of the flashover voltage are shown in Formula (5) and (6). When considering the flashover voltage under DC positive polar power source is larger than that of DC negative polar case, only the comparison of pollution flashover under DC negative polar and AC voltage power source is discussed in this chapter.
where U is the average flashover voltage, kV; Ui is the applied voltage obtained from the test in the time of i, kV; N is the total times of the valid test, N = 6; RSD is the relative standard deviation of the test result.
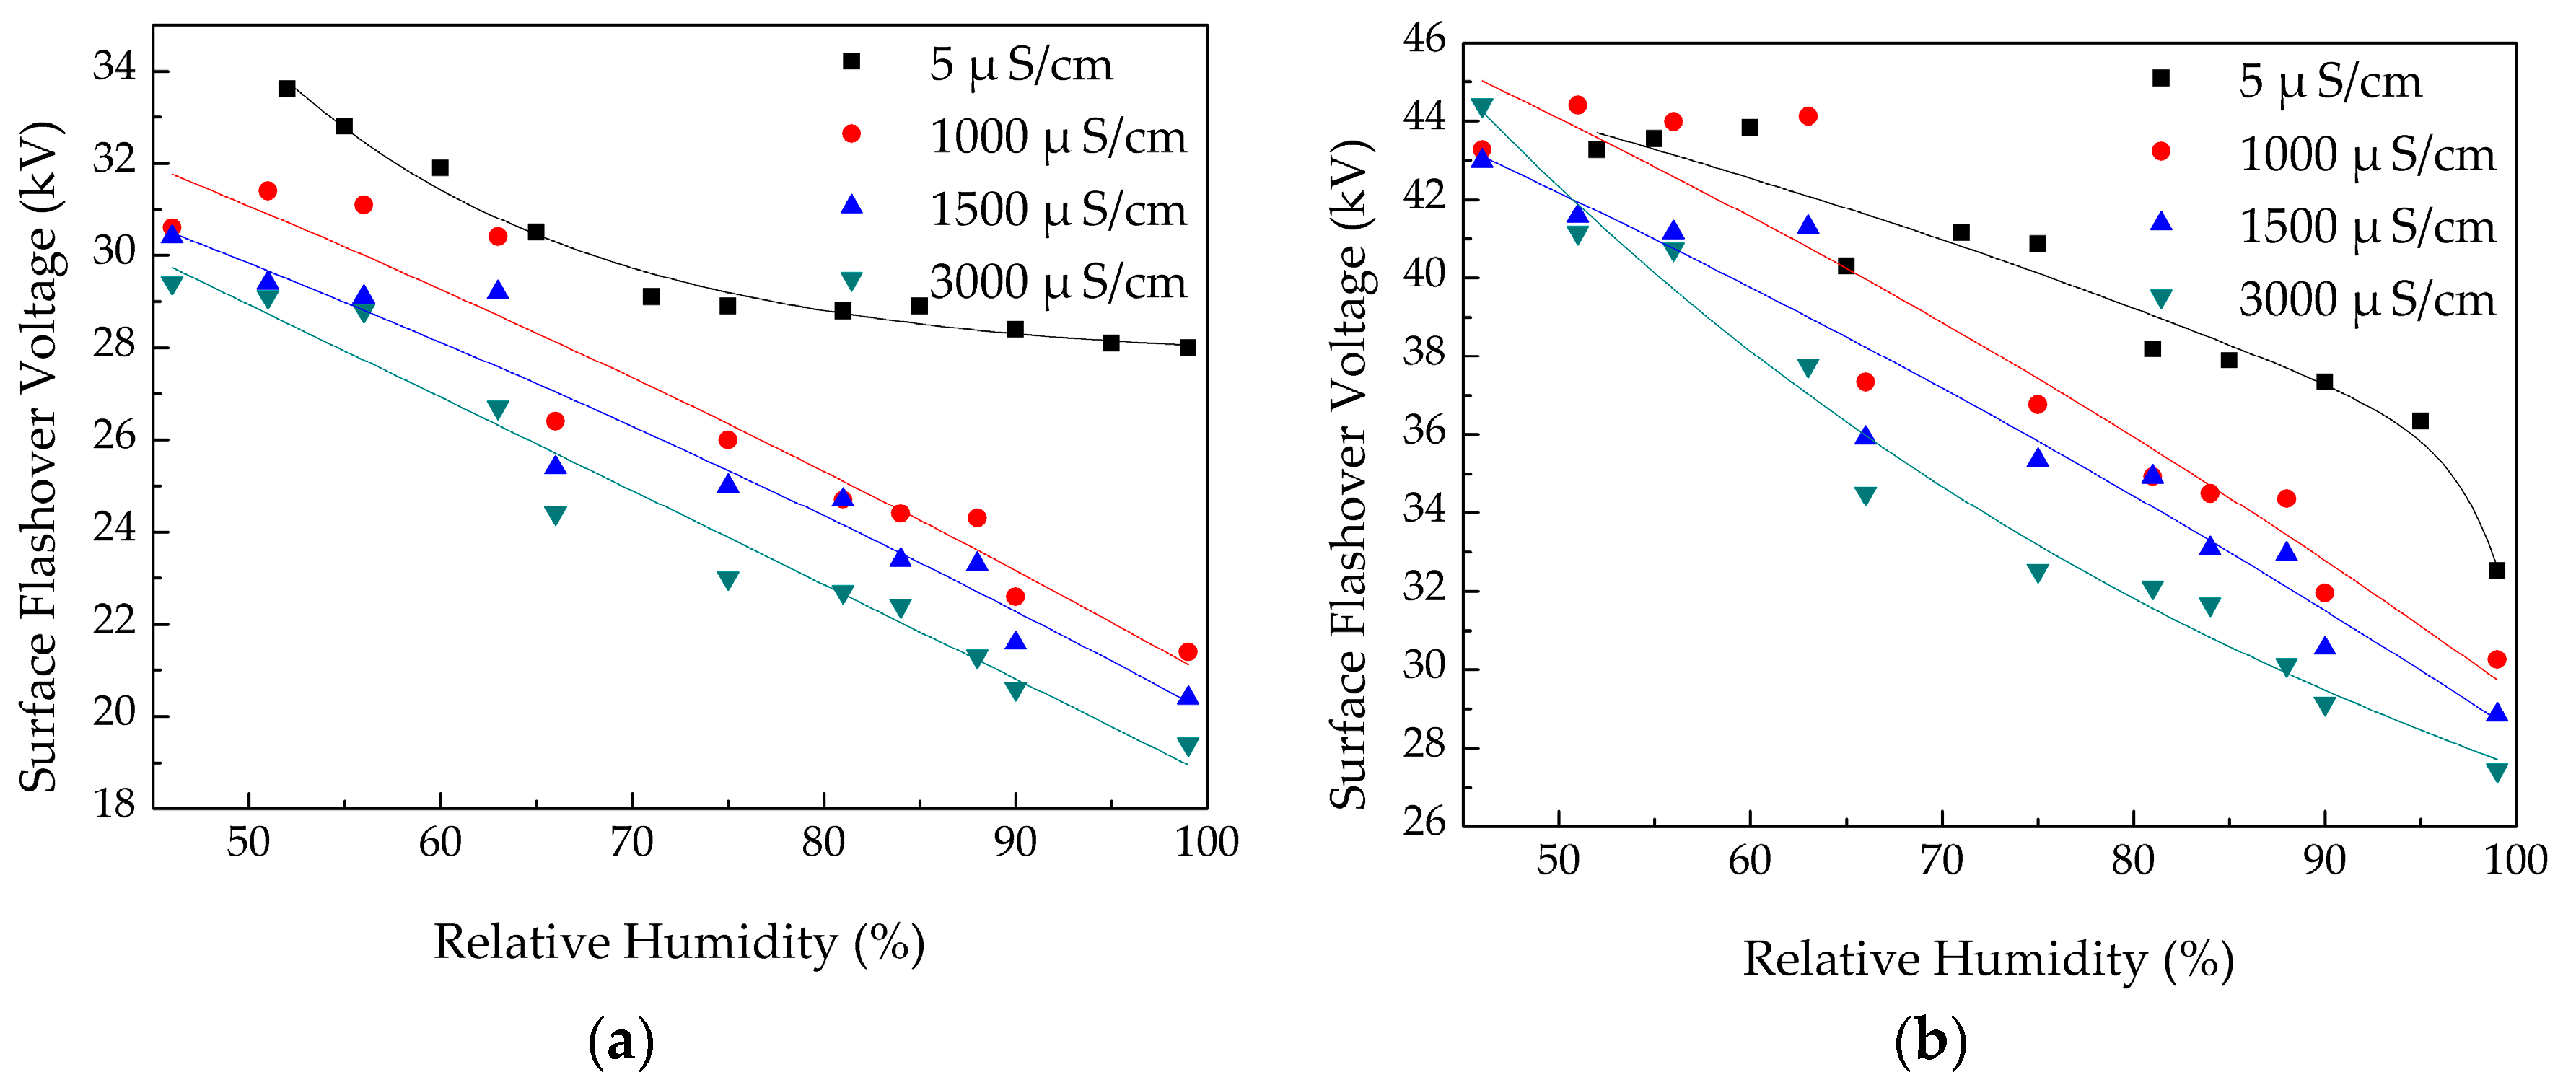
It can be seen from Figure 19a that when deionized water (5 μS/cm) was used for fog, the surface flashover voltage decreased gradually with increasing the relative ambient humidity. When the relative humidity exceeded 70%, U was maintained at about 29 kV. With the increase of the conductivity of salt spray, the surface flashover voltage of RTV coating decreased obviously, when the conductivity reached 3000 μS/cm, U reached its minimum 19.4 kV. This is because that, the leakage current in the RTV surface increased with the increase of the conductivity of salt spray, which accelerated the formation of “dry areas” and decreased the flashover voltage. The surface flashover test of RTV coating under AC power source was conducted as shown in Figure 19b. With the increase of the conductivity of salt spray, the surface flashover voltage decreased. When compared to the DC flashover voltage, the influence of humidity on AC flashover voltage was more obvious. Especially, U decreased obviously when the humidity exceeded 80%. Thus, the larger the fog spray conductivity is, the lower the surface flashover voltage is, and the poorer the insulation performance of RTV coating is.
4.4.2. Surface Pollution Flashover
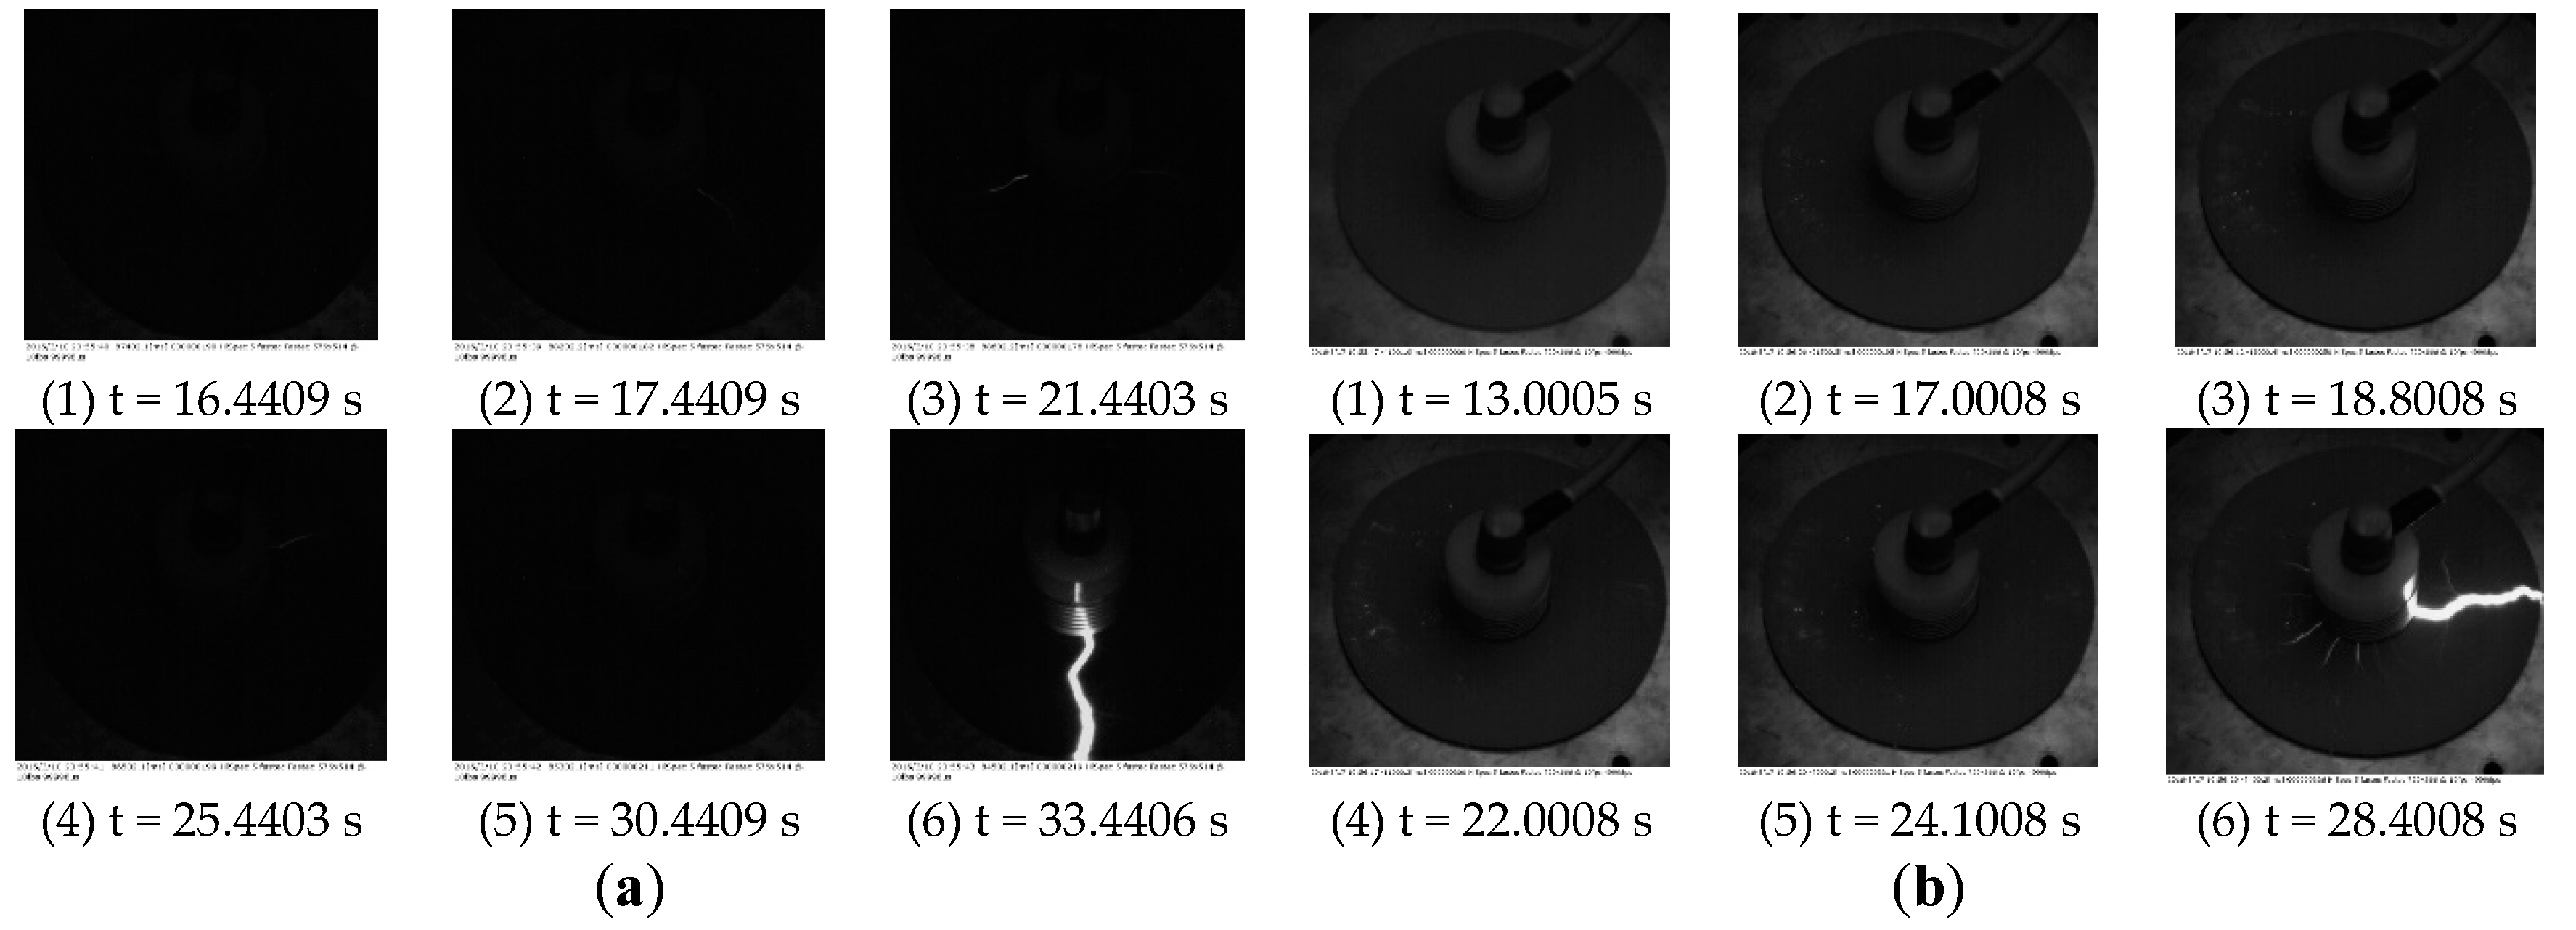
In order to study the influence of haze-fog environment on flashover development, a comparison test between two cases is performed. Case (1): The flashover development on the clean RTV coating with 50% environmental humidity is recorded. Case (2): The flashover development on the polluted RTV coating in the simulated haze-fog environment is recorded.
The flashover development on the clean RTV coating with 50% environmental humidity is shown in Figure 20a. There is weak corona discharge in the high voltage electrode, showing as a light blue halo in Figure 20(a1). In Figure 20(a2–a5), there are glow discharge and glide discharge, and the discharge is also very weak. In Figure 20(a6), the discharge spark reached the grounding copper and the surface flashover occurred, the flashover voltage was 34 kV and the leakage current was 100 μA. It can also be seen from Figure 20(a6) that the arc channel is bright and unbranched, from the high-voltage electrode directly to the grounding copper plate.
The SiO2 with NSDD of 2.5 mg/cm2 and a particle size of 15 μm was smeared on the RTV-coated surface by the solid-layer method. The 3000 S/cm conductivity salt fog was injected into the fog chamber continuously until the relative humidity reached 90%.
The flashover process was recorded 40 min later, which is shown in Figure 20b. There was also light blue halo in the high electrode in Figure 20(b1). As shown in Figure 20(b2), obvious glow discharge appeared when the applied voltage reached 17 kV, and there were visible droplets in the discharge area. From Figure 20(b3–b5), when the applied voltage reached 24 kV, the glow discharge appeared brighter, and the leakage current increased gradually to 193 μA. As shown in Figure 20(b6), surface flashover occurred when the applied voltage reached 28 kV, accompanied by a significant sliding discharge and the leakage current increased to 512 μA.
By comparing the two cases of experimental phenomena, the surface flashover voltage of the RTV coating was reduced and the leakage current was increased by the haze-fog environment, illustrating that the insulating property of the RTV coating was affected by the haze-fog environment.
5. Conclusions
- (1)
- The main ion components from haze-fog atmospheric particles are NO3−, SO42−, NH4+, and Ca2+. More than 90% of the contamination particle sizes are within 50 μm. The amount of large particles on the AC line is greater than that of the DC line. The influence of DC polarity power source on the distribution of contamination particle size is not significant.
- (2)
- In haze-fog environment, the maximum ESDD and NSDD under DC positive polar power source are 0.306 mg/cm2 and 3.244 mg/cm2, respectively, the maximum ESDD and NSDD under DC negative polar power source are 0.279 mg/cm2 and 2.439 mg/cm2, respectively, the maximum ESDD and NSDD under AC power source are 0.249 mg/cm2 and 2.002 mg/cm2, respectively. The of DC(+), DC(−) and AC are 0.141 mg/cm2, 0.133 mg/cm2 and 0.111 mg/cm2, respectively. The of DC(+), DC(−) and AC are 1.376 mg/cm2, 1.356 mg/cm2 and 1.124 mg/cm2, respectively.
- (3)
- Under Haze-fog environment, the insulators are easily to accumulate droplets, causing a distortion of the electric field. The droplets on the RTV-coated surface would be deformed or moved due to the electric field, motion direction of which is from the strong electrical field to the weak electrical field. After the deformation or movement, a new triple junction point would be formed.
- (4)
- After the deposition of haze-fog, the local conductivity of the RTV-coated surface increased and reduced the flashover voltage, illustrating that the insulating property of the RTV coating was affected by the haze-fog environment.
- (5)
- Under haze-fog environment, it is essential to strengthen the line patrol and clean the contamination accumulated on insulator surface timely, especially the lower surface. The surface of insulators should be designed to be convenient for droplets to move from the area with strong electric field intensity to the area with weak electric field intensity, so as to break away from the RTV coating surface. Besides, the RTV coating with stronger hydrophobicity could be designed to flush the contamination on RTV coating surface by the own gravity of droplets.
Acknowledgments
Project supported by Science and Technology Project of State Grid Corporation of China (SGTYHT/15–JS–193).
Author Contributions
Ang Ren conceived and designed the experiments; Ang Ren wrote the paper, Hongshun Liu, Jianchun Wei and Qingquan Li revised it.
Conflicts of Interest
The authors declare no conflict of interest.
References
- Jose, S.; Gharai, B.; Kumar, Y.B.; Rao, P.V.N. Radiative implication of a haze event over Eastern India. Atmos. Pollut. Res. 2015, 6, 138–146. [Google Scholar] [CrossRef]
- Guo, Y.J.; Jiang, X.L.; Liu, Y.; Meng, Z.G.; Li, Z.Y. AC flashover characteristics of insulators under haze–fog environment. IET Gener. Transm. Distrib. 2016, 10, 3563–3569. [Google Scholar] [CrossRef]
- Yuan, Q.; Li, W.J.; Zhou, S.Z.; Yang, L.X.; Chi, J.W.; Sui, X.; Wang, W.X. Integrated evaluation of aerosols during haze–fog episodes at on regional background in North China Plain. Atmos. Res. 2015, 156, 102–110. [Google Scholar] [CrossRef]
- Zhang, Z.J.; You, J.W.; Wei, D.H.; Jiang, X.L.; Zhang, D.D.; Bi, M.Q. Investigations on AC pollution flashover performance of insulator string under different non-uniform pollution conditions. IET Gener. Transm. Distrib. 2016, 10, 437–443. [Google Scholar] [CrossRef]
- Zhang, D.D.; Zhang, Z.J.; Jiang, X.L.; Li, Y.F. Study on Insulator Flashover Voltage Gradient Correction Considering Soluble Pollution Constituents. Energies 2016, 9, 954. [Google Scholar] [CrossRef]
- Jiang, X.L.; Dong, B.B.; Hu, Q.; Yin, F.H.; Xiang, Z.; Shu, L.C. Effect of ultrasonic fog on AC flashover voltage of polluted porcelain and glass insulators. IEEE Trans. Dielectr. Electr. Insul. 2013, 20, 429–434. [Google Scholar] [CrossRef]
- Jiang, X.L.; Zhao, S.H.; Xie, Y.B.; Zhang, Z.J.; Shu, L.C. Study on fog flashover performance and fog-water conductivity correction coefficient for polluted insulators. IET Gener. Transm. Distrib. 2013, 7, 143–153. [Google Scholar]
- Jiang, X.L.; Xiang, Z.; Zhang, Z.J.; Hu, J.L.; Hu, Q.; Shu, L.C. AC pollution flashover performance and flashover process of glass insulators at high altitude site. IET Gener. Transm. Dis. 2014, 8, 495–502. [Google Scholar] [CrossRef]
- Arshad; Nekahi, A.; Mcmeekin, S.G.; Farzaneh, M. Flashover Characteristics of Silicone Rubber Sheets under Various Environmental Conditions. Energies 2016, 9, 683. [Google Scholar] [CrossRef]
- Joneidi, I.A.; Kamarposhti, M.A.; Akmal, A.A.S.; Mohseni, H. Leakage current analysis, FFT calculation and electric field distribution under water droplet on polluted silicon rubber insulator. Electr. Eng. 2013, 95, 315–323. [Google Scholar] [CrossRef]
- Souza, A.L.; Lopes, I.J.S. Experimental investigation of corona onset in contaminated polymer surfaces. IEEE Trans. Dielectr. Electr. Insul. 2015, 22, 1321–1331. [Google Scholar] [CrossRef]
- Xie, G.; He, F.; Liu, X.; Guo, D. Sessile multidroplets and salt droplets under high tangential electric fields. Sci. Rep. 2016, 6, 25002. [Google Scholar] [CrossRef] [PubMed]
- Li, J.; Wei, Y.; Huang, Z.Y.; Wang, F.P.; Yan, X.Z.; Wu, Z.L. Electrohydrodynamic behavior of water droplets on a horizontal super hydrophobic surface and its self-cleaning application. Appl. Surf. Sci. 2017, 403, 133–140. [Google Scholar] [CrossRef]
- Clayton, C.A.; Perritt, R.L.; Pellizzari, E.D.; Thomas, K.W.; Whitmore, R.W.; Wallace, L.A.; Ozkaynak, H.; Spengler, J.D. Particle Total Exposure Assessment Methodology (PTEAM) study: Distributions of aerosol and elemental concentrations in personal, indoor, and outdoor air samples in a southern California community. J. Exp. Anal. Environ. Epidemiol. 1993, 3, 227–250. [Google Scholar]
- Aaron, V.D.; Martin, R.V.; Michael, B.; Ralph, K.; Robert, L.; Carolyn, V.; Paul, J.V. Global Estimates of Ambient Fine Particulate Matter Concentrations from Satellite-Based Aerosol Optical Depth: Development and Application. Environ. Health Pers. 2010, 118, 847. [Google Scholar]
- Yan, W.; Yang, L.; Chen, J.; Wang, X.F.; Wen, L.; Zhao, T.; Wang, W.X. Aerosol Optical Properties at Urban and Coastal Sites in Northern China. Atmos. Res. 2017, 188, 39–47. [Google Scholar] [CrossRef]
- Lv, Y.; Li, J.; Zhang, X.; Pang, G.; Liu, Q. Simulation study on pollution accumulation characteristics of XP13-160 porcelain suspension disc insulators. IEEE Trans. Dielectr. Electr. Insul. 2016, 23, 2196–2206. [Google Scholar] [CrossRef]
- Ren, A.; Li, Q.Q.; Xiao, H.S. Influence Analysis and Prediction of ESDD and NSDD Based on Random Forests. Energies 2017, 10, 878. [Google Scholar] [CrossRef]
- International Electrotechnical Commission. Selection and Dimensioning of High–Voltage Insulators Intended for Use in Polluted Conditions; IEC/TS 60815; IEC: Geneva, Switzerland, 2008. [Google Scholar]
- Inamuddin; Luqman, M. Ion Exchange Technology II; Springer: Dordrecht, The Netherlands, 2012; pp. 97–107. [Google Scholar]
- International Electrotechnical Commission. Artificial Pollution Tests on High-Voltage Ceramic and Glass Insulators to be Used on a.c. Systems; IEC 60507; IEC: Geneva, Switzerland, 2013. [Google Scholar]
- International Electrotechnical Commission. International Standard: Artificial Pollution Tests on High-Voltage Ceramic and Glass Insulators to be Used on d.c. Systems; IEC: Geneva, Switzerland, 2015. [Google Scholar]
- Vlastos, A.E.; Sherif, E. Experience from insulators with RTV silicon rubber sheds and shed coatings. IEEE Trans. Power Deliv. 1990, 5, 2030–2038. [Google Scholar] [CrossRef]
- Dimitropoulou, M.; Pylarinos, D.; Siderakis, K.; Thalassinakis, E.; Danikas, M. Comparative Investigation of Pollution Accumulation and Natural Cleaning for Different HV Insulators. Eng. Technol. Appl. Sci. Res. 2015, 5, 764–774. [Google Scholar]
Figure 1.
Insulator sampling diagram of suspension insulators.

Figure 2.
Test circuit of surface discharge.

Figure 3.
The discharge model of Room Temperature Vulcanized (RTV)-coated surface.

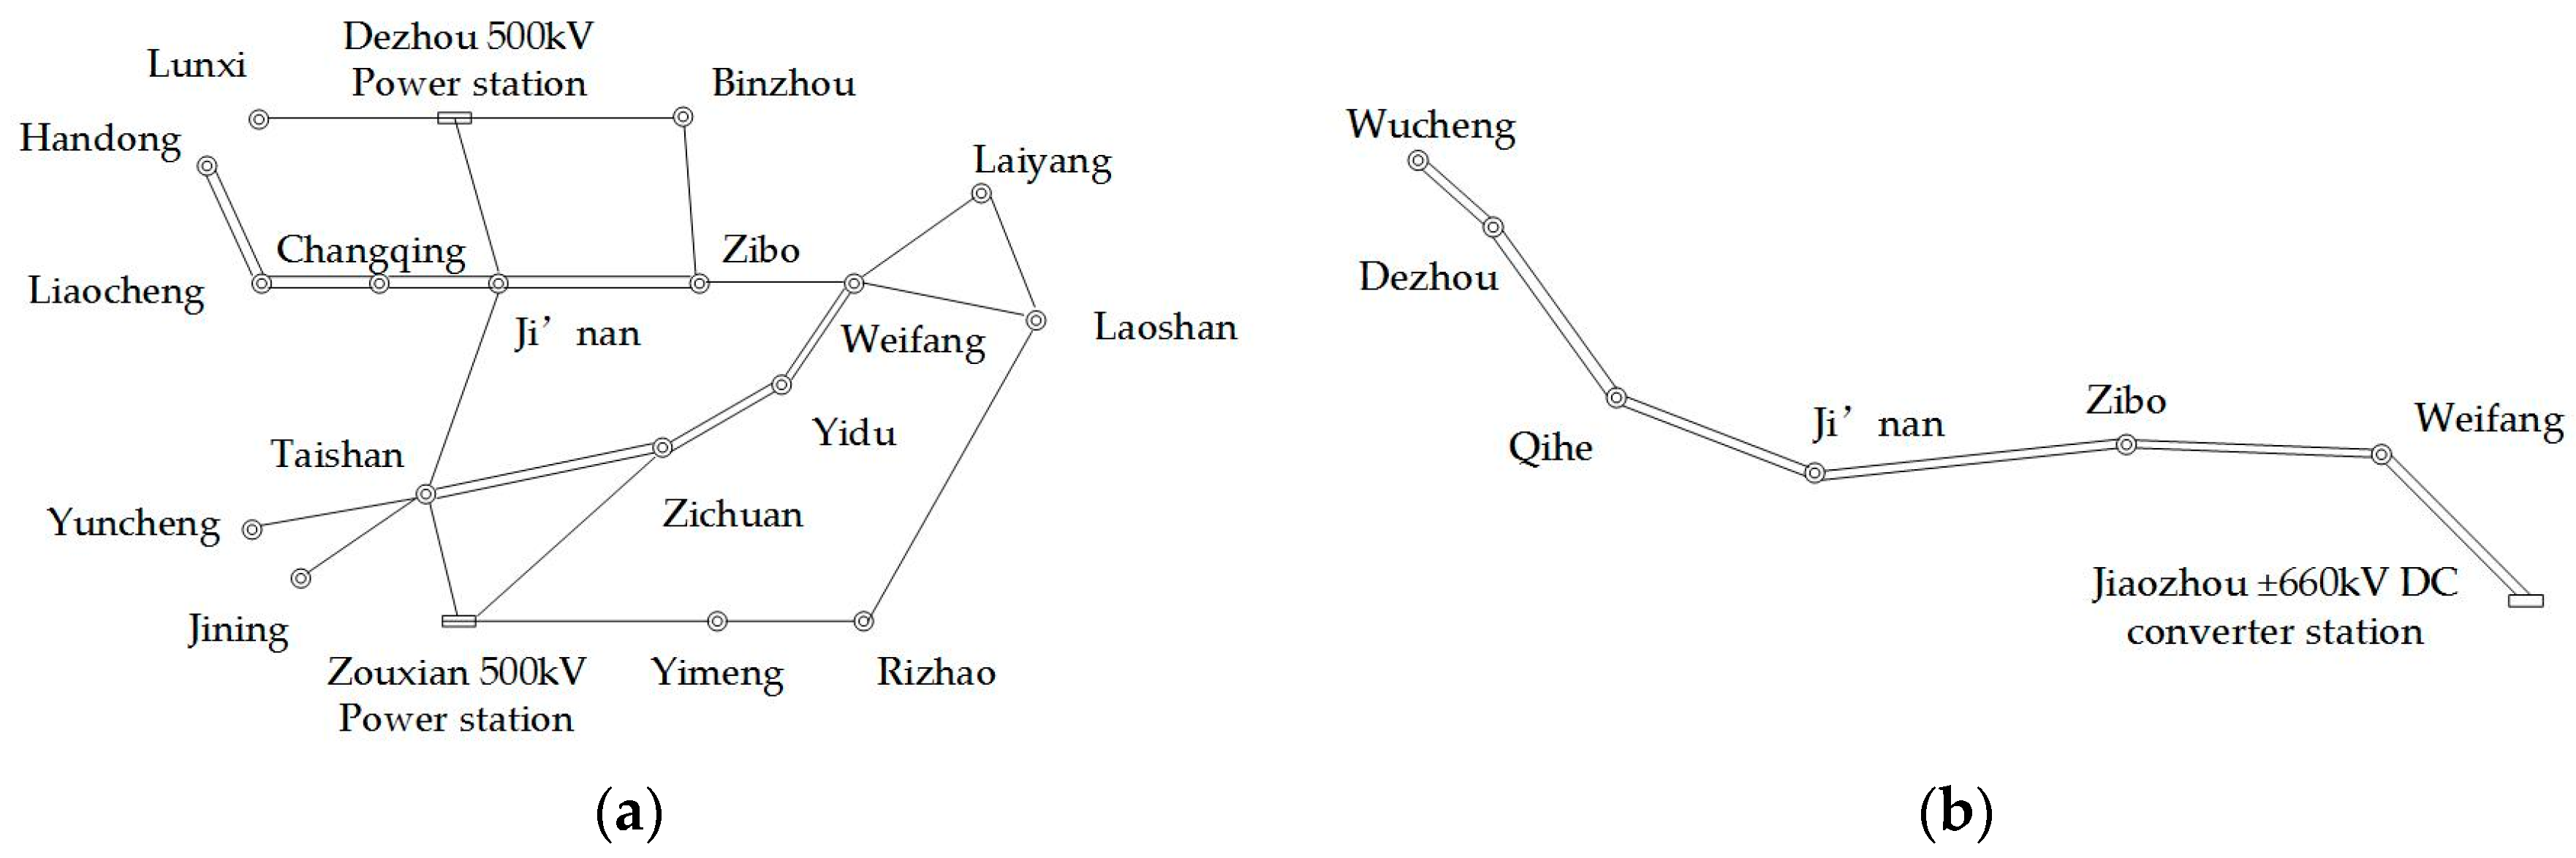
Figure 4.
Diagram of Shandong transmission line. (a) 500 kV. (b) ±660 kV.

Figure 5.
Sampling scene.
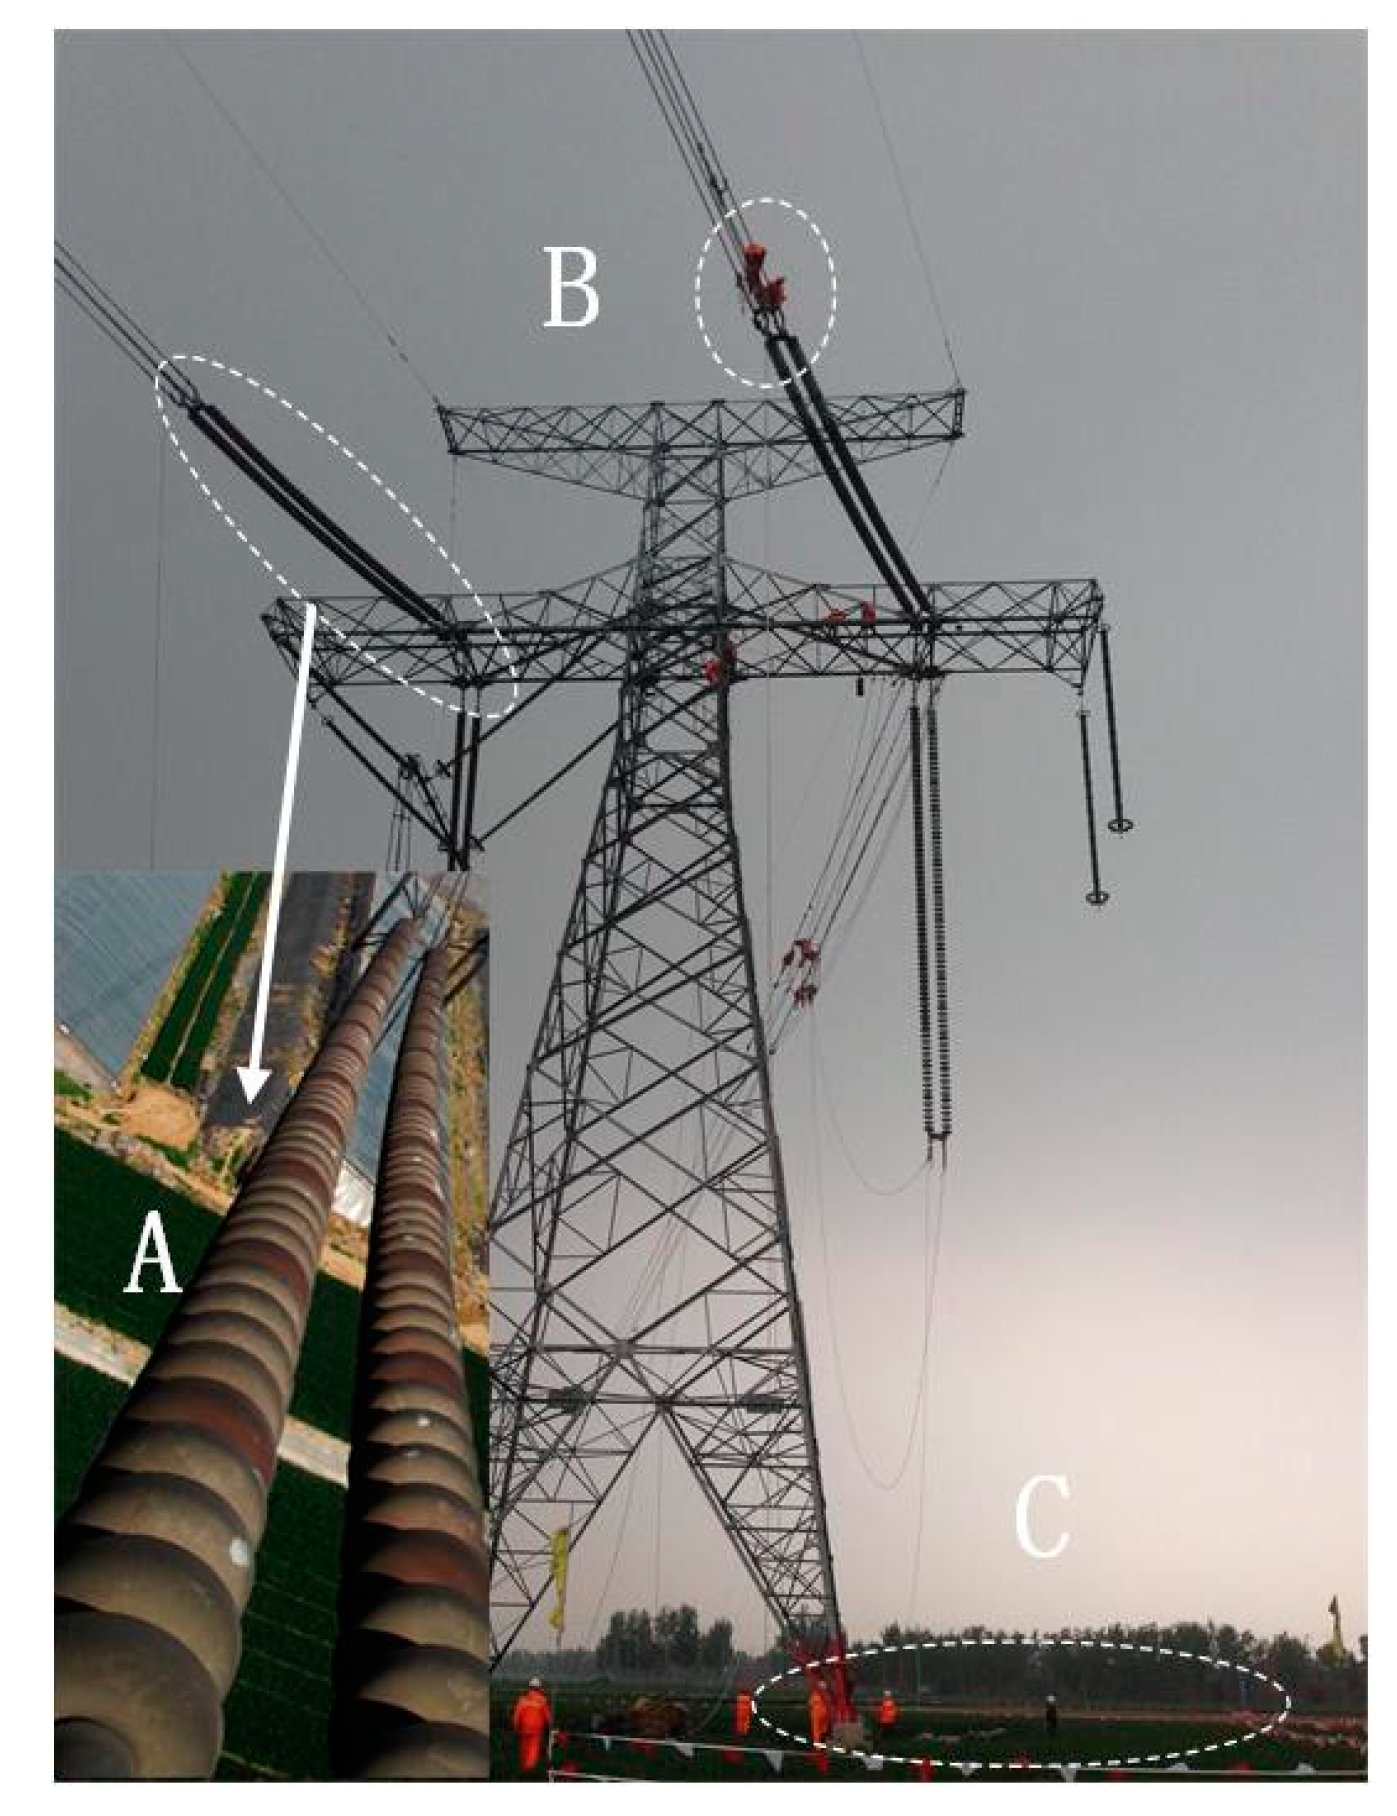
Figure 6.
Sampling results in 2015 and 2016. (a) 500 kV. (b) ±660 kV.

Figure 7.
The contamination of HVDC(+). (a) The results of equivalent salt deposit density (ESDD). (b) The results of non-soluble deposit density (NSDD).
Figure 7.
The contamination of HVDC(+). (a) The results of equivalent salt deposit density (ESDD). (b) The results of non-soluble deposit density (NSDD).

Figure 8.
The contamination of HVDC(−). (a) The results of ESDD. (b) The results of NSDD.

Figure 9.
The contamination of High Voltage Altanating Current (HVAC) insulators. (a) The results of ESDD. (b) The results of NSDD.
Figure 9.
The contamination of High Voltage Altanating Current (HVAC) insulators. (a) The results of ESDD. (b) The results of NSDD.

Figure 10.
The leakage current with different relative humidity.

Figure 11.
Surface flashover comparative test with traditional simulation contamination (a) change the soluble ingredients (b) change the insoluble ingredients
Figure 11.
Surface flashover comparative test with traditional simulation contamination (a) change the soluble ingredients (b) change the insoluble ingredients

Figure 12.
The distribution of electric field after applying droplets (gravels).

Figure 13.
The distribution of electric field.

Figure 14.
The deformation characteristic of droplet under DC positive polar power source.


Figure 15.
The movement characteristics of droplet under DC positive polar power source. (a) droplet without applied voltage (b) droplet begin to add voltage (c) droplet with voltage of 10 kV.
Figure 15.
The movement characteristics of droplet under DC positive polar power source. (a) droplet without applied voltage (b) droplet begin to add voltage (c) droplet with voltage of 10 kV.

Figure 16.
The deformation characteristic of droplet under DC negative polar power source.

Figure 17.
The movement characteristic of droplet under DC negative polar power source. (a) Droplet without applied voltage (b) droplet begin to add voltage (c) droplet with voltage of 10 kV.
Figure 17.
The movement characteristic of droplet under DC negative polar power source. (a) Droplet without applied voltage (b) droplet begin to add voltage (c) droplet with voltage of 10 kV.

Figure 18.
The deformation characteristics of droplet under AC power source.

Figure 19.
Surface flashover voltage with different conductivity. (a) DC(−). (b) AC.

Figure 20.
Flashover development (a) Clean RTV coating, 50% relative humidity. (b) Simulated haze-fog environment, 90% relative humidity.
Figure 20.
Flashover development (a) Clean RTV coating, 50% relative humidity. (b) Simulated haze-fog environment, 90% relative humidity.


Table 1.
The parameters of the suspension insulators.
| Insulator Type | Voltage Level (kV) | Leakage Distance (mm) | Upper Surface Areas (cm2) | Lower Surface Areas (cm2) |
|---|---|---|---|---|
| XWP2–160 | 500 | 450 (a piece) | 1551 | 1208 |
| FC160P | 500 | 550 (a piece) | 1198 | 2541 |
| FC160P/C170DC | ±660 | 550 (a piece) | 1800 | 2700 |
Table 2.
The concentrations of water-soluble inorganic ions from atmospheric particles (μg·m−3).
| Ions | PM2.5 | PM10 | ||||
|---|---|---|---|---|---|---|
| Maximum | Minimum | Average | Maximum | Minimum | Average | |
| NH4+ | 39.47 | 2.78 | 19.64 | 67.35 | 3.10 | 10.84 |
| Na+ | 2.35 | 0.37 | 1.59 | 3.40 | 0.35 | 1.95 |
| K+ | 5.24 | 0.24 | 1.92 | 4.98 | 0.36 | 2.59 |
| Ca2+ | 16.94 | 0.63 | 5.90 | 21.23 | 1.57 | 10.32 |
| Mg+ | 0.81 | 0.15 | 0.38 | 1.10 | 0.38 | 0.65 |
| NO3− | 48.26 | 2.16 | 18.98 | 80.88 | 6.08 | 33.05 |
| SO42− | 59.1 | 5.61 | 15.62 | 92.86 | 5.66 | 31.67 |
| Cl− | 20 | 0.82 | 3.32 | 18.40 | 1.10 | 6.07 |
Table 3.
Particle size of the contamination.
| Voltage Type | D10 (μm) | D50 (μm) | D90 (μm) | P<3 (%) | P<20 (%) | P<40 (%) |
|---|---|---|---|---|---|---|
| DC(+) | 5.66 | 14.63 | 34.41 | 2.56 | 66.32 | 93.90 |
| DC(−) | 5.27 | 13.59 | 33.37 | 2.88 | 70.09 | 94.25 |
| AC | 6.11 | 34.32 | 57.88 | 2.25 | 42.44 | 84.35 |
Table 4.
The ESDD and NSDD of insulators.
| Voltage Type | Mean (mg/cm2) | Standard Deviation | Max (mg/cm2) | |||||||||
|---|---|---|---|---|---|---|---|---|---|---|---|---|
| Upper Surface | Lower Surface | ESDD | NSDD | Upper Surface | Lower Surface | ESDD | NSDD | |||||
| ESDD | NSDD | ESDD | NSDD | ESDD | NSDD | ESDD | NSDD | |||||
| DC(+) | 0.035 | 0.361 | 0.211 | 2.052 | 0.141 | 1.376 | 0.007 | 0.138 | 0.038 | 0.426 | 0.306 | 3.244 |
| DC(−) | 0.047 | 0.491 | 0.191 | 1.932 | 0.133 | 1.356 | 0.012 | 0.153 | 0.028 | 0.248 | 0.279 | 2.439 |
| AC | 0.056 | 0.814 | 0.149 | 1.339 | 0.111 | 1.124 | 0.013 | 0.159 | 0.045 | 0.466 | 0.249 | 2.002 |
Table 5.
The contamination parameters.
| Voltage Type | (μS/cm) | ESDD (mg/cm2) | NSDD (mg/cm2) |
|---|---|---|---|
| DC(+) | 1380 | 0.141 | 1.376 |
| DC(−) | 1250 | 0.133 | 1.356 |
| AC | 950 | 0.111 | 1.124 |
© 2017 by the authors. Licensee MDPI, Basel, Switzerland. This article is an open access article distributed under the terms and conditions of the Creative Commons Attribution (CC BY) license (http://creativecommons.org/licenses/by/4.0/).
Share and Cite
MDPI and ACS Style
Ren, A.; Liu, H.; Wei, J.; Li, Q. Natural Contamination and Surface Flashover on Silicone Rubber Surface under Haze–Fog Environment. Energies 2017, 10, 1580. https://doi.org/10.3390/en10101580
AMA Style
Ren A, Liu H, Wei J, Li Q. Natural Contamination and Surface Flashover on Silicone Rubber Surface under Haze–Fog Environment. Energies. 2017; 10(10):1580. https://doi.org/10.3390/en10101580
Chicago/Turabian StyleRen, Ang, Hongshun Liu, Jianchun Wei, and Qingquan Li. 2017. "Natural Contamination and Surface Flashover on Silicone Rubber Surface under Haze–Fog Environment" Energies 10, no. 10: 1580. https://doi.org/10.3390/en10101580
Note that from the first issue of 2016, this journal uses article numbers instead of page numbers. See further details here.