
Energy Consumption and Energy-Related CO2 Emissions from China’s Petrochemical Industry Based on an Environmental Input-Output Life Cycle Assessment

1
School of Business Administration, China University of Petroleum-Beijing, Beijing 102249, China
2
Energy and Resources Group, University of California-Berkeley, Berkeley, CA 94720, USA
*
Author to whom correspondence should be addressed.
Energies 2017, 10(10), 1585; https://doi.org/10.3390/en10101585
Submission received: 4 September 2017
/
Revised: 25 September 2017
/
Accepted: 29 September 2017
/
Published: 12 October 2017
Abstract
:The fast-growing petrochemical industry is one of the largest energy consumers and emitters in China, exerting a strong impact on the national economic, energy and environmental systems. We provide a holistic picture of energy consumption and energy-related CO2 emissions from China’s petrochemical industry in 2012 through an environmental input-output life-cycle assessment (EIO-LCA). We combine two perspectives: (1) direct energy consumption and emissions, and (2) the indirect energy and emissions embodied and reallocated from other sectors in the supply chain to satisfy final demand in the petrochemical industry. Results indicate that the total of its direct and indirect energy consumption and CO2 emissions accounts for approximately 32% and 18% of China’s industrial total, respectively, exerting high “influence” and “induction” with regards to the rest of the economic sectors. Most of the petrochemical industry’s embodied energy and CO2 emissions comes from the “Production and Supply of Electric and Heat Power”. We also identified five other sectors key to China’s energy conservation and CO2 mitigation efforts due to their high influence and induction effects: “Smelting and Pressing of Ferrous Metals”, “Manufacture of Non-metallic Mineral Products”, “Smelting and Pressing of Non-ferrous Metals”, “Transport, Storage and Post”, and “Mining and Washing of Coal”. A systematic view of direct and indirect energy, environmental relationships, and the conveying effects among sectors is crucial for policymaking in China to achieve its energy and mitigation goals.
1. Introduction
The Paris Climate Agreement of 2016 requires collaborative endeavors to limit global warming to “well below” 2 degrees Celsius. China is under pressure in the international arena to respond to this challenge, being the world’s largest energy consumer, with a coal-dominated energy structure, and the largest carbon emitter. Its energy consumption totaled 4.3 billion tons of coal equivalent in 2015, of which 64% is coal [1]. Industrial sectors are responsible for approximately 70% of the energy consumption in the nearly two five-year plan (FYP) periods (2006–2014) [2].
Domestic environmental issues and weather events draw the government’s attention to energy conservation and emissions mitigation [3]. In the most recently released work plan for greenhouse gas emissions control by the State Council, the government discussed its future efforts to change energy system structures and hold carbon emissions to a peak in 2030 [4].
The petrochemical industry, a “pillar industry” for China, is also its main energy consumer and CO2 emitter, with 340 of its enterprises listed among the nation’s 1000 key energy consumers by National Development and Reform Commission (NDRC), and should draw deep attentions from the government with their energy and emission reduction. It is comprised of five subsectors that include the “Extraction of Petroleum and Natural Gas” (EPNG); “Processing of Petroleum, Coking and Processing of Nuclear Fuel” (PCNF); “Manufacture of Raw Chemical Materials and Chemical Products” (RCCP); “Manufacture of Chemical Fibers” (CF); and “Manufacture of Rubber and Plastics Products” (RPP), according to the national economic industry classification standard [5]. Those subsectors are not only highly interrelated in their production and demand, but also exert strong impact on the rest of the economy, and its energy and emissions, through their high “influence” and “induction” effects on other sectors. The “influence” effect is referred to as the level of backward linkage a certain sector has to the rest (the extent of changes on all other sectors corresponding to the change of demand of the one under examination); the greater the influence coefficient, the greater the pulling power of the examined sector upon others. Meanwhile, the “induction” effect describes the level of forward linkages (changes received by a given sector corresponding to the changes in all other sectors affecting demand in the given one); the greater the induction coefficient, the greater the pushing power of the rest sectors on the one under examination [6].
It is particularly important to study the energy consumption and CO2 emissions of this industry by incorporating its highly correlative economic, energy and environmental relationship with other sectors in China’s economic system, exposing conveying effects and mechanisms, and the industry’s impact across the entire economy regarding energy and emissions. The results will provide energy and emissions policymaking with a systematic view, as well as evidence for the related clarification of responsibilities and enactment of targets. An environmental input-output life-cycle assessment (EIO-LCA) model was used to conduct research toward this purpose.
This paper provides a holistic picture of the petrochemical industry’s energy consumption and CO2 emissions in 2012, presenting not only the direct energy consumption and energy related CO2 emissions, but also the indirect amounts that can be tracked throughout the supply chain by using an EIO-LCA model from both production and demand perspectives. This paper also provides a systematic view of the responsibilities among sectors, by incorporating complex economic, energy and environmental relationships and levels of impact through assessment of all China’s economic sectors, identifying key sectors that should receive attention to achieve China’s energy conservation and emission mitigation targets.
2. Literature Review
2.1. Review on the Development of Petrochemical Industry in China
The Chinese petrochemical industry has grown rapidly, with an average annual growth rate for gross output at 22.3% in the 11th FYP period, with 9% (gross output) and 9.4% (value added) of growth rates over the 12th FYP period [7,8]. It also saw rapid growth in energy consumption, at an average annual rate of over 7% for gross energy consumption, from 449.27 Mtce in 2006 to 783.02 Mtce in 2014 [2]. Fossil energy is the dominant source for this industry, as seen from its final energy structure in 2012 shown in Figure 1.
Considering the upward growth tendency of the petrochemical industry projected by Ministry of Industry and Information Technology (MITT) (8% average annual growth for 2016–2020), its impact on China’s national economy, energy and emissions will strengthen. Given this, strict targets have been stipulated by MITT for this industry: reducing its energy intensity and CO2 emissions by 18% by the end of 2020 [8].
2.2. Review on Methods
The IO model was introduced by Leontief, who treated pollutants as the by-product of regular economic activities, representing them in vectors of input-output tables [9]. It is useful in studying the relationship among sectors [10]. Hendrickson et al. incorporated an IO model into environmental life cycle assessment (LCA), creating an environmental impact coefficient matrix—a diagonal matrix that enables the tracking of environmental outputs caused by final demand to various sectors through production chains [11]. Researchers have previously used EIO-LCA in studies on China’s energy consumption and carbon emissions. For instance, Shui and Harriss found that 7–14% of total Chinese CO2 emissions were exported to the US through trade [12]. Zhang et al. found that indirect amounts account for a large percentage of total household energy consumption (69–77%) and emissions (77–84%) [13].
Emissions studies on the petrochemical industry have generally used a direct calculation method: Li and Fan and Fan et al. found that direct emissions from 2001 to 2010 increased by 81.3 Mtn, and they decomposed the drivers for those direct CO2 emissions [14,15]. Yet the EIO-LCA model, recent IO tables published by National Bureau of Statistics (NBS), and sectorial energy data provide us with the space in this research to perform an in-depth look at the embodied energy and emissions of petrochemical industry, the contributions of each sectors, and the influence and induction effects among sectors regarding energy consumption and CO2 emissions reduction in China.
3. Methodology and Data
Data used on output is from the 2012 China Input-Output table published by the NBS; the economic sectors are reclassified from 139 to 42 to reconcile the difference of classification between the tables and yearbooks—and to achieve as accurate an estimation as possible—as presented in Appendix A. Data used on direct energy consumption and final energy consumption to calculated CO2 emissions is from the China energy statistical yearbook, and energy balance sheets, while the emissions factors are selected from the 2006 IPCC, except for coal, which is from Liu et al. [16,17]. For calculating CO2 emissions for each sector, consumption of 23 fossil energy sources are counted: Coal, Coke, Coke Oven Gas, Blast Furnace Gas, Converter Gas, Other Gas, Other Coking Products, Crude Oil, Gasoline, Kerosene, Diesel Oil, Fuel Oil, Naphtha, Lubricants, Paraffin Waxes, White Spirit, Bitumen Asphalt, Petroleum Coke, LPG, Refinery Gas, Other Petroleum Products, Natural Gas, and LNG. Heat and electricity consumed in each sector are included in direct energy consumption, but since they do not produce CO2 emissions directly (see Zhang et al. [13]), they were not calculated in the direct CO2 emissions calculation, but as the indirect part that can be traced from heat and electric power sectors (the energy consumption used for calculating CO2 emissions of heat and electric power sectors is composed of both final energy consumption and power supply consumption as shown in energy balance sheet).
3.1. Estimation of Indirect Energy Consumption from Final Demand, Assessment of the Influence and Induction Coefficients of Energy Consumption
Start from the basic Leontief demand side model in monetary Input-Output tables:
where represents the total output column vector, , is the column vector of final demand of all 42 sectors, , is the unit matrix, is the direct consumption coefficient matrix, and is the Leontief inverse matrix, which is also seen as the complete demand coefficient matrix.
Following Hendrickson et al. [11] and Wang et al. [18]:
where presents the direct energy consumption of sector i, presents the output of sector i, and is the direct energy intensity of sector i. is a diagonal matrix.
, is the complete energy consumption demand coefficient matrix:
From the perspective of columns in , is the complete energy consumption demand for sector j, which is the amount of total corresponding energy consumption increases across all sectors when the final demand of sector j increases by 1 unit.
From the perspective of rows in , is the complete energy consumption supply from sector i, which is the required amount of energy consumption increase of sector i when final demand of all sectors increases by 1 unit. Meanwhile, and scribe the influence and induction effects of energy consumption from final demand, respectively, which are different from traditional economic input-output influence and induction coefficients in that the calculations are based on the matrix instead of the matrix.
, the indirect energy consumption for sector j from final demand, can be calculated as follows:
It can be noted that the total direct energy consumption from all sectors and the indirect energy consumption from final demand are equal [19].
3.2. Estimation of Indirect CO2 Emissions, Assessment of the Influence and Induction Coefficients of CO2 Emissions
According to IPCC [16] and Wei et al., the calculation of carbon dioxide emissions can be specified as in Equation (7) [20]:
where is the direct CO2 emissions from sector i. Final energy consumption is used to describe for sector i’s consumption on energy source k, is in standard coal equivalent units, represents the caloric value per unit of coal equivalent, is the carbon emissions factor for energy source k, is the molecular weight ratio of carbon dioxide to carbon, and is the oxidation rate of energy source k used for sector i:
Above, is the direct CO2 emissions intensity of sector i, while is a diagonal matrix. , is the complete CO2 emissions demand coefficient matrix:
From the perspective of columns in , is the complete CO2 emissions demand for sector j, which is the amount of total corresponding CO2 emissions increases across all sectors when the final demand of sector j increases by 1 unit.
From the perspective of rows in , is the complete CO2 emissions supply from sector i, which is the required amount of CO2 emissions increase of sector i when the final demand of all sectors increases by 1 unit. Meanwhile, and describe the influence and induction effects of CO2 emissions from final demand, respectively.
, the indirect CO2 emissions of sector j from final demand can be calculated as follows:
4. Results and Discussions
For 2012, the total (direct and indirect) energy consumption of the petrochemical industry is estimated at 920.84 Mtce, with the indirect portion making up 23% (207.70 Mtce); this accounts for 32% of industrial energy consumption. The total (direct and indirect) CO2 emissions of petrochemical industry are estimated at 1400.80 Mtn, with the indirect portion making up 32% (449.36 Mtn); this accounts for 18% of China’s industrial energy-related CO2 emissions. Neglecting these indirect portions leads to underestimation of the impact of the petrochemical industry in both total energy consumption and CO2 emissions, undermining efforts toward energy conservation and CO2 mitigation targets.
As shown in Figure 2 and Figure 3, within the broader petrochemical industry the RCCP subsector has the largest totals for energy consumption and CO2 emissions, with relatively large indirect energy consumption and CO2 emissions.
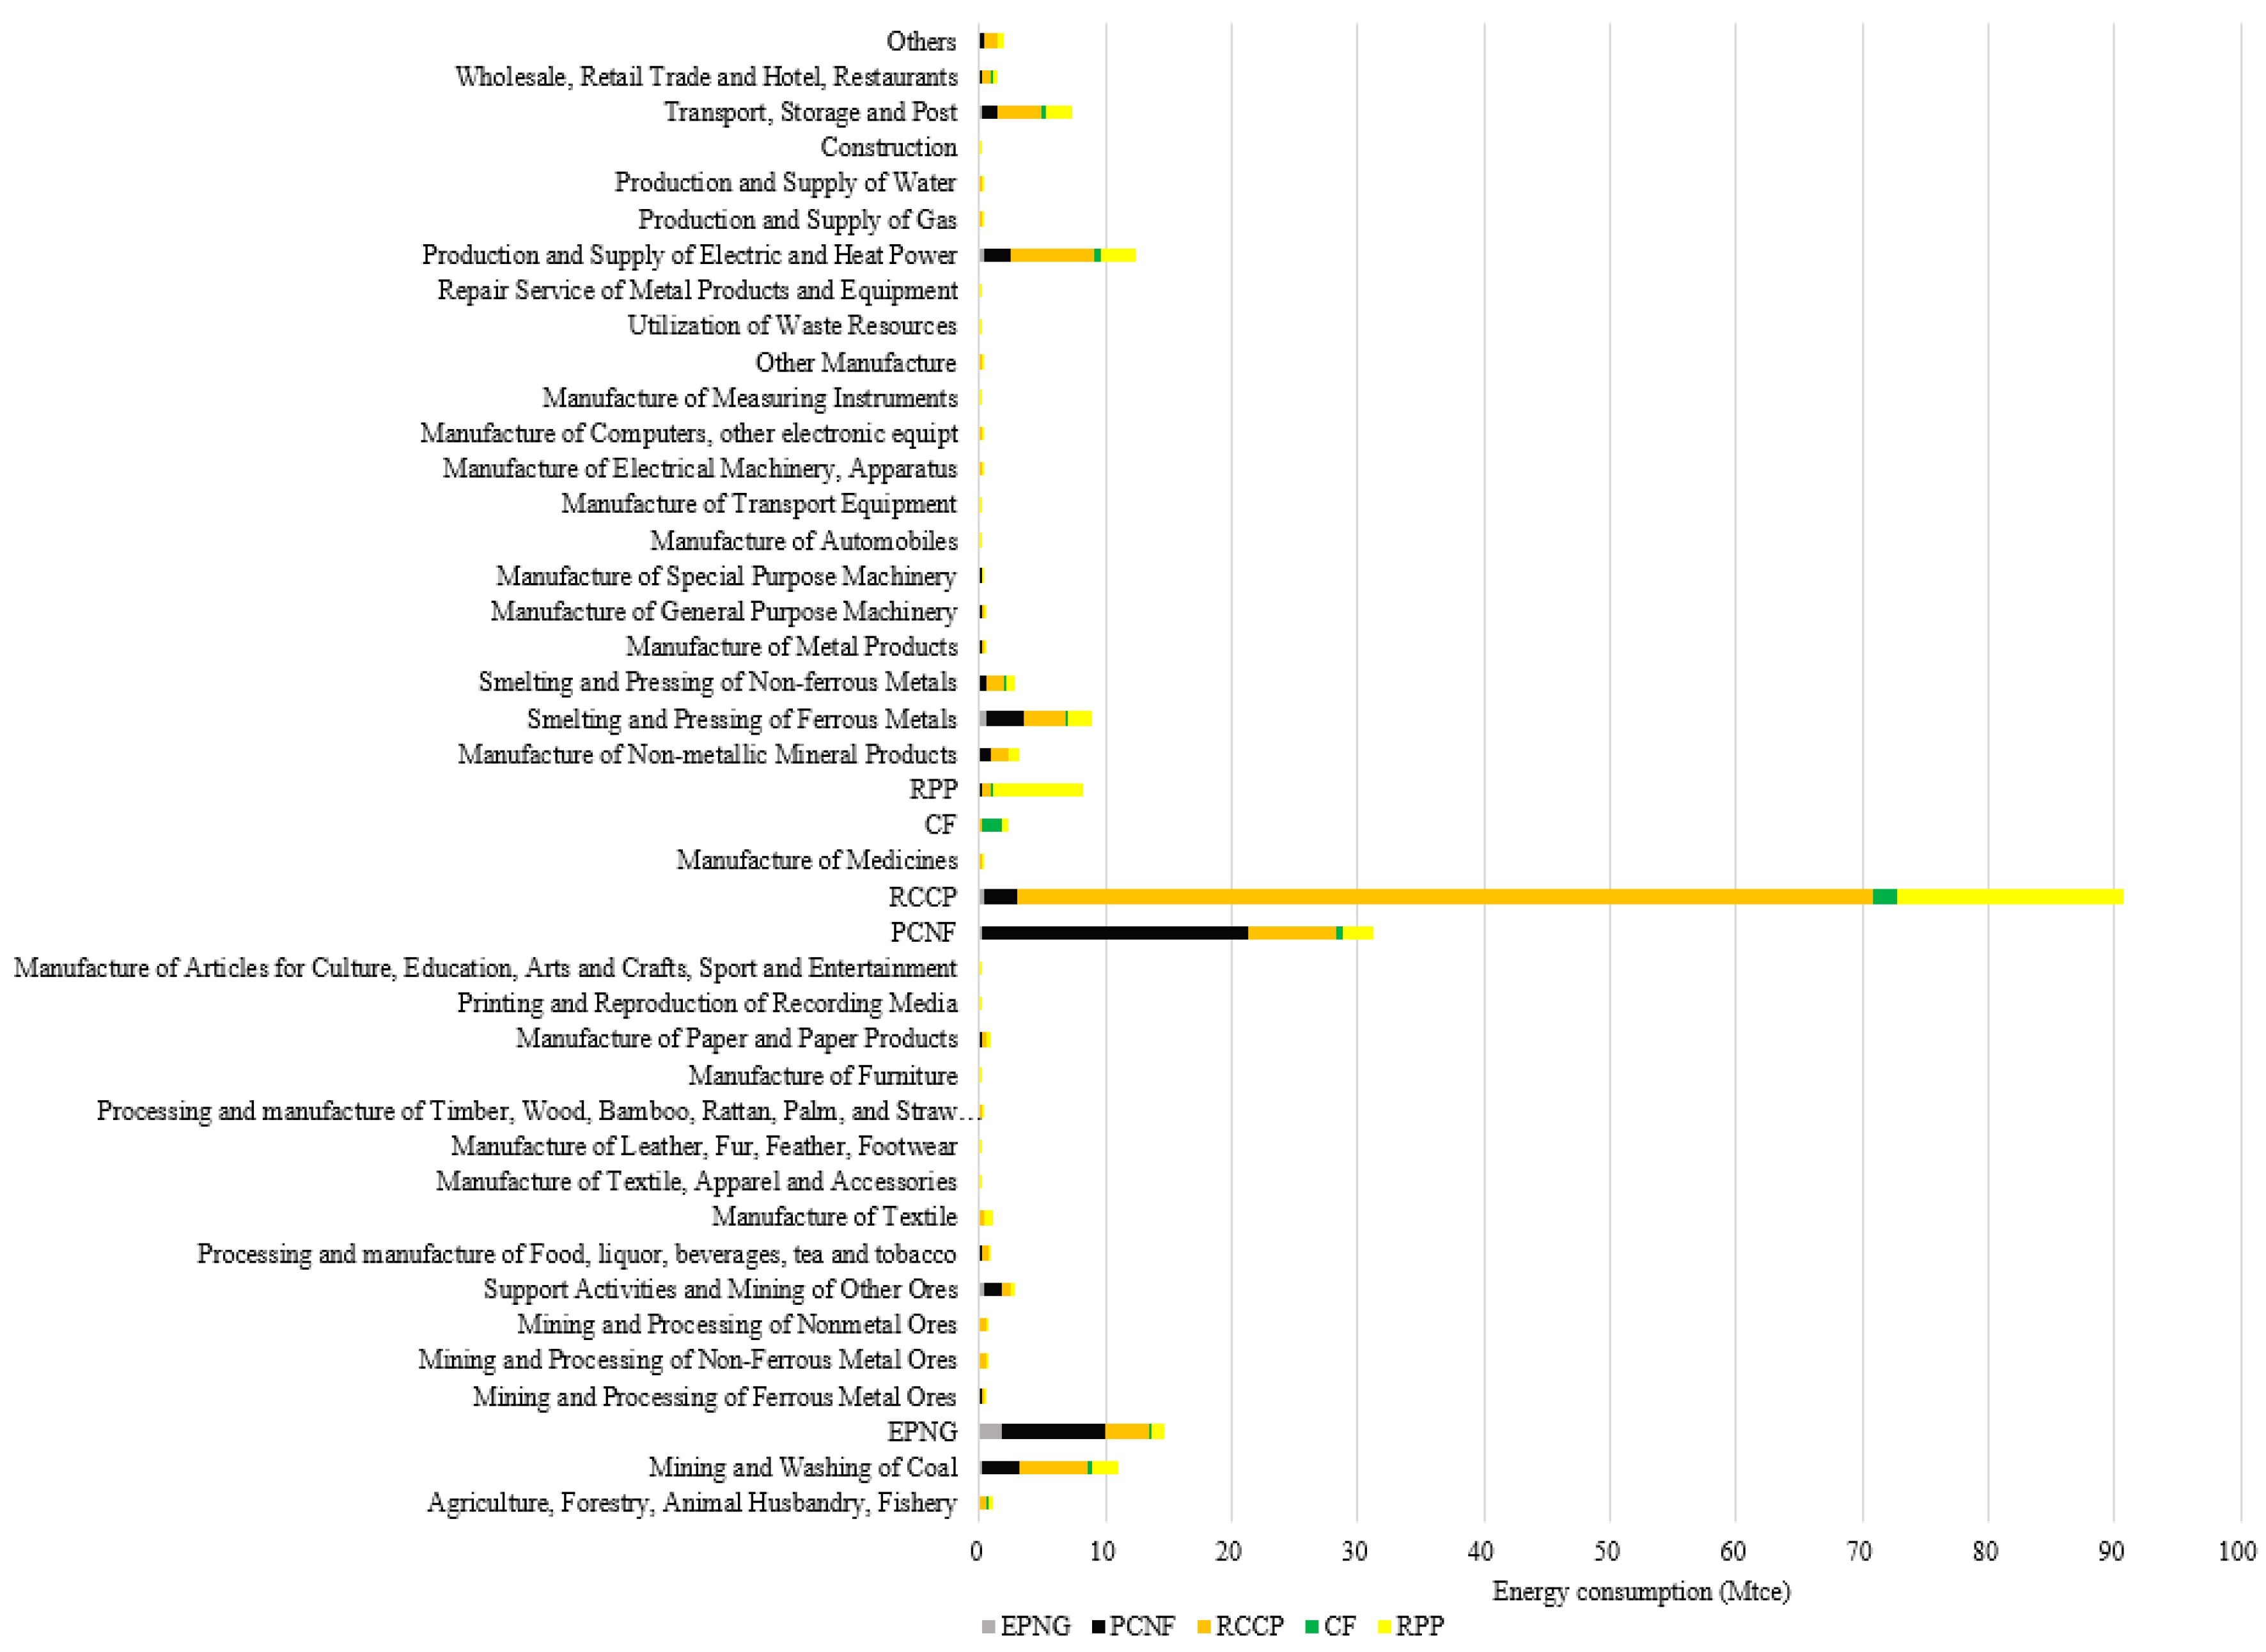
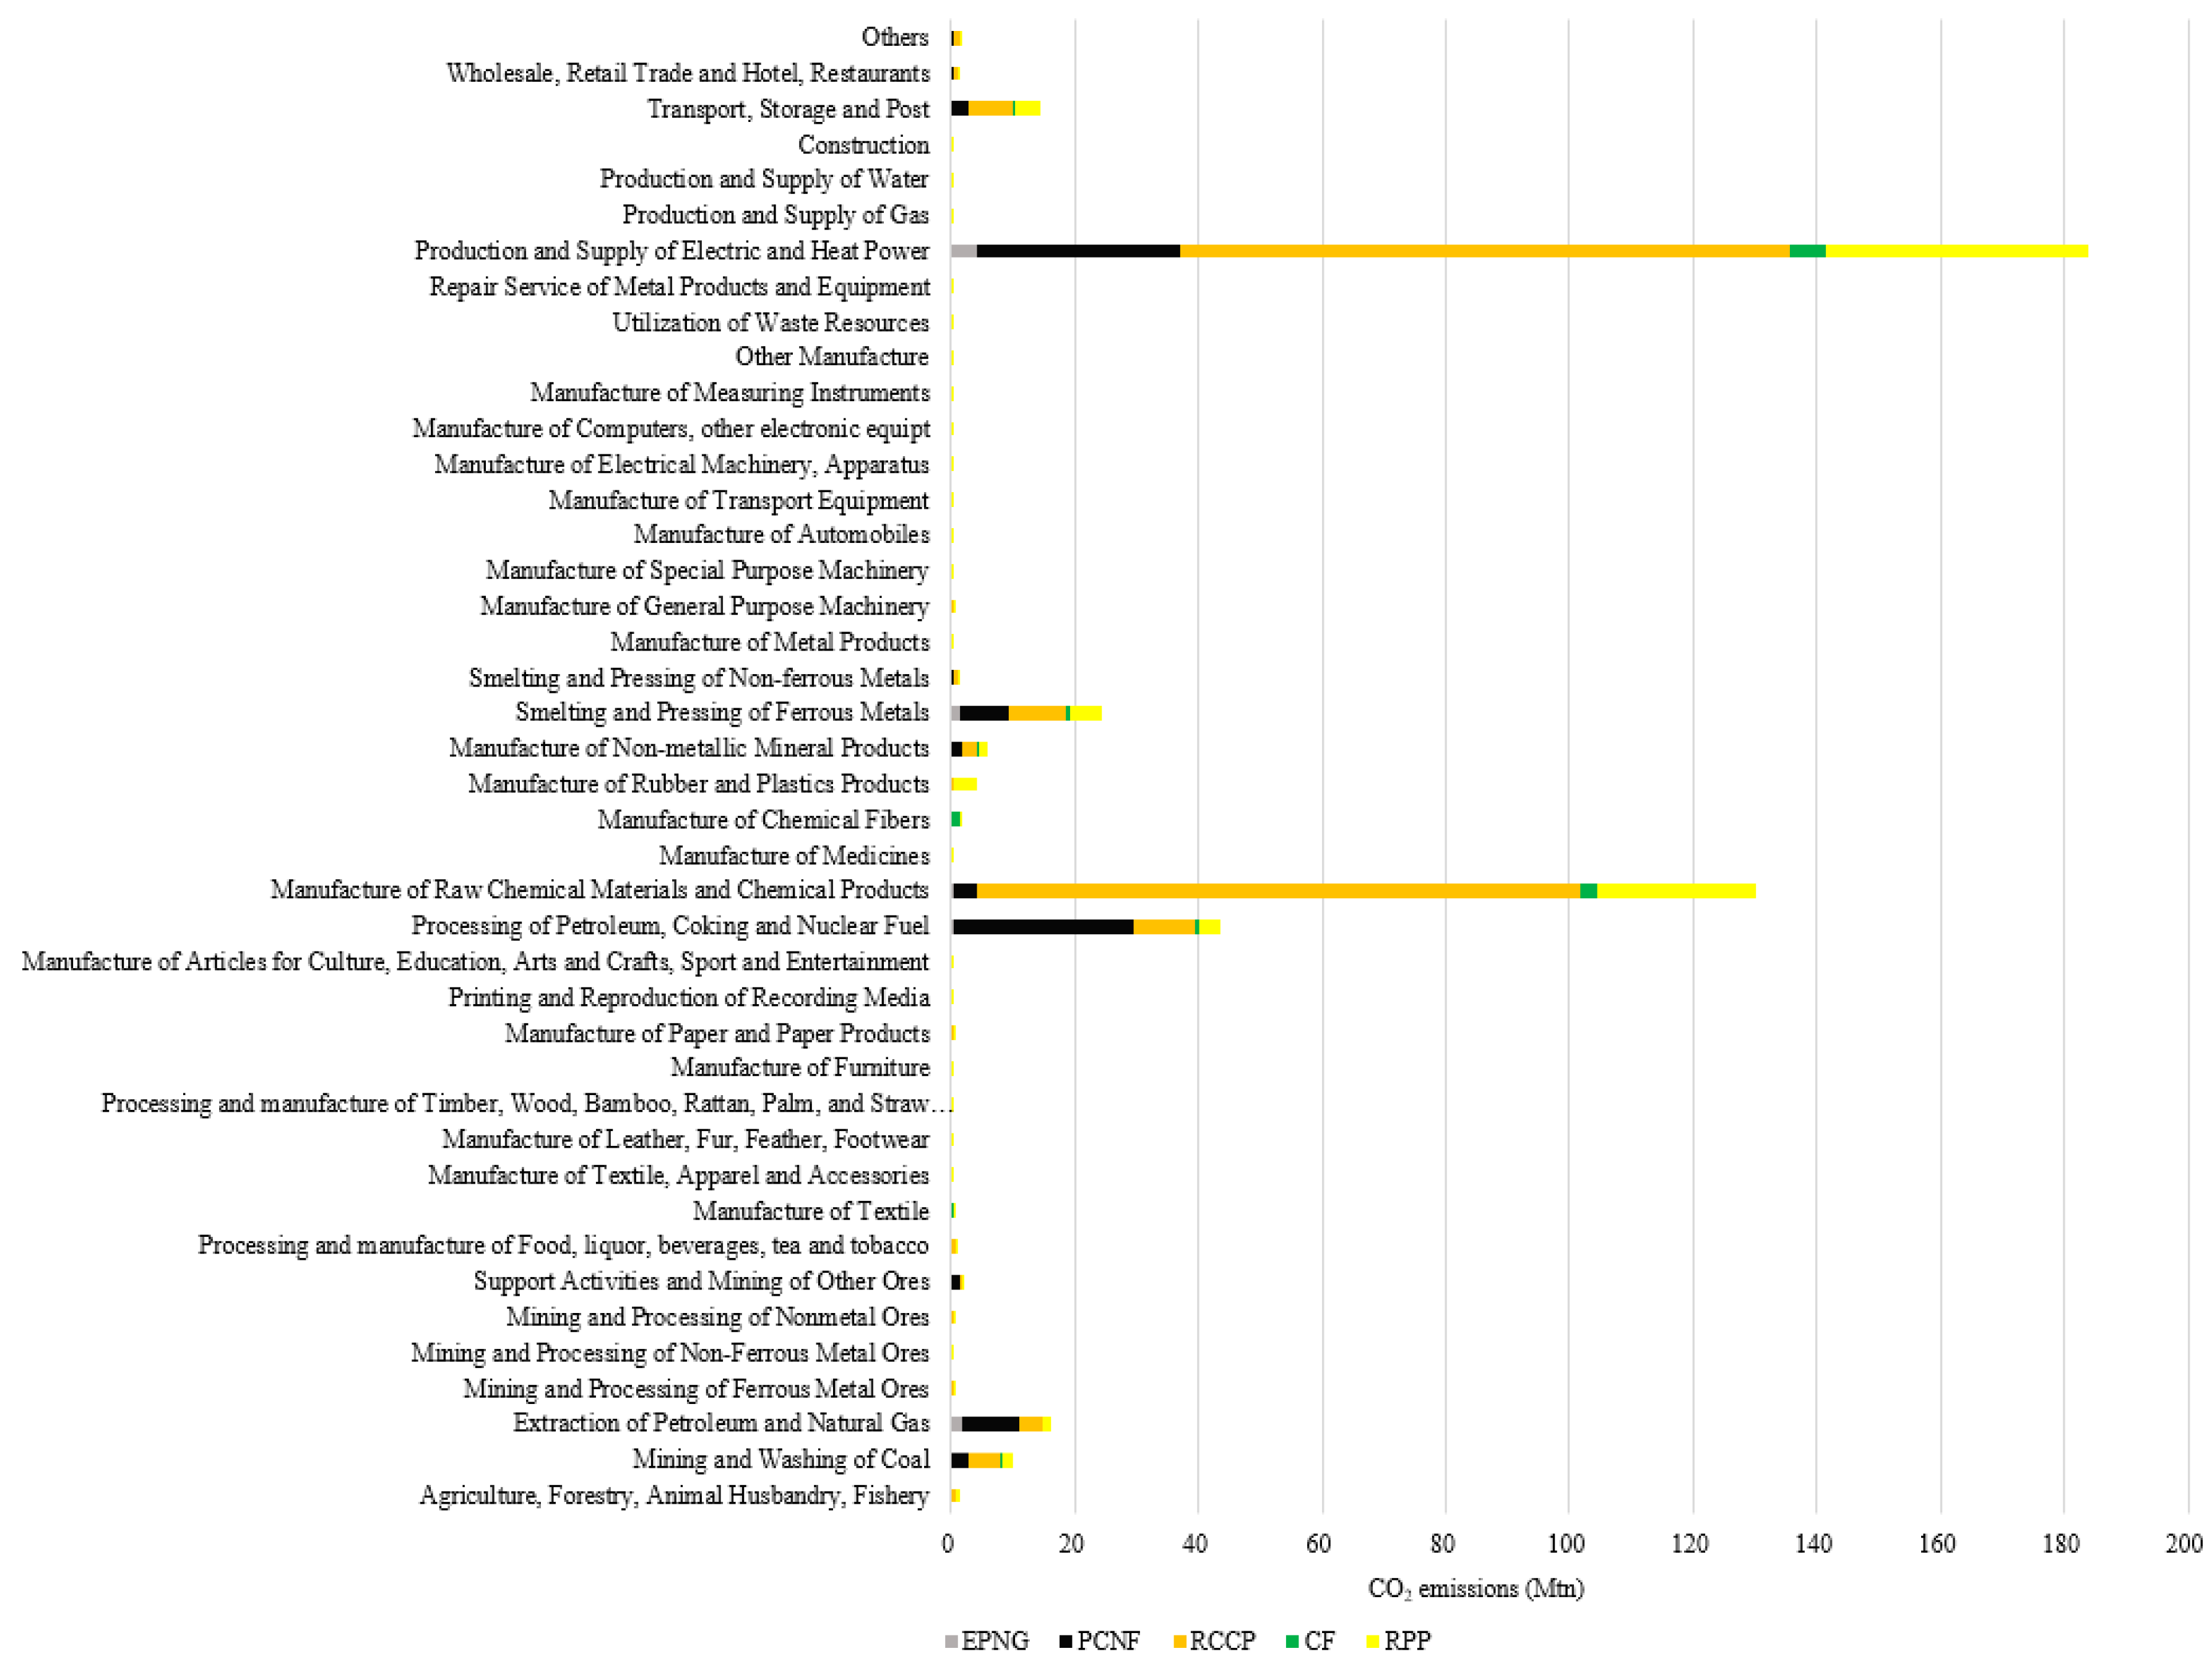
We analyze the composition of indirect energy consumption and CO2 emissions attributable to the petrochemical industry further below, to present a whole picture of energy use and CO2 emissions conveyed from other sectors to the five petrochemical subsectors to satisfy final demand. The identified contributions of all 42 sectors to the indirect energy consumption and CO2 emissions of the petrochemical industry are shown in Figure 4 and Figure 5.
The “Production and Supply of Electric and Heat Power” sector contributed the most (other than the petrochemical industry itself) at 12.37 Mtce to the indirect energy consumption of the petrochemical industry, followed by the “Mining and Washing of Coal” sector (11.07 Mtce) and “Smelting and Pressing of Ferrous Metals” sector (8.89 Mtce). The “Production and Supply of Electric and Heat Power” sector also contributed the most, at 183.96 Mtn, to the indirect CO2 emissions of petrochemical industry, followed by the “Smelting and Pressing of Ferrous Metals” sector (24.52 Mtn), and “Transport, Storage and Post” sector (14.49 Mtn). The large portion of indirect contribution from the “Production and Supply of Electric and Heat Power” sector can be attributed to high energy consumption and CO2 emissions based on a coal-dominant fuel structure (over 90%) and its high level of influence and induction effects that can be seen from Figure 6, making it the central piece of China’s fossil-emissions economy.
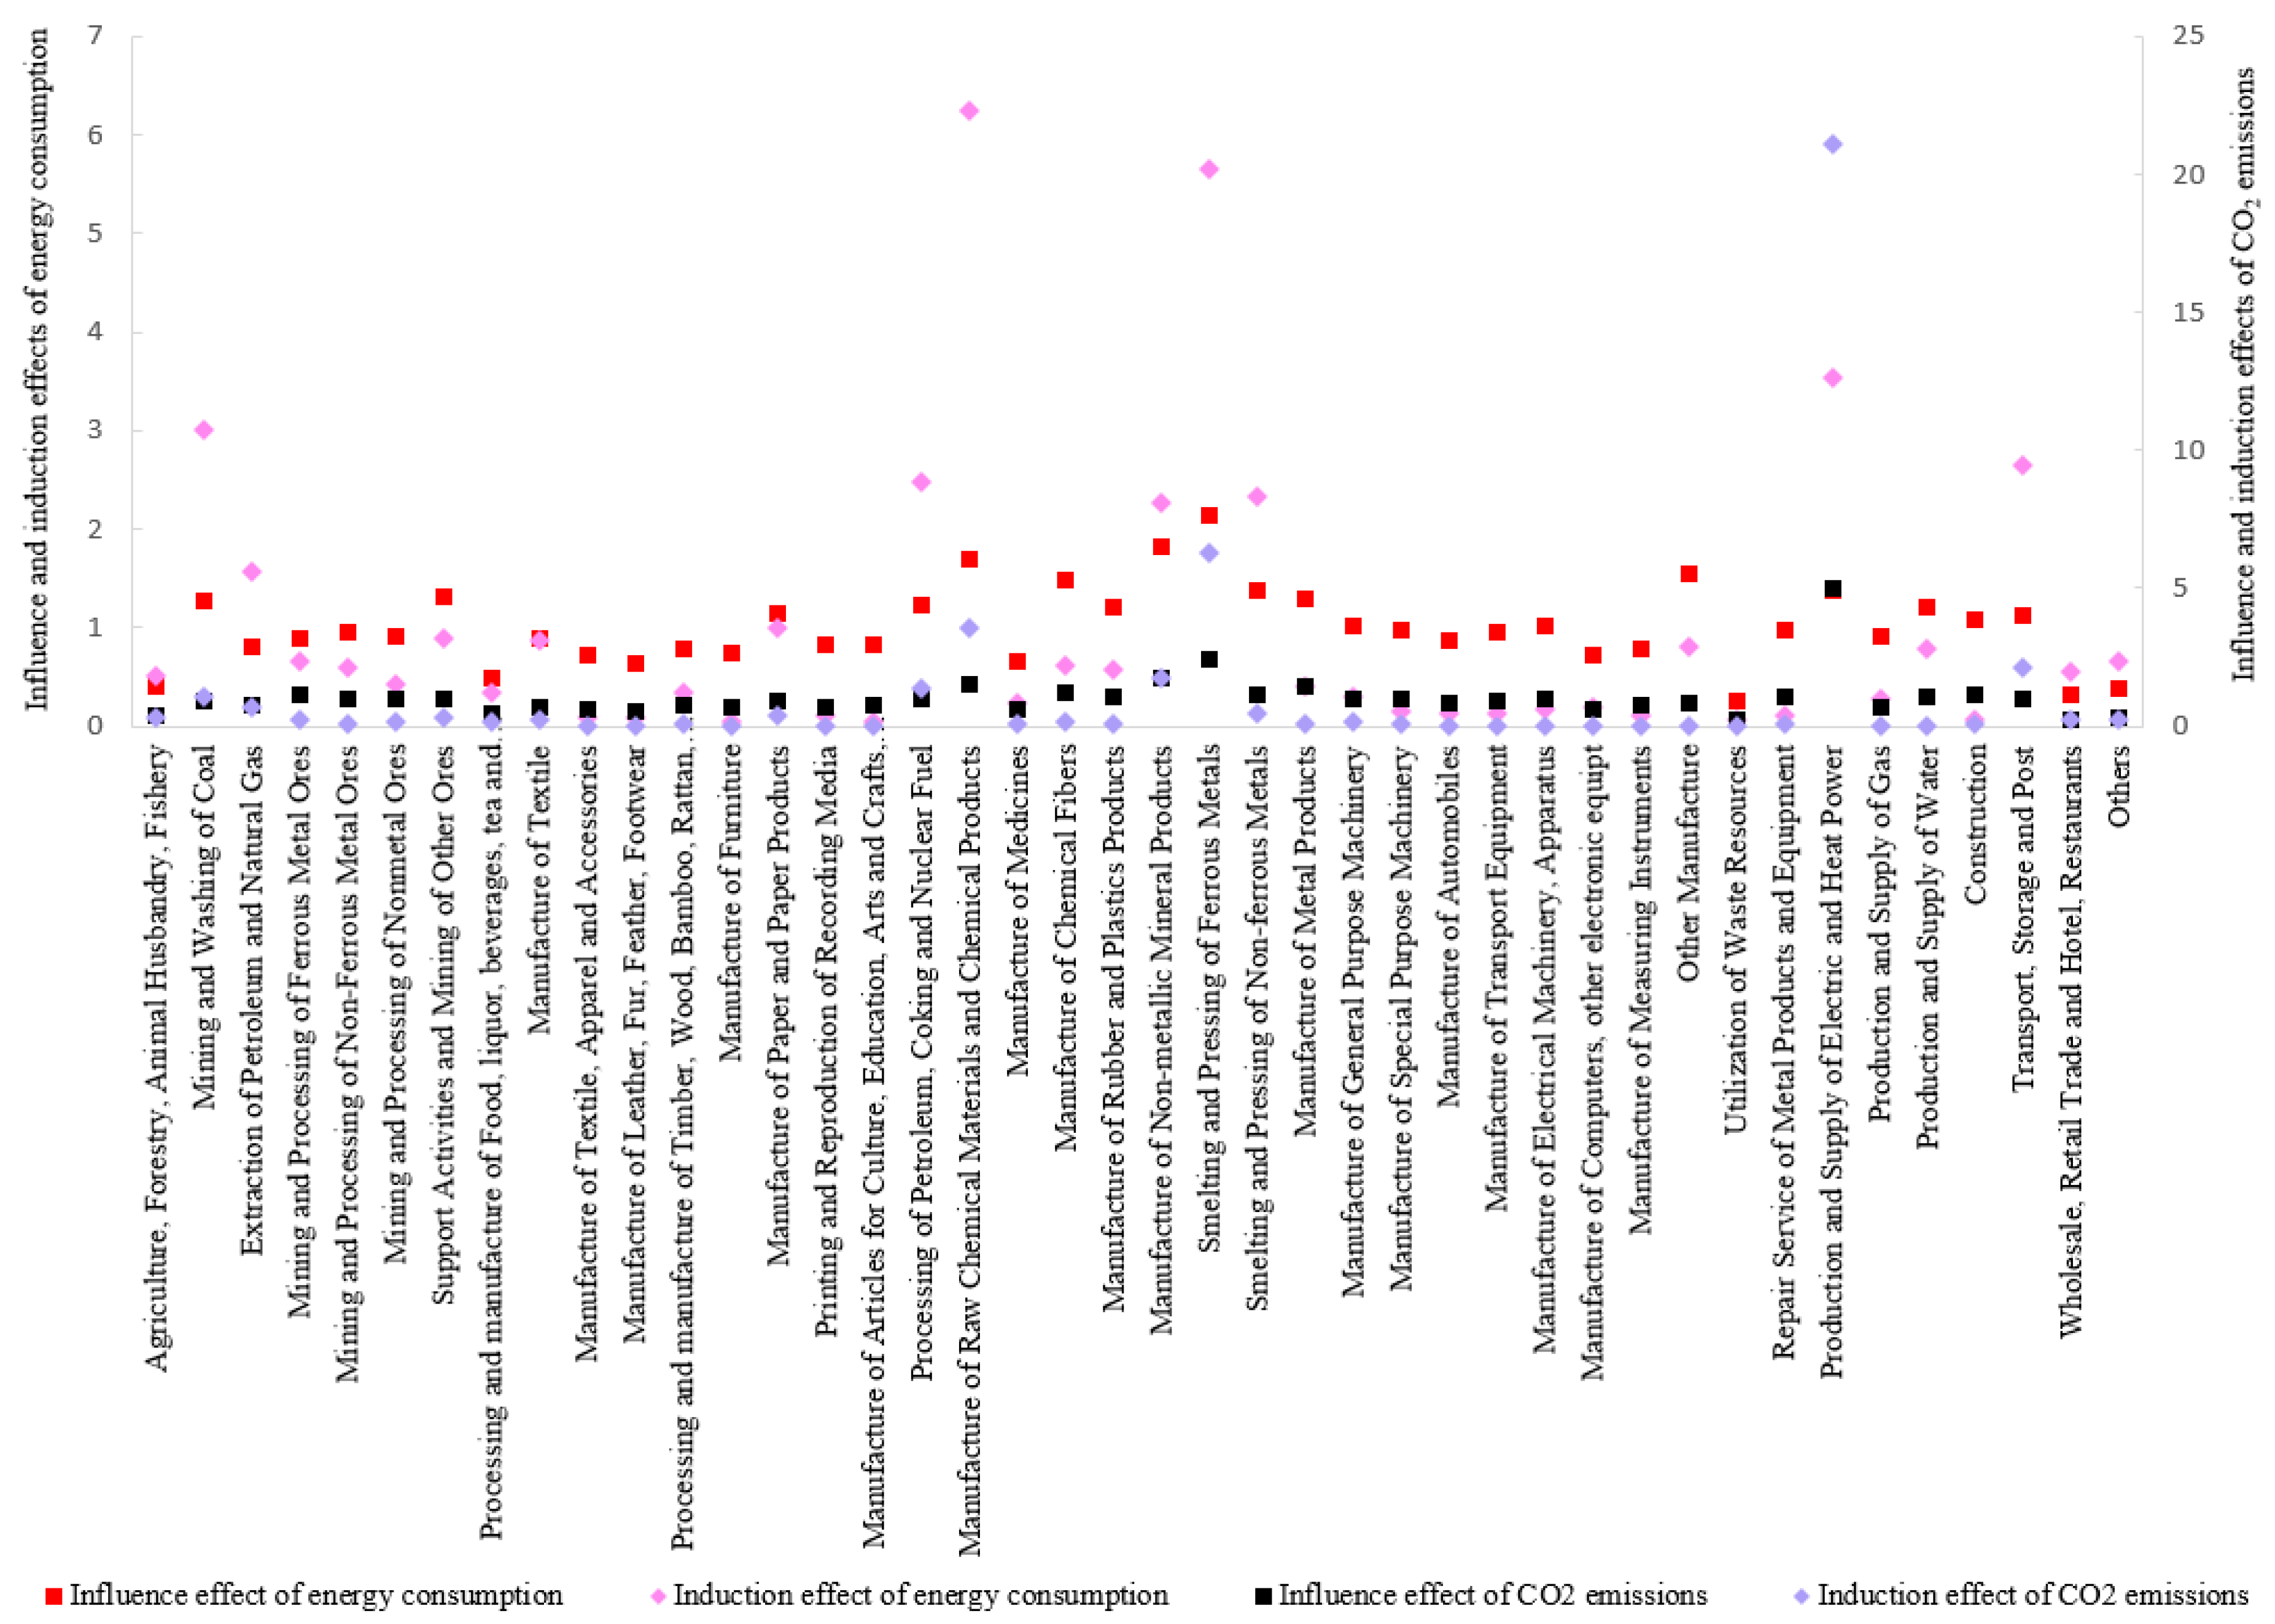
Further, to achieve a systematic view of the indirect energy and environmental relationships, and of how they are conveyed through the supply chain, the influence and induction effects of energy consumption and CO2 emissions for all 42 economic sectors are examined below. They are analyzed using influence and induction coefficients based on Equations (4), (5), (10) and (11). As shown in Figure 6 (detailed results can be found in Table A1 in Appendix A), the petrochemical industry exerts a strong impact on national energy consumption and CO2 emissions, with all subsectors except RPP appearing in China’s top 10 with regards to high influence or induction effects, among all 42 of China’s economic sectors. This illustrates the high impact of the petrochemical industry’s expansion on the energy consumption and CO2 emissions of other sectors, and vice versa.
We identify other key sectors which experience relatively higher “pulling power” or “pushing power” from the others with regards to CO2 emissions and energy consumption in China. The five key sectors beside “Production and Supply of Electric and Heat Power” that deserve our attention are as follows: “Smelting and Pressing of Ferrous Metals”, “Manufacture of Non-metallic Mineral Products”, “Smelting and Pressing of Non-ferrous Metals”, “Transport, Storage and Post”, and the “Mining and Washing of Coal” sectors.
Policymaking in China regarding energy conservation and CO2 emissions has already addressed much effort toward sectorial level management, observable from policies such as the FYPs for sectorial development, Action Plan for Industrial Area Response to Climate Change (2012–2020), and the Industrial Green Development Program (2016–2020). However, only key sectors such as the petrochemical industry have been focused upon and given mandatory targets in these policies and programs. Importantly, embodied energy and energy-related emissions conveyed through the supply chain still have not been given appropriate consideration with regards to policymaking on energy and environmental management. The five key sectors identified in this paper, together with the “Production and Supply of Electric and Heat Power” sector and petrochemical industry, are of high importance to the reduction of energy use and emissions of China, in that: (1) the amount of the embodied energy consumption and CO2 emissions are huge, as seen in Figure 4 and Figure 5; (2) the indirect energy and environmental relationship among sectors is crucial. This is especially true for sectors with high influence and induction effects, such as the petrochemical industry, the fast expansion of which leads to a multiplier effect as supplying sectors scale up to satisfy its final demand, further raising energy use and energy-related emissions of the whole economy, and feeding back into the industry [21]. Thus, the neglecting of the embodied energy and energy related emissions and the indirect relationship among sectors will undermine efforts in sectorial energy conservation and emissions mitigation control.
A systematic view of the indirect energy and environmental relationships, and an accurate classification of responsibilities among sectors—especially those with high influence and induction—based on comprehensive analysis are needed for formulation of an integrated sectoral-level policy system. This will improve the efficacy of energy and environmental management policies. Further, with this perspective a more comprehensive sector-level target system can be built to ensure the achievement of China’s national commitments on energy conservation and CO2 emissions mitigation.
5. Conclusions
The petrochemical complex is the core industry in China’s economy from the perspective of energy consumption and CO2 emissions. Given its continuing fast growth for the near future, the latter two metrics needs to be brought under control. To present a holistic picture of the complete energy consumption and CO2 emissions of the petrochemical industry, the direct and indirect energy, environmental relationships and the conveying effect between all 42 economic sectors and petrochemical subsectors were studied through an EIO-LCA model. The results of the paper indicate that the indirect energy consumption and CO2 emissions embodied and conveyed through supply chain are highly significant, though often overlooked. The indirect portions accruing to the petrochemical industry, estimated at 23% (energy) and 32% (emissions), cannot be neglected in determining the role and responsibilities of sectors in energy conservation and emissions reduction. The work of policymaking regarding the energy and emission reduction of sectors is not completed by focusing on sectors alone or in isolation, but by incorporating them with the rest of the sectors in a complete, interrelated economic system—this view is necessary to achieve more operability and efficacy for targeting programs. We expect the results of this study will provide useful insights for energy and climate mitigation policy in China.
Author Contributions
The authors worked collectively on the manuscript preparation, modification and review.
Conflicts of Interest
The authors declare no conflict of interest.
Appendix A

Table A1.
Influence and induction coefficients of energy consumption and CO2 emissions for all 42 economic sectors of China (2012).
Table A1.
Influence and induction coefficients of energy consumption and CO2 emissions for all 42 economic sectors of China (2012).
| Sectors | Energy Consumption | CO2 Emissions | ||||||
|---|---|---|---|---|---|---|---|---|
| Influence Coefficient | Rank | Induction Coefficient | Rank | Influence Coefficient | Rank | Induction Coefficient | Rank | |
| Agriculture, Forestry, Animal Husbandry, Fishery | 0.40 | 39 | 0.51 | 21 | 0.36 | 39 | 0.27 | 11 |
| Mining and Washing of Coal | 1.27 | 10 | 3.00 | 4 | 0.91 | 23 | 1.09 | 7 |
| EPNG | 0.80 | 30 | 1.57 | 9 | 0.74 | 27 | 0.69 | 8 |
| Mining and Processing of Ferrous Metal Ores | 0.90 | 25 | 0.66 | 15 | 1.11 | 9 | 0.24 | 14 |
| Mining and Processing of Non-Ferrous Metal Ores | 0.96 | 21 | 0.59 | 18 | 1.00 | 14 | 0.09 | 24 |
| Mining and Processing of Nonmetal Ores | 0.91 | 23 | 0.42 | 22 | 0.97 | 18 | 0.19 | 17 |
| Support Activities and Mining of Other Ores | 1.31 | 8 | 0.89 | 11 | 1.00 | 15 | 0.27 | 12 |
| Processing and manufacture of Food, liquor, beverages, tea and tobacco | 0.48 | 38 | 0.35 | 24 | 0.42 | 38 | 0.16 | 19 |
| Manufacture of Textile | 0.89 | 26 | 0.87 | 12 | 0.68 | 33 | 0.22 | 16 |
| Manufacture of Textile, Apparel and Accessories | 0.73 | 34 | 0.08 | 38 | 0.57 | 36 | 0.02 | 35 |
| Manufacture of Leather, Fur, Feather, Footwear | 0.63 | 37 | 0.09 | 37 | 0.53 | 37 | 0.02 | 36 |
| Processing and manufacture of Timber, Wood, Bamboo, Rattan, Palm, and Straw Products | 0.79 | 31 | 0.34 | 25 | 0.74 | 28 | 0.11 | 22 |
| Manufacture of Furniture | 0.73 | 33 | 0.04 | 41 | 0.71 | 30 | 0.01 | 42 |
| Manufacture of Paper and Paper Products | 1.15 | 14 | 1.00 | 10 | 0.95 | 21 | 0.42 | 10 |
| Printing and Reproduction of Recording Media | 0.83 | 29 | 0.10 | 36 | 0.69 | 32 | 0.02 | 38 |
| Manufacture of Articles for Culture, Education, Arts and Crafts, Sport and Entertainment | 0.84 | 28 | 0.04 | 42 | 0.75 | 26 | 0.02 | 40 |
| PCNF | 1.23 | 11 | 2.48 | 6 | 0.99 | 17 | 1.38 | 6 |
| RCCP | 1.70 | 3 | 6.24 | 1 | 1.52 | 4 | 3.58 | 3 |
| Manufacture of Medicines | 0.66 | 36 | 0.23 | 28 | 0.60 | 35 | 0.11 | 23 |
| CF | 1.48 | 5 | 0.61 | 17 | 1.24 | 6 | 0.19 | 18 |
| RPP | 1.21 | 13 | 0.56 | 19 | 1.03 | 12 | 0.12 | 21 |
| Manufacture of Non-metallic Mineral Products | 1.82 | 2 | 2.26 | 8 | 1.78 | 3 | 1.74 | 5 |
| Smelting and Pressing of Ferrous Metals | 2.14 | 1 | 5.66 | 2 | 2.46 | 2 | 6.24 | 2 |
| Smelting and Pressing of Non-ferrous Metals | 1.37 | 7 | 2.34 | 7 | 1.14 | 7 | 0.47 | 9 |
| Manufacture of Metal Products | 1.30 | 9 | 0.40 | 23 | 1.41 | 5 | 0.08 | 25 |
| Manufacture of General Purpose Machinery | 1.01 | 18 | 0.30 | 26 | 1.02 | 13 | 0.12 | 20 |
| Manufacture of Special Purpose Machinery | 0.97 | 20 | 0.14 | 31 | 1.00 | 16 | 0.04 | 28 |
| Manufacture of Automobiles | 0.87 | 27 | 0.14 | 32 | 0.83 | 24 | 0.03 | 32 |
| Manufacture of Transport Equipment | 0.95 | 22 | 0.12 | 33 | 0.92 | 22 | 0.04 | 31 |
| Manufacture of Electrical Machinery, Apparatus | 1.03 | 17 | 0.17 | 30 | 0.95 | 20 | 0.03 | 34 |
| Manufacture of Computers, other electronic equip | 0.72 | 35 | 0.19 | 29 | 0.64 | 34 | 0.01 | 41 |
| Manufacture of Measuring Instruments | 0.79 | 32 | 0.11 | 34 | 0.73 | 29 | 0.02 | 39 |
| Other Manufacture | 1.55 | 4 | 0.80 | 13 | 0.80 | 25 | 0.04 | 30 |
| Utilization of Waste Resources | 0.24 | 42 | 0.07 | 39 | 0.25 | 42 | 0.04 | 29 |
| Repair Service of Metal Products and Equipment | 0.98 | 19 | 0.10 | 35 | 1.06 | 11 | 0.05 | 27 |
| Production and Supply of Electric and Heat Power | 1.38 | 6 | 3.54 | 3 | 5.01 | 1 | 21.10 | 1 |
| Production and Supply of Gas | 0.90 | 24 | 0.29 | 27 | 0.70 | 31 | 0.03 | 33 |
| Production and Supply of Water | 1.22 | 12 | 0.77 | 14 | 1.09 | 10 | 0.02 | 37 |
| Construction | 1.08 | 16 | 0.07 | 40 | 1.12 | 8 | 0.05 | 26 |
| Transport, Storage and Post | 1.11 | 15 | 2.66 | 5 | 0.97 | 19 | 2.12 | 4 |
| Wholesale, Retail Trade and Hotel, Restaurants | 0.31 | 41 | 0.55 | 20 | 0.26 | 41 | 0.23 | 15 |
| Others | 0.37 | 40 | 0.66 | 16 | 0.32 | 40 | 0.26 | 13 |
References
- National Bureau of Statistics. China National Economy and Social Development Statistical Bulletin 2015; China Statistical Press: Beijing, China, 2016.
- National Bureau of Statistics. China Statistical Yearbook 2007–2015; China Statistical Press: Beijing, China, 2015.
- Xie, X.; Shao, S.; Lin, B. Exploring the driving forces and mitigation pathways of CO2 emissions in China’s petroleum refining and coking industry: 1995–2031. Appl. Energy 2016, 184, 1004–1015. [Google Scholar] [CrossRef]
- State Council. The Thirteenth Five-Year Work Plan for Greenhouse Gas Emissions Control. Available online: http://www.gov.cn/zhengce/content/2016-11/04/content_5128619.htm (accessed on 29 September 2017).
- National Bureau of Statistics. National Economic Industry Classification Standard 2011; China Statistical Press: Beijing, China, 2011.
- Wu, X.; Zhang, Z. Input–output analysis of the Chinese construction sector. Constr. Manag. Econ. 2005, 23, 905–912. [Google Scholar] [CrossRef]
- Ministry of Industry and Information Technology. The Twelfth Five-Year Plan for the Development of Petrochemical and Chemical Industries. Available online: http://www.miit.gov.cn/n1146290/n1146397/c4241600/content.html (accessed on 29 September 2017).
- Ministry of Industry and Information Technology. The Plan for the Development of Petrochemical and Chemical Industries (2016–2020). Available online: http://www.miit.gov.cn/n1146295/n1652858/n1652930/n3757017/c5285161/content.html (accessed on 29 September 2017).
- Leontief, W. Environmental repercussions and the economic structure: An input-output approach. Rev. Econ. Stat. 1970, 262–271. [Google Scholar] [CrossRef]
- Xu, T.; Baosheng, Z.; Lianyong, F.; Masri, M.; Honarvar, A. Economic impacts and challenges of China’s petroleum industry: An input-output analysis. Energy 2011, 36, 2905–2911. [Google Scholar] [CrossRef]
- Hendrickson, C.; Horvath, A.; Joshi, S.; Lave, L. Economic input-output models for environmental life-cycle assessment. Environ. Sci. Technol. 1998, 32, 184–190. [Google Scholar] [CrossRef]
- Shui, B.; Harriss, R.C. The role of CO2 embodiment in US–China trade. Energy Policy 2006, 34, 4063–4068. [Google Scholar] [CrossRef]
- Zhang, Y.; Bian, X.; Tan, W.; Song, J. The indirect energy consumption and CO2 emission caused by household consumption in China: An analysis based on the input–output method. J. Clean. Prod. 2015, 163, 69–83. [Google Scholar] [CrossRef]
- Li, X.; Fan, T. Analysis of carbon emissions from China’s petrochemical industries using the LMDI method. In Proceedings of the International Conference on E-Product E-Service and E-Entertainment, Henan, China, 7–9 November 2010; pp. 1–4. [Google Scholar]
- Fan, T.; Luo, R.; Xia, H.; Li, X. Using LMDI method to analyze the influencing factors of carbon emissions in China’s petrochemical industries. Nat. Hazards 2015, 75, 319–332. [Google Scholar] [CrossRef]
- Intergovernmental Panel on Climate Change. IPCC Guidelines for National Greenhouse Gas Inventories; Institute for Global Environmental Strategies: Hayama, Japan, 2006; Volume 2, pp. 48–56.
- Liu, Z.; Guan, D.; Wei, W.; Davis, S.J.; Ciais, P.; Bai, J.; Peng, S.; Zhang, Q.; Hubacek, K.; Marland, G.; et al. Reduced carbon emission estimates from fossil fuel combustion and cement production in China. Nature 2015, 524, 335–338. [Google Scholar] [CrossRef] [PubMed]
- Wang, Z.; Liu, W.; Yin, J. Driving forces of indirect carbon emissions from household consumption in China: An input–output decomposition analysis. Nat. Hazards 2015, 75, 257–272. [Google Scholar] [CrossRef]
- Das, A.; Paul, S.K. CO2 emissions from household consumption in India between 1993–1994 and 2006–2007: A decomposition analysis. Energy Econ. 2014, 41, 90–105. [Google Scholar] [CrossRef]
- Wei, Y.M.; Liu, L.C.; Fan, Y.; Wu, G. China Energy Report: Carbon Emissions Research; Science Press: Beijing, China, 2008. [Google Scholar]
- Lenzen, M.; Wood, R.; Foran, B. Direct Versus Embodied Energy. The Need for Urban Lifestyle Transitions; Elsevier: Amsterdam, The Netherlands, 2008; pp. 91–120. [Google Scholar]
Figure 1.
Final energy consumption by petrochemical industry in 2012.
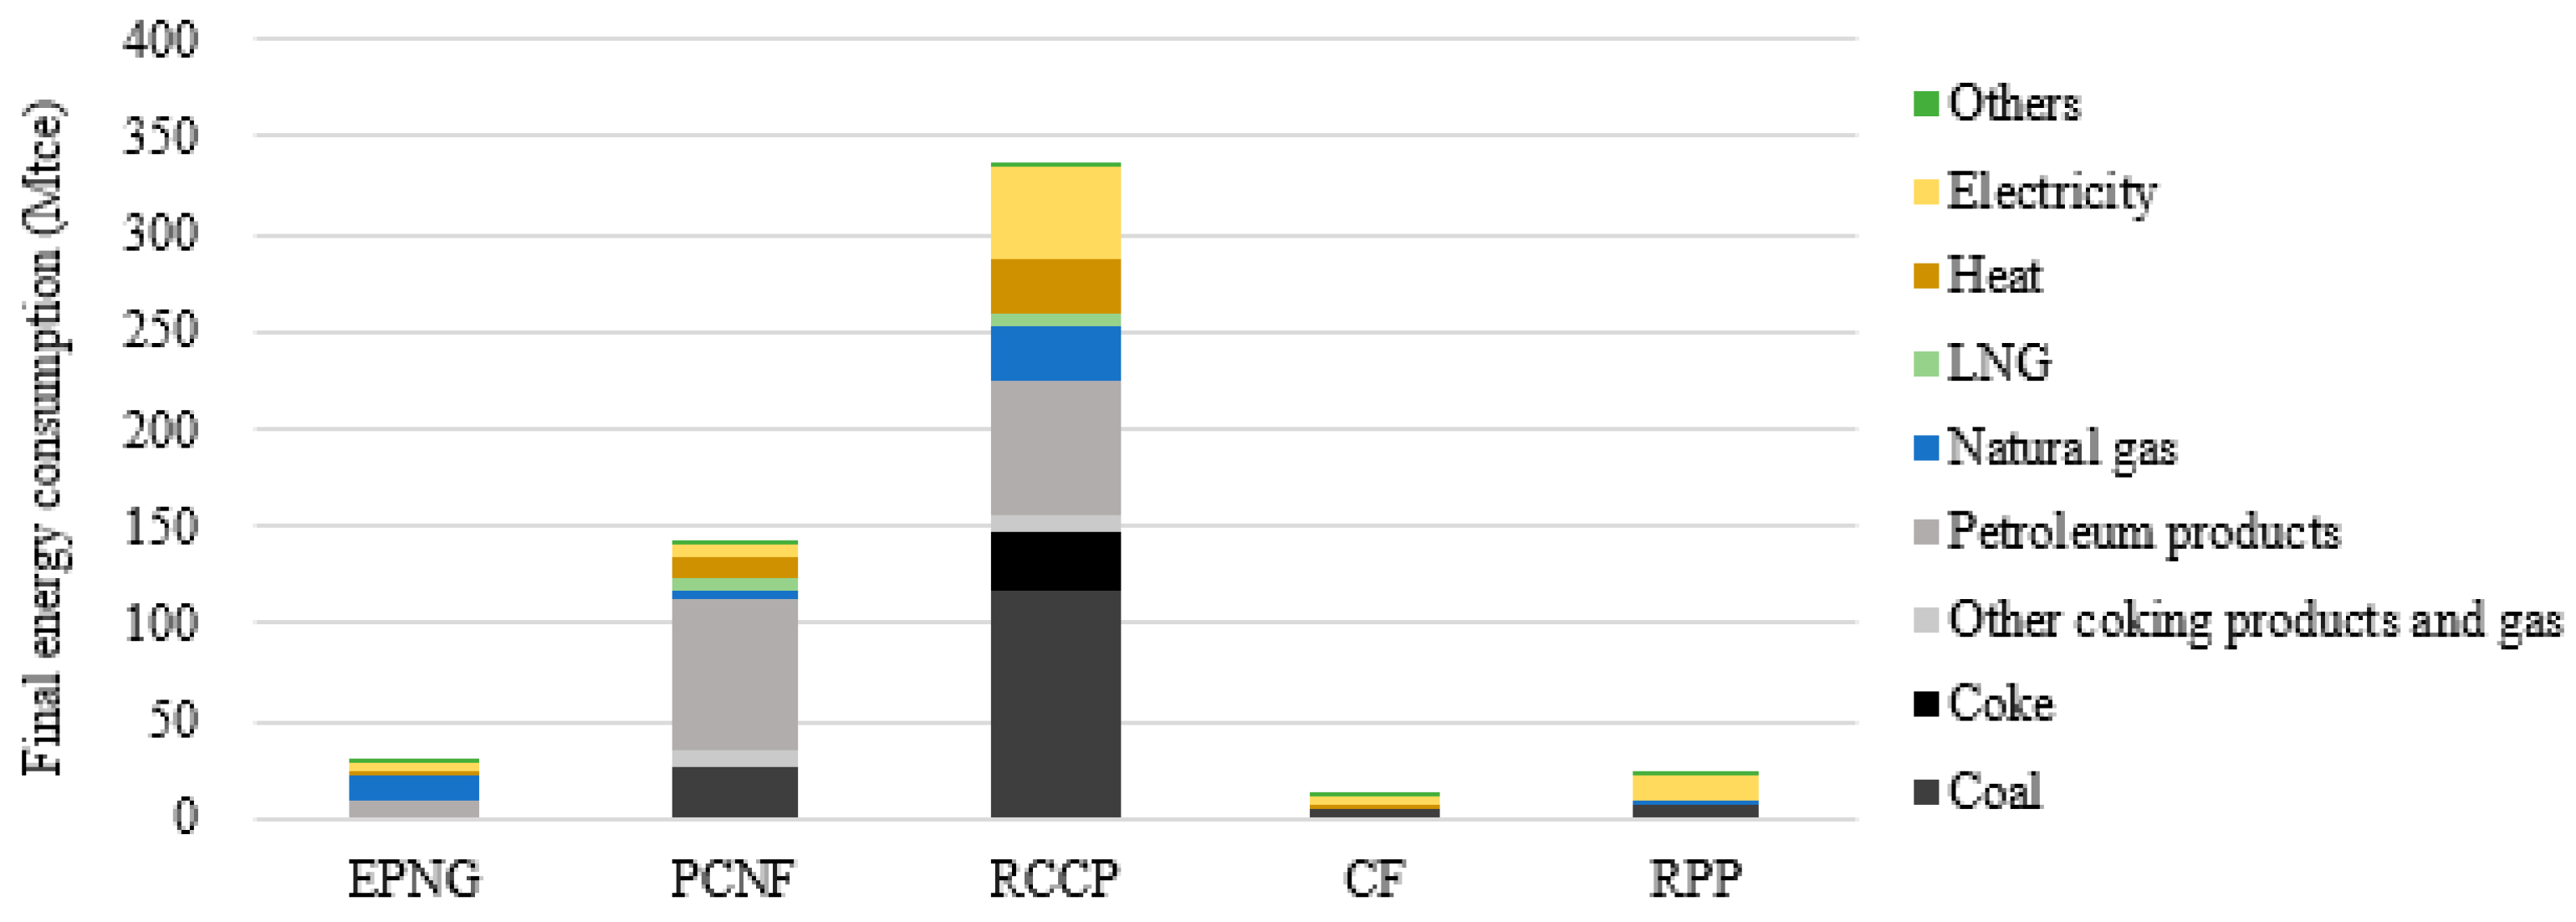
Figure 2.
Direct and indirect energy consumption and intensity of the petrochemical industry (2012).
Figure 2.
Direct and indirect energy consumption and intensity of the petrochemical industry (2012).
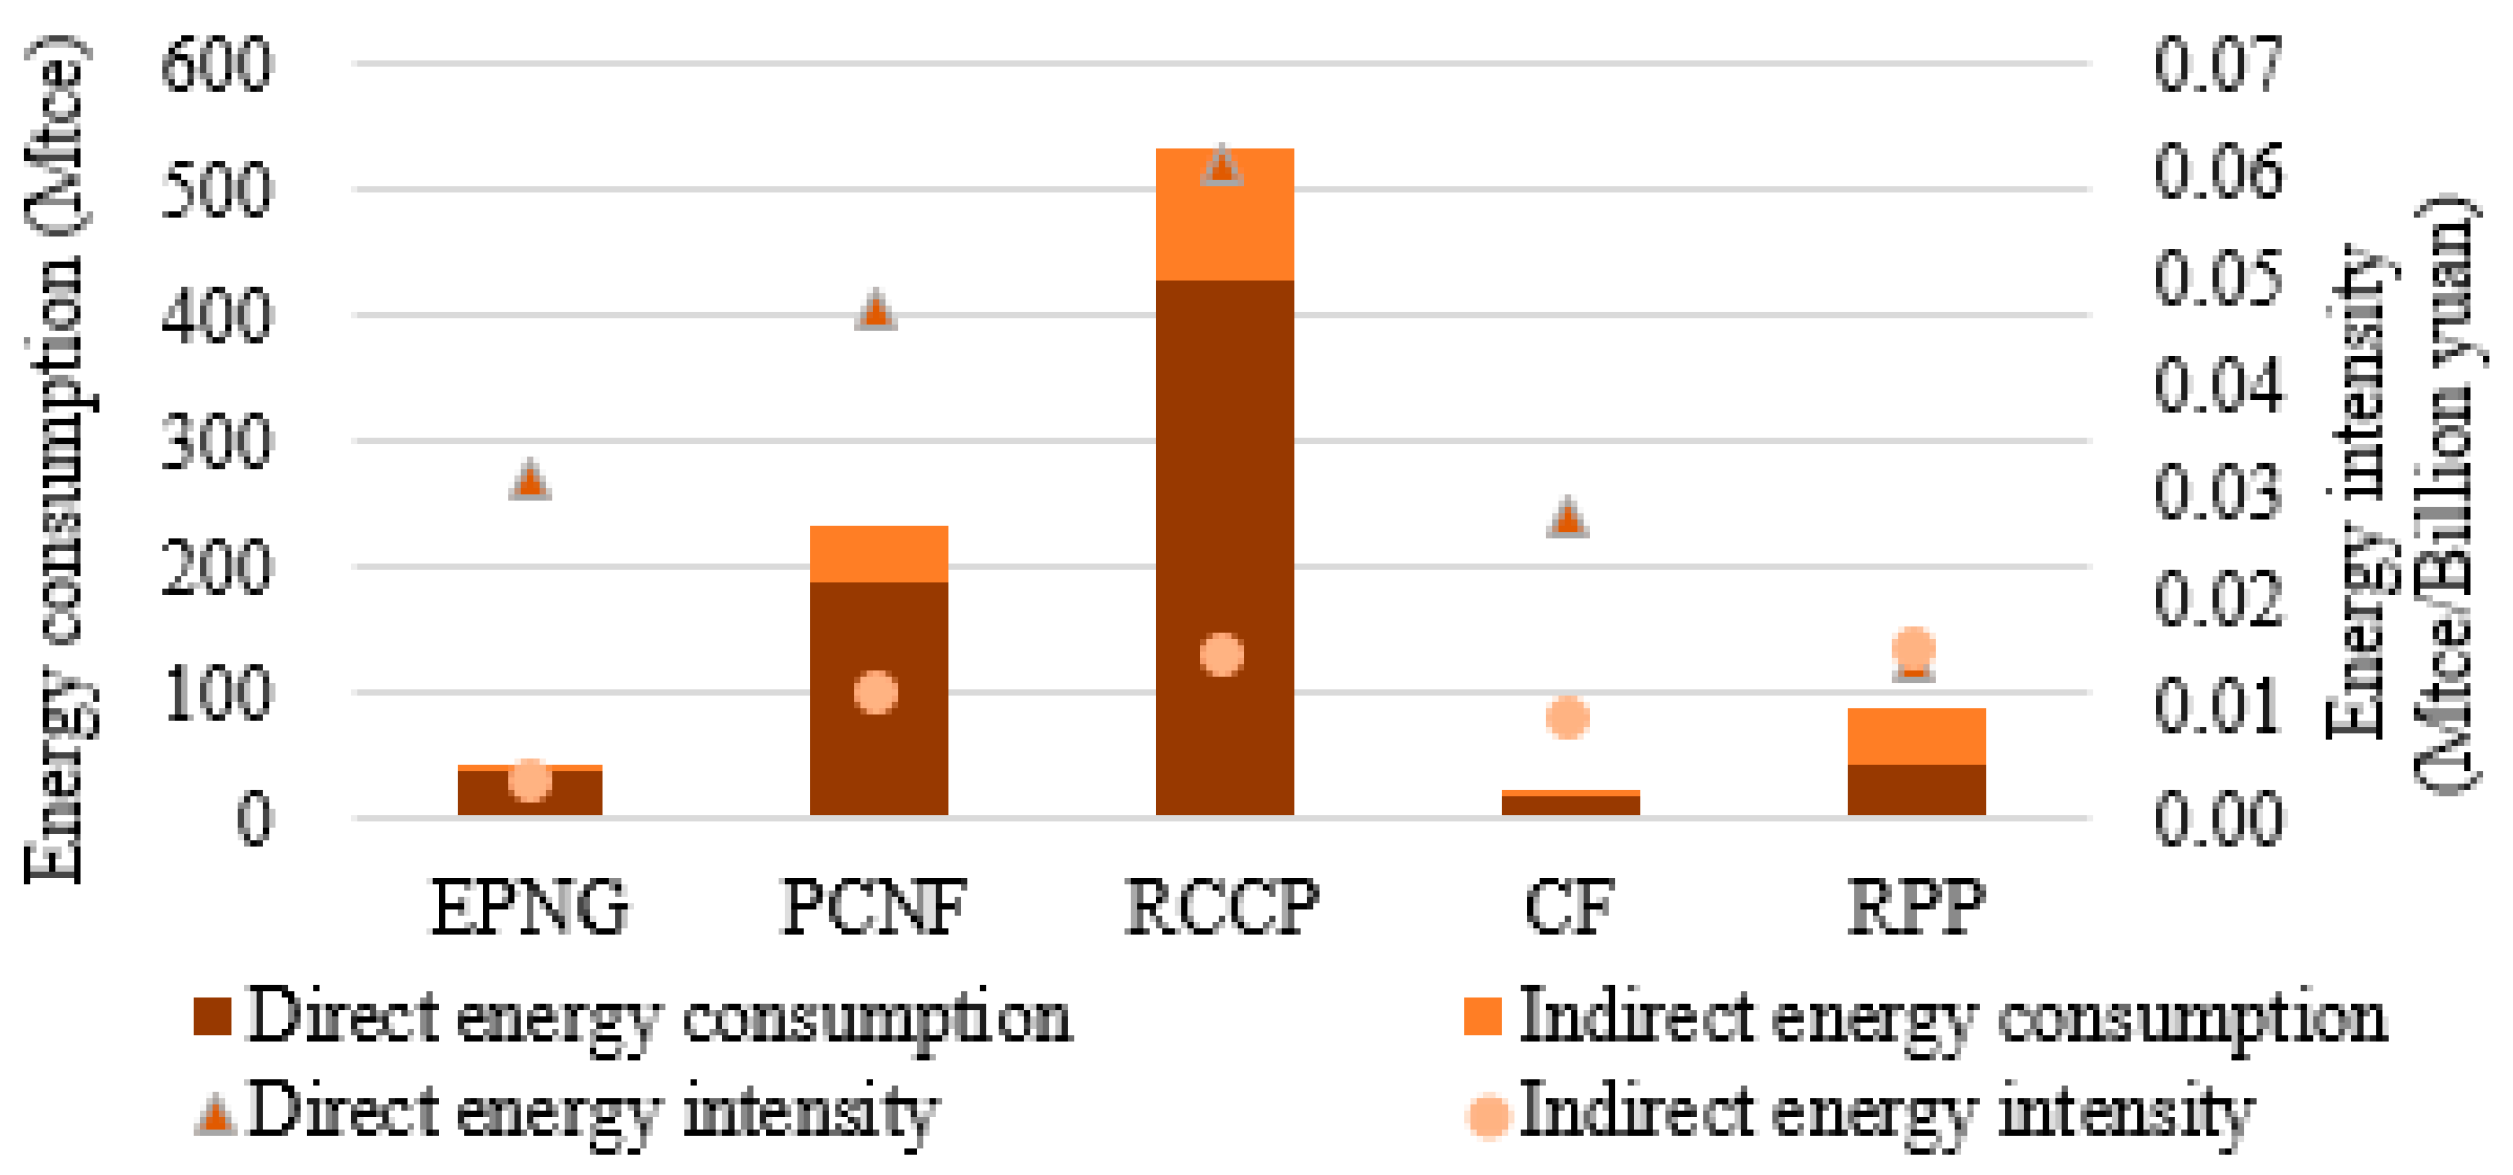
Figure 3.
Direct and indirect CO2 emissions and intensity of the petrochemical industry (2012).
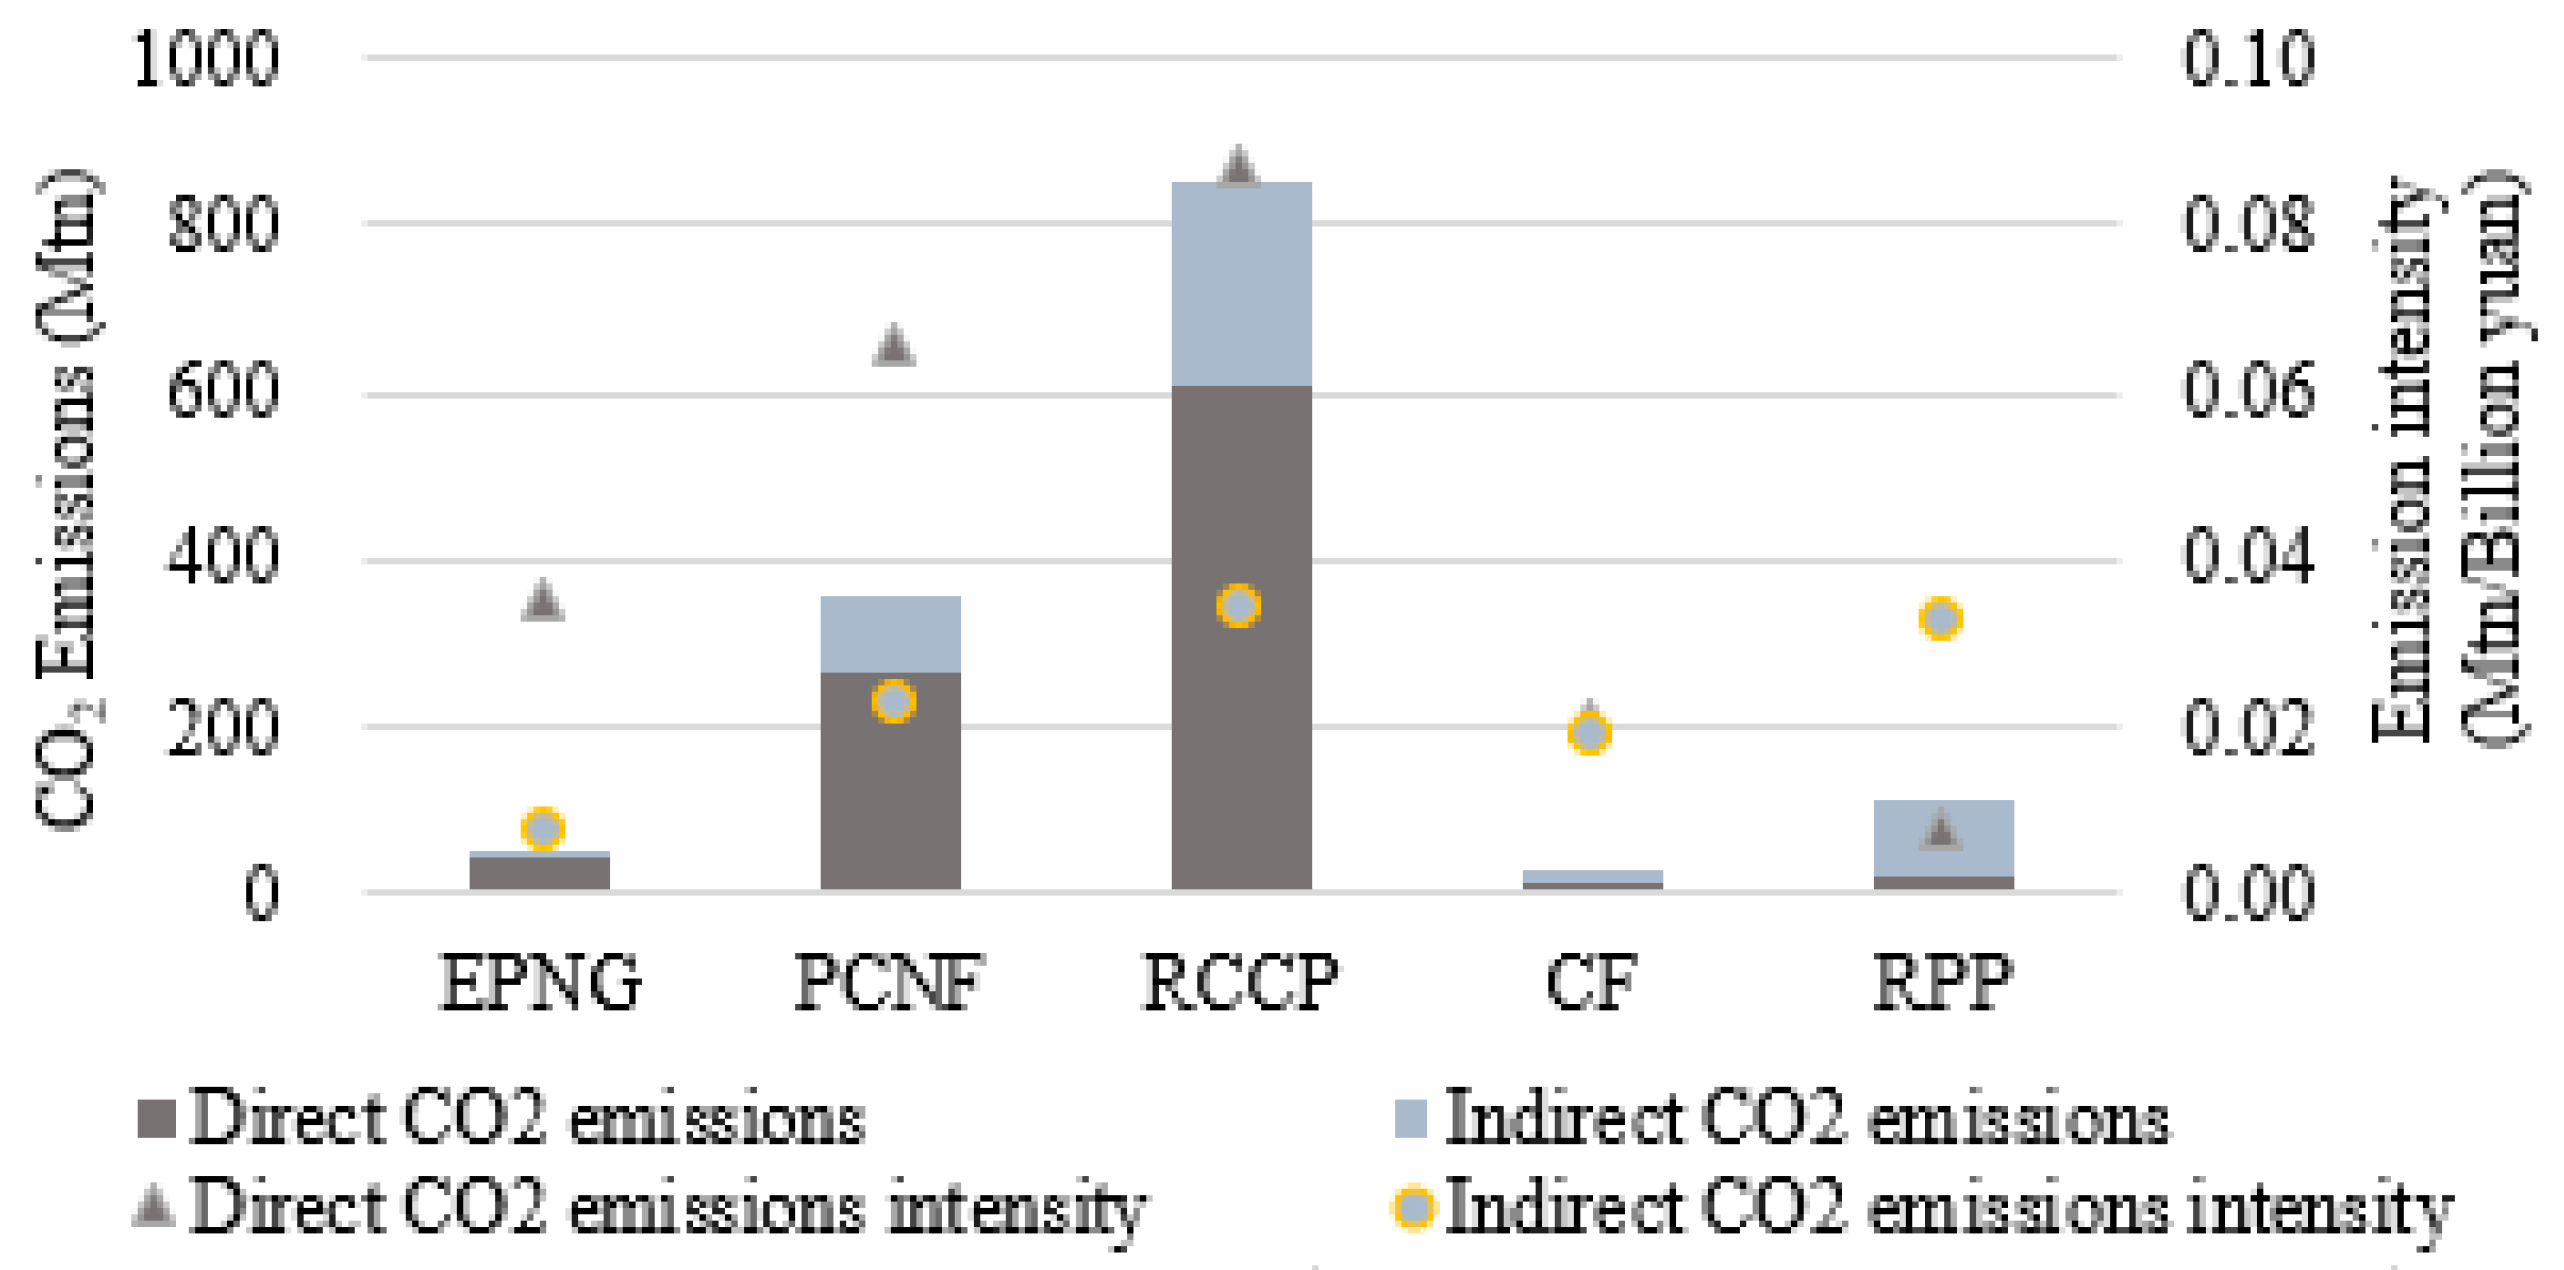
Figure 4.
Contribution of sectors to indirect energy consumption of the petrochemical industry (2012).
Figure 4.
Contribution of sectors to indirect energy consumption of the petrochemical industry (2012).

Figure 5.
Contribution of sectors to indirect CO2 emissions of the petrochemical industry (2012).

Figure 6.
Influence and induction effects of energy consumption and energy-related CO2 emissions for all 42 economic sectors in China (2012).
Figure 6.
Influence and induction effects of energy consumption and energy-related CO2 emissions for all 42 economic sectors in China (2012).
© 2017 by the authors. Licensee MDPI, Basel, Switzerland. This article is an open access article distributed under the terms and conditions of the Creative Commons Attribution (CC BY) license (http://creativecommons.org/licenses/by/4.0/).
Share and Cite
MDPI and ACS Style
Meng, L.; Sager, J. Energy Consumption and Energy-Related CO2 Emissions from China’s Petrochemical Industry Based on an Environmental Input-Output Life Cycle Assessment. Energies 2017, 10, 1585. https://doi.org/10.3390/en10101585
AMA Style
Meng L, Sager J. Energy Consumption and Energy-Related CO2 Emissions from China’s Petrochemical Industry Based on an Environmental Input-Output Life Cycle Assessment. Energies. 2017; 10(10):1585. https://doi.org/10.3390/en10101585
Chicago/Turabian StyleMeng, Lu, and Jalel Sager. 2017. "Energy Consumption and Energy-Related CO2 Emissions from China’s Petrochemical Industry Based on an Environmental Input-Output Life Cycle Assessment" Energies 10, no. 10: 1585. https://doi.org/10.3390/en10101585
Note that from the first issue of 2016, this journal uses article numbers instead of page numbers. See further details here.