Article

Characterization and Prediction of the Gas Hydrate Reservoir at the Second Offshore Gas Production Test Site in the Eastern Nankai Trough, Japan

1
Japan Oil Engineering Co., Ltd. (JOE), Kachidoki Sun-Square 1-7-3, Kachidoki, Chuo-ku, Tokyo 104-0054, Japan
2
Japan Oil, Gas and Metals National Corporation (JOGMEC), 1-2-2 Hamada Mihama-ku, Chiba-shi, Chiba 261-0025, Japan
*
Author to whom correspondence should be addressed.
Energies 2017, 10(10), 1678; https://doi.org/10.3390/en10101678
Submission received: 2 August 2017 / Revised: 15 September 2017 / Accepted: 9 October 2017 / Published: 23 October 2017
(This article belongs to the Special Issue Methane Hydrate Research and Development)

Abstract

:
Following the world’s first offshore production test that was conducted from a gas hydrate reservoir by a depressurization technique in 2013, the second offshore production test has been planned in the eastern Nankai Trough. In 2016, the drilling survey was performed ahead of the production test, and logging data that covers the reservoir interval were newly obtained from three wells around the test site: one well for geological survey, and two wells for monitoring surveys, during the production test. The formation evaluation using the well log data suggested that our target reservoir has a more significant heterogeneity in the gas hydrate saturation distribution than we expected, although lateral continuity of sand layers is relatively good. To evaluate the spatial distribution of gas hydrate, the integration analysis using well and seismic data was performed. The seismic amplitude analysis supports the lateral reservoir heterogeneity that has a significant positive correlation with the resistivity log data at the well locations. The spatial distribution of the apparent low-resistivity interval within the reservoir observed from log data was investigated by the P-velocity volume derived from seismic inversion. The integrated results were utilized for the pre-drill prediction of the reservoir quality at the producing wells. These approaches will reduce the risk of future commercial production from the gas hydrate reservoir.

1. Introduction

The eastern Nankai Trough (Figure 1a) is one of attractive areas for the offshore gas production test from a natural gas hydrate (NGH) reservoir. The world’s first offshore production test was conducted by a depressurization technique in 2013 at the Daini-Atsumi Knoll (Figure 1b) and produced methane gas with total volume of 119,000 m3 during a six-day continuous period [1,2,3,4]. Following the first offshore production test, the second offshore production test has been planned to confirm much longer and more stable gas production in one month. The main objective for the second production test is to verify the effectiveness of countermeasures against the technical issues observed in the first production test, such as sand production and gas-water separation [5,6].
In the second production test, two producers (AT1-P2 and AT1-P3, later called P2 and P3 in this paper) and two monitoring wells (AT1-MT2 and AT1-MT3, later called MT2 and MT3 in this paper) were planned at the northern slope of the Daini-Atsumi Knoll, which is near the first production test site (AT1-P, Figure 1b). In 2015, two candidate locations were narrowed down through the site screening process. During the drilling campaign in 2016 which was performed ahead of the production test, a new geological survey well was drilled at the structural up-dip side (AT1-UD, later called UD in this paper) (Figure 1b). Based on the formation evaluation of the UD well onboard the drilling ship, the production test site was decided to set about 100 m away in a southeast direction from the first production test site, and then two monitoring wells were drilled.
Following the drilling campaign in 2016, geological and petrophysical evaluations were performed using newly-obtained three-well data (UD, MT2, and MT3) together with the previous wells in the first production test site [6,7,8]. The results suggested that the target reservoir has a more significant heterogeneity in the NGH saturation distribution than we expected, although lateral continuity of sand layers is relatively good [6,7,8].
The reservoir heterogeneity has a significant impact upon fluid hydrodynamic and thermodynamic behavior during the production test. Therefore, the understanding of the reservoir heterogeneity is a critical issue for the accurate reservoir potential evaluation, as well as resource assessment. Three-dimensional (3D) seismic data is important for the reconnaissance investigation of the spatial distribution of NGH-bearing sediments and useful for the prediction of the reservoir quality at undrilled locations if the seismic data have good correlation with the observations of the well data [9]. In the present study, we investigate the spatial distribution of NGH-bearing sediments to comprehend the reservoir heterogeneity around the second offshore production test site. We perform the integrated analysis using 3D seismic and well log data by the quantitative and statistical correlation approach, and predict the reservoir quality at the producing wells.

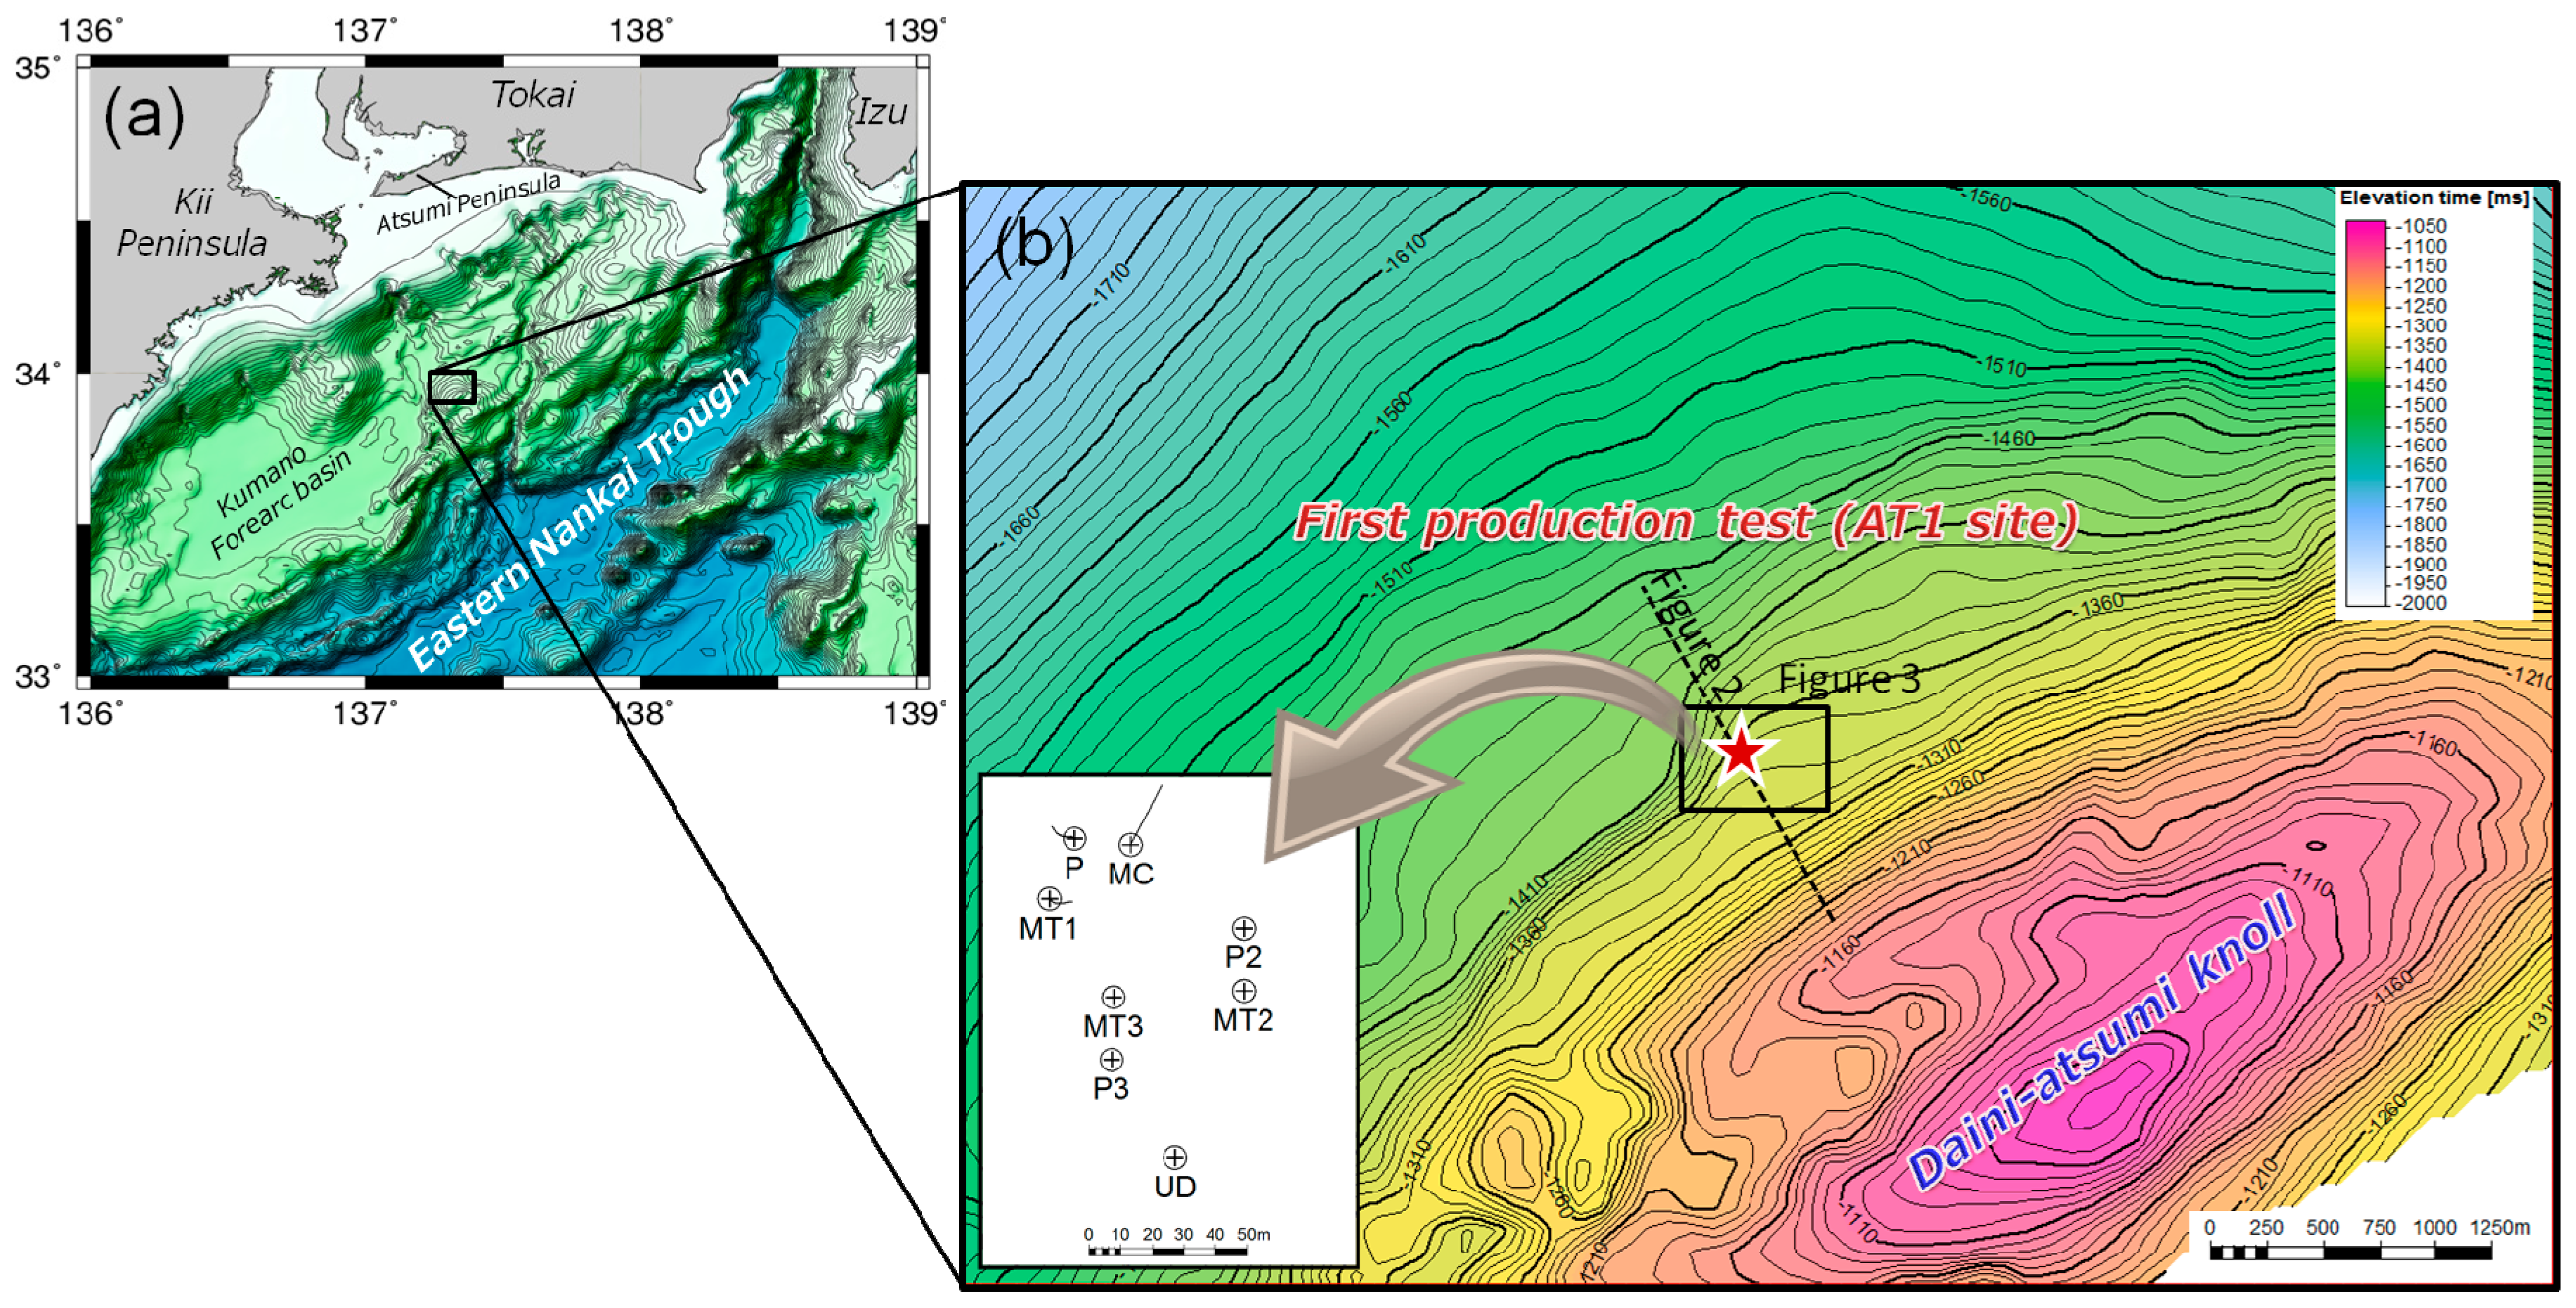
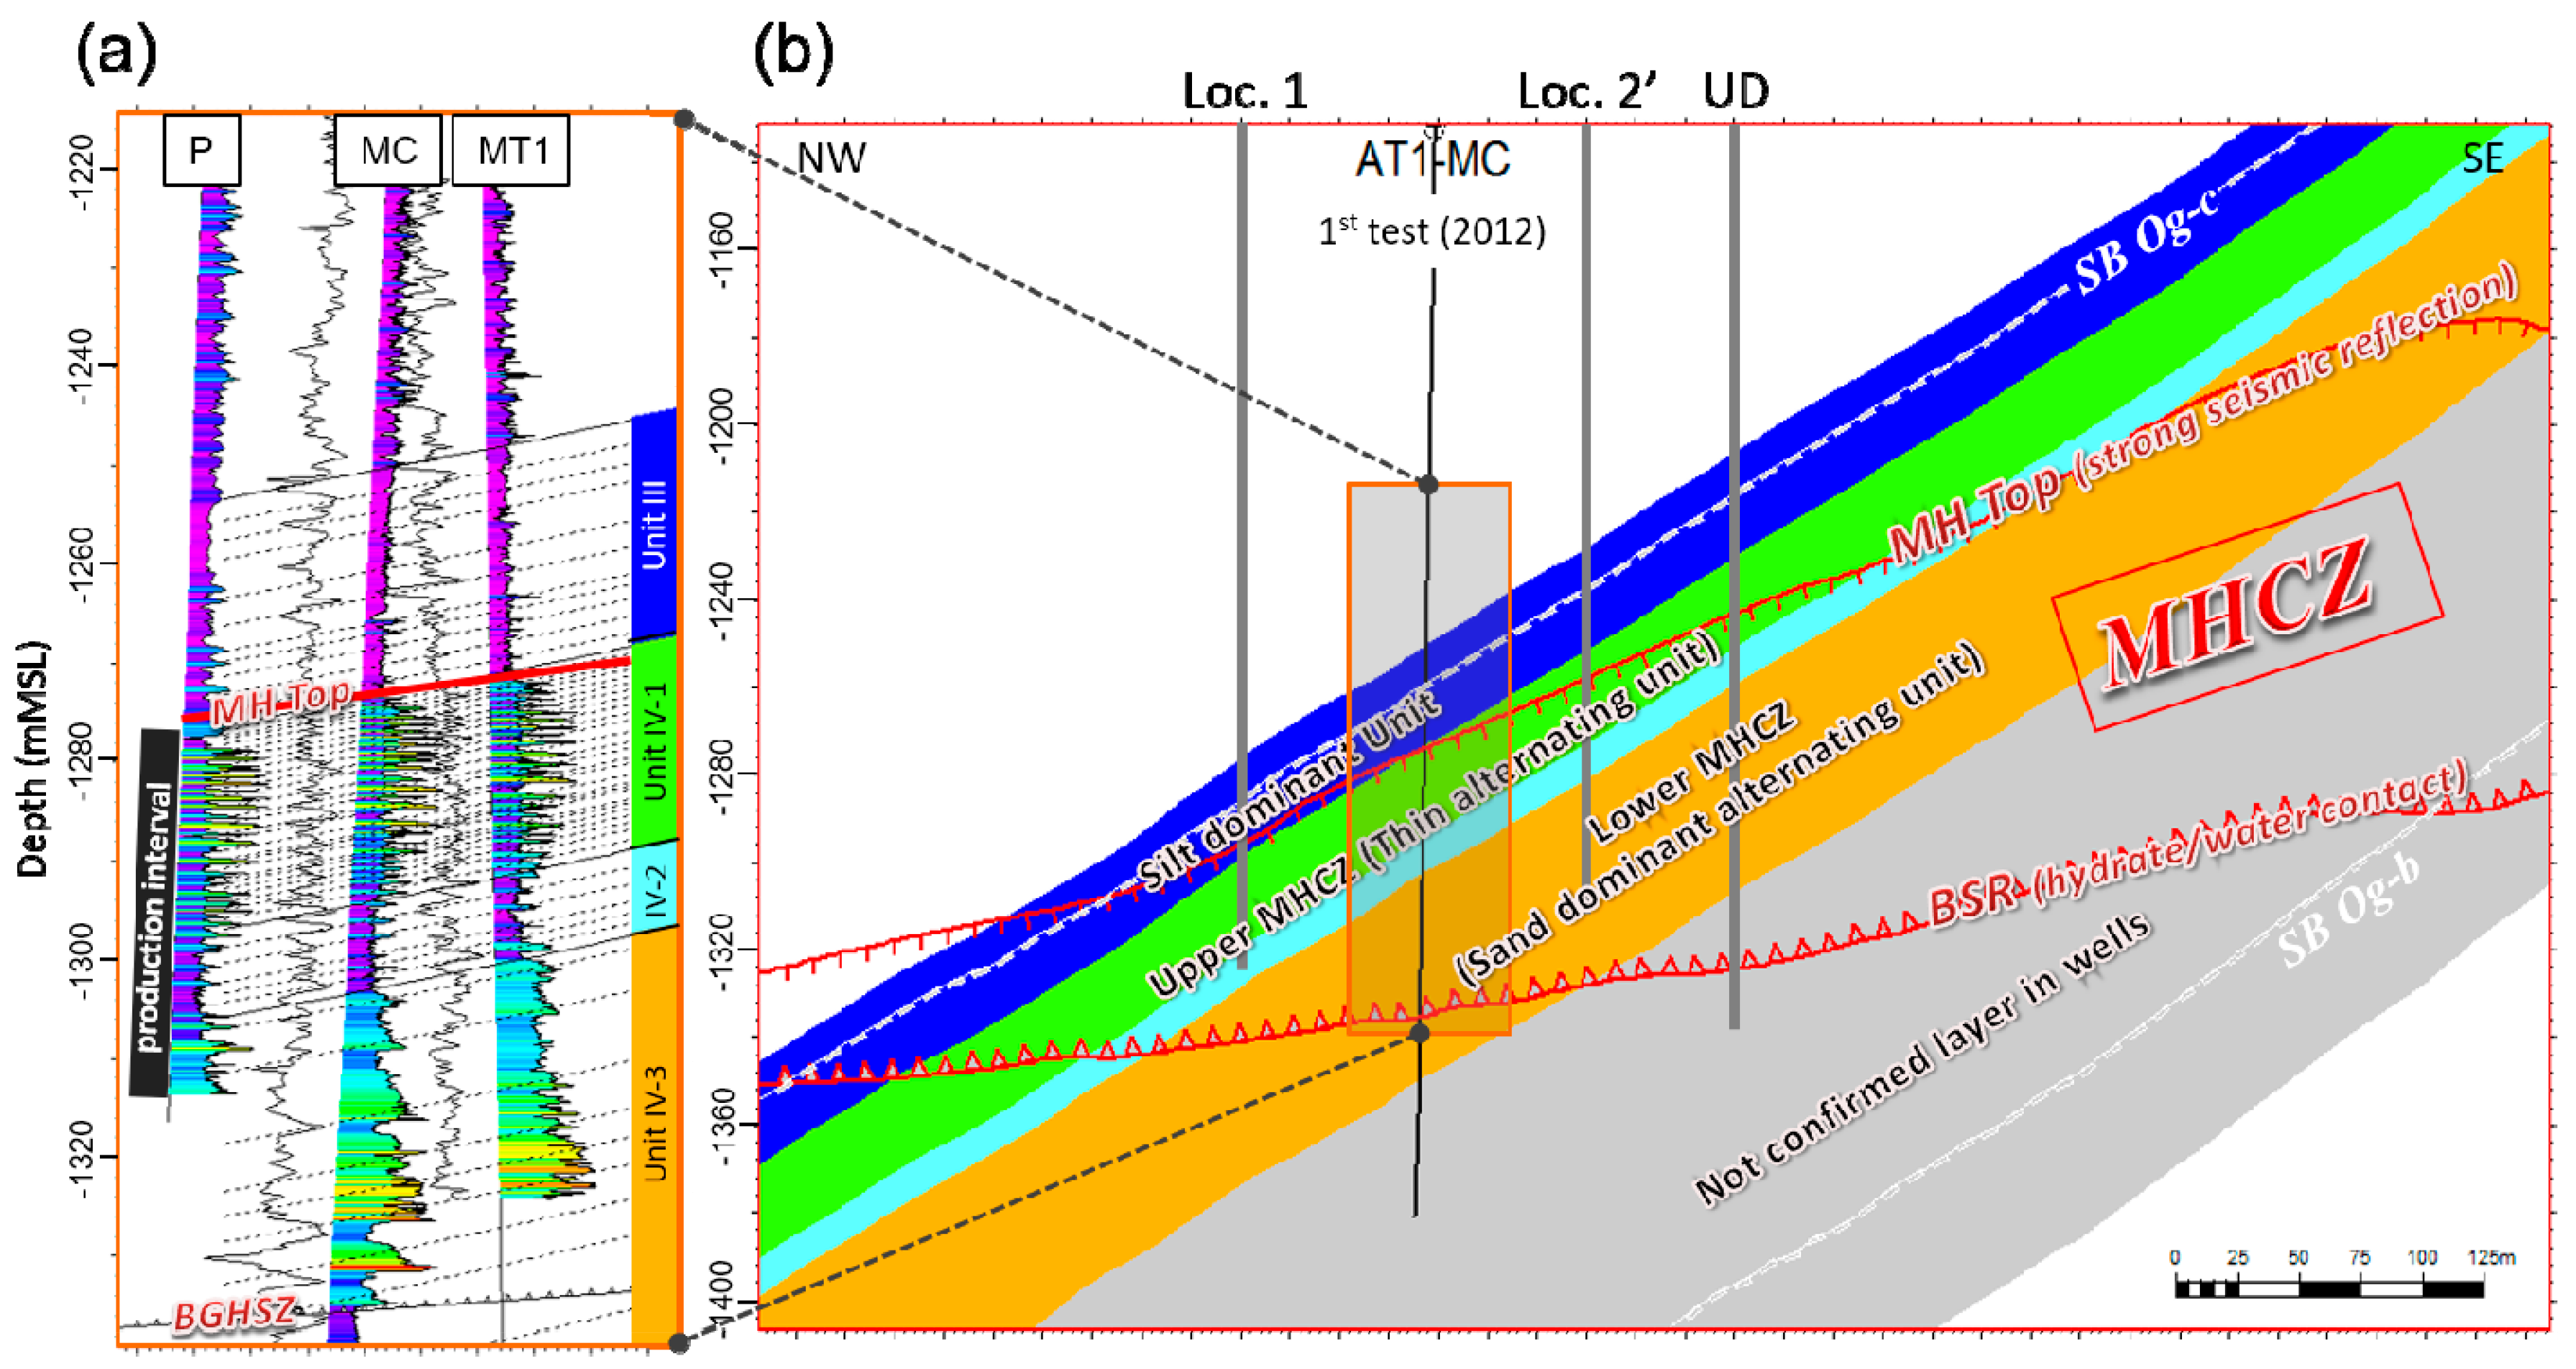
2. Geological Setting and Reservoir Architecture in the Second Offshore Production Test Site

Our study area is contained within a forearc basin (Tokai–Atsumi–Kumano basins) that overlies the Nankai accretionary prism overlying the Nankai subduction zone. The production test site is located on the northern slope of the Daini–Atsumi Knoll, off Atsumi Peninsula (Figure 1). The active uplift of the knoll occurred after the late Pleistocene (e.g., [10,11]), which led to tilting northwest of about 20 degrees around the test site (Figure 2). The stratigraphy in the Tokai–Atsumi–Kumano forearc basins was established through sequence stratigraphy and sedimentology using 2D/3D seismic, well log, and core data. It is found that a major depositional system of the sediments is a submarine fan turbidite system (e.g., [10,11,12,13,14,15]).
Our target NGH reservoir is a methane hydrate-concentrated zone (MHCZ, Figure 2), which is characterized by strong amplitude and high velocity anomalies in seismic data, and the high resistivity interval in well log data (e.g., [15,16]). Spatial distribution of the MHCZ is defined by the top of the NGH strong seismic reflection and bottom simulating reflectors (BSR).
The lithological units around the production test site were identified from well log and core data. The sediments were divided into five units: Unit I, Unit II, Unit III, Unit IV, and Unit V (Figure 2) [16]. The unit boundaries were mainly defined by the resistivity log data, and the degree of NGH saturation is different in each unit. The MHCZ is mainly distributed in Unit IV. Based on the vertical succession patterns in turbidite facies, Unit IV was further subdivided into an upper thin bedded alternating unit (Unit IV-1 and Unit IV-2) and a lower thick sand dominant alternation (Unit IV-3) (Figure 3) [16]. Unit IV-2 was defined to characterize the apparent low-resistivity interval within the MHCZ at the wells (MC, MT1, P) in the first production test (Figure 3a).

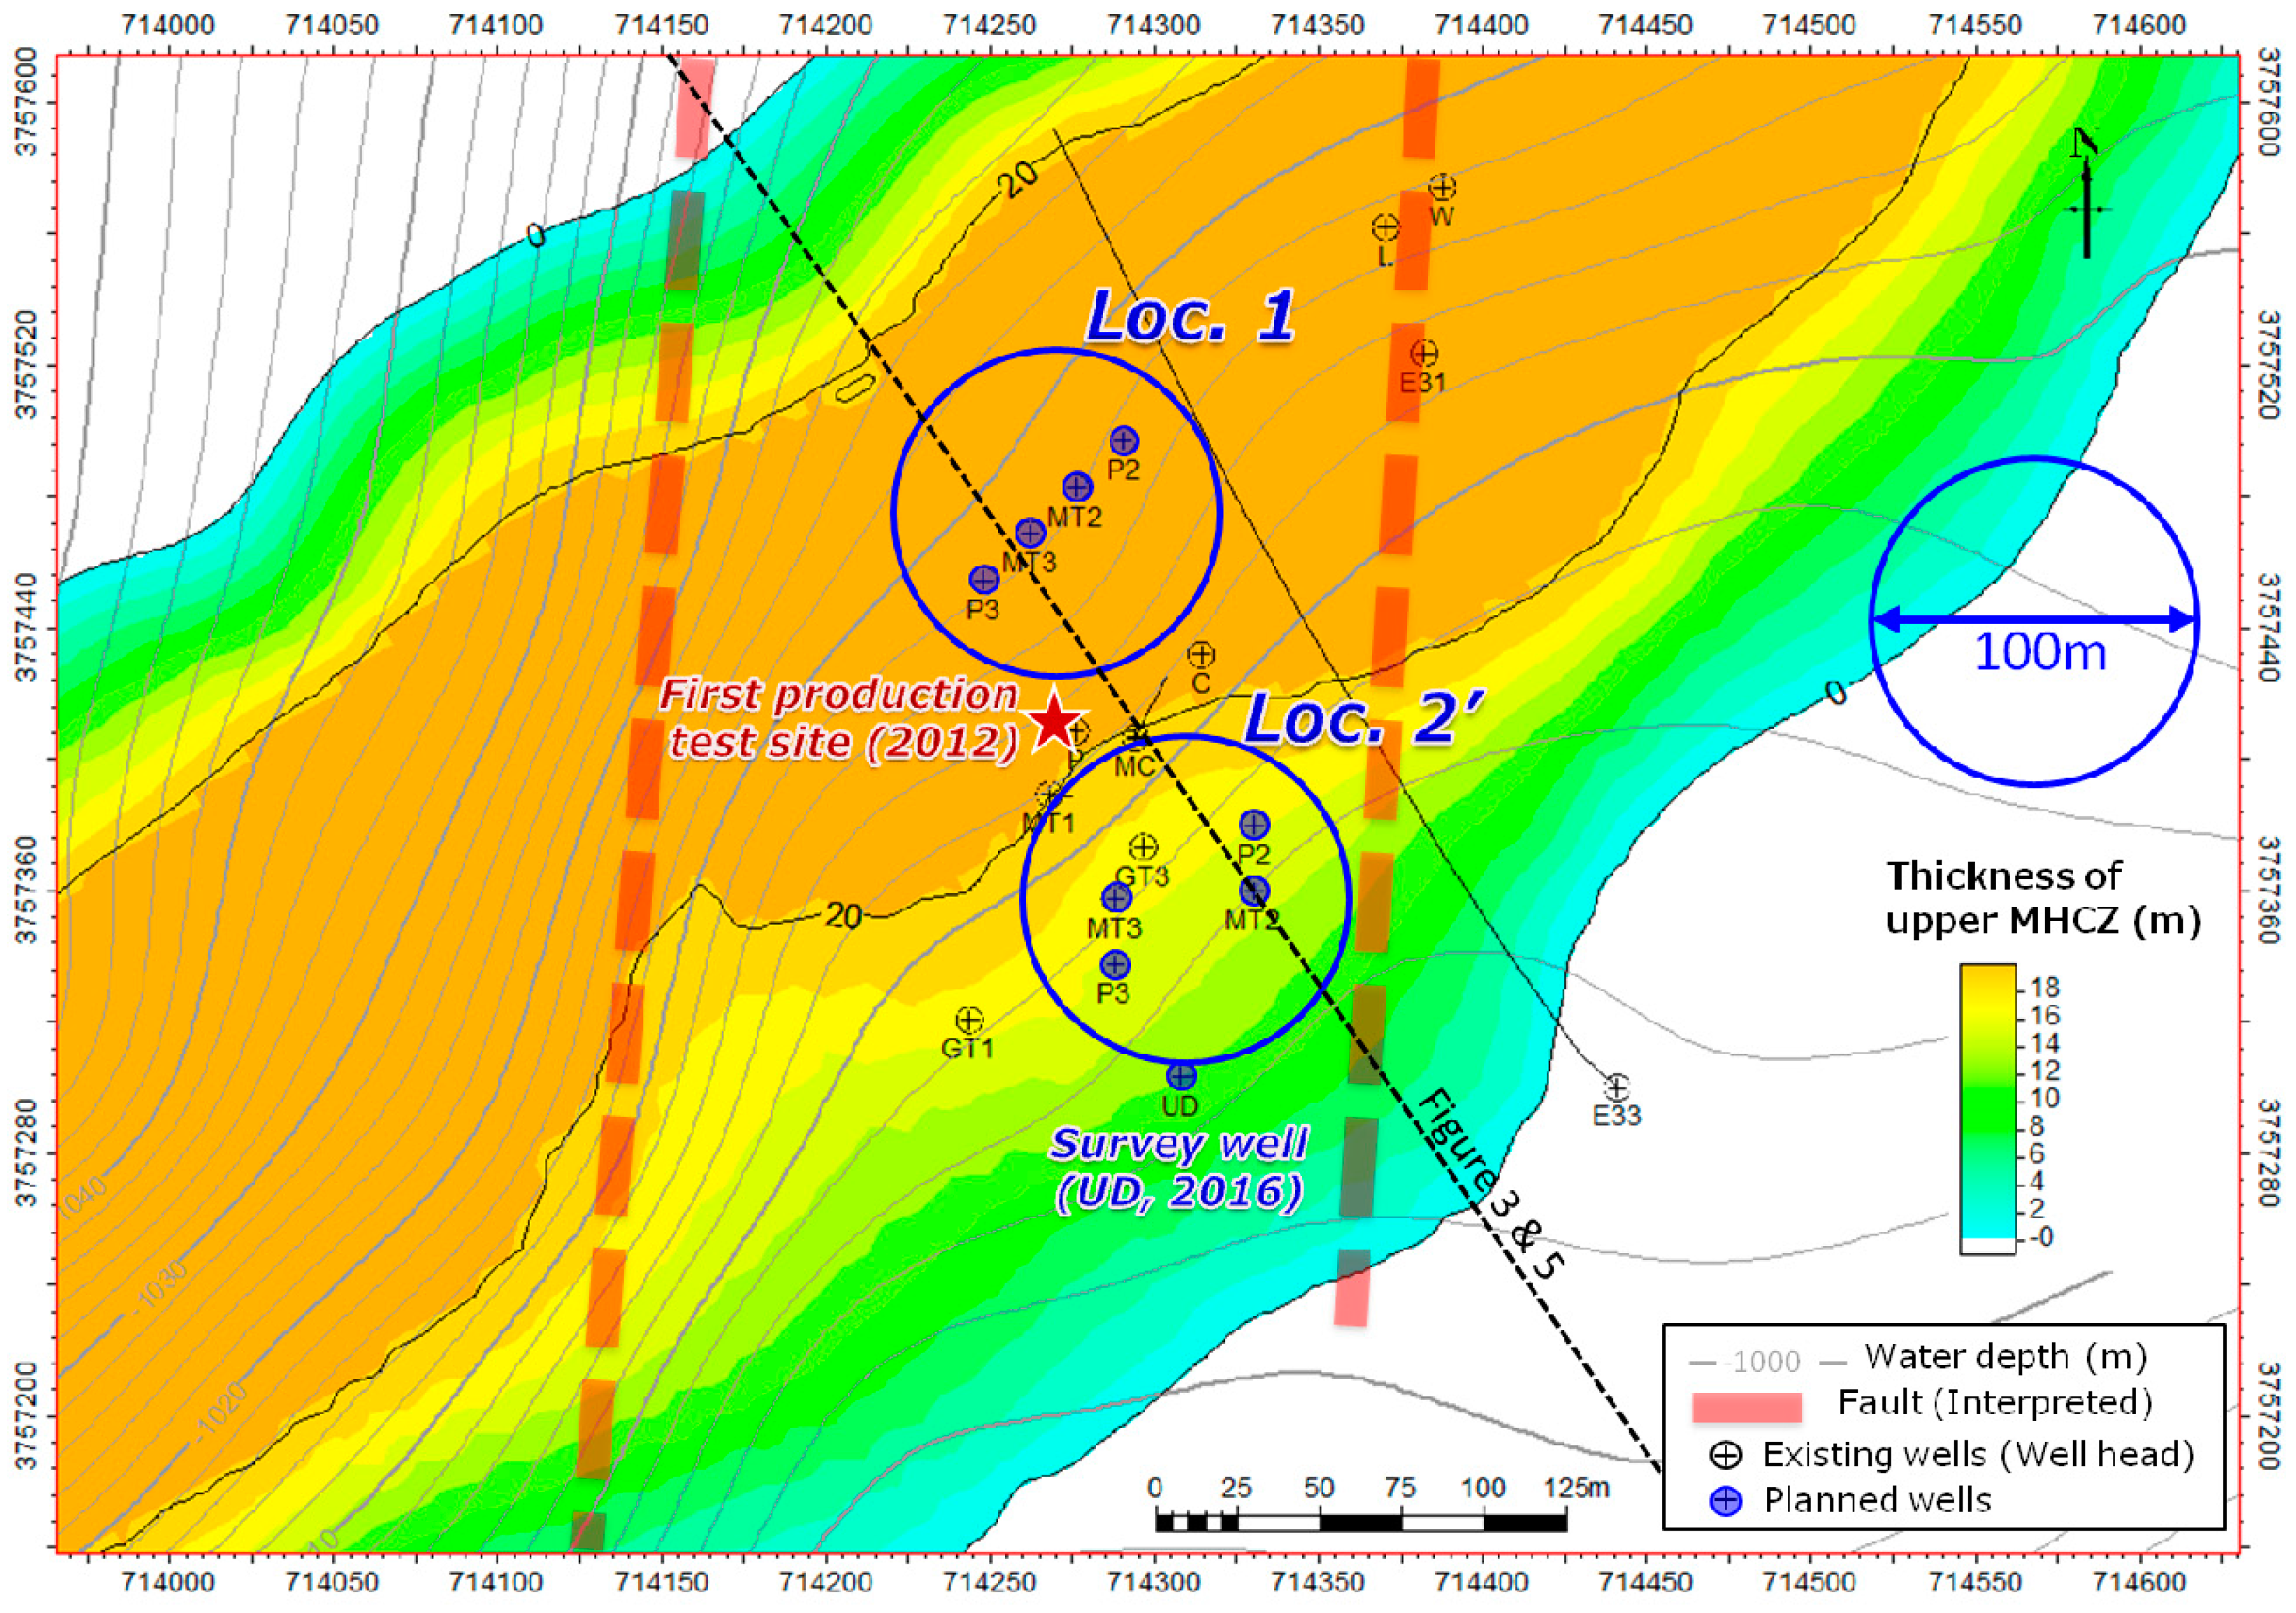
3. Site Screening Process to Narrow Down the Candidate Location

In 2015, two candidate locations were narrowed down through the site screening process (location 1 and location 2’, Figure 3b and Figure 4) [6]. The basic screening criteria for the candidate locations were: (1) in the vicinity of the first production test site to reduce geological risk and drilling cost; (2) expected for the stable gas production with an adequate production rate; (3) risk mitigation for intervention with the pre-drilled existing wells during the production; (4) risk mitigation for rapid water breakthrough into producing wells through the faults/fractures and low-NGH bearing layers; and (5) seabed stability for the installation of production equipment (i.e., excluding the area where the sea slope is steep). Based on the above screening criteria, east area (close to faults/fractures) and west area (steep sea slope) were excluded from the candidate sites.
Each candidate has both advantages and disadvantages of the production test site. For location 1, the target reservoir covers the upper unit of 20 m (Figure 4) where the high productivity and predominant NGH dissociation were observed in the first production test [3,4]. However, the location has a concern regarding rapid water breakthrough into the producing well from the structural down-dip side below BSR which almost corresponds to the base of the NGH stability zone (i.e., NGH/water contact) (Figure 3b). On the other hand, location 2’ has an uncertainty of the reservoir quality for the upper unit due to sparse data of the structural up-dip side although the location can assure the longer vertical production interval compared with location 1. Considering the above concern and uncertainty, a new well was drilled in the structural up-dip side (UD, Figure 3b and Figure 4) before the production test. The production location was finally determined based on the formation evaluation of the UD well onboard the drilling ship.

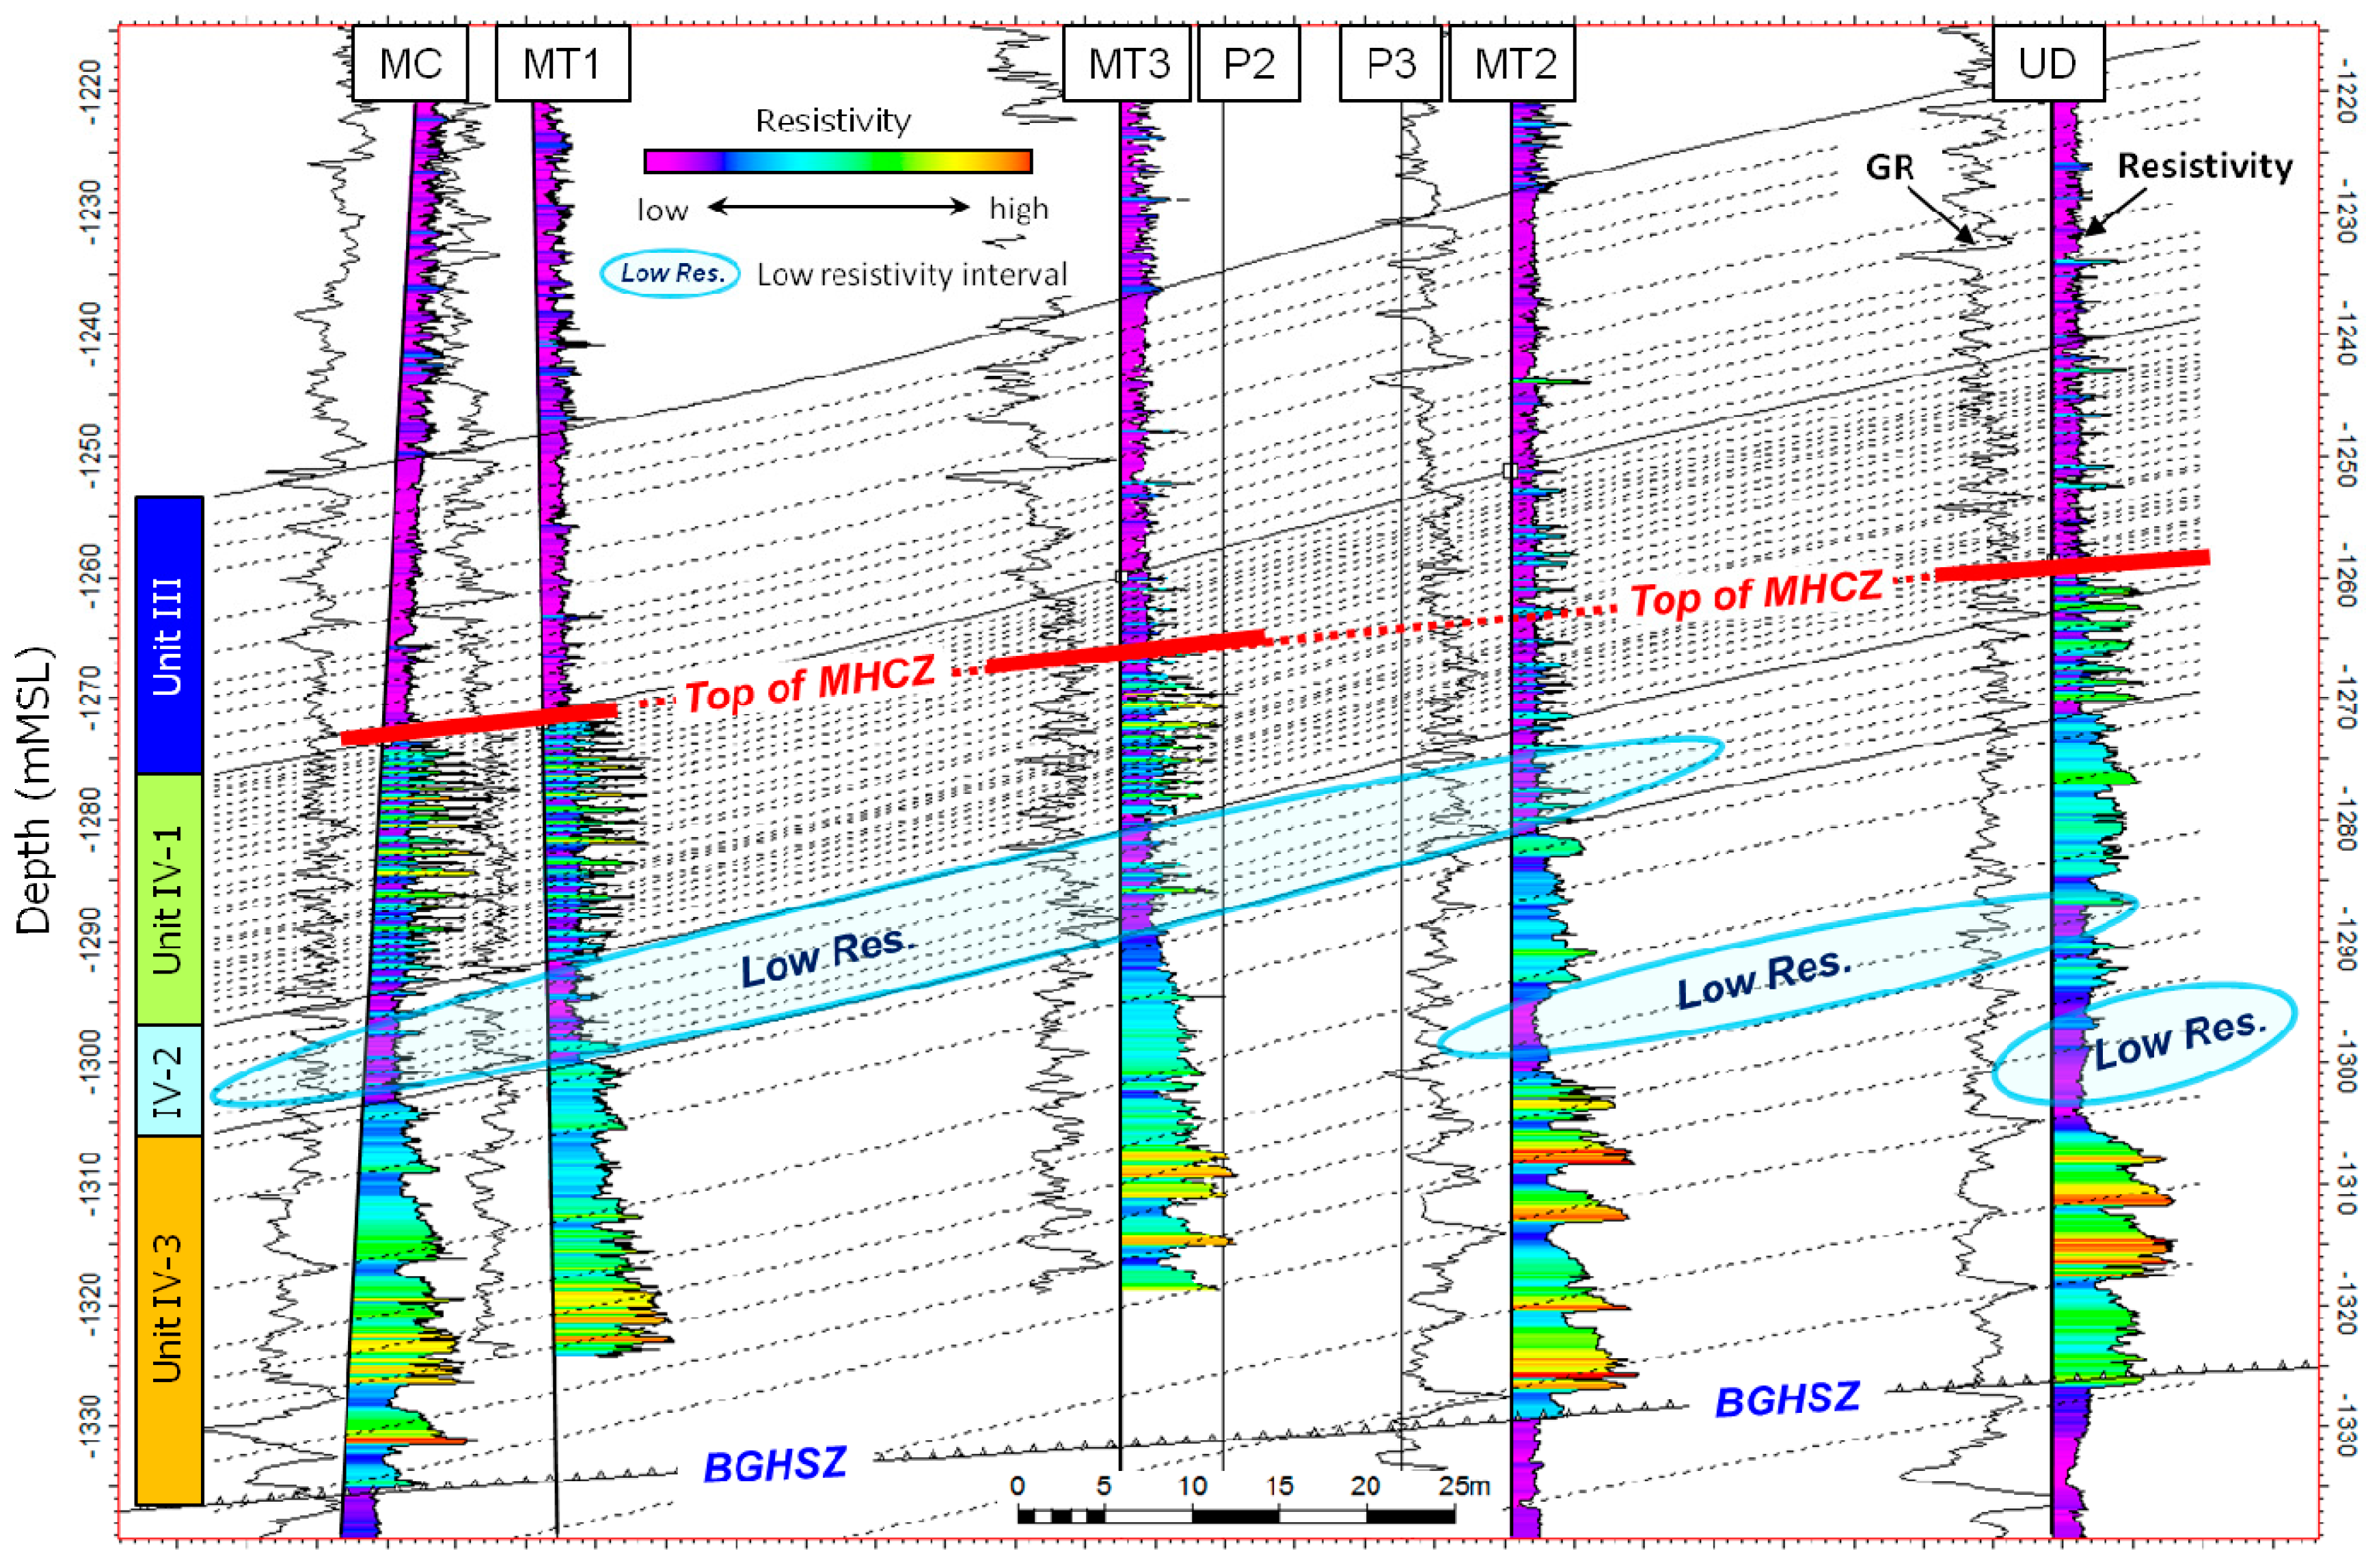
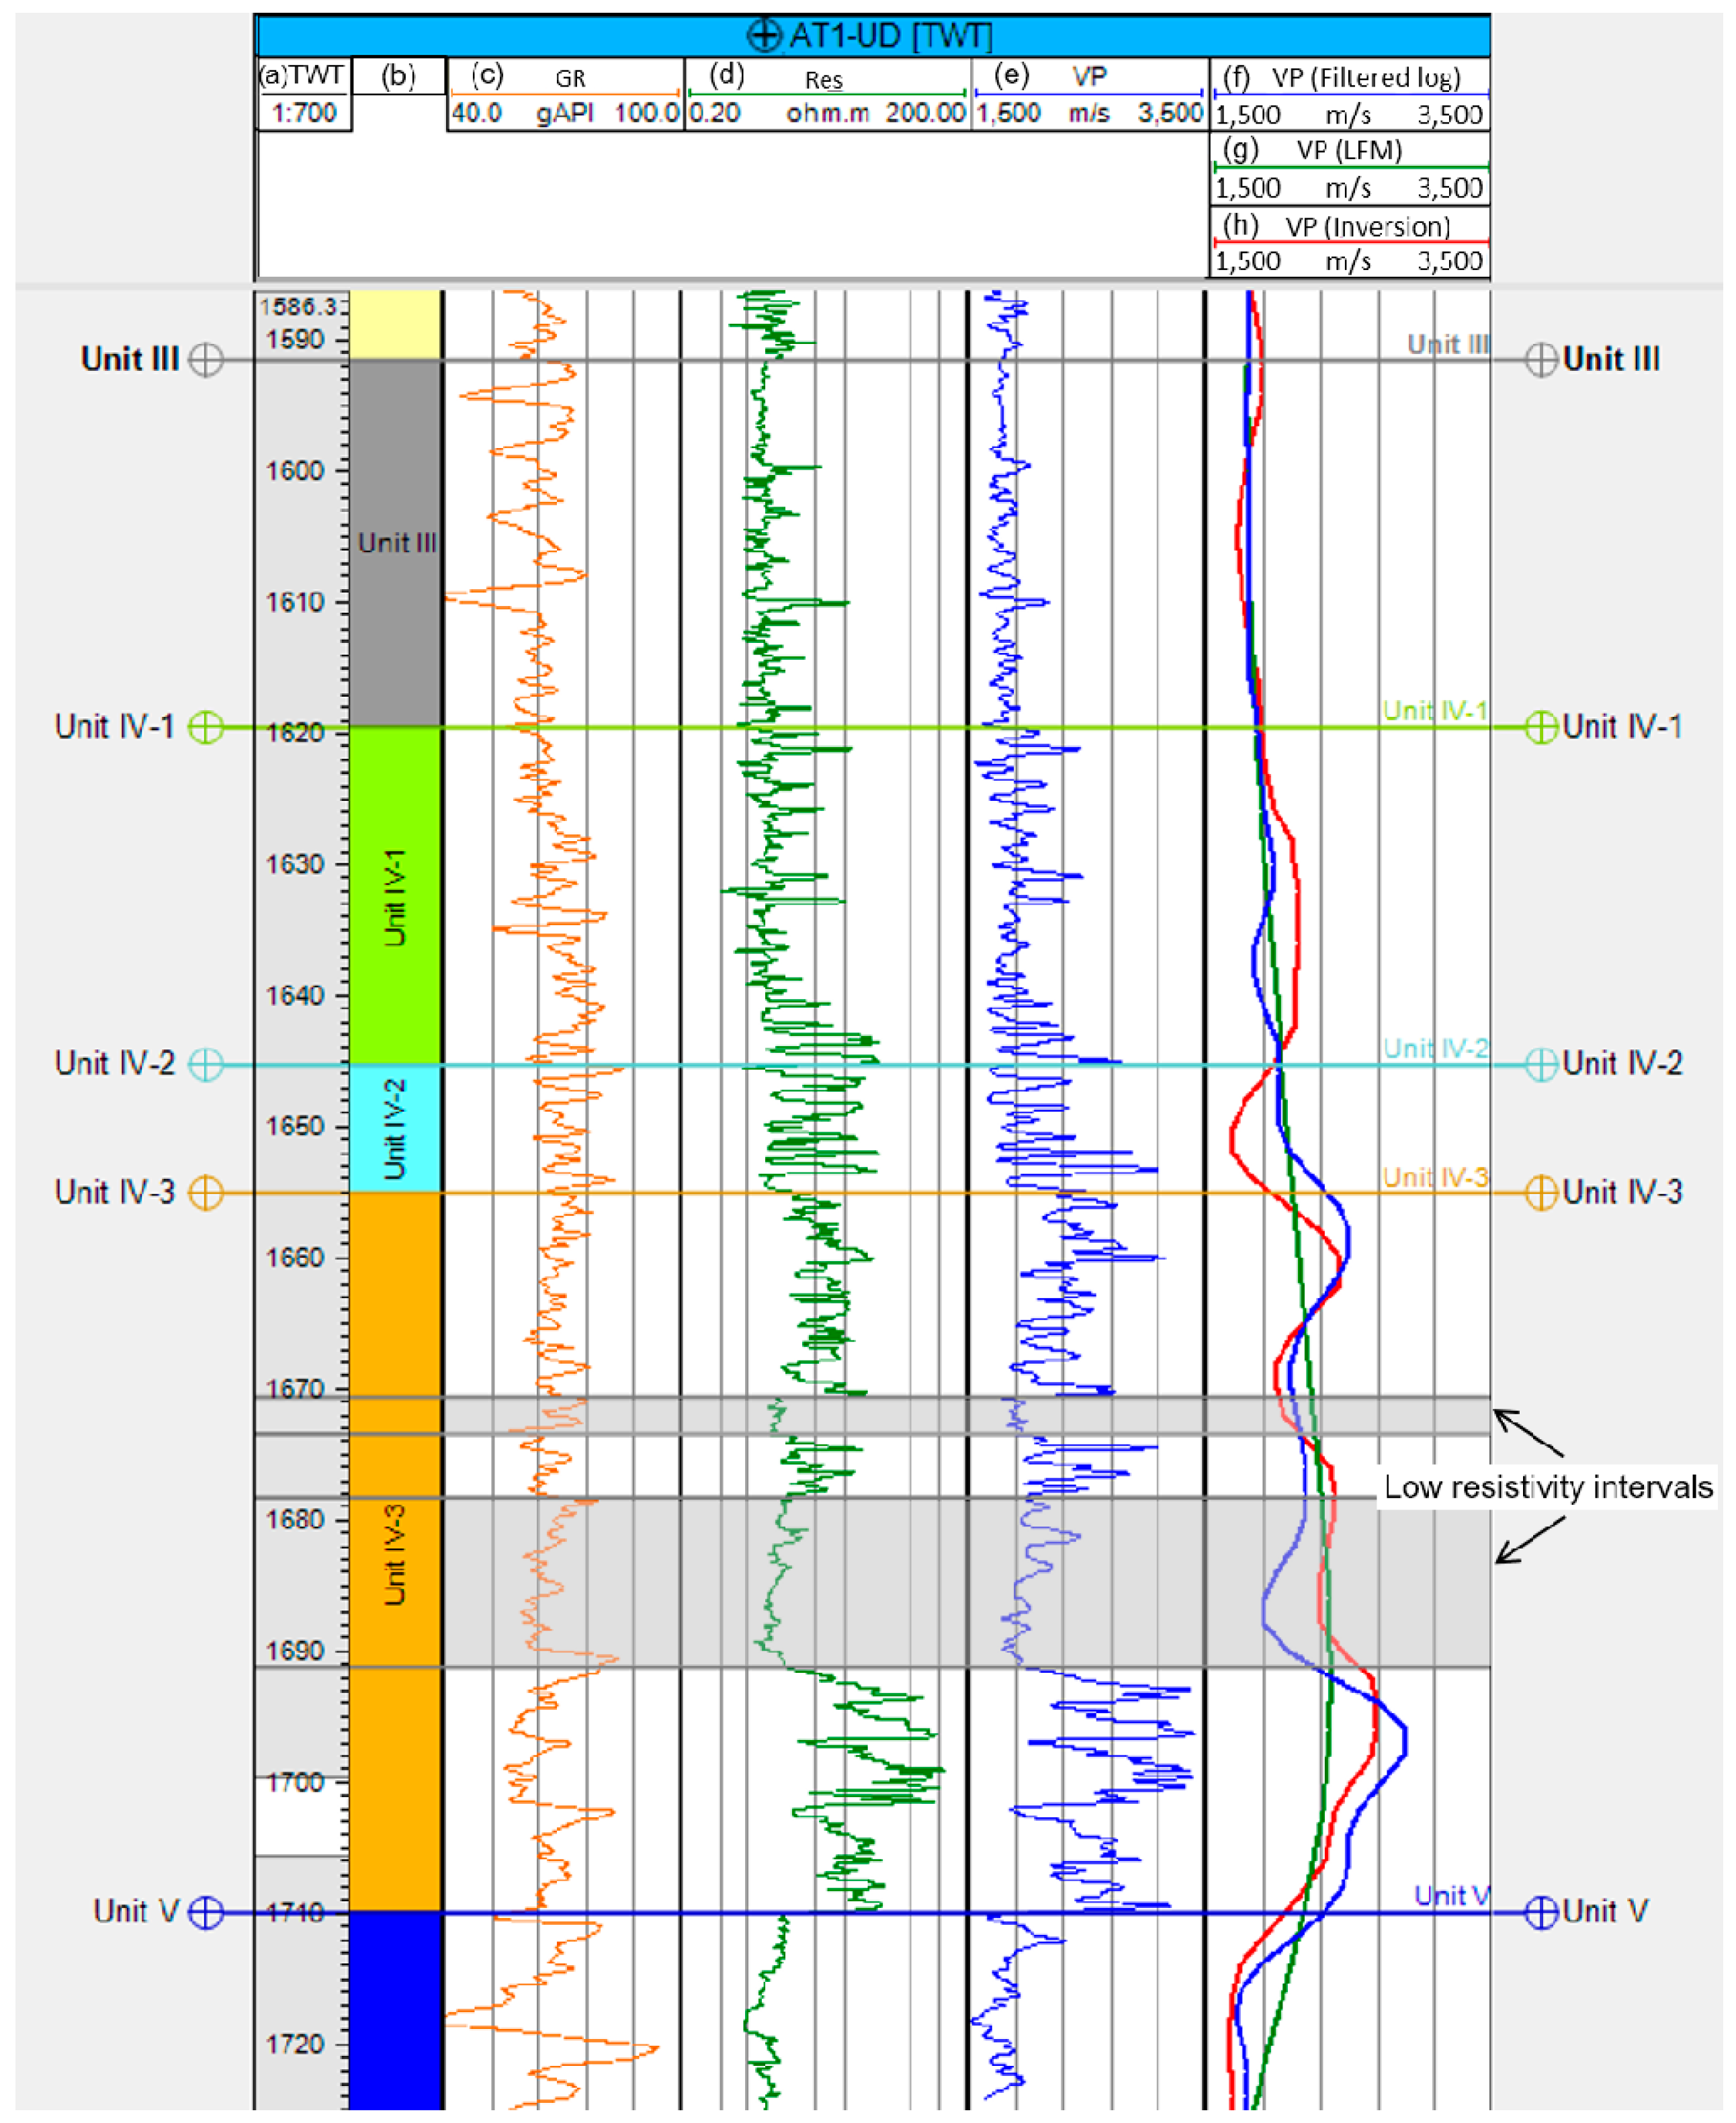
4. Well Log Observations and the Internal Reservoir Heterogeneity

4.1. Formation Evaluation of Geological Survey Well and Selection of the Candidate Site

During the drilling campaign in 2016, the UD well was firstly drilled ahead of the drilling of the two monitoring wells (MT2 and MT3). The logging while drilling (LWD) result of the UD well clarifies approximately 67 m gross thickness of MHCZ identified by the high resistivity interval (Figure 5). Based on the petrophysical analyses, the NGH saturation in the thin-normal alternation unit at the UD well which stratigraphically corresponds to Unit IV-1 at MC and MT1 wells is much poorer than that of the MC and MT1 wells. Unit IV-2 was characterized by the low-resistivity interval at the MC and MT1 wells (Figure 5). However, the same stratigraphic unit at the UD well shows apparent high resistivity and much more NGH saturation. By simple interpolation of the top of the MHCZ between the MC and UD wells, it is expected that location 2’ has a NGH reservoir with both upper and lower units, although it may have the low-resistivity interval in the MHCZ that appears at the UD well. Well-to-well correlations, including the previous wells, show basically good lateral continuities of the dominant sand layers in the turbidite sequence. The depth of each unit boundary is almost same as the predicted depth estimated by the 3D geological model, which suggests a stable structure without significant gaps caused by major faults around the drilling area.
By considering the expected reservoir potential at location 2’, such as the expected production interval, thickness of the thin-normal alternation unit, and top and lateral sealing unit capacity evaluated from the LWD data of the UD well, location 2’ was finally selected for the second production test site.

4.2. NGH Reservoir Heterogeneity Within the MHCZ

After the drilling of the UD well and the decision of the location, two monitoring wells (MT2 and MT3) and two producing wells (P2 and P3, only for the part shallower than the NGH reservoir) were drilled. Well-to-well correlations, including the MT2 and MT3 wells, also show good lateral continuity (Figure 5). Basically, lithological and sedimentary features of these wells were almost the same with those of the wells for the first production test site [7]. However, resistivity log data indicate a more heterogeneous NGH distribution within the MHCZ. It is also found that the lower unit (Unit IV-3) has the apparent low-resistivity intervals in sandy layers at the MT2 and UD wells, but these are not continued in the same stratigraphic layers at the other wells (Figure 5). Based on the petrophysical analysis, the low-resistivity intervals in sandy layers are interpreted to be of low NGH saturation (i.e., high water saturation) [7]. The well log results suggest that the target reservoir within the MHCZ is more heterogeneous than expected. The interval of the low-NGH saturation in sandy layers has a risk of rapid water breakthrough into the producing wells which possibly causes the sand flow damage to the screens (sand production) as well as the decrease of gas productivity. Therefore, it is important to understand the spatial distribution of the low-resistivity intervals.

5. Method for the Understanding the Spatial Distribution of the NGH-Bearing Sediments

One of the critical issues for the production test is the prediction of the reservoir quality at the producing wells. The pre-drill predictions were necessary for the production planning, such as well design and the completion interval. In the present study, we investigated the spatial distribution of NGH-bearing sediments by integration of 3D seismic and well log data, and predicted the reservoir qualities at the producing wells based on the results. We focus on two issues for the upper and lower units.
The first issue is the reservoir quality at the upper unit. The resistivity log at the MT3 well shows high resistivity, but the MT2 well shows relative weak resistivity, as does the UD well (Figure 5). To understand the spatial distribution of the reservoir quality in the upper unit, we performed an amplitude map analysis by using the reservoir top seismic horizon. Basically, NGH-bearing sediments generate an increase in impedance at the upper contact, which produces a positive or peak event (in the 0° phase North American polarity) and a strong reflection in the seismic data (e.g., [15,17]). Therefore, seismic mapping of the amplitude is one of the generalized approaches to identify and evaluate the potential direct indication of NGH occurrence. The seismic amplitude was also used for the quantitative evaluation of the NGH saturation and reservoir thickness by incorporation of the physical property model (e.g., [18,19]). In our target reservoir, the top of the MHCZ is identified by the strong peak reflection in the seismic data [15] (Figure 2). The variation of the amplitude intensity at the top of the MHCZ can be an approximate first-order indicator of the NGH-bearing saturation within the MHCZ (mainly upper MHCZ), in case the sediments above the MHCZ shows non/weak-NGH-bearing which represents the relative low impedance and small lateral variation. In the present study, we generated the amplitude map of the top of MHCZ to investigate the spatial distribution of NGH-bearing sediments and predict the reservoir quality at the producing wells based on the result of the correlation between the seismic amplitude and well data.
The second issue is to investigate the spatial distribution of the low-resistivity interval at the lower unit and predict the appearance at the producing wells. This is an important factor for deciding the completion interval in order to mitigate risk of rapid water breakthrough into the producing wells. Based on the well log analysis, the low-resistivity interval also shows the low P-velocity (Vp) in the sonic log data. In the present study, we used seismic inversion analysis to obtain the Vp volume. Several NGH studies applied the seismic inversion analysis for the quantitative evaluation of the NGH-related properties, as well as the amplitude analysis (e.g., [20,21,22]). The results of our previous seismic inversion conducted before the first production test suggested that the seismic data were effective for the prediction of the NGH saturation, especially for the low NGH saturation unit [9]. Therefore, we updated the previous inversion results [23] by using post-stack seismic data and well log data, including newly-obtained wells. We applied the model-based inversion algorithm [24] using Petrel software developed by Schlumberger.

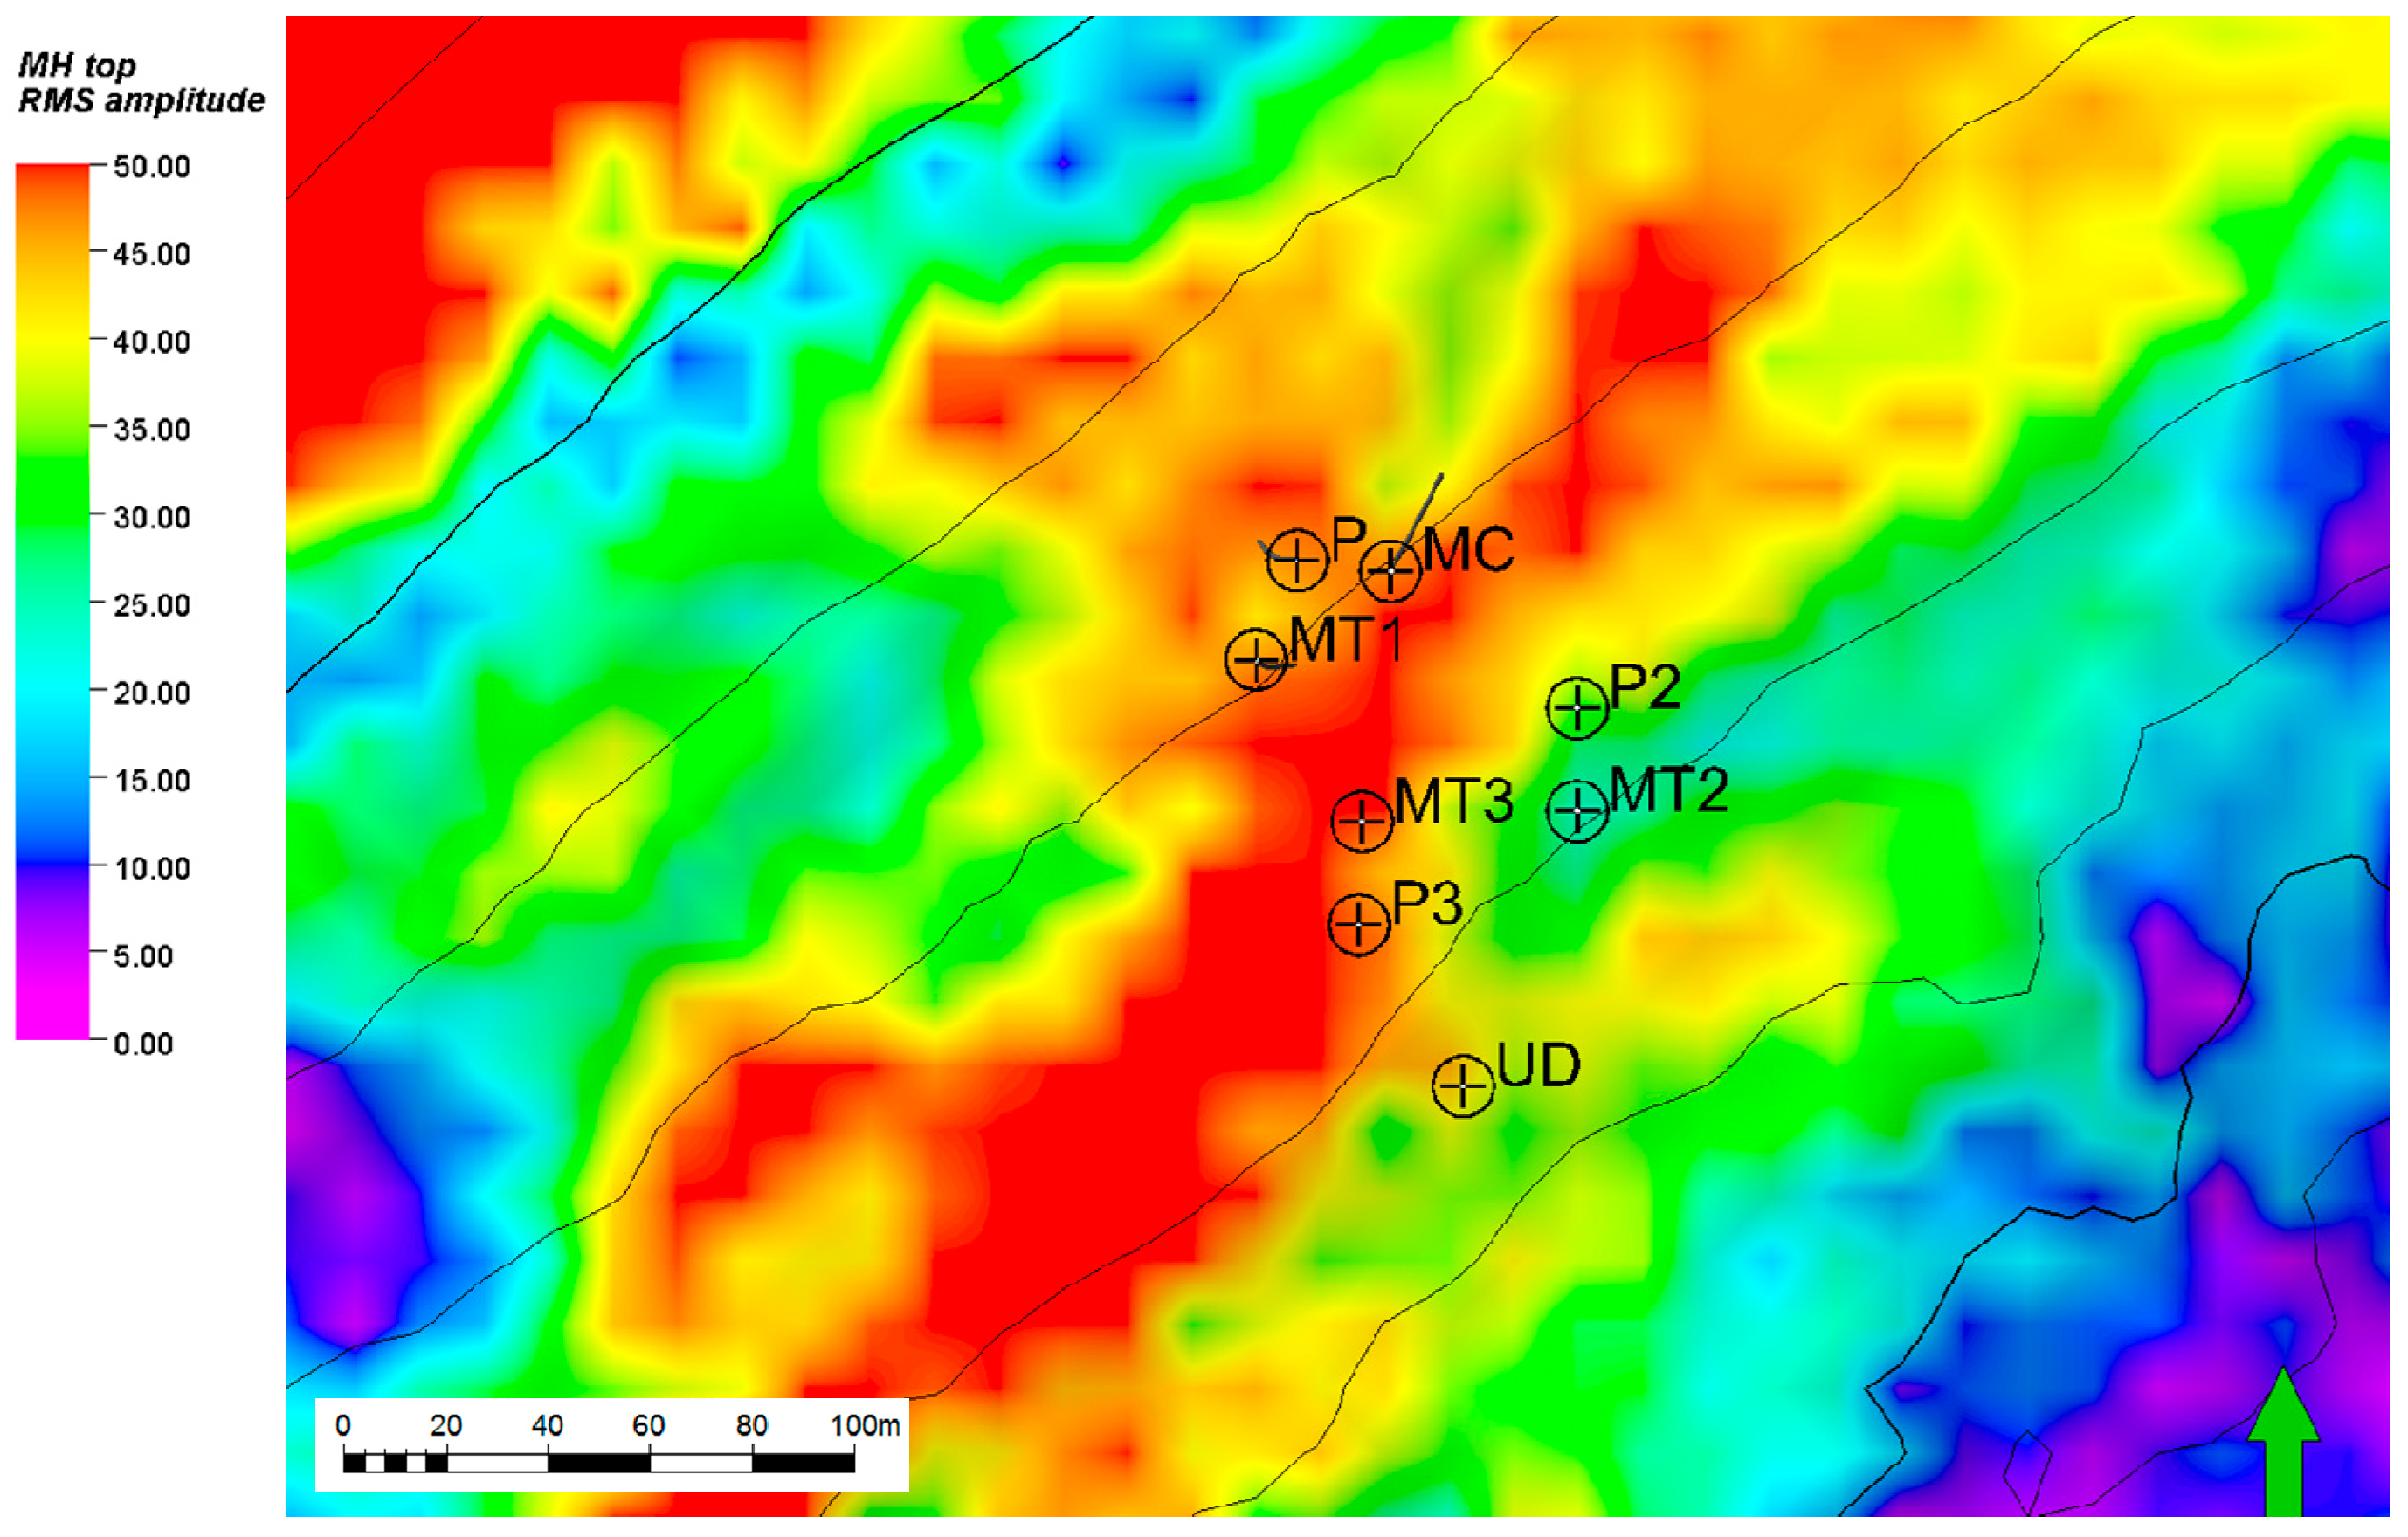
6. Results of Integration of the Well Log and Seismic Data

6.1. Reservoir Quality for the Upper Unit

Figure 6 shows the amplitude map generated by the top of the MHCZ. We applied a +/− 5 ms window to estimate root-mean-square (RMS) amplitude. The amplitude map depicts the relative strong amplitude (colored in red) in a NE–SW direction that passes through the location of the MT3 well. On the other hand, the location of the MT2 well shows the relatively weak amplitude. This trend is concordant with the observation of resistivity log at the upper unit (Figure 5). In this study, we made a cross-plot between the integrated resistivity for the upper unit and intensity of the RMS amplitude at each location using the existing seven wells that have LWD resistivity logs. The result shows a positive correlation (correlation coefficient, 0.718, Figure 7), which suggests that the higher intensity of the amplitude can be expected for the higher NGH potential. If we plot the amplitude of the two producing wells on this correlation, we can predict that the reservoir quality of the P3 well will be similar with that of the MT3 well and the wells drilled at the first test site, and the reservoir quality of the P2 well will be similar with that of the MT2 and UD wells.

6.2. Reservoir Quality for the Lower Unit

Figure 8 and Figure 9 show the results of the Vp derived from the seismic inversion. Since the seismic data are generally lacking in low-frequency information, a low-frequency model (initial model) is necessary to obtain quantitative data in the seismic inversion (e.g., [22,24,25]). In our previous study, the low-frequency model was constructed by the geological horizons from the seismic interpretation and data from one well log. We updated the low-frequency model by the data from several wells, including newly-drilled wells. The seismic velocity was also used as a guide to construct the model. The wavelet was estimated by the deterministic method, which was extracted by de-convolution of the seismic trace. The Vp was obtained from the acoustic impedance inversion using the constant value of the density (1000 kg/m3), which is the same as the previous approach [23].
Figure 8 shows the well log data and seismic inversion results in the two-way-time scale that are extracted at the location of the UD well. The Vp in the low-frequency model (the green line in the right column (g)) is relatively high in the NGH reservoir interval. The inversion result (the red line in the right column (h)) almost reproduced the internal reservoir heterogeneity observed from the filtered log data (the blue line in the right column (f)). Around the low-resistivity intervals in Unit IV-3 (gray zone in Figure 8) the inversion result shows the relative low Vp intervals which are similar trends with the filtered Vp log data.
Figure 9a–c show the cross-section through the wells. In the cross-section through the wells for the west side (MC-MT3-P3-UD wells, Figure 9a), the low-velocity zone observed at the UD well continues to the down-dip side and close to the P3 well, but it does not appear at the MT3 well. However, in the cross-section through the wells for the east side (MC-P2-MT2-UD, Figure 9b), the low-velocity zone obviously continues to the down-dip side at the MT2 well, which has the low-resistivity interval, and it also appears at the P2 well. These results show that the low velocity zone is developed along the east side, as well as along the up-dip side around the production test site. The cross-section through the producing wells (Figure 9c) predict that the P2 well will have a risk of the low-resistivity interval connected to the MT2 well in the lower unit. On the other hand, the P3 well will not have the apparent low-resistivity interval, but it will exist close to the structural up-dip side toward the UD well (Figure 9a).

7. Discussion and the Way Forward

The integration analysis, by using the existing well and seismic data, statistically demonstrated that the seismic amplitude map generated from top of the MHCZ is useful to understand the lateral heterogeneity and reservoir quality of NGH-bearing sediments around the production test area. The significant correlation between the seismic amplitude and resistivity log data become apparent only after the drilling campaign in 2016 since the previous existing wells show similar amplitudes (Figure 7). The structural up-dip well data provided us with the geological information to understand the spatial distribution of the NGH-bearing sediments and the internal reservoir heterogeneity within the MHCZ. The seismic amplitude information provides the spatial information in constructing a 3D geological model used for the dynamic flow reservoir simulation.
The strong amplitude anomaly suggests that the highest reservoir quality lies in a NE–SW trending direction (Figure 6). From a geological point of view, our interest is to clarify the controls on the preference of the NGH prospect in our target area. Based on the well log interrelation, lithological continuity is relatively good and there is no drastic lateral variation of lithologies around the production test site [7]. Structural analysis also shows that the bedding is stable without major structural gaps. However, further investigation of the detailed observations using core data is still necessary to confirm the slight lithological variations and small-scale faults/fractures. In addition, a petrogenetic approach including bio-chemical information, effective surface area of minerals and contents of organic compounds is also important to consider the controls on the existence of NGH and the preference of the gas migration path. The basin modeling is one of the approaches used to model the NGH system [26].
The presence of the low-resistivity interval within the MHCZ is a critical issue not only for resource assessment but also reservoir productivity. The seismic inversion results are also useful to understand the spatial distribution of the internal reservoir heterogeneity including low-NGH/water bearing sediments. This enables us to reduce a risk of the future commercial production, as well as an exploration risk. The result of the well-to-well correlation suggests that the low-resistivity intervals are not necessarily continued to the same stratigraphic layers (Figure 5). It is notable that the lower limit of the layers with a low-resistivity interval is aligned at the same depth (around 1300 m below mean sea level (mMSL)). This indicates the importance of not only a geological constraint, but also some physical constraints, such as temperature and pressure. At Nankai, the double BSR could be the result of vertical migration of the base of the NGH stability zone caused by either sea level change or tectonics forces [27]. Although the apparent double BSR is not observed in our target area, such migration of the NGH stability zone is one of key issues to understand the formation mechanism of the low-resistivity interval within the MHCZ. Further investigation of NGH formation and localization mechanisms requires a multidisciplinary approach in order to more fully understand the controlling factor governing the formation of large concentrations of NGH.

Acknowledgments

This study was conducted as a part of the program of the Research Consortium for Methane Hydrate Resource in Japan (MH21 Research Consortium). The authors would like to express their sincere appreciation to MH21 and the Ministry of Economy, Trade, and Industry for providing permission to disclose this study.

Author Contributions

All authors contributed to the work of the reservoir characterization and publishing of this paper. Tetsuya Fujii performed the geological interpretation using well data and summarized the conception of the site screening process to narrow down the candidate locations for the second production test; Kiyofumi Suzuki performed the lithological interpretation, petrophysical analyses and formation evaluation using well data; and Machiko Tamaki performed the well-to-well correlation, geophysical analyses and integration analyses using well log and seismic data, and wrote the paper.

Conflicts of Interest

The authors declare no conflict of interest.

References

  1. Yamamoto, K.; Terao, Y.; Fujii, T.; Ikawa, T.; Seki, M.; Matsuzawa, M.; Kanno, T. Operational overview of the first offshore production test of methane hydrates in the Eastern Nankai Trough. In Proceedings of the Offshore Technology Conference, Huston, TX, USA, 5–8 May 2014. [Google Scholar]
  2. Matsuzawa, M.; Terao, Y.; Hay, W.J.; Wingstrom, L.; Duncan, M.W.; Ayling, I. A completion system application for the world’s first marine methane hydrate production test. In Proceedings of the Offshore Technology Conference, Huston, TX, USA, 5–8 May 2014. [Google Scholar]
  3. Yamamoto, K.; Kanno, T.; Wang, X.X.; Tamaki, M.; Fujii, T.; Chee, S.S.; Wang, X.W.; Pimenov, V.; Shako, V. Thermal Responses of a Gas Hydrate-bearing Sediment to a Depressurization Operation. RSC Adv. 2017, 7, 5554–5577. [Google Scholar] [CrossRef]
  4. Konno, Y.; Fujii, T.; Sato, A.; Akamine, K.; Naiki, M.; Masuda, Y.; Yamamoto, K.; Nagao, J. Key Findings of the World’s First Offshore Methane Hydrate Production Test off the Coast of Japan: Toward Future Commercial Production. Energy Fuels 2017, 31, 2607–2616. [Google Scholar] [CrossRef]
  5. Yamamoto, K.; Nakatsuka, Y. Planning and progress of the second offshore production Test. In JOGMEC Oil and Gas Technical Activity Report, 1st ed.; The Oil & Gas Upstream Technology Unit, Japan Oil, Gas and Metals National Corporation, Ed.; JOGMEC: Chiba, Japan, 2016; pp. 91–93. [Google Scholar]
  6. Fujii, T.; Suzuki, K.; Tamaki, M.; Takayama, T.; Suzuki, S. The selection of the candidate location for the second offshore methane hydrate production test and geological findings from the pre-drilling operation, in the eastern Nankai Trough, Japan. In Proceedings of the 9th International Conference on Gas Hydrates, Denver, CO, USA, 25–30 June 2017. [Google Scholar]
  7. Suzuki, K.; Takayama, T.; Tamaki, M.; Fujii, T. Lithological interpretation for constructing the geological model around wells for the 2nd offshore gas-production test from gas hydrate on the Daini-Atsumi knoll in eastern Nankai Trough area. In Proceedings of the 9th International Conference on Gas Hydrates, Denver, CO, USA, 25–30 June 2017. [Google Scholar]
  8. Tamaki, M.; Fujii, T.; Suzuki, K.; Takayama, T. Integrated reservoir characterization and 3D geological modeling for the gas hydrate potential evaluation at the 2nd offshore production test site in the eastern Nankai Trough, Japan. In Proceedings of the 9th International Conference on Gas Hydrates, Denver, CO, USA, 25–30 June 2017. [Google Scholar]
  9. Tamaki, M.; Suzuki, K.; Fujii, T.; Sato, A. Prediction and Validation of Gas Hydrate Saturation Distribution in the Eastern Nankai Trough, Japan: Geostatistical Approach Integrating Well-log and 3D Seismic Data. Interpretation 2016, 4, SA83–SA94. [Google Scholar] [CrossRef]
  10. Noguchi, S.; Shimoda, N.; Takano, O.; Oikawa, N.; Inamori, T.; Saeki, T.; Fujii, T. 3-D internal Architecture of Methane Hydrate-bearing Turbidite Channels in the Eastern Nankai Trough, Japan. Mar. Pet. Geol. 2011, 28, 1817–1828. [Google Scholar] [CrossRef]
  11. Takano, O.; Itoh, Y.; Kusumoto, S. Variation in forearc basin configuration and basin-filling depositional systems as a function of trench slope break development and strike-slip movement: Examples from the Cenozoic Ishikari-Sanriku-Oki and Tokai-Oki-Kumano-Nada forearc basins, Japan. In Mechanism of Sedimentary Basin Formation: Multidisciplinary Approach on Active Plate Margins, 1st ed.; Itoh, Y., Ed.; InTech: Rijeka, Croatia, 2013; pp. 3–25. ISBN 978-953-51-1193-1. [Google Scholar]
  12. Tsuji, Y.; Ishida, H.; Nakamizu, M.; Matsumoto, R.; Shimizu, S. Overview of the METI Nankai Trough Wells: A Milestone in the Evaluation of Methane Hydrate Resources. Resour. Geol. 2004, 54, 3–10. [Google Scholar] [CrossRef]
  13. Tsuji, Y.; Fujii, T.; Hayashi, M.; Kitamura, R.; Nakamizu, M.; Ohbi, K.; Saeki, T.; Yamamoto, K.; Namikawa, T.; Inamori, T.; et al. Methane-hydrate occurrence and distribution in the eastern Nankai Trough, Japan: Findings of the Tokai-oki to Kumano-nada methane-hydrate drilling program. In Natural Gas Hydrates—Energy Resource Potential and Associated Hazards, 1st ed.; Collett, T., Johnson, A., Knapp, C., Boswell, R., Eds.; AAPG Memoir: Tulsa, OK, USA, 2009; Volume 89, pp. 228–246. [Google Scholar]
  14. Uchida, T.; Lu, H.; Tomaru, H. Subsurface Occurrence of Natural Gas Hydrate in the Nankai Trough Area: Implication for Gas Hydrate Concentration. Resour. Geol. 2004, 54, 35–44. [Google Scholar] [CrossRef]
  15. Saeki, T.; Fujii, T.; Inamori, T.; Kobayashi, T.; Hayashi, M.; Nagakubo, S.; Takano, O. Extraction of methane hydrate concentrated zone for resource assessment in the eastern Nankai Trough, Japan. In Proceedings of the Offshore Technology Conference, Huston, TX, USA, 5–8 May 2008. [Google Scholar]
  16. Fujii, T.; Suzuki, K.; Takayama, T.; Tamaki, M.; Komatsu, Y.; Konno, Y.; Yoneda, J.; Yamamoto, K.; Nagao, J. Geological Setting and Characterization of a Methane Hydrate Reservoir Distributed at the First Offshore Production Test Site on the Daini-Atsumi Knoll in the Eastern Nankai Trough, Japan. Mar. Pet. Geol. 2015, 66, 310–322. [Google Scholar] [CrossRef]
  17. Boswell, R.; Shipp, C.; Reichel, T.; Shelander, D.; Saeki, T.; Frye, M.; Shedd, W.; Collett, T.; McConnell, R. Prospecting for Marine Gas Hydrate Resources. Interpretation 2016, 4, SA13–SA24. [Google Scholar] [CrossRef]
  18. Lee, M.; Collett, T.; Inks, T. Seismic-attribute analysis for gas-hydrate and free-gas prospects on the North Slope of Alaska. In Natural Gas Hydrates—Energy Resource Potential and Associated Hazards, 1st ed.; Collett, T., Johnson, A., Knapp, C., Boswell, R., Eds.; AAPG Memoir: Tulsa, OK, USA, 2009; Volume 89, pp. 541–554. [Google Scholar]
  19. Inks, T.; Lee, M.; Agena, W.; Taylor, D.; Collett, T.; Hunter, T.; Zyrianova, M. Seismic prospecting for gas hydrate and associated free gas prospects in the Milne Point area of northern Alaska. In Natural Gas Hydrates—Energy Resource Potential and Associated Hazards, 1st ed.; Collett, T., Johnson, A., Knapp, C., Boswell, R., Eds.; AAPG Memoir: Tulsa, OK, USA, 2009; Volume 89, pp. 555–583. [Google Scholar]
  20. Dai, J.; Xu, H.; Snyder, F.; Dutta, N. Detection and Estimation of Gas Hydrates Using Rock Physics and Seismic Inversion: Examples from the Northern Deepwater Gulf of Mexico. Lead. Edge 2004, 23, 60–66. [Google Scholar] [CrossRef]
  21. Shelander, D.; Dai, J.; Bunge, G.; Singh, S.; Eissa, M.; Fisher, K. Estimating Saturation of Gas Hydrates Using Conventional 3D data, Gulf of Mexico Joint Industry Project Leg II. Mar. Pet. Geol. 2012, 34, 96–110. [Google Scholar] [CrossRef]
  22. Rajput, S.; Thakur, N.K. Rock properties. In Geological Controls for Gas Hydrates and Unconventionals, 1st ed.; Elsevier: Amsterdam, The Netherlands, 2016; pp. 131–164. ISBN 978-0-12-802020-3. [Google Scholar]
  23. Noguchi, S.; Furukawa, T.; Aung, T.T.; Oikawa, N. Reservoir architecture of methane hydrate bearing turbidite channels in the eastern Nankai Trough, Japan. In Proceedings of the 7th International Conference on Gas Hydrates, Edinburgh, UK, 17–21 July 2011. [Google Scholar]
  24. Barclay, F.; Bruun, A.; Rasmussen, K.B.; Alfaro, J.C.; Cooke, A.; Cooke, D.; Salter, D.; Godfrey, R.; Lowden, D.; McHugo, S.; et al. Seismic Inversion: Reading between the Lines. Oilfield Rev. 2008, 20, 42–63. [Google Scholar]
  25. Latimer, R.B.; Davison, R.; van Riel, P. An Interpreter’s Guide to Understanding and Working with Seismic-derived Acoustic Impedance Data. Lead. Edge 2000, 19, 242–256. [Google Scholar] [CrossRef]
  26. Fujii, T.; Aung, T.T.; Wada, N.; Komatsu, Y.; Suzuki, K.; Ukita, T.; Wygrala, B.; Fuchs, T.; Rottke, W.; Egawa, K. Modeling Gas Hydrate Petroleum Systems of the Pleistocene Turbiditic Sedimentary Sequences of the Daini-Atsumi Area, Eastern Nankai Trough, Japan. Interpretation 2016, 4, SA95–SA111. [Google Scholar] [CrossRef]
  27. Foucher, J.P.; Nouzé, H.; Henry, P. Observation and Tentative Interpretation of a Double BSR on the Nankai Slope. Mar. Geol. 2002, 187, 161–175. [Google Scholar] [CrossRef]
Figure 1. (a) Index map of the Tokai-Atsumi-Kumano forearc basin around the eastern Nankai Trough; and (b) the seabed structure map (vertical scale is two-way-time (ms)) and well location map around the first and second offshore gas hydrate production test sites.
Energies 10 01678 g001
Figure 2. Seismic cross-section through the AT1-MC well and logging data obtained in the AT1-MC well (modified from [9]). The location of the cross-section profile is shown in Figure 1.
Energies 10 01678 g002
Figure 3. (a) Well log results at the first production test site. Log data at each well shows the gamma ray (left) and resistivity (right) measurements; and (b) the geological cross-sections pass through the candidate locations and the first production test site. The location of the cross-section profile is shown in Figure 4. The geological unit boundary defined in this figure is in accordance with [16].
Energies 10 01678 g003
Figure 4. Candidate locations for the second production test (planned) (modified from [6]). The colored area shows the thickness of the upper MHCZ (Unit IV-1 and Unit IV-2 within the methane hydrate-concentrated zone).
Energies 10 01678 g004
Figure 5. Logging data at AT1-UD, MT2, and MT3 wells, and the results of well-to-well correlations together with the existing wells (MC and MT1) at the first production test. Each well shows the log data of the gamma ray (left) and resistivity (right) measurements. Cross-section profiles pass through the MT2 well (Figure 4). The wells, except for the MT2 well, are plotted by the vertical projection to the cross-section. The geological unit boundary defined in this figure is in accordance with [16].
Energies 10 01678 g005
Figure 6. RMS amplitude map generated from the top of the MHCZ horizon around the production test site.
Energies 10 01678 g006
Figure 7. Cross-plot between the integrated resistivity for the upper unit (Unit IV-1 and Unit IV-2) and the RMS amplitude for the top of the MHCZ at each location using the existing seven wells.
Energies 10 01678 g007
Figure 8. The well log data and seismic inversion results: (a) two-way-time scale (TWT); (b) geological unit; (c) natural gamma ray log (GR); (d) resistivity log (Res); (e) P-velocity from sonic logs (Vp); (f) filtered Vp log applied by a high cut filter of 87.5 Hz; (g) Vp, low-frequency model (LFM) used for the seismic inversion; and (h) Vp, result of the seismic inversion. The lines (g) and (h) are extracted at the location of the UD well.
Energies 10 01678 g008
Figure 9. The results of the Vp estimated by the seismic inversion. The cross-sections are through the wells: (a) MC-MT3-P3-UD wells for the west side; (b) MC-P2-MT2-UD wells for the east side; and (c) P2-P3 wells for the pre-drill prediction of the reservoir quality. The projected distribution of the low Vp in the lower unit is shown by 2D plane (upper right side in Figure 9c). The vertical scale in the cross-section is two-way-time (ms).
Energies 10 01678 g009aEnergies 10 01678 g009b

