Comparison of Modelled and Measured Tilted Solar Irradiance for Photovoltaic Applications


1
Institute for Meteorology and Climatology, Leibniz Universität Hannover, Herrenhäuser Straße 2, 30419 Hannover, Germany
2
Valentin Software GmbH, Stralauer Platz 34, 10243 Berlin, Germany
3
Physikalisch-Technische Bundesanstalt (PTB), Bundesallee 100, 38116 Braunschweig, Germany
*
Author to whom correspondence should be addressed.
Energies 2017, 10(11), 1688; https://doi.org/10.3390/en10111688
Submission received: 9 August 2017
/
Revised: 10 October 2017
/
Accepted: 16 October 2017
/
Published: 25 October 2017
(This article belongs to the Section L: Energy Sources)
Abstract
:This work assesses the performance of five transposition models that estimate the global and diffuse solar irradiance on tilted planes based on the global horizontal irradiance. The modelled tilted irradiance values are compared to measured one-minute values from pyranometers and silicon sensors tilted at different angles at Hannover (Germany) and NREL (Golden, CO, USA). It can be recognized that the deviations of the model of Liu and Jordan, Klucher and Perez from the measurements increases as the tilt angle increases and as the sensors are oriented away from the south direction, where they receive lower direct radiation than south-oriented surfaces. Accordingly, the vertical E, W and N planes show the highest deviation. Best results are found by the models from Hay and Davies and Reindl, when horizontal pyranometer measurements and a constant albedo value of 0.2 are used. The relative root mean squared difference (rRMSD) of the anisotropic models does not exceed 11% for south orientation and low inclination angles (β = 10–60°), but reaches up to 28.9% at vertical planes. For sunny locations such as Golden, the Perez model provides the best estimates of global tilted irradiance for south-facing surfaces. The relative mean absolute difference (rMAD) of the Perez model at NREL ranges from 4.2% for 40° tilt to 8.7% for 90° tilt angle, when horizontal pyranometer measurements and a measured albedo value are used; the use of measured albedo values instead of a constant value of 0.2 leads to a reduction of the deviation to 3.9% and 6.0%, respectively. The use of higher albedo values leads to a significant increase of rMAD. We also investigated the uncertainty resulting from using horizontal pyranometer measurements, in combination with constant albedo values, to estimate the incident irradiance on tilted photovoltaic (PV) modules. We found that these uncertainties are small or negligible.
1. Introduction
To estimate the expected energy output of a PV system, yield estimation models are used which need specific input parameters such as global solar irradiance. Since small uncertainties in the model parameters can lead to large deviations from the expected returns on investment, uncertainties resulting from model input should be reduced as much as possible.
Estimating solar irradiation incident on tilted surfaces of various orientations is essential to estimate the electric power generated by PV, to design solar energy systems and to evaluate their long-term average performance [1]. However, the available measurement data are suboptimal, since global horizontal or diffuse horizontal irradiance measurements provided by pyranometers are often the only available measurements at most locations. Even if tilted measurements are performed, the tilt angle chosen for the measurement is not necessarily the optimal tilt angle for the location. Consequently, the tilted solar irradiance must be determined by converting the solar irradiance on a horizontal surface to that incident on the tilted surface of interest [2].
Transposition models based on global and diffuse horizontal irradiance have been widely used in the solar energy industry to estimate the solar irradiance incident on tilted PV panels. The transposition models parametrize the irradiance on a tilted plane to three components: direct, diffuse and ground reflected radiation. The direct radiation can be computed by the geometrical relationship between the horizontal and tilted surfaces. The ground reflected radiation can be estimated with the aid of an isotropic model by using simple algorithms. The assumption of isotropy may be justified for estimating the influence of the albedo but is problematic for the diffuse component. This is due to the complexity of the angular dependence of the diffuse component, which depends on many factors such as solar zenith angle and clouds [3]. The continuing evolution and diversity of transposition models illustrates the complexity of the task.
Early models converted the horizontal diffuse radiation to the tilted plane by assuming that the total sky diffuse radiation is distributed isotropically over the sky dome [4,5,6]. However, this assumption is too simple and is inconsistent with reality. Newer transposition models treat the diffuse component as anisotropically distributed. Several anisotropic models only consider an isotropic background and an additional circumsolar region; others also take the horizon-brightening into account. However, this assumption is only valid in the absence of clouds as in overcast situations the horizon tends to be darker than the zenith [7].
Many authors have studied the accuracy of transposition models by comparing the modelled irradiance with measured values in different climate conditions. Kambezidis et al. [8] used twelve sky diffuse models to calculate the global irradiance on a south-facing surface tilted at 50° in Athens, Greece. Furthermore, four albedo models were used to assess the albedo of the measurement location. The performance of models was evaluated against hourly measurements of global solar irradiance. The transposition models proposed by Gueymard [9], Hay [10], Reindl [11], and Skartveit and Olseth [12] were found to have the best overall performances, in conjunction with either one of three albedo sub-models.
Notton et al. [13] evaluated the performance of 15 transposition models against measured hourly data for two tilted surface angles (45° and 60°) in Ajaccio, France. Among the tested models, the Perez model shows the best accuracy. The authors chose a constant value of 0.2 for the albedo as the most commonly used value in the literature for visible radiation. Gueymard et al. [14] have shown that the deviation between measured and modelled irradiance depends on the uncertainty of the global horizontal irradiance, ground albedo and other factors. Gueymard [15] compared ten transposition models that were appraised against one-minute global irradiance measured on fixed-tilt, south-facing planes (40° and 90°) and a two-axis tracker at NREL’s Solar Radiation Research Lab. in Golden (CO, USA). They found that the Gueymard and Perez models provide the best estimates of global irradiance incident on tilted surfaces for sunny sites only when optimal input data (measured direct, diffuse and albedo) are used. When only global irradiance is known, the accuracy of the predicted tilted irradiance degrades significantly. Yang [16] compared the performance of 26 transposition models using 18 case studies from four sites in the USA, Germany and Singapore. Various error metrics, linear ranking, and hypothesis testing were employed to quantify the model performance. Results of the pairwise Diebold-Mariano tests concluded that no single model was universally optimal. However, he found that according to the linear ranking results on rRMSE the top four families of models are Perez, Muneer, Hay, and Gueymard.
Furthermore, there are several studies that have concentrated on the solar radiation on vertical surfaces for building application. Li et al. [17], Cucomo et al. [18], and Chirarattananon et al. [19] evaluated various models to estimate the global solar radiation on vertical surfaces. These studies have indicated that the Perez model delivers better predictions for all orientations. Loutzenhiser et al. [20] assessed seven radiation models on inclined surfaces that were implemented in building energy simulation codes. Among the models tested in this study are the models of Hay [10] and Perez [21]. These studies revealed that even in the same region, the uncertainties of the solar radiation model were found to vary according to the direction and slope of the surface. Many other studies [22,23,24,25,26] have been conducted in the last two decades to evaluate transposition models and the results show that the performance of models varies, depending on the quality of the input data, the surface orientation and the measurement location.
However, no significant research has been found on how the model sensitivity is affected by using horizontal pyranometer irradiance to estimate the irradiance incident on tilted PV modules, which have different spectral and angular responses, and non-negligible temperature responses. There are also little published research about the systematic error that can be introduced.
In this study, five irradiance transposition models [4,10,11,21,27] are used to calculate the irradiance received on tilted surfaces with various tilt elevation and azimuth angles. We examined model performance for seven south-facing PV surfaces tilted at 10° intervals from 10° to 70°, six vertical tilted surfaces facing north, east, southeast, south, southwest, and west and a horizontally oriented surface. The models were chosen because they are widely used and their required input data are readily available. The validation is conducted with measurement data derived from tilted irradiance sensors, located at two different locations to derive results that hold a more general significance and are more spatially applicable. Furthermore, we investigate the uncertainties caused by the use of horizontal pyranometer measurements to compute the irradiance absorbed by the tilted PV array and the uncertainty from the use of constant albedo value in the calculations.
2. Instruments and Methods
The input data used in this study are one-minute irradiance data measured in two independent locations.
2.1. IMUK Measurements
Various irradiance measurements were performed for three years (January 2014–December 2016) on the roof of the Institute for Meteorology and Climatology (IMUK) of the Leibniz Universität Hannover (Hannover, Germany; 52.23° N, 09.42° E and 50 m above sea level).
The following irradiance measurements were conducted:
- Global Horizontal Irradiance (GHI) from January 2014 to December 2016, measured by a CMP11 pyranometer (Kipp & Zonen, Delft, The Netherlands),
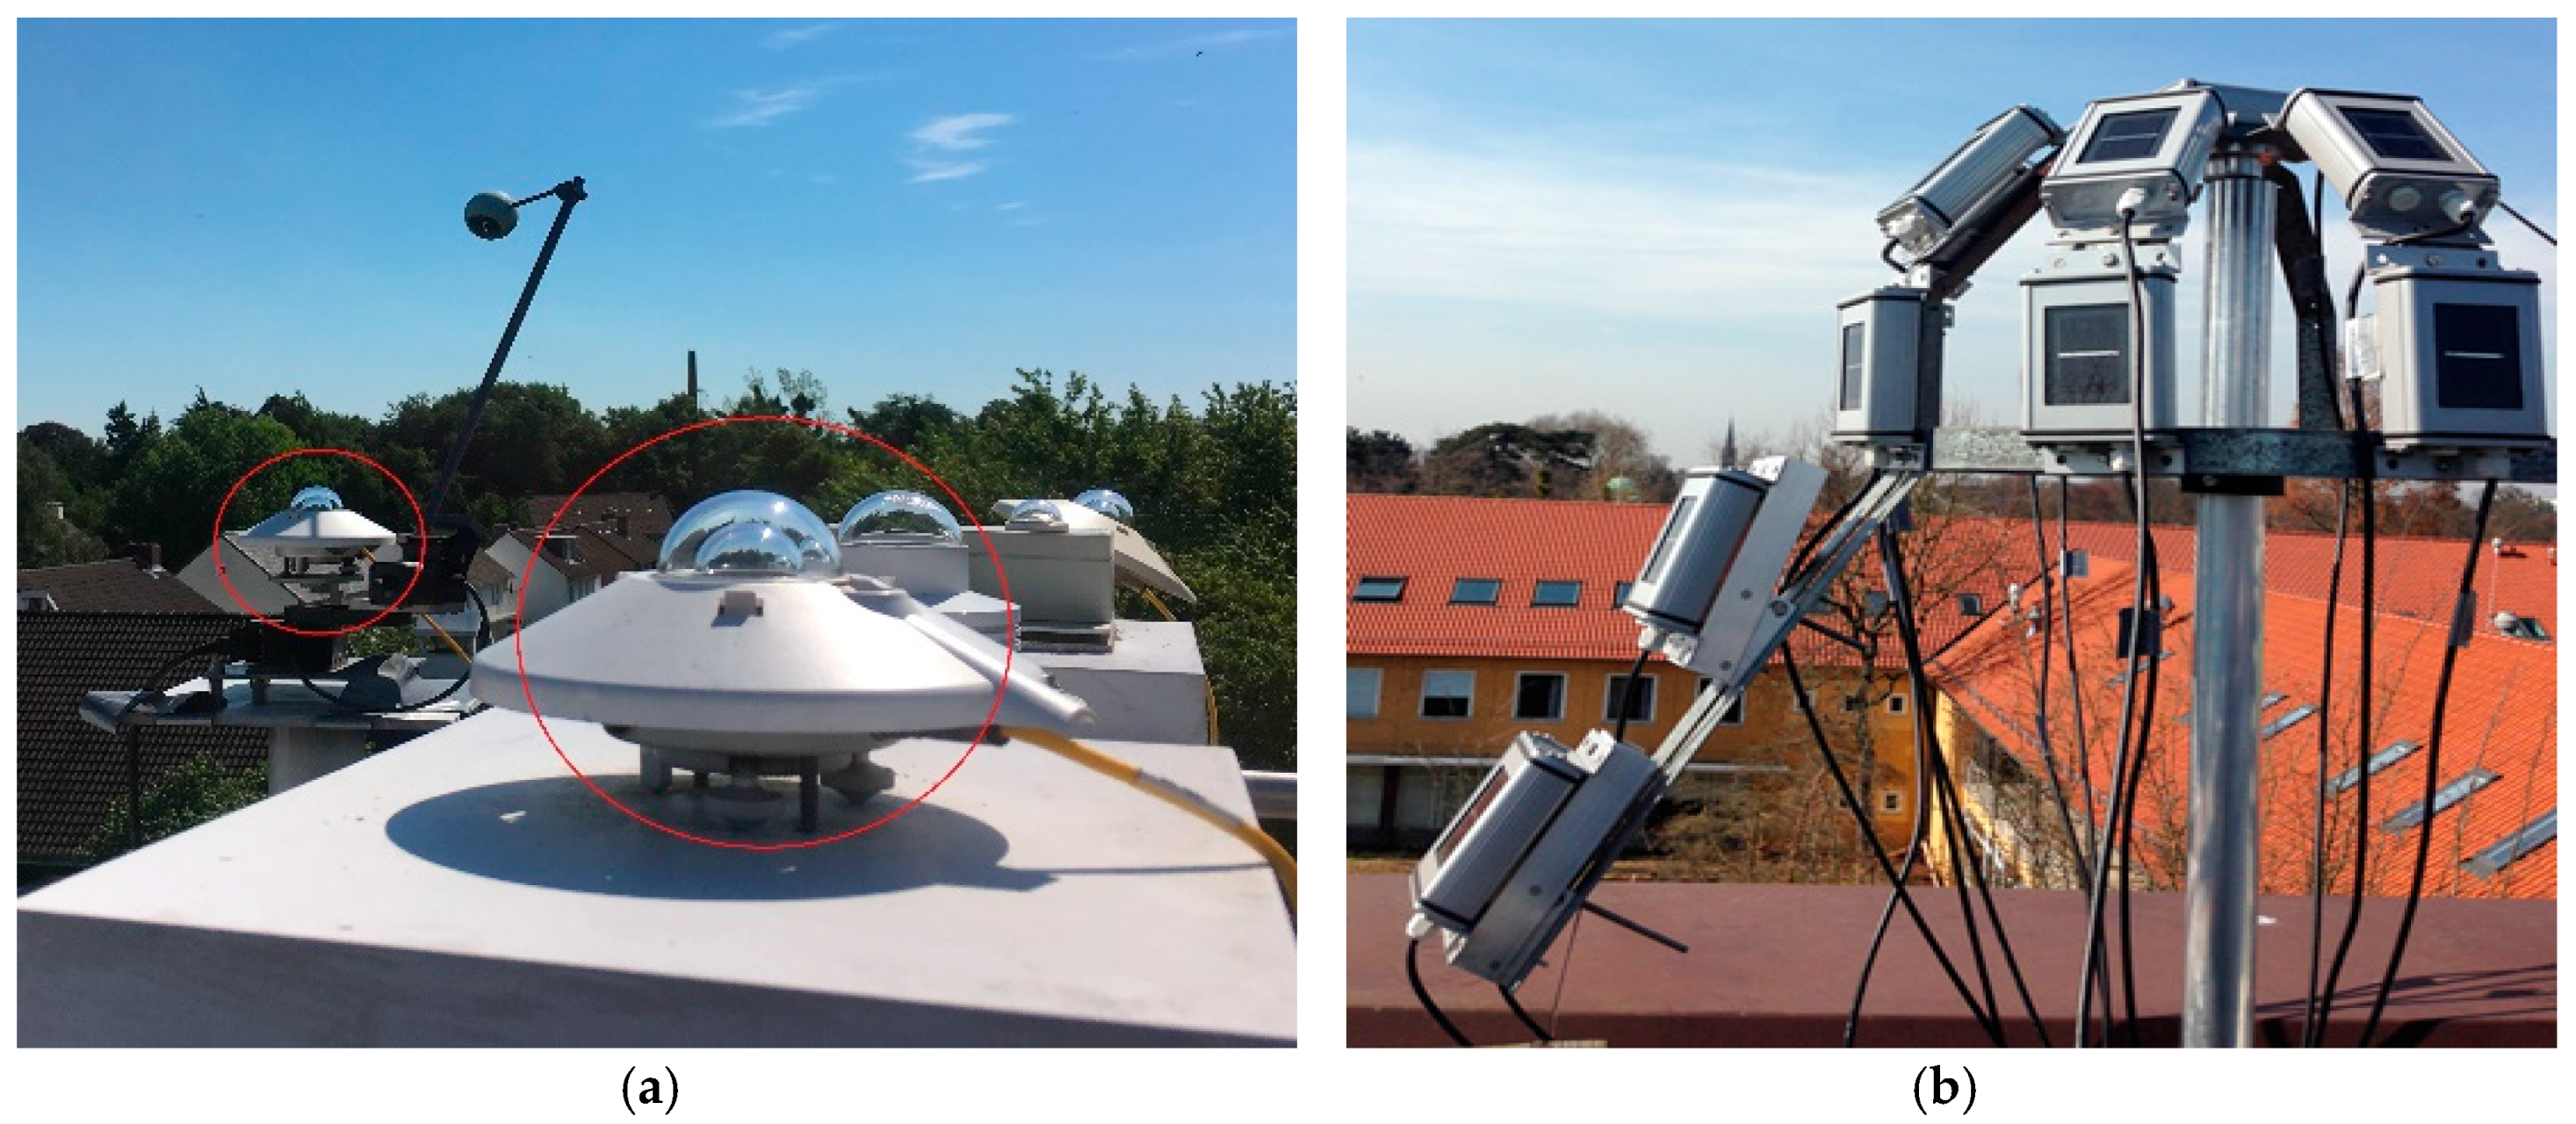
- Diffuse Horizontal Irradiance (DHI) from January 2014 to December 2016, measured by a CMP11 pyranometer with a shadow ball (Figure 1a),
- Global Tilted Irradiance (GTI) measured at a 40° inclined plane facing south by a CM11 pyranometer from January to December 2016,
- Global Tilted Irradiances from January 2014 to December 2016 measured by at various orientations by 14 crystalline silicon PV device with individual temperature sensors (Mencke & Tegtmeyer GmbH, Hameln, Germany). Seven of those silicon sensors (SiS) were facing south, tilted at 0°, 10°, 20°, 30°, 40°, 50°, 60°, 70°, six sensors were tilted vertically facing N, S, E, W, SE and SW and a single sensor was oriented horizontally (Figure 1b).
All sensors are cleaned regularly to prevent the accumulation of dirt and dust. The silicon sensors have been calibrated by the manufacturer in November 2013. In addition, all SiS’s at IMUK are compared after one year of measurements by placing them side by side horizontally. These comparisons were performed under different weather conditions and have showed an agreement within ±3%.
2.2. NREL Measurements
The NREL irradiance measurements were acquired at NREL’s Solar Radiation Research Laboratory in Golden, CO, USA (latitude 39.74° N, longitude 105.18° W, elevation 1829 m). This NREL site is located on a mesa that overlooks the western side of the urban agglomeration of Denver. The data have been obtained from SRRL’s download tool, http://www.nrel.gov/midc/srrl_bms for the period from March 2015 to December 2016. The NREL data includes the following values:
- 1
- Global Horizontal Irradiance (GHI) measured by a CMP11 pyranometer,
- 2
- Diffuse Horizontal Irradiance (DHI), measured by a CMP11 pyranometer,
- 3
- Global Tilted Irradiance (GTI) measured at a 40° inclined plane facing south by a CMP11 pyranometer,
- 4
- Global Tilted Irradiances measured by a silicon pyranometer LI-200 (LI-COR Inc., Lincoln, NE, USA), facing S, tilted at 40° and vertically tilted sensors facing N, S, E and W,
- 5
- Albedo measurements, measured by two silicon pyranometers LI-200.
2.3. Preprocessing and Quality Control
The following quality control procedure was applied to the IMUK data: Using Equation (1) we corrected the irradiance measured with the SiS’s at IMUK based on their temperature coefficient to take in account the drop of sensor signal due to temperature and to correct the testing conditions:
where I is the corrected solar irradiance, is the signal in (mV), is the calibrated value in mV/(1000 W/m2), T is the sensor temperature, and α represents the temperature coefficient.
In addition to the temperature correction, the cosine error of the silicon sensors is determined and the optical reflectance losses were corrected by using the model of Martin and Ruiz [28]. Only GHI and DHI values recorded at solar zenith angles (SZA) less 85° were used. All GHI and DHI values less than 0 W/m2 were removed from the analysis, since these values were likely erroneous measurements. Furthermore, any DHI measurement that exceeded the concurrent GHI measurement was set equal to the GHI measurement because it is not physically possible for DHI to exceed GHI [29]. NREL radiation values have been processed with the SERI-QC quality control software developed by NREL. SERI QC assesses the quality of solar radiation data by comparing measured values with expected values. This procedure is based on the relationship between global and direct solar radiation [30].
2.4. Transposition Models
The global tilted irradiance is estimated by the sum of the beam tilted , sky diffuse tilted , and ground-reflected irradiances:
Five models are selected in this study to estimate the global and diffuse solar irradiance on tilted planes based on the global and diffuse horizontal irradiance. The models are from Liu and Jordan, Klucher, Hay and Davies, Reindl and Perez. Those models have been selected since they are widely used, the necessary input data are available at the examined measurement site, and because they present the three most common model types: isotropic, anisotropic with two components and anisotropic with three components. A brief description of the selected models is given below.
2.4.1. Liu and Jordan Model
The Liu and Jordan model [4] is a simple model that assumes all diffuse sky radiation is uniform over the sky dome and that reflection on the ground is diffuse. For surfaces tilted by an angle β from the horizontal plane, total solar irradiance can be written as:
where is the tilted irradiance, the beam irradiance on a horizontal surface, the ratio of beam radiation on the tilted surface to that on a horizontal, the diffuse horizontal irradiance, β the tilt angle, the global horizontal irradiance, and ρ the ground reflectance.
2.4.2. Klucher Model
Klucher found that Liu and Jordan’s isotropic model gave good results only for overcast skies. However, it underestimates the irradiance under clear and partly overcast conditions, when there is increased intensity near the horizon and in the circumsolar region of the sky [27]. He developed therefore an anisotropic model by modifying the isotropic model, to take into account the horizontal and circumsolar brightening:
F is the Klucher modulating factor. Under overcast skies, F becomes zero and the model reduces to the Liu & Jordan model.
2.4.3. Hay and Davies Model
The Hay and Davies diffuse model divides the sky diffuse irradiance into isotropic and circumsolar components only [31]. The horizon brightening was not taken into account:
A represents the transmittance of beam irradiance through the atmosphere, where is the direct-normal solar irradiance and the direct extraterrestrial normal irradiance.
2.4.4. Reindl Model
The Reindl sky diffuse irradiance model represents three components of diffuse irradiance, including isotropic background, circumsolar brightening, and horizon brightening [11]:
A is the transmittance of beam radiation through the atmosphere defined in Equation (6).
2.4.5. Perez Model
Perez model represents a more detailed analysis of the sky diffuse radiation. The model, like the Klucher and the Reindl models, devided the diffuseirradiance into three components of isotropic background, circumsolar brightening and horizon brightening [21]:
where, and are circumsolar and horizon brightness coefficients, respectively; a and b are solid angles corresponding to the circumsolar part as seen from the inclined plane. The terms a and b are computed as:
a = max(0, cos θ)
b = max(cos 85°, cos θz)
and in Equation (9) are functions of clearness ε, zenith angle and brightness Δ. These factors are defined as:
The coefficients and are then computed as:
The coefficients , , , , and were derived based on a statistical analysis of experimental data for different locations (Table 1).
The ability of models to estimate the solar irradiance incident on tilted surfaces is analyzed by means of the relative Root Mean Square Difference (rRMSD), relative Mean Absolute Difference (rMAD) and relative Mean Bias Difference (rMBD). These parameters are calculated using Equations (16)–(21):
where Mi is the measured irradiance on an inclined plane and Ci the calculated model value.
3. Results and Discussion
3.1. Measurement Validation
The two most devices used by the PV industry for measuring the solar irradiance are thermopile pyranometers and small solar cells (silicon sensors). Of the latter, only crystalline silicon (cSi) sensors provide the required stability [32].
Thermopile pyranometers are devices that consist of junctions of dissimilar metals in contact with a black surface that absorbs solar radiation (the “hot” junction) and a separate surface that does not absorb solar radiation (the “cold” junction). Pyranometers have an uniform spectral response from about 280 to about 2800 nm. They are widely used for meteorological measurements and nearly all existing irradiation databases are validated using these measurements [32].
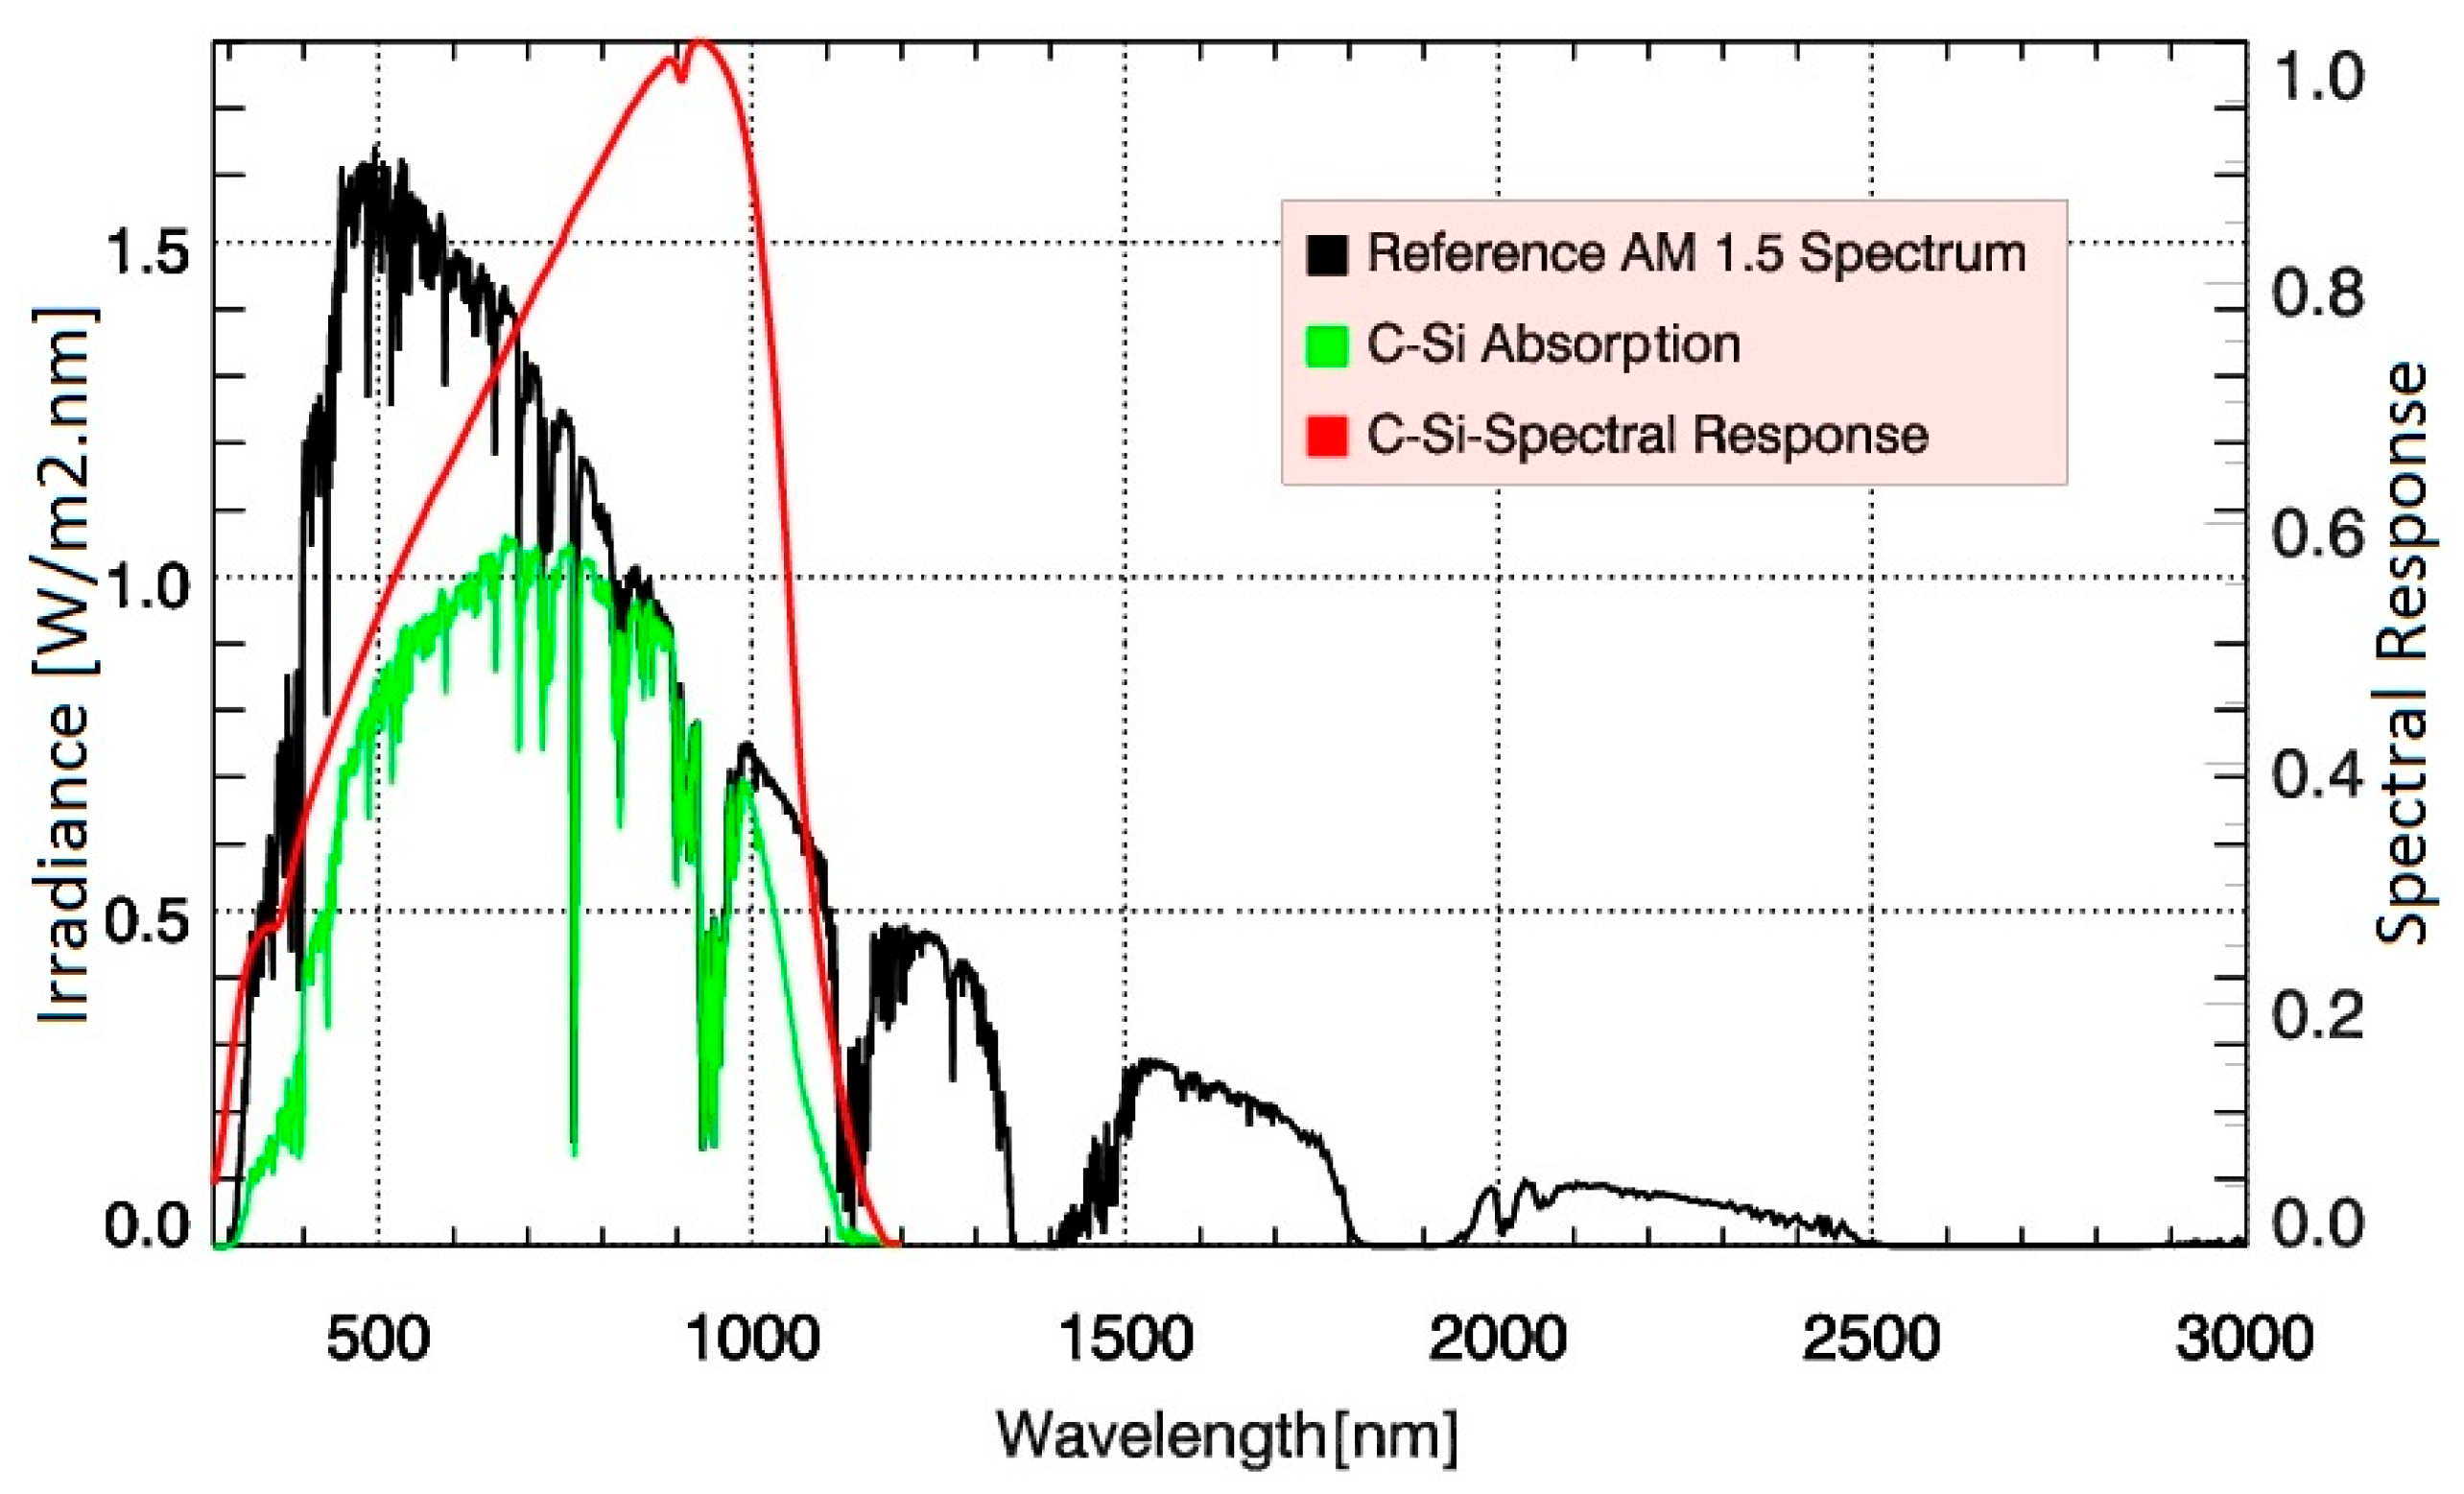
Unlike pyranometers, silicon sensors convert incident irradiance to electrons through the photovoltaic effect. The silicon sensors are spectrally selective in the range of about 350 to about 1100 nm (Figure 2). The shorter wavelength is determined by the transmission of the front glass and encapsulant, whereas the longer wavelength is determined by the material’s band gap [33]. Table 2 provides a comparison of basic specifications between the sensors used in this study.
Due to the different spectral response the highest absolute difference between the signal measured by a silicon sensor and a thermopile pyranometer is at clear sky conditions with a low diffuse to direct ratio [34]. Silicon sensors are fundamentally photovoltaic devices, and as such, standard American Society for Testing and Materials (ASTM) test procedures are applied to calibrate them by using a solar simulator [35].
The difference in cosine error is considered as the second important factor that sets apart the two devices. Silicon sensors have in general a higher cosine error than thermopile pyranometers [36] and therefore underestimate radiance incident from steep angles.
The difference between the sensors (see Table 2) affects the measured irradiance, as shown in Figure 3. The sensitivity of silicon sensors shows an increase during summer months, when SZAs are low compared to the winter months. The ratio of measured irradiance between the pyranometers and silicon the sensors is higher in winter. The right plots of Figure 3 show the ratios of daily horizontal irradiance measured by both sensors. The annual pyranometer irradiance at both sites is higher than the irradiance derived by the silicon sensors. At NREL, the pyranometer irradiance is higher in winter months, while irradiance measured by the Li-200 sensor is higher in summer. However, the behavior of silicon sensors against pyranometer measurements in both locations is the same, the relative sensitivity of the silicon sensors increases during the summer months.
In the following we investigate the uncertainties associated with the use of different irradiance sensors and assumption of albedo values as the major contributors to the uncertainty.
3.1.1. Uncertainty Resulting from Using Different Sensors
Low uncertainty of the measurements is a key factor for the quality of the data. For many applications, including predictions for a return of investment, it is important to know the uncertainties resulting from using sensors of various types to measure horizontal and tilted irradiance.
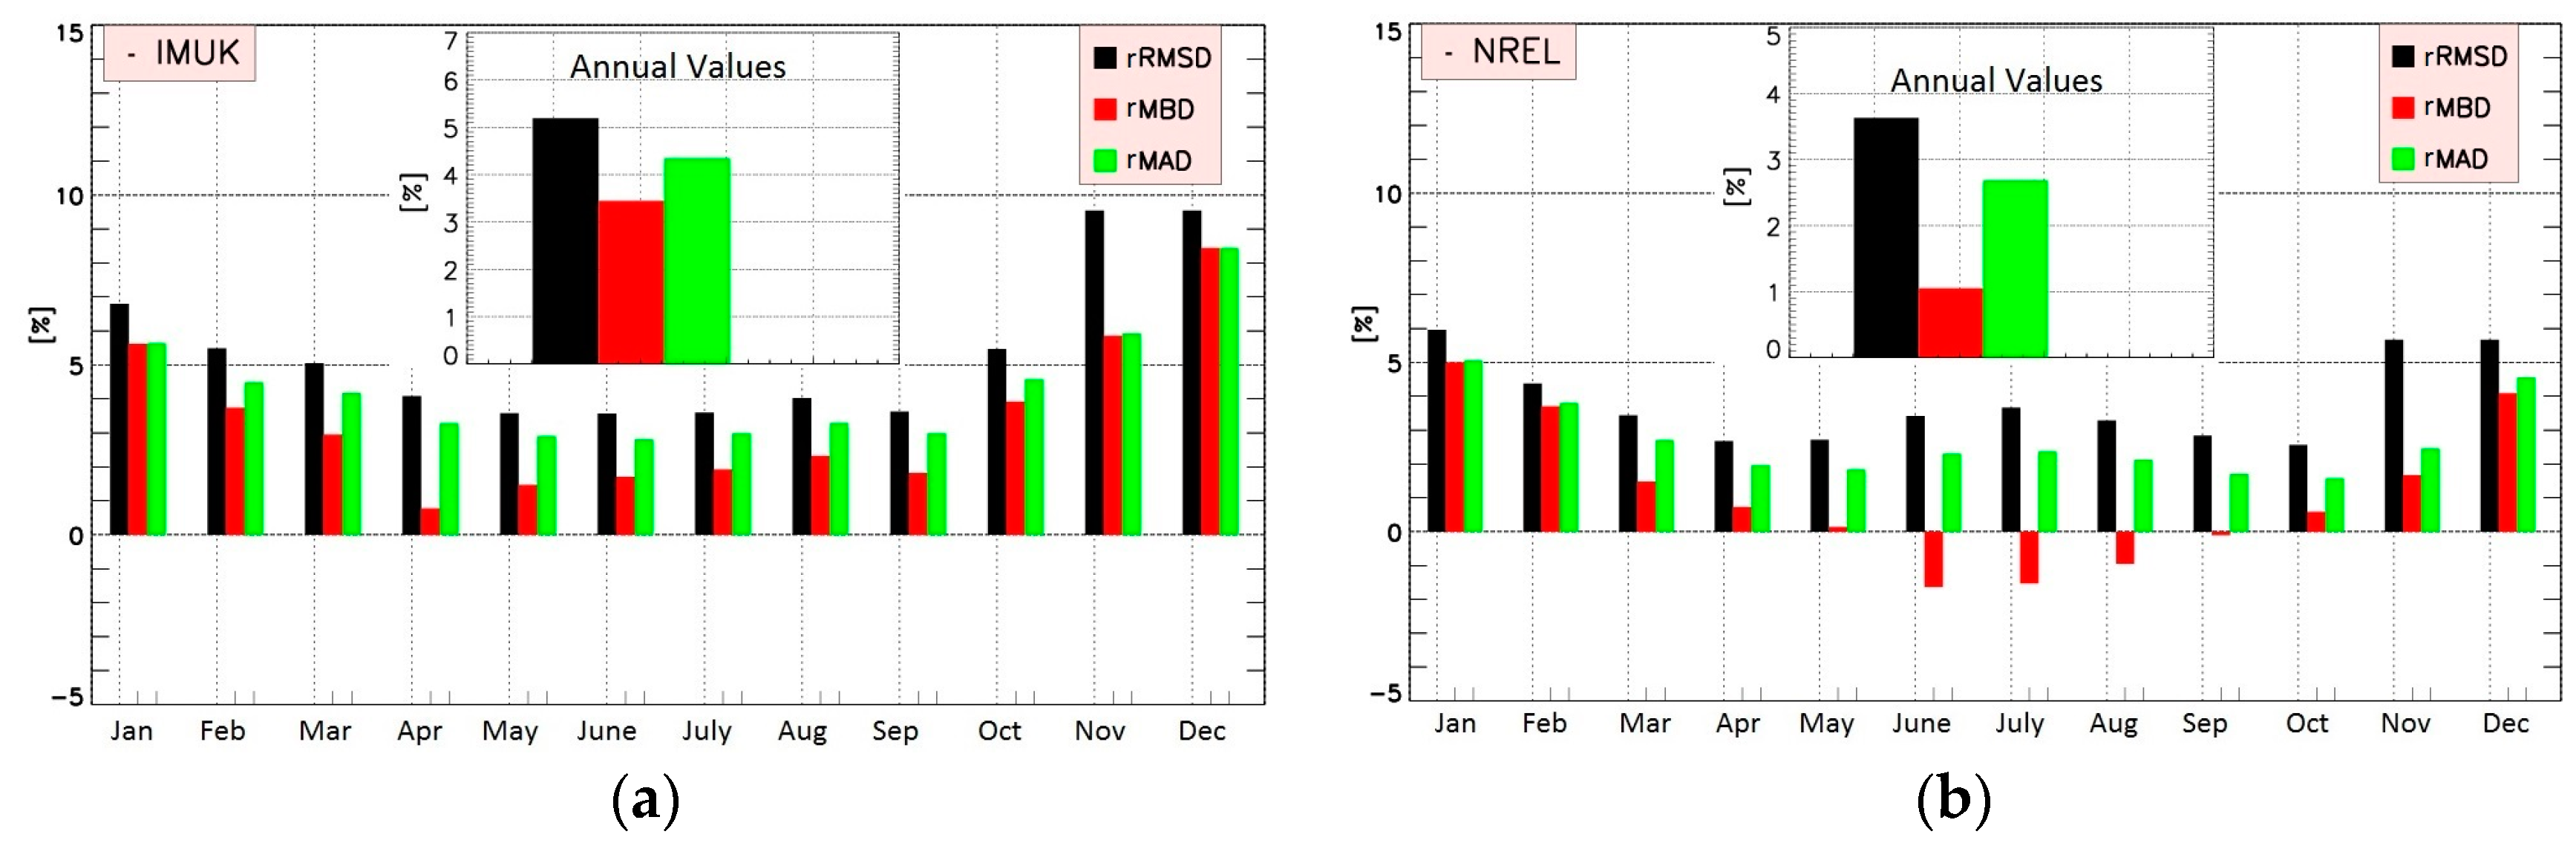
In this regard, it makes sense to use the statistical indices to compare the horizontal measurements from different technologies of solar sensors. Figure 4 shows the monthly and the annual rRMSD, rMBD and rMAD between the horizontal irradiances measured by the pyranometer and the silicon sensors at both sites in 2016. The annual rRMSD and the rMBD values at IMUK are 5.2% and 3.5% respectively. The differences are largest in the winter months, as the measured signal is low and are slightly lower with increasing irradiance in the summer months. The differences between the NREL’s sensors are smaller, where the annual rRMSD is 3.6% and the rMBD is 1.1%. The monthly average in the left plot shows the same behavior at NREL with negative rMBD values during the summer months (June–September). This agrees with Figure 3, where irradiance measured by the Li-200 sensor is higher in summer than the pyranometer values.
Based on these results, it is important to investigate how the differences in the horizontal measurements of different sensors affect the calculated tilted irradiance.
For this purpose, horizontal pyranometer measurements from 2016 were used to calculate the tilted irradiance at 40° S. The results were compared with tilted irradiance measured by: (1) tilted thermopile pyranometer and (2) tilted silicon sensor (SIS) at 40° S. The rMAD resulting from the comparison with SIS values ranges from 5.1 (Reindl) to 8.4% (Liu and Jordan). The comparison with Pyranometer values leads to slightly lower differences of 5.1% and 6.5%, respectively (Figure 5). The Liu and Jordan model and the Perez model are affected more when using different instruments whereas the model of Hay and Davies and Reindl were almost unaffected. These values are for 40° S tilt, the other orientations could not be tested, because there is only one tilted pyranometer (40° S) at IMUK.
Thus, it can be concluded, that a systematic error is introduced when using horizontal pyranometer measurements to compute the irradiance absorbed by tilted PV modules, which have different spectral, angular, and temperature responses. Depending on the used model, this error has only a small or even no influence on the calculated irradiance on a tilted PV surface.
3.1.2. Albedo and Seasonal Effects
The accuracy of ground reflection calculations depends strongly on the knowledge of albedo values used in the models; the dependence becomes stronger as the tilt angle increases [15]. Only in rare cases ground is albedo is known accurately; in most cases a constant value for albedo is used by the model.
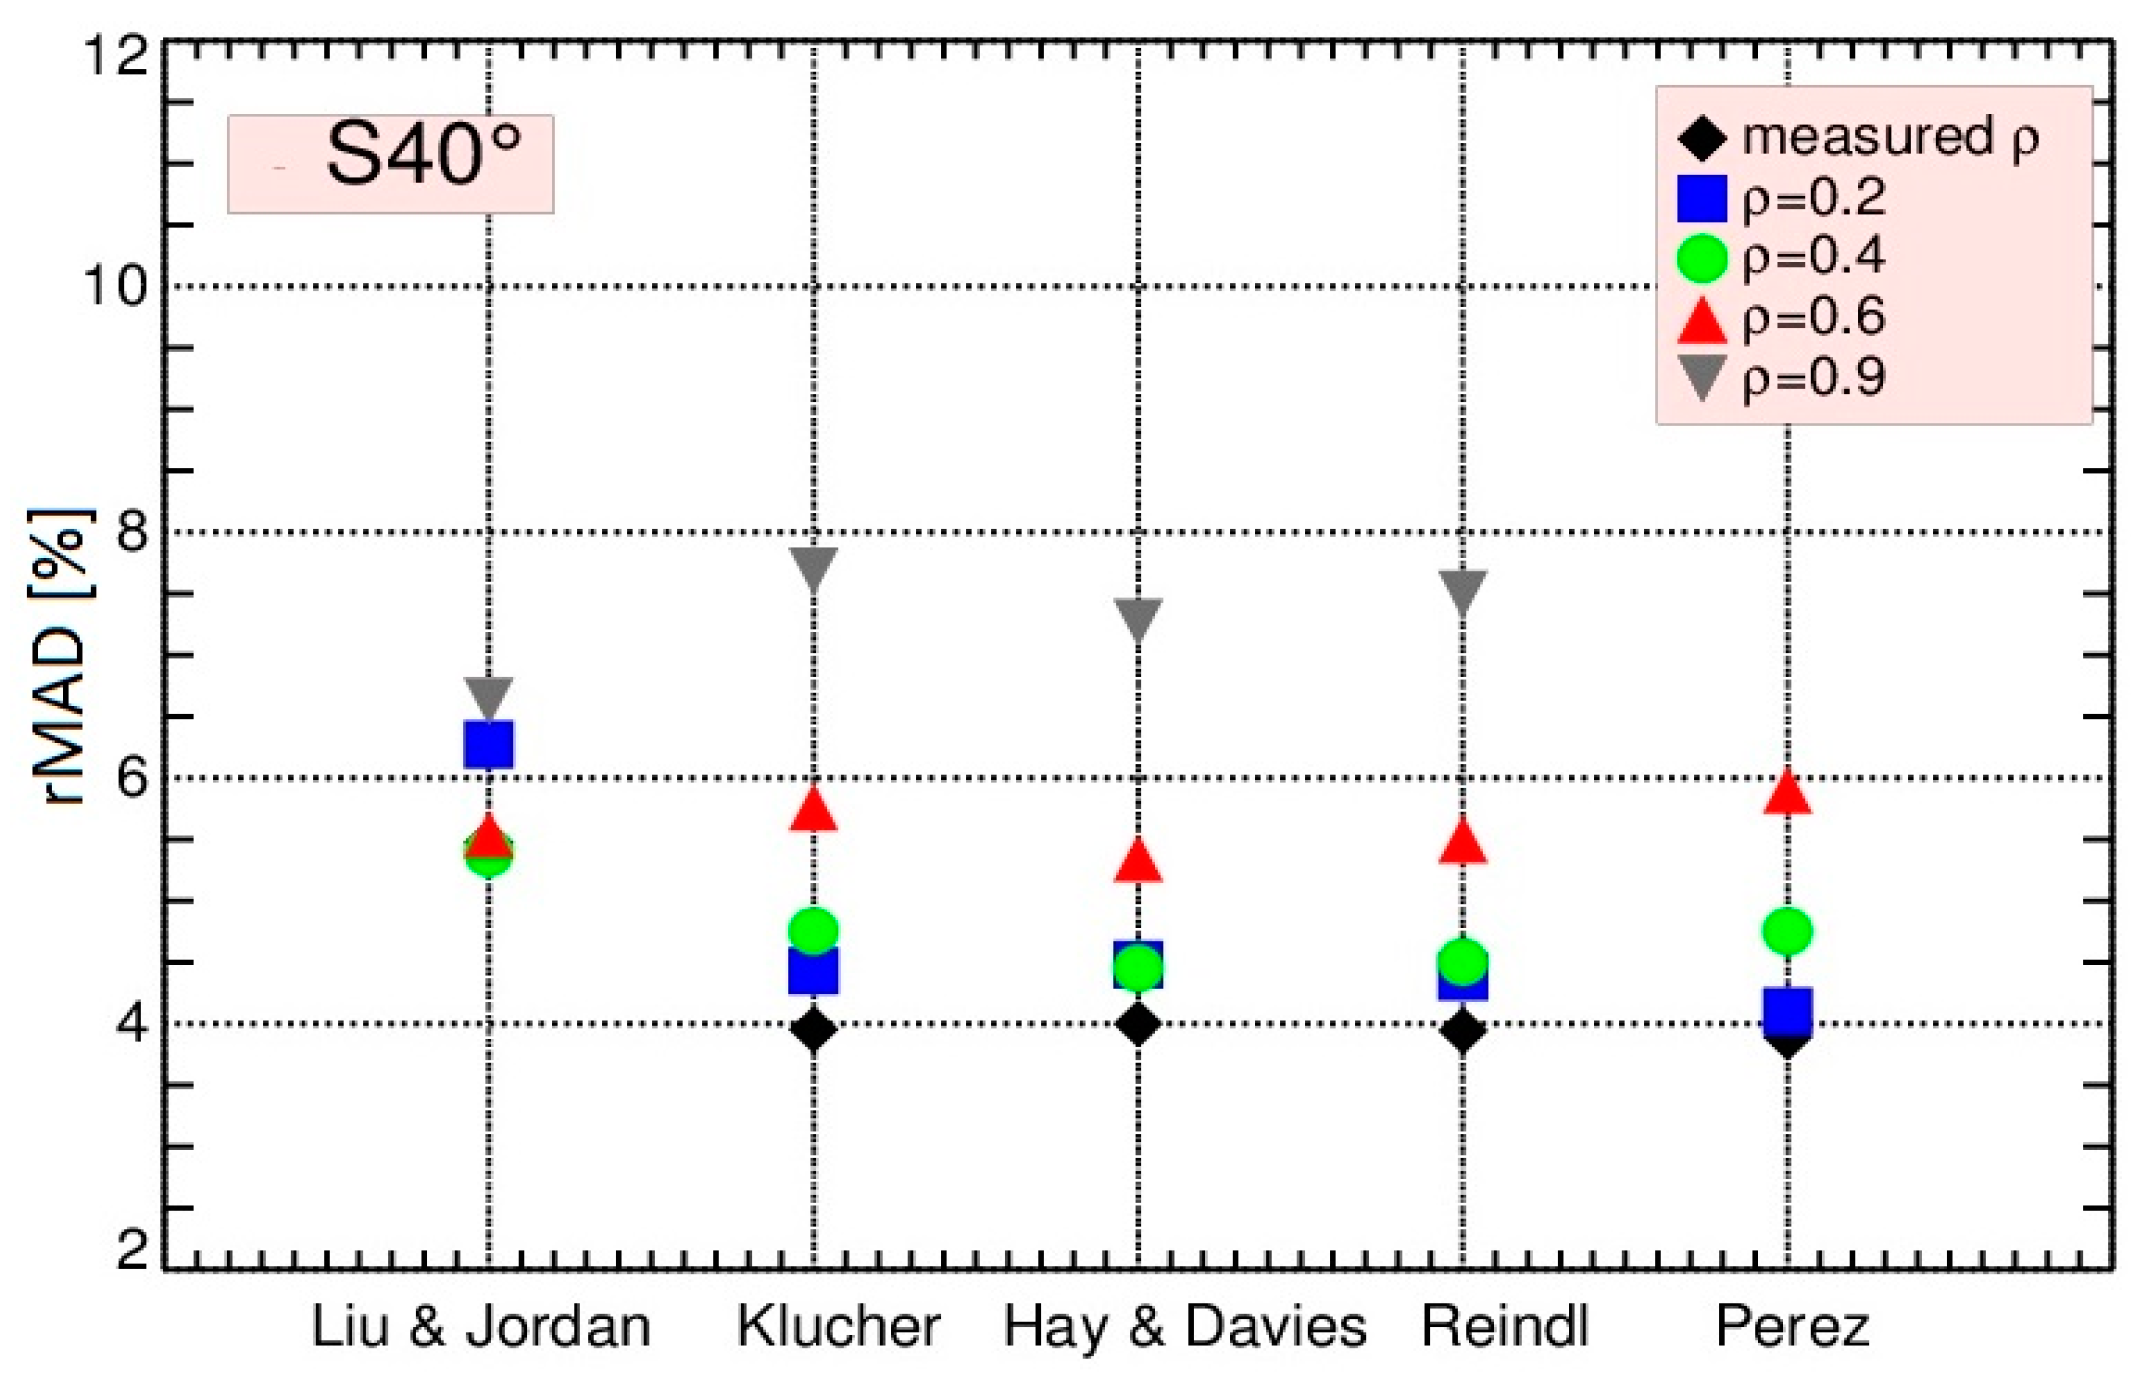
It is useful to evaluate the uncertainty that results from using a spectrally constant albedo for calculating the tilted irradiance. For this purpose, measured albedo values and different constant values (0.2, 0.4, 0.6 and 0.9) are used to calculate the tilted irradiance on 40° and 90° tilt based on NREL data. The rMAD is used to evaluate the prediction of the models for each albedo value (Figure 6).
Figure 6 shows that the models are more accurate if measured albedo values are used. The rMAD increase as the albedo value increases. The use of constant albedo value of 0.2 (the most used value for models) leads to an increase of the rMAD of between 0.2% (Perez) and 0.8% (Liu and Jordan). The Figure 6 also shows that the Liu and Jordan model is less dependent on the albedo. This may be explained by the assumption of isotropic distribution of diffuse irradiance in this model.
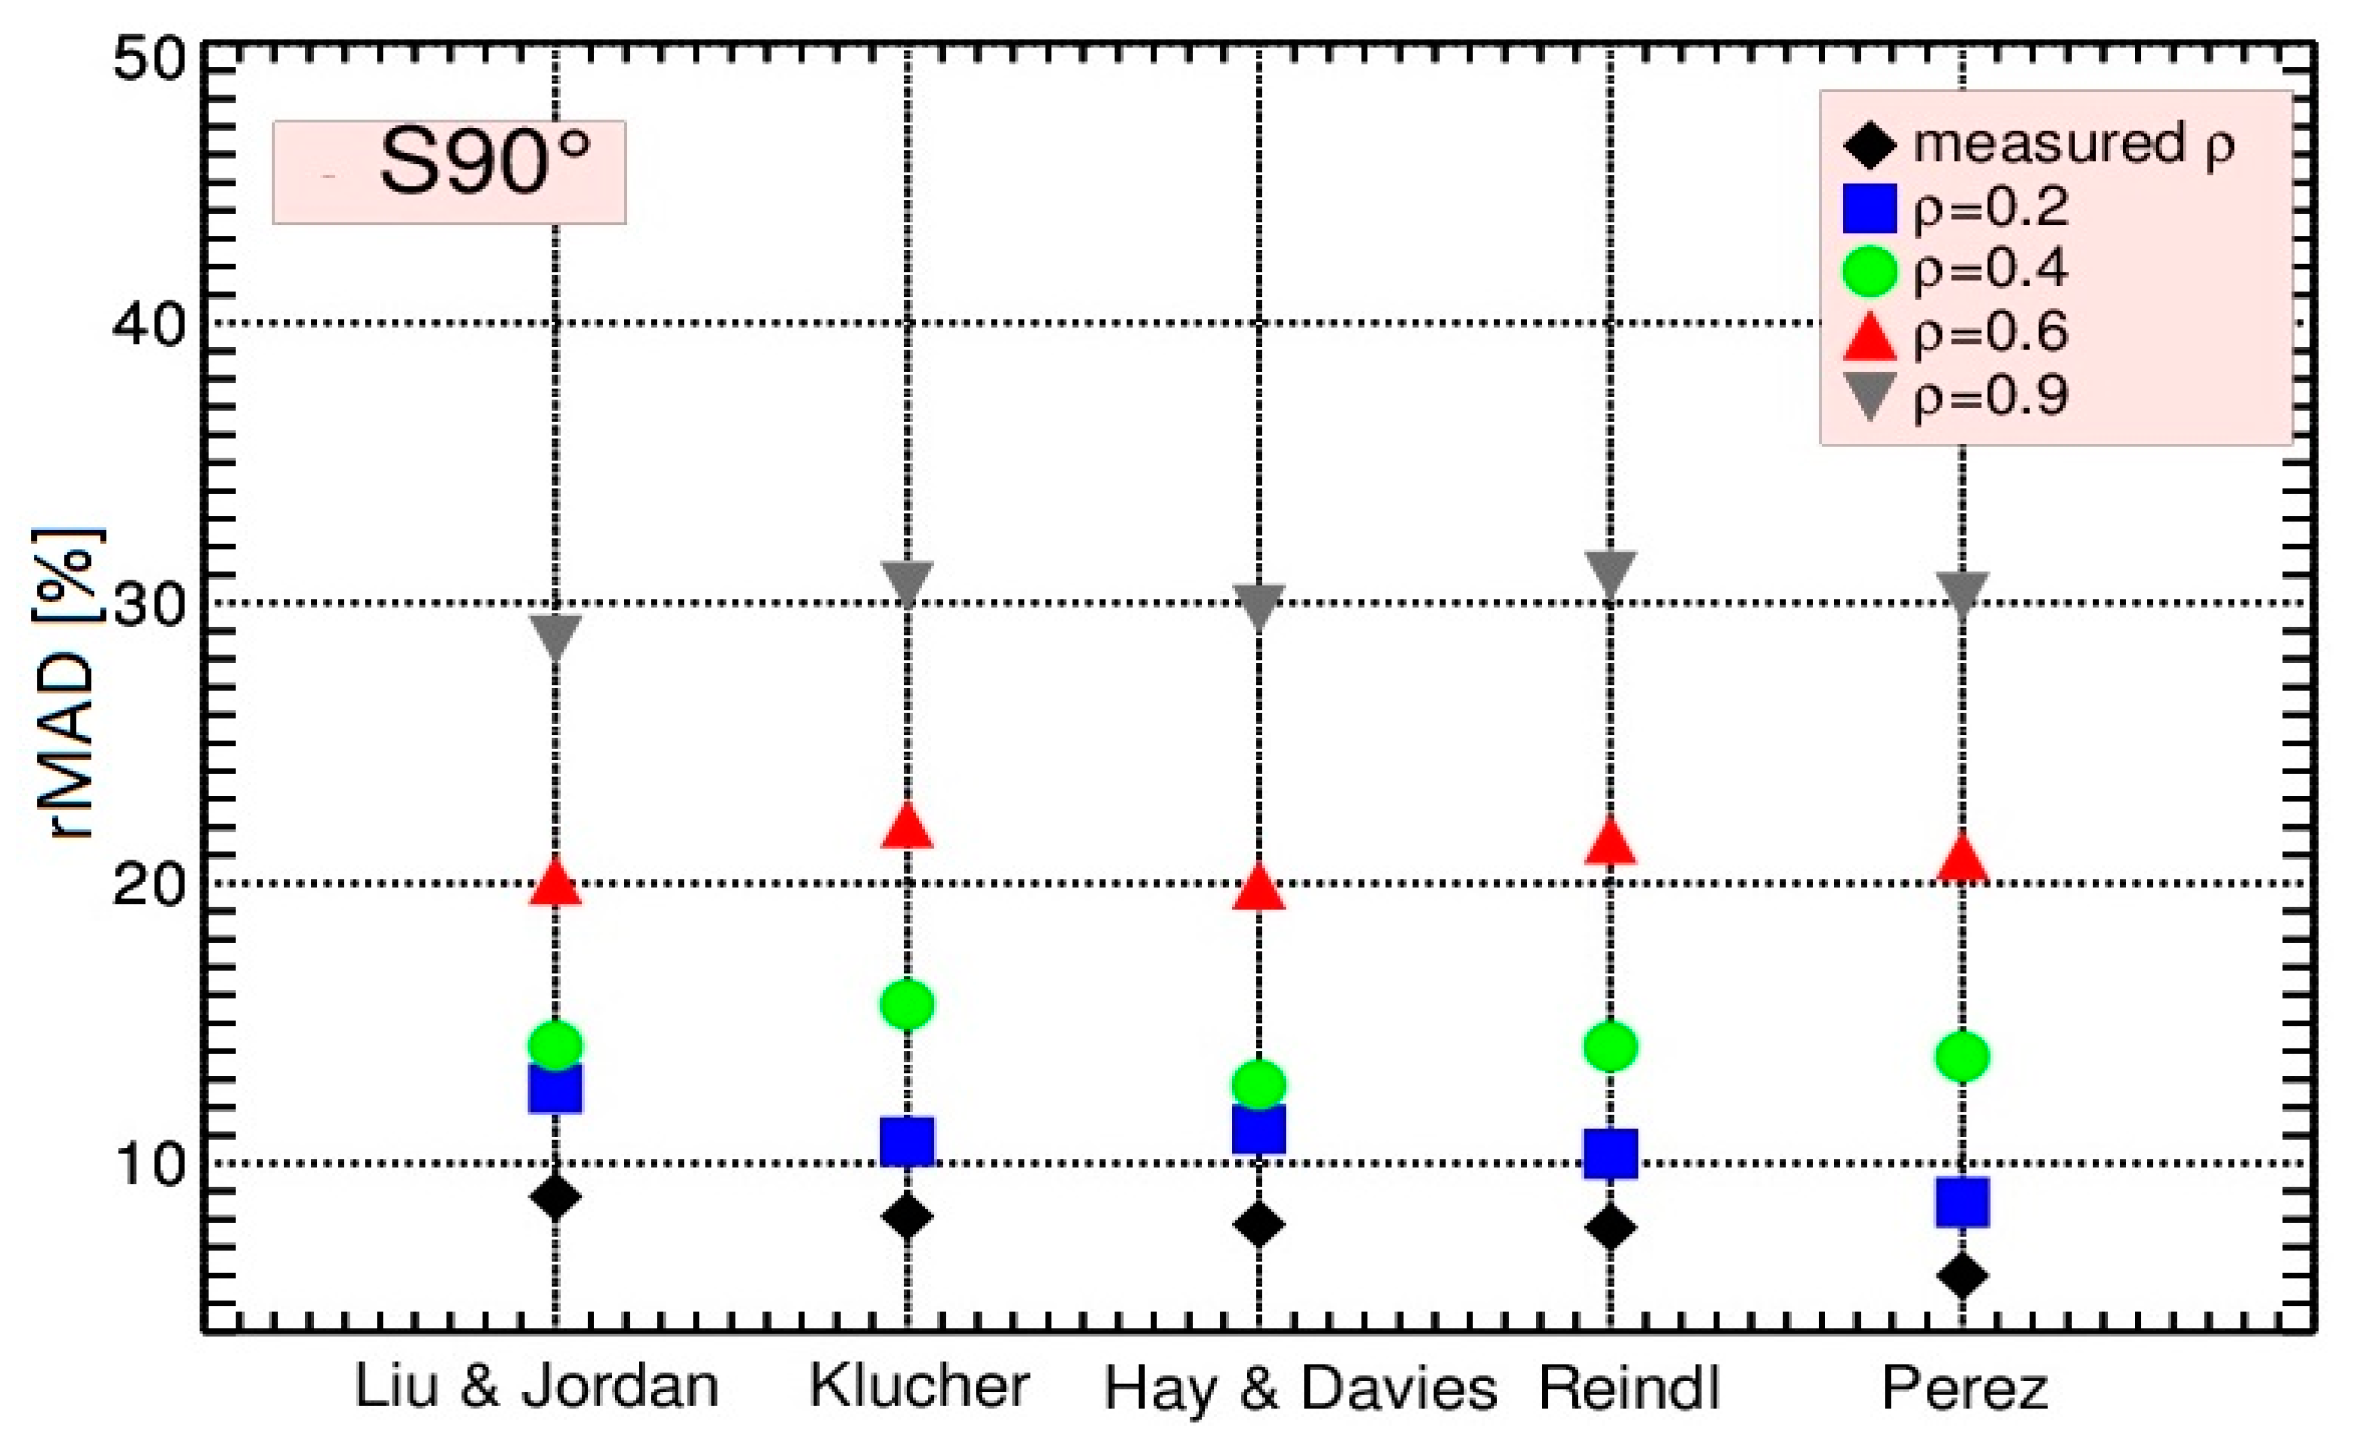
The same calculations were done for 90° S tilt (Figure 7). It is easy to recognize that the influence of albedo on the calculated tilt irradiance is much larger. The use of a constant value of 0.2 instead of a measured value increases the rMAD by about 2.5% (Perez model) and 3.8% (Liu and Jordan). The rMAD increases also with increasing albedo values.
3.2. Model Validation
In order to evaluate the model performance and to consider the influence of some input parameters on the results, we use measured horizontal irradiances (global and diffuse) to calculate the tilted irradiance at different orientations and tilt angles. The calculated values are compared with one-minute values from irradiance sensors facing the same orientation and tilt angles. The global and diffuse horizontal input values are measured at both sites by thermopile pyranometers. Furthermore, tilted pyranometers are used to measure the tilted global irradiance at 40°. Tilted irradiance at IMUK has been measured by silicon sensors (SiS) at 14 different orientations and tilt angles. At NREL, the tilted irradiance at 40° and at different vertical planes (E, W, S, N) were measured by another silicon device (Li-200). The measurements and the corresponding instruments are shown in details in Table 3.
The results of the five models are shown in Table 4, for all available orientations and tilt angles of IMUK. It can be recognized that the deviations of the model of Liu and Jordan, Klucher and Perez from the measurements increases as the tilt angle increases and as the sensors are oriented away from the south direction, where they receive much less direct radiation than south-facing surfaces. Accordingly, the vertical E, W and N planes show the highest deviation. In general, the best results in terms of rRMSD and rMAD are obtained with the Hay and Davies and Reindl models, while the isotropic model of Liu & Jordan provide the worst agreement for south facing planes (Figure 8).
For the vertical tilt planes, the Hay and Davies model obtains the lowest RMSD. The Klucher transposition model is most affected by errors when facing away from the south direction. The high deviation of the vertical sensors can be related to the significant change in the ratio for the vertical tilt and also to the incorrect modelling of ground reflection.
It has also been observed that the anisotropic models overestimate the south-tilted irradiances (MBD ranging from −0.52 to −3.63%) and most of the vertical irradiances (MBD ranging from 3.47 to −20.1%). In contrast, the Liu and Jordan model underestimates the tilted irradiance in most directions, but not at very low tilt or on vertical surfaces away from the south quadrant.
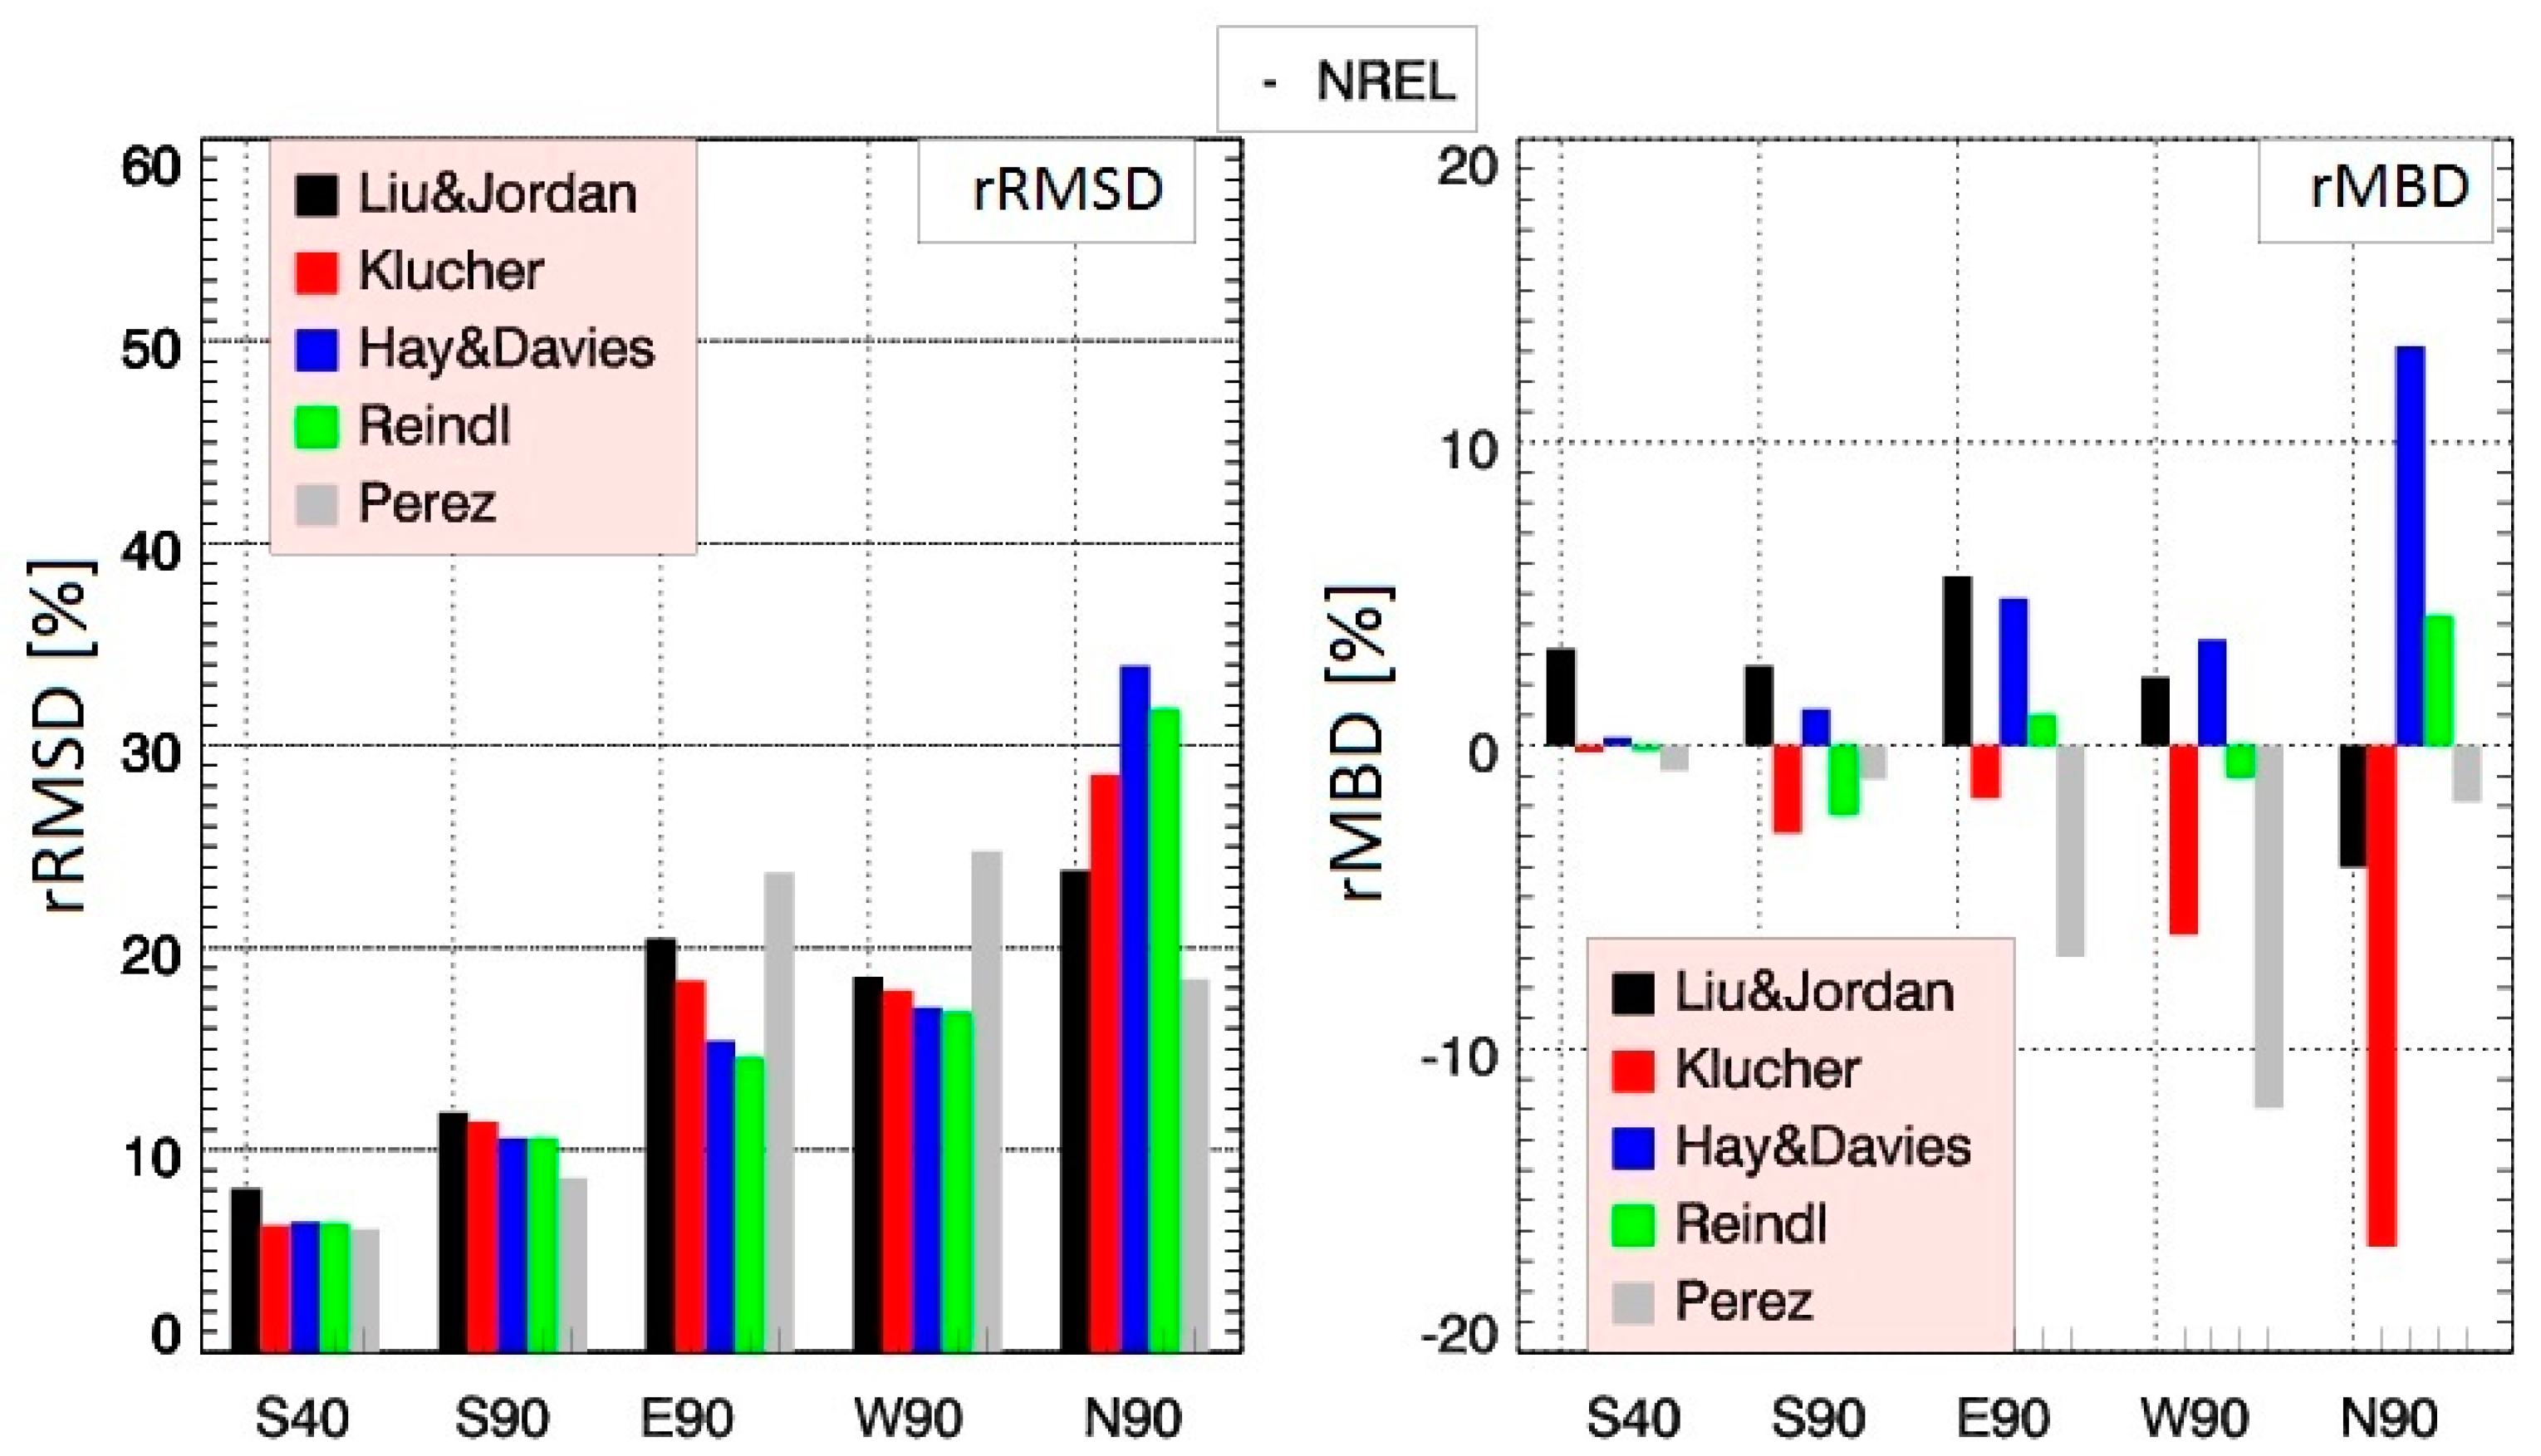
According to the data from NREL (Table 5), the Perez model provides the best results for S and N directions, while the models of Reindl and Hay and Davies provide the lowest rRMSD for E and W orientations, which agrees with the IMUK results. The rMBD of rNREL values show that the models of Klucher and Perez overestimate the calculated irradiance (MBD ranging from −0.45 to −16.7%), while the rMBDs of the other models range between positive and negative, depending on the azimuth angle (Figure 9).
The difference in model performance between IMUK and NREL can be explained by two factors. First, by the different climates of the sites; the sky at IMUK is mostly cloudy, while NREL is a sunny site; Second, the quality of model input data; the GHI and DHI were measured by different sensors and measured albedo values are used for modelling the NREL data, which influences the calculated vertical irradiance significantly.
The accuracy of the modelled global tilted irradiance depends basically on two things: the availability of measured irradiance, which is a requirement for any model [14] and the accuracy of the model itself, in other words, the ability of the model to simulate the irradiance distribution in the atmosphere. It is therefore important to evaluate the uncertainty resulting from the input data of the model before evaluating the performance of the models. The measured horizontal irradiance components (global, diffuse, direct) constitute the most important input data to compute the tilted irradiance. Modelling of tilted irradiance would be ideal if measurements for all irradiance components, including ground reflectance, were available. This would avoid uncertainties that result from estimation of one component from the other two. The modelling of tilted irradiance would be less ideal but still useful if two of them are available.
All presented models use the same method for calculating beam and ground reflected irradiance on a tilted surface; the differences lie only in the calculation of the diffuse radiation. The statistical analysis showed that the Reindl and Hay and Davies models produce the best agreement with the measured tilted data in Hannover. The results of both models are very similar, even although they differ in their modeling approach for the diffuse sky radiation. This may be because both models use the same anisotropic index to weight the circumsolar and isotropic components. Moreover, the horizon brightening component has a limited effect under cloudy conditions; it is most profound in clear skies [37].
As expected, the isotropic Liu and Jordan model underestimates the tilted diffuse irradiance (positive MBD) for the south-facing planes, while it shows relatively good agreement with the measurement for the other orientations, when the irradiance is low. In contrast, the anisotropic models overestimate the irradiance at IMUK, with the three-component anisotropic models tending to overestimate the diffuse irradiance more than the two-component models.
The assumed distributions for diffuse sky irradiance and the nature of the anisotropic factors are what characterizes each of the anisotropic models used in this study. For the models of Klucher and Perez, it is possible that the climate at IMUK has some characteristics that require adjustment of the coefficients used in both model.
It can be concluded that the accurate calculation of the tilted diffuse solar irradiance is what distinguishes models form each other. Moreover, the basic criterion for selecting the most suitable model for simulating the electrical output of a PV module is its ability to simulate the diffuse radiation of the sky under all weather conditions. This can be understood if we consider that an inaccurately calculated diffuse irradiance can lead to significant over- or underestimations in the annual energy yield of a photovoltaic (PV) system by as much as 8% [38] even for horizontal orientations of the PV system.
4. Conclusions
Using one-minute measured GHI and DHI data, modeling was performed to calculate the tilted irradiance for different orientations and tilt angles in Hannover (Germany) and at NREL (Golden, CO, USA). The following conclusions can be drawn from this study:
- -
- Best results are provided by the models from Hay and Davies and Reindl, when horizontal pyranometer measurements and a constant albedo value of 0.2 are used. This agreement of the two may relate to the anisotropic index used by both models to weight the circumsolar and isotropic components.
- -
- The anisotropic models overestimate the south tilted irradiance and most of vertical tilted irradiance. In contrast, the isotropic model underestimates the tilted irradiance in most directions.
- -
- For the NREL location, when measured albedo is used, the Perez model provides the best estimates of global tilted irradiance.
- -
- The deviations of the anisotropic models from the measurements increase with increasing deviation from the south direction. In this case, the ratio of direct to diffuse radiation decreases and the uncertainty in modelling the diffuse irradiance becomes dominant.
- -
- An uncertainty is introduced when using horizontal pyranometer measurements to estimate the irradiance absorbed by tilted PV modules. Depending on the used model, this uncertainty has only a small or even no effect on the calculated irradiance.
- -
- The influence of albedo value on the calculated tilted irradiance increases as the tilt angle increases. The use of a constant albedo value of 0.2, which is widely accepted and used in most applications, leads to an increase in the rMAD that ranges between 0.2% and 0.8% at 40° tilt and reaches up to 3.8% at 90° tilt angle. If there are surfaces with higher reflectance in the vicinity of the PV system, rMAD is significantly higher.
- -
- The models of Hay and Davies and Reindl is recommended to estimate the tilted irradiance for south-facing modules in regions with mainly cloudy conditions and when albedo measurements are not available. The Hay and Davies model would also be useful for vertical surfaces (e.g., facades and glazing) whereas the Perez model is recommended for sunny sites and when albedo measurements are available.
The spectral distribution of sky radiance is affected by clouds and aerosols. This has a significant influence on the performance of silicon sensors, where the spectral response of silicon sensors is wavelength-dependent. Therefore, additional spectral measurements are needed to understand the behavior of silicon sensors in the different weather conditions. Therefore, advances in the modelling of PV yields require more knowledge about spectral radiance, which is known to be anisotropic.
Acknowledgments
The publication of this article was funded by the Open Access fund of Leibniz Universität Hannover. We are also grateful to Christian Melsheimer from IUP Bremen, Ben Liley, Richard McKenzie and Alex Geddes from NIWA for the useful comments.
Author Contributions
Riyad Mubarak conceived and designed the study and wrote the draft paper; Martin Hofmann, Stefan Riechelmann and Gunther Seckmeyer contributed in conception and design, analysis and interpretation of the data. All the authors significantly contributed to the final version of the manuscript.
Conflicts of Interest
The authors declare no conflict of interest.
Nomenclature
| Δ | sky’s brightness, as in Perez model |
| ρ | ground albedo |
| β | tilt angle (rad) |
| θ | incidence angle (rad) |
| solar zenith angle (rad) | |
| ε | sky’s clearness, as in Perez model [21] |
| a, b | sky geometry parameters, as in Perez model |
| A | transmittance of beam irradiance through atmosphere, as in Hay & Davies model |
| c-Si | crystalline silicon |
| F | Klucher’s modulating factor |
| F1, F2 | degree of circumsolar and horizon anisotropy, in the simplified Perez model |
| , , ,, | Perez model coefficients for irradiance |
| direct-normal solar irradiance (DNI) (W/m2) | |
| beam horizontal irradiance (BHI) (W/m2) | |
| global horizontal irradiance (GHI) (W/m2) | |
| diffuse horizontal irradiance (DHI) (W/m2) | |
| beam tilted irradiance (BTI) (W/m2) | |
| diffuse tilted irradiance (DTI) (W/m2) | |
| ground-reflected irradiance (W/m2) | |
| direct extraterrestrial normal irradiance (W/m2) | |
| global tilted irradiance (GTI) (W/m2) | |
| MAD | mean absolute difference |
| MBD | mean bias difference |
| PV | photovoltaic |
| α | temperature coefficient |
| factor that accounts for direction of beam radiation, | |
| RMSD | root mean square difference |
| SiS | silicon sensor |
References
- Mehleri, E.D.; Zervas, P.L.; Sarimveis, H.; Palyvos, J.A.; Markatos, N.C. A new neural network model for evaluating the performance of various hourly slope irradiation models: Implementation for the region of Athens. Renew. Energy 2010, 35, 1357–1362. [Google Scholar] [CrossRef]
- Kudish, A.I.; Evseev, E.G. Prediction of solar global radiation on a surface tilted to the south. In Proceedings of the Optical Modeling and Measurements for Solar Energy Systems II, San Diego, CA, USA, 11 September 2008; p. 704603. [Google Scholar]
- Riechelmann, S.; Schrempf, M.; Seckmeyer, G. Simultaneous measurement of spectral sky radiance by a non-scanning multidirectional spectroradiometer (MUDIS). Meas. Sci. Technol. 2013, 24, 125501. [Google Scholar] [CrossRef]
- Liu, B.; Jordan, R. Daily insolation on surfaces tilted towards equator. ASHRAE J. 1961, 10, 526–541. [Google Scholar]
- Duffie, J.A.; Beckman, W.A.; Worek, W.M. Solar Engineering of Thermal Processes, 2nd ed.; John Wiley & Sons: New York, NY, USA, 1991. [Google Scholar]
- Badescu, V. 3D isotropic approximation for solar diffuse irradiance on tilted surfaces. Renew. Energy 2002, 26, 221–233. [Google Scholar] [CrossRef]
- Grant, R.H.; Heisler, G.M. Obscured Overcast Sky Radiance Distributions for Ultraviolet and Photosynthetically Active Radiation. J. Appl. Meteorol. 1997, 36, 1336–1345. [Google Scholar] [CrossRef]
- Kambezidis, H.D.; Psiloglou, B.E.; Gueymard, C. Measurements and models for total solar irradiance on inclined surface in Athens, Greece. Sol. Energy 1994, 53, 177–185. [Google Scholar] [CrossRef]
- Gueymard, C. An anisotropic solar irradiance model for tilted surfaces and its comparison with selected engineering algorithms. Sol. Energy 1987, 38, 367–386. [Google Scholar] [CrossRef]
- Hay, J.E. Calculation of monthly mean solar radiation for horizontal and inclined surfaces. Sol. Energy 1979, 23, 301–307. [Google Scholar] [CrossRef]
- Reindl, D.T.; Beckman, W.A.; Duffie, J.A. Evaluation of hourly tilted surface radiation models. Sol. Energy 1990, 45, 9–17. [Google Scholar] [CrossRef]
- Skartveit, A.; Asle Olseth, J. Modelling slope irradiance at high latitudes. Sol. Energy 1986, 36, 333–344. [Google Scholar] [CrossRef]
- Notton, G.; Cristofari, C.; Poggi, P. Performance evaluation of various hourly slope irradiation models using Mediterranean experimental data of Ajaccio. Energy Convers. Manag. 2006, 47, 147–173. [Google Scholar] [CrossRef]
- Gueymard, C.A. Advanced solar irradiance model and procedure for spectral solar heat gain calculation. ASHRAE Trans. 2007, 113 Pt 1, 149–164. [Google Scholar]
- Gueymard, D.R.; Myers, C.A. Validation and Ranking Methodologies for Solar Radiation Models; Springer: Berlin/Heidelberg, Germany, 2008. [Google Scholar]
- Yang, D. Solar radiation on inclined surfaces: Corrections and benchmarks. Sol. Energy 2016, 136, 288–302. [Google Scholar] [CrossRef]
- Li, D.H.W.; Lam, J.C.; Lau, C.C.S. A new approach for predicting vertical global solar irradiance. Renew. Energy 2002, 25, 591–606. [Google Scholar] [CrossRef]
- Cucumo, M.; De Rosa, A.; Ferraro, V.; Kaliakatsos, D.; Marinelli, V. Experimental testing of models for the estimation of hourly solar radiation on vertical surfaces at Arcavacata di Rende. Sol. Energy 2007, 81, 692–695. [Google Scholar] [CrossRef]
- Chirarattananon, S.; Rukkwansuk, P.; Chaiwiwatworakul, P.; Pakdeepol, P. Evaluation of vertical illuminance and irradiance models against data from north Bangkok. Build. Environ. 2007, 42, 3894–3904. [Google Scholar] [CrossRef]
- Loutzenhiser, P.G.; Manz, H.; Felsmann, C.; Strachan, P.A.; Frank, T.; Maxwell, G.M. Empirical validation of models to compute solar irradiance on inclined surfaces for building energy simulation. Sol. Energy 2007, 81, 254–267. [Google Scholar] [CrossRef] [Green Version]
- Perez, R.; Ineichen, P.; Seals, R.; Michalsky, J.; Stewart, R. Modeling daylight availability and irradiance components from direct and global irradiance. Sol. Energy 1990, 44, 271–289. [Google Scholar] [CrossRef]
- De Miguel, A.; Bilbao, J.; Aguiar, R.; Kambezidis, H.; Negro, E. Diffuse solar irradiation model evaluation in the North Mediterranean Belt area. Sol. Energy 2001, 70, 143–153. [Google Scholar] [CrossRef]
- Pandey, C.K.; Katiyar, A.K. A comparative study of solar irradiation models on various inclined surfaces for India. Appl. Energy 2011, 88, 1455–1459. [Google Scholar] [CrossRef]
- Demain, C.; Journée, M.; Bertrand, C. Evaluation of different models to estimate the global solar radiation on inclined surfaces. Renew. Energy 2013, 50, 710–721. [Google Scholar] [CrossRef]
- Khalil, S.A.; Shaffie, A.M. Performance of Statistical Comparison Models of Solar Energy on Horizontal and Inclined Surface. Int. J. Energy Power 2013, 2, 8–25. [Google Scholar]
- Wattan, R.; Janjai, S. An investigation of the performance of 14 models for estimating hourly diffuse irradiation on inclined surfaces at tropical sites. Renew. Energy 2016, 93, 667–674. [Google Scholar] [CrossRef]
- Klucher, T.M. Evaluation of models to predict insolation on tilted surfaces. Sol. Energy 1979, 23, 111–114. [Google Scholar] [CrossRef]
- Martin, N.; Ruiz, J.M. Annual angular reflection losses in PV modules. Prog. Photovolt. Res. Appl. 2005, 13, 75–84. [Google Scholar] [CrossRef]
- Lave, M.; Hayes, W.; Pohl, A.; Hansen, C.W. Evaluation of global horizontal irradiance to plane-of-array irradiance models at locations across the United States. IEEE J. Photovolt. 2015, 5, 597–606. [Google Scholar] [CrossRef]
- Maxwell, E.; Wilcox, S. Users Manual for SERI QC Software, Assessing the Quality of Solar Radiation Data; National Renewable Energy Laboratory: Golden, CO, USA, 1993.
- Hay, J.E.; Davies, J.A. Calculation of the solar radiation incident on an inclined surface. In Proceedings of the First Canadian Solar Radiation Data Workshop, Toronto, ON, Canada, 17–19 April 1978; pp. 59–72. [Google Scholar]
- Woyte, A.; Richter, M.; Moser, D.; Mau, S.; Reich, N.; Jahn, U. Monitoring of Photovoltaic Systems: Good Practices and Systematic Analysis. J. Chem. Inf. Model. 2013, 53, 1689–1699. [Google Scholar]
- Woyte, A.; Richter, M.; Moser, D.; Reich, N.; Green, M.; Mau, S.; Beyer, H. Analytical Monitoring of Grid-Connected Photovoltaic Systems—Good Practices for Monitoring and Performance Analysis; Technical Report; IEA-PVPS: St. Ursen, Switzerland, 2014. [Google Scholar]
- Glotzbach, T.; Schulz, B.; Zehner, M.; Fritze, P.; Schlatterer, M.; Vodermayer, C.; Wotruba, G.; Mayer, M. Round-Robin-Test of Irradiance Sensors. In Proceedings of the 23th PVSEC, Valencia, Spain, 1–5 September 2008. [Google Scholar]
- King, D.L.; Myers, D.R. Silicon-photodiode pyranometers: operational characteristics, historical experiences, and new calibration procedures. In Proceedings of the Conference Record of the Twenty-Sixth IEEE Photovoltaic Specialists Conference, Anaheim, CA, USA, 29 September–3 October 1997; pp. 1285–1288. [Google Scholar]
- Garg, H.P.; Prakash, J. Solar Energy Fundamentals and Applications; Tata McGraw-Hill: New York, NY, USA, 2005. [Google Scholar]
- Perez, R.; Seals, R.; Ineichen, P.; Stewart, R.; Menicucci, D. A new simplified version of the perez diffuse irradiance model for tilted surfaces. Sol. Energy 1987, 39, 221–231. [Google Scholar] [CrossRef]
- Hofmann, M.; Seckmeyer, G. A New Model for Estimating the Diffuse Fraction of Solar Irradiance for Photovoltaic System Simulations. Energies 2017, 10, 248. [Google Scholar] [CrossRef]
Figure 1.
(a) Pyranometers and other instruments available and operational at Institute for Meteorology and Climatology (IMUK); (b) Set of solar sensors based on silicon detectors mounted in several different tilt angles and orientations, operational at the IMUK (IMUK 2017).
Figure 1.
(a) Pyranometers and other instruments available and operational at Institute for Meteorology and Climatology (IMUK); (b) Set of solar sensors based on silicon detectors mounted in several different tilt angles and orientations, operational at the IMUK (IMUK 2017).

Figure 2.
Global solar spectrum at air mass 1.5 (black) and the portion absorbed by a silicon device (green). The silicon sensors (SiS) can measure up to 1200 nm (compare the c-Si spectral response (red)), while the pyranometer measures up to about 2800 nm.
Figure 2.
Global solar spectrum at air mass 1.5 (black) and the portion absorbed by a silicon device (green). The silicon sensors (SiS) can measure up to 1200 nm (compare the c-Si spectral response (red)), while the pyranometer measures up to about 2800 nm.

Figure 3.
[Top plots] Monthly global horizontal irradiance (GHI) measured by thermopile pyranometers and silicon sensors (SiS) on horizontal surface (left) and the ratios of daily irradiances measured by both sensors (right), for the location of IMuK. [Bottom plots] the same as the top plots but at NREL. The irradiance measured by silicon sensors shows an increase during the summer months.
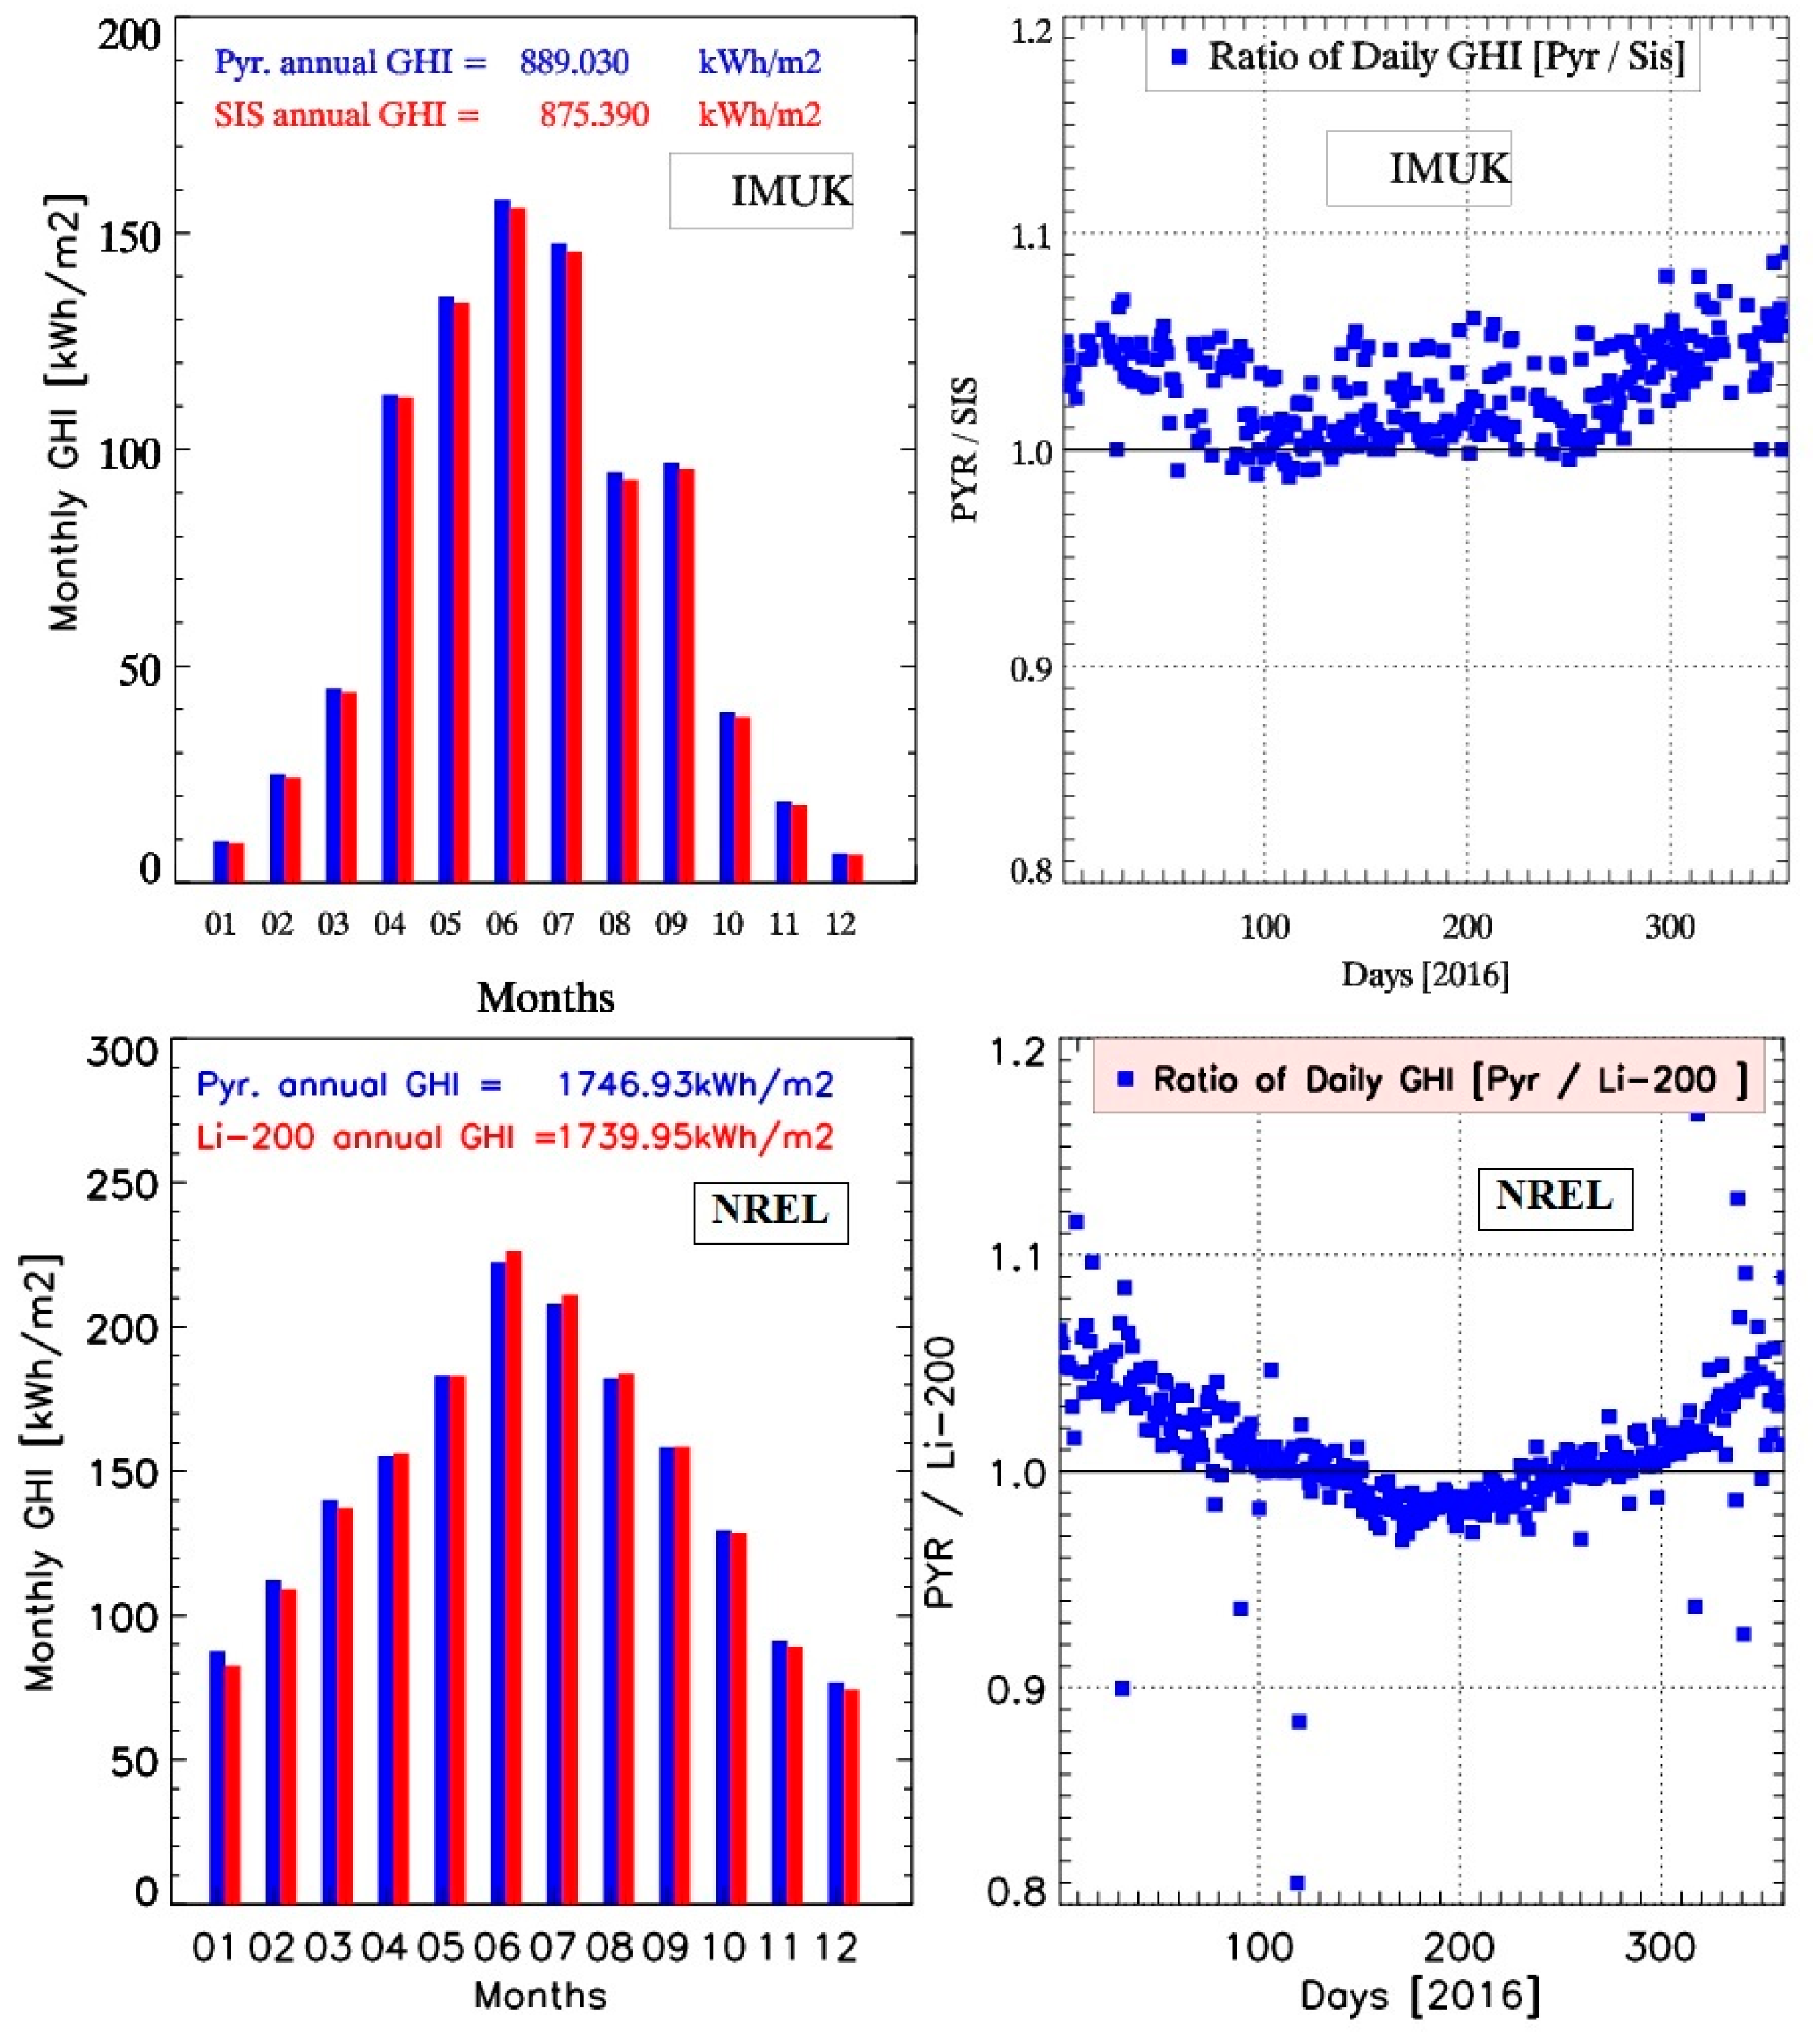
Figure 4.
Monthly and annual average of the statistical indices relative Root Mean Square Difference (rRMSD), relative Mean Absolute Difference (rMBD) and relative Mean Bias Difference (rMAD) between pyranometer and silicon sensor measurements at IMUK (a) and at NREL (b). The statistical indices show clear differences in the magnitude and show a seasonal dependence.

Figure 5.
Dependence of the rMAD on the used sensor for the five transposition models. The performance of models is better if the model input data (GHI) and validation data (GTI) are measured by sensors of the same type.
Figure 5.
Dependence of the rMAD on the used sensor for the five transposition models. The performance of models is better if the model input data (GHI) and validation data (GTI) are measured by sensors of the same type.
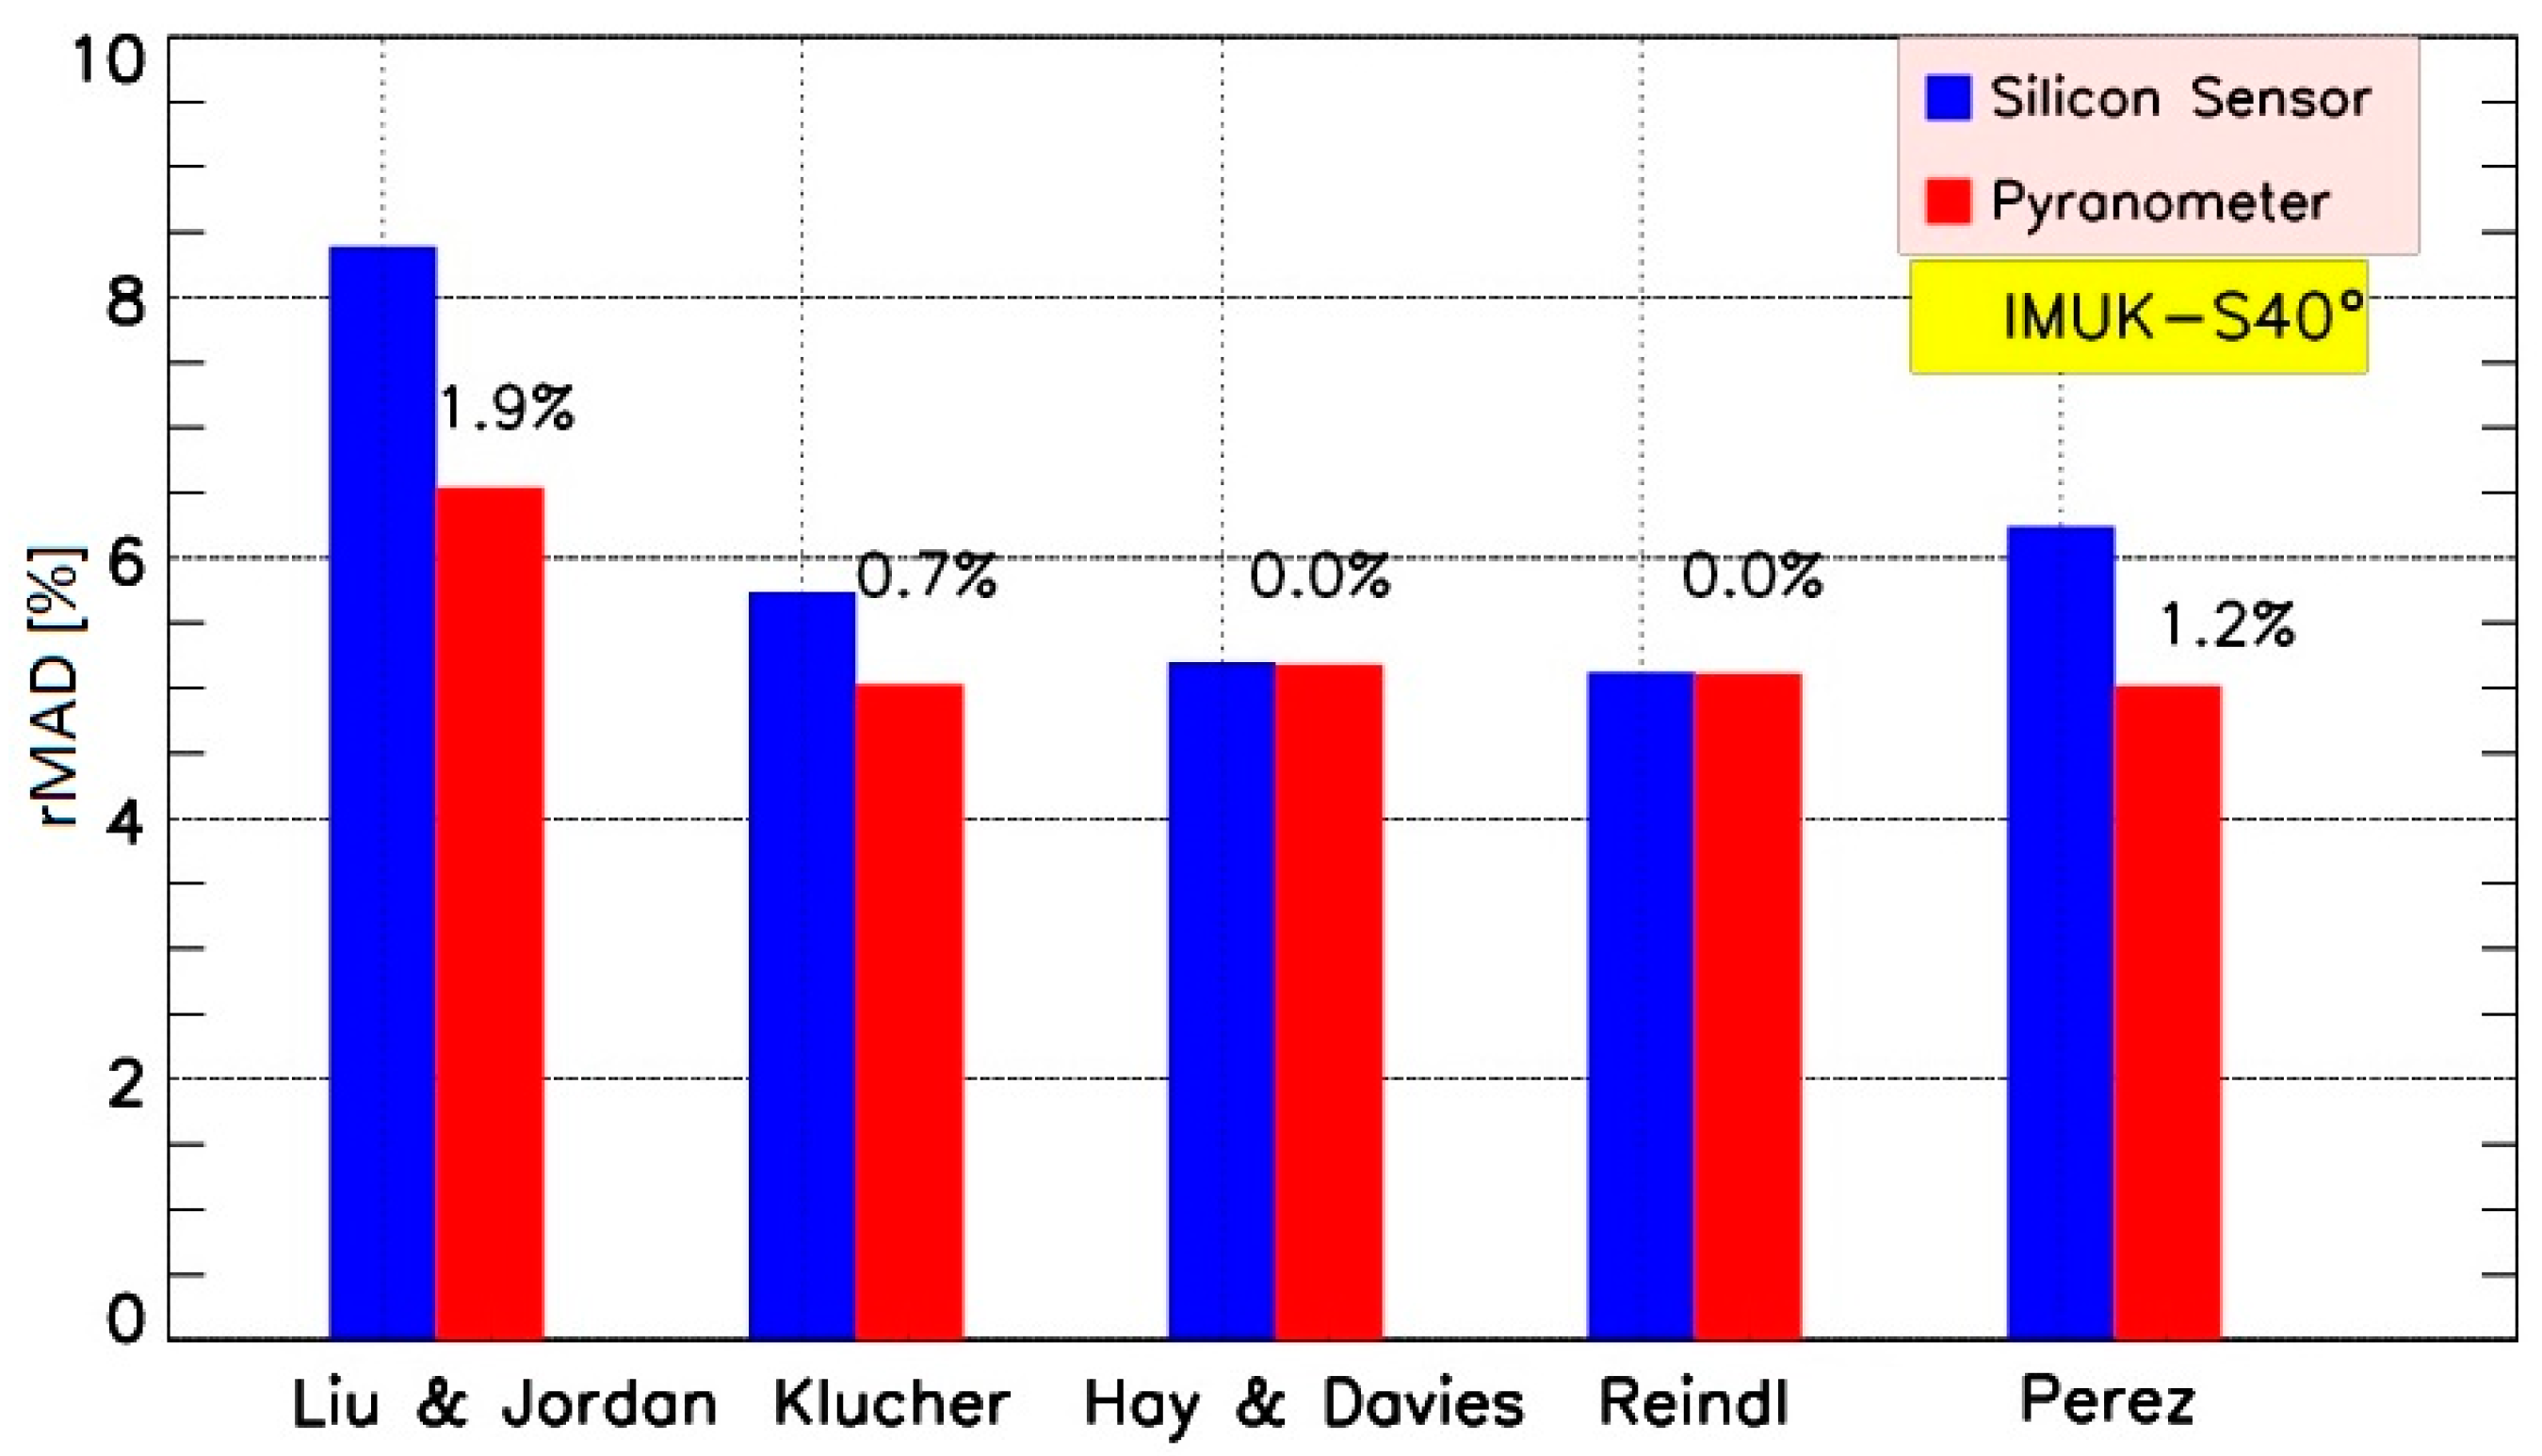
Figure 6.
Dependence of the rMAD for the five models on the spectrally constant ground albedo. The tilted irradiance has been calculated based on NREL data for 40° S tilt, using different constant albedo values (0.2, 0.4, 0.6 and 0.9) and measured values at NREL. The models show lower deviations to the measurement if measured albedo values are used.

Figure 7.
Same as Figure 6, but for 90° S. The rMAD increase as the albedo value increases. The plot illustrates albedo values on vertical tilted irradiance.
Figure 7.
Same as Figure 6, but for 90° S. The rMAD increase as the albedo value increases. The plot illustrates albedo values on vertical tilted irradiance.

Figure 8.
Root mean square difference (left) and mean bias difference (right) between model and measurements at IMUK for all south facing sensors (upper plots) and vertical sensors (lower plots). The difference increases, as the tilt angle increase.
Figure 8.
Root mean square difference (left) and mean bias difference (right) between model and measurements at IMUK for all south facing sensors (upper plots) and vertical sensors (lower plots). The difference increases, as the tilt angle increase.
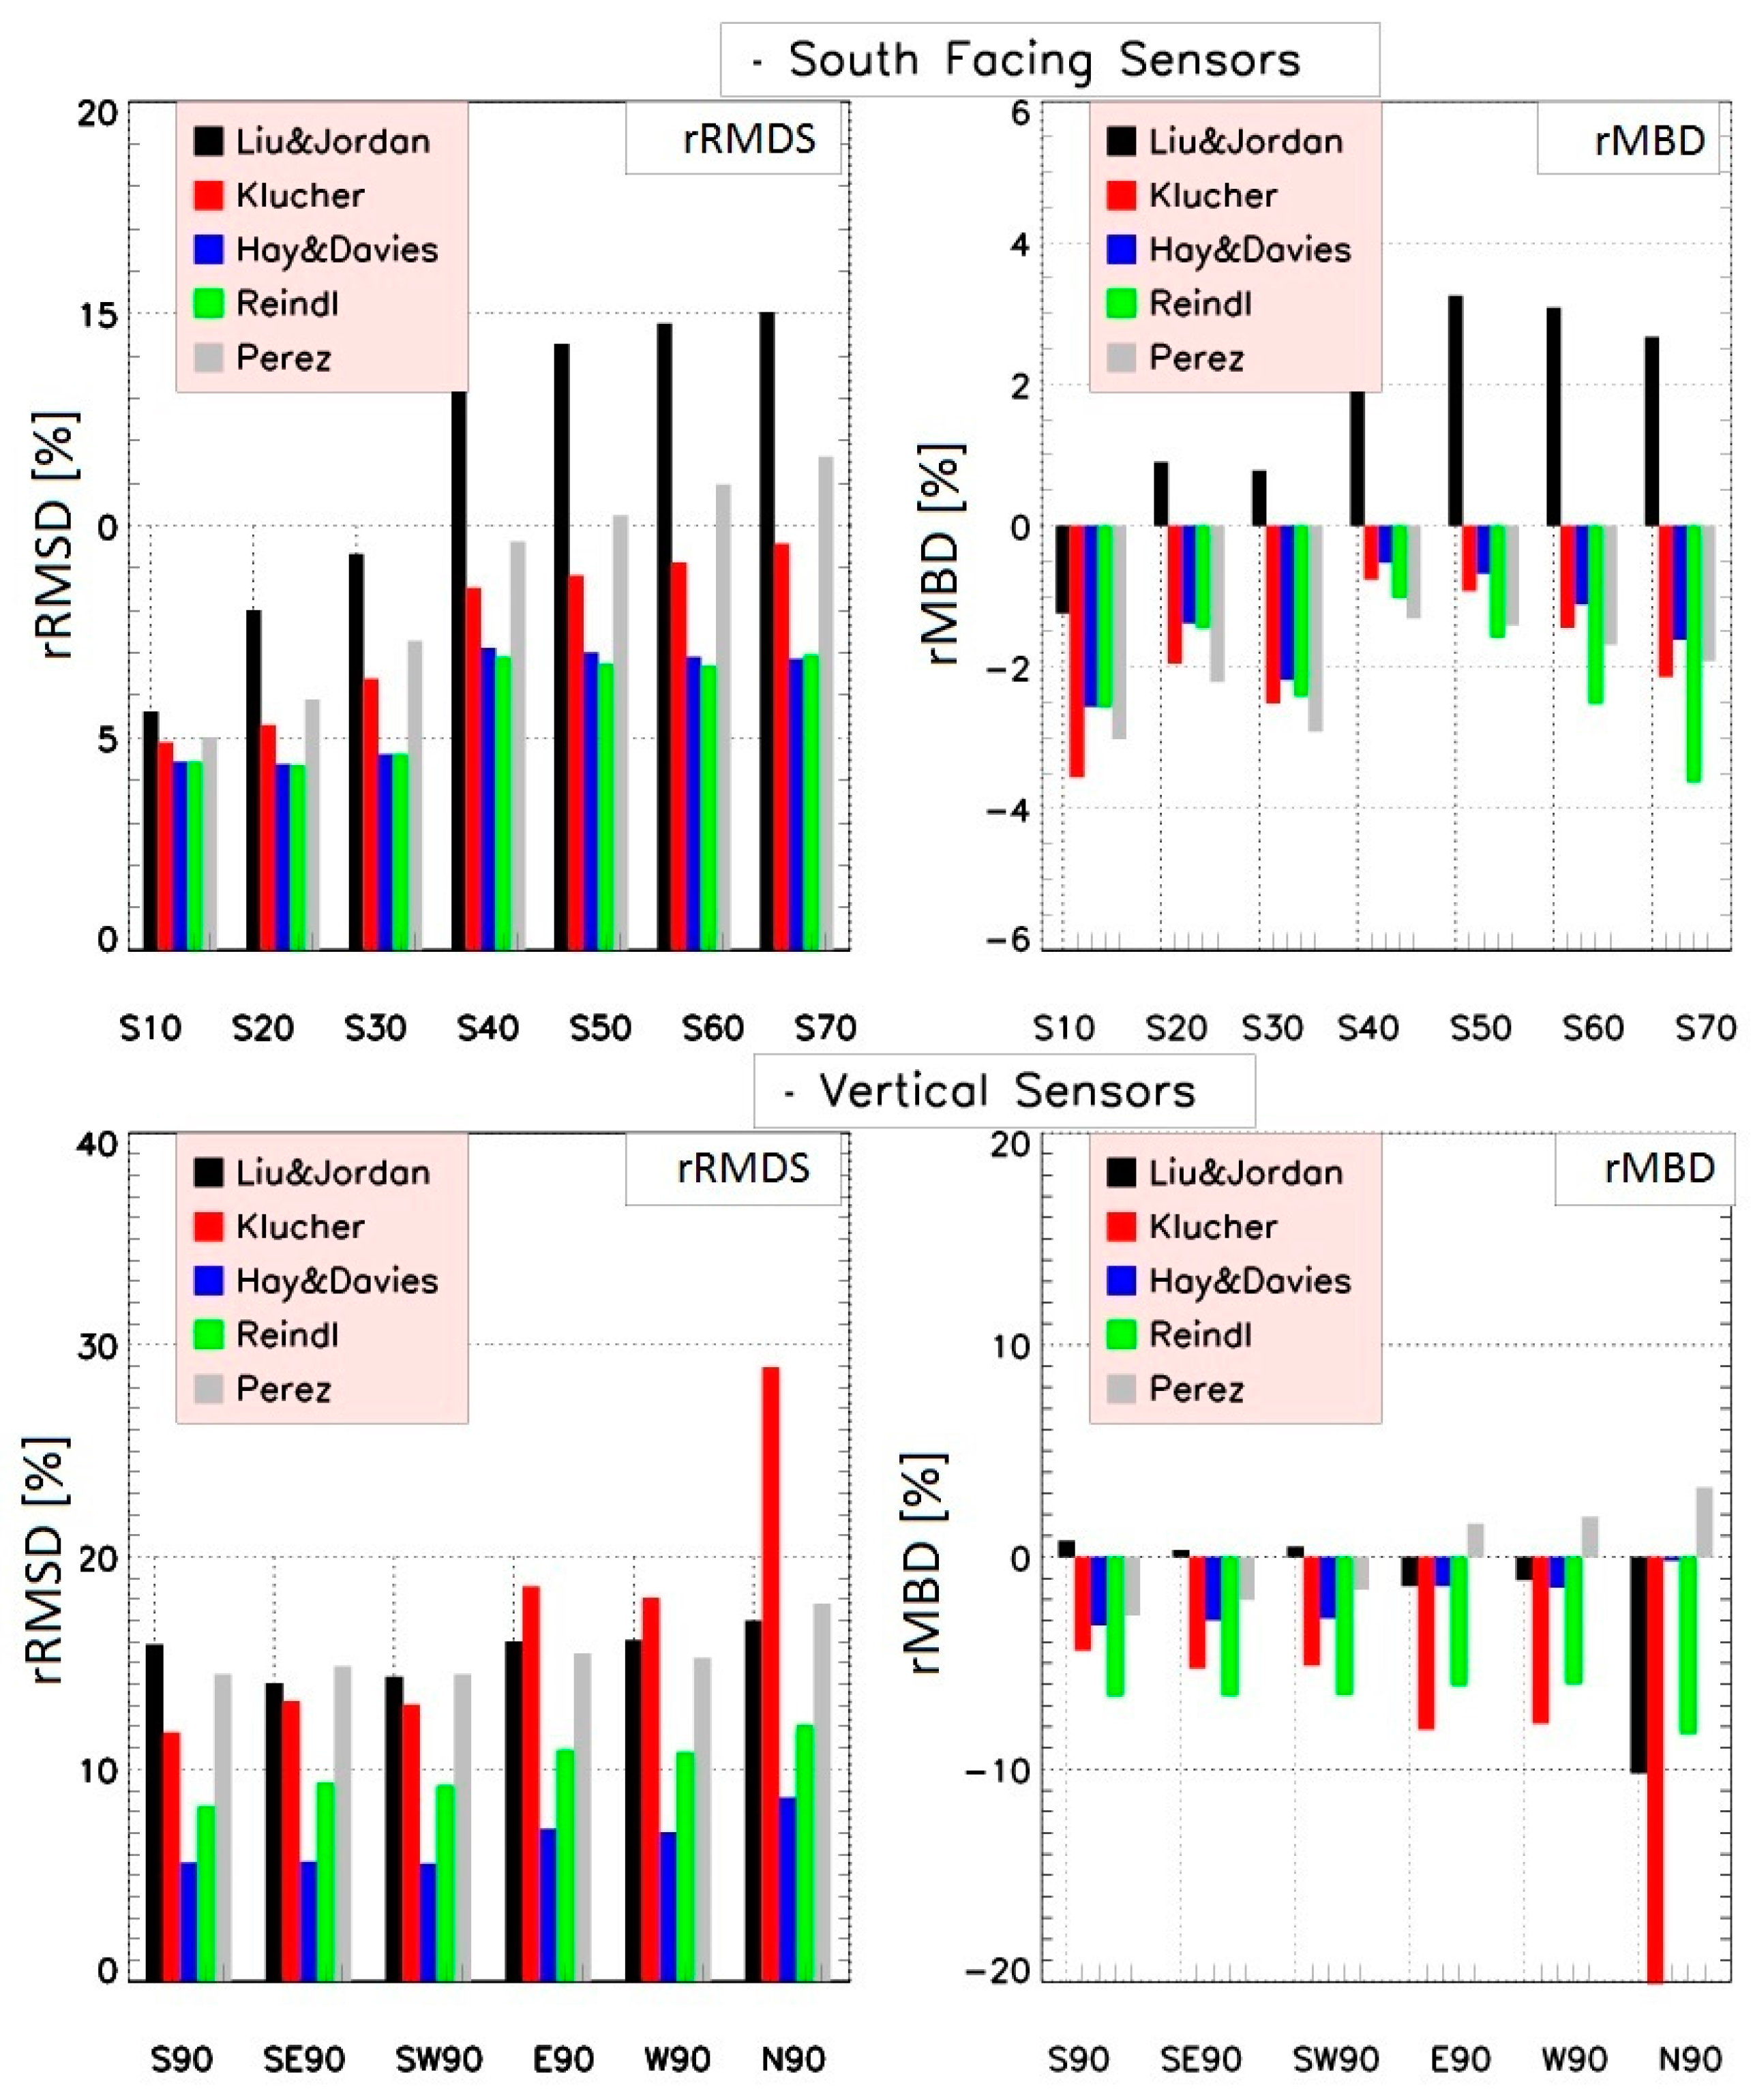
Figure 9.
Root mean square difference (left) and mean bias difference (right) between model and measurements at NREL for all available orientations.
Figure 9.
Root mean square difference (left) and mean bias difference (right) between model and measurements at NREL for all available orientations.

Table 1.
Perez model coefficients for various values of clearness ε.
| ε | ||||||
|---|---|---|---|---|---|---|
| [1, 1.065] | −0.008 | 0.588 | −0.062 | −0.06 | 0.072 | −0.022 |
| [1.065, 1.23] | 0.13 | 0.683 | −0.151 | −0.019 | 0.066 | −0.029 |
| [1.23, 1.5] | 0.33 | 0.487 | −0.221 | 0.055 | −0.064 | −0.026 |
| [1.5, 1.95] | 0.568 | 0.187 | −0.295 | 0.109 | −0.152 | −0.014 |
| [1.95, 2.8] | 0.873 | −0.392 | −0.362 | 0.226 | −0.462 | 0.001 |
| [2.8, 4.5] | 1.132 | −1.237 | −0.412 | 0.288 | −0.823 | 0.056 |
| [4.5, 6.2] | 1.06 | −1.6 | −0.359 | 0.264 | −1.127 | 0.131 |
| [6.2, ∞] | 0.678 | −0.327 | −0.25 | 0.156 | −1.377 | 0.251 |
Table 2.
Comparison of the specifications of the sensors used.
| Specifications | Pyranometer CMP11 | Silicon Sensor SiS | Silicon Sensor Li-200 |
|---|---|---|---|
| Spectral sensitivity range (nm) | 285–2800 | 350–1100 | 350–1100 |
| Response time (s) | 5 | <0.001 | <0.001 |
| Offset (W/m2) | 2 | 0 | 0 |
| Temperature dependence (−10–40 °C) (%) | <1 | 0.2 | ±0.15 |
| Uncertainty (W/m2) | <5 | ± 5 | <5 |
| Non-linearity (100 to 1000 W/m2) (%) | <0.5 | ±0.5 | <1.0 |
Table 3.
Components and data used for comparisons between measurements and models.
| Measurements | Model | |||||
|---|---|---|---|---|---|---|
| Parameter | Description | Measuring Sensor | Parameter | Description | Inputs | Measuring Sensor |
| GTI south facing (IMUK) | Tilt: 10°, 20°, 30°, 40°, 50°, 60°, 70° | SiS | GTI south facing | Tilt: 10°, 20°, 30°, 40°, 50°, 60°, 70° | GHI DHI Albedo | CMP11 CMP11 Const. 0.2 |
| GTI Vertical (IMUK) | E, S, W, N, SE, SW | SiS | GTI Vertical | E, S, W, N, SE, SW | GHI DHI Albedo | CMP11 CMP11 Const. 0.2 |
| GTI south facing (IMUK) | Tilt: 40° | CMP11 | GTI south facing | Tilt: 40° | GHI DHI Albedo | CMP11 CMP11 Const. 0.2 |
| GTI south facing (NREL) | Tilt: 40° | Li-200 | GTI south facing | Tilt: 40° | GHI DHI Albedo | CMP11 CMP11 Li-200 |
| GTI Vertical (NREL) | E, S, W, N | Li-200 | GTI Vertical | E, S, W, N | GHI DHI Albedo | CMP11 CMP11 Li-200 |
| GTI south facing (NREL) | Tilt: 40° | CMP11 | GTI south facing | Tilt: 40° | GHI DHI Albedo | CMP11 CMP11 Li-200 |
| GTI south facing (NREL) | Tilt: 40° | Li-200 | GTI south facing | Tilt: 40° | GHI DHI Albedo | CMP11 CMP11 Li-200 |
| GTI Vertical (NREL) | S | Li-200 | GTI Vertical | S | GHI DHI Albedo | CMP11 CMP11 Li-200 |
Table 4.
Performance of all five transposition models, compared to IMUK measurements.
| IMUK | Liu & Jordan | Klucher | Hay & Davies | Reindl | Perez | ||||||||||
|---|---|---|---|---|---|---|---|---|---|---|---|---|---|---|---|
| Azimuth/Tilt | rMBD | rMAD | rRMSD | rMBD | rMAD | rRMSD | rMBD | rMAD | rRMSD | rMBD | rMAD | rRMSD | rMBD | rMAD | rRMSD |
| ss10 | −1.24 | 4.32 | 5.62 | −3.56 | 4.06 | 4.98 | −2.56 | 3.67 | 4.44 | −2.57 | 3.67 | 4.44 | −3.02 | 3.94 | 5.01 |
| ss20 | 0.90 | 5.61 | 8.01 | −1.95 | 4.08 | 5.30 | −1.38 | 3.51 | 4.38 | −1.45 | 3.51 | 4.36 | −2.21 | 4.19 | 5.90 |
| ss30 | 0.78 | 6.55 | 9.33 | −2.51 | 4.95 | 6.39 | −2.18 | 3.75 | 4.62 | −2.41 | 3.77 | 4.61 | −2.91 | 5.08 | 7.28 |
| ss40 | 3.03 | 8.71 | 13.49 | −0.76 | 6.54 | 8.54 | −0.52 | 5.11 | 07.12 | −1.02 | 5.04 | 06.91 | −1.31 | 6.40 | 09.62 |
| ss50 | 3.25 | 9.11 | 14.29 | −0.92 | 6.20 | 08.83 | −0.68 | 5.06 | 07.02 | −1.58 | 5.01 | 06.74 | −1.41 | 6.88 | 10.24 |
| ss60 | 3.08 | 9.37 | 14.76 | −1.44 | 6.46 | 09.13 | −1.11 | 5.04 | 06.91 | −2.52 | 5.15 | 06.70 | −1.68 | 7.41 | 10.97 |
| ss70 | 2.57 | 10.96 | 15.03 | −2.14 | 6.47 | 09.58 | −1.61 | 5.05 | 06.86 | −3.63 | 5.16 | 06.95 | −1.93 | 8.05 | 11.63 |
| ss90 | 0.76 | 08.04 | 15.89 | −4.41 | 08.04 | 11.74 | −3.22 | 04.14 | 05.60 | −6.57 | 6.70 | 09.27 | −2.75 | 10.25 | 14.48 |
| se90 | 0.32 | 08.56 | 14.06 | −5.26 | 08.42 | 13.20 | −2.99 | 04.00 | 05.64 | −6.55 | 06.65 | 09.38 | −2.02 | 10.73 | 14.85 |
| sw90 | 0.50 | 08.70 | 14.36 | −5.12 | 08.43 | 13.05 | −2.98 | 03.96 | 05.55 | −6.51 | 06.60 | 09.26 | −1.54 | 10.43 | 14.47 |
| ee90 | −1.37 | 10.29 | 16.02 | −8.14 | 12.66 | 18.63 | −1.38 | 05.21 | 07.20 | −6.07 | 07.69 | 10.92 | 1.57 | 11.36 | 15.46 |
| ww90 | −1.09 | 10.46 | 16.10 | −7.86 | 12.50 | 18.09 | −1.43 | 05.13 | 07.02 | −6.01 | 07.67 | 10.80 | 1.98 | 11.27 | 15.24 |
| nn90 | −10.20 | 10.48 | 17.00 | −20.13 | 20.28 | 28.94 | −0.17 | 06.81 | 08.67 | −8.34 | 08.97 | 12.08 | 3.47 | 14.45 | 17.81 |
| pyr40 | 4.66 | 6.64 | 8.69 | 0.74 | 5.03 | 6.74 | 1.45 | 5.68 | 7.59 | 1 | 5.49 | 7.37 | 0.23 | 5.08 | 6.66 |
Table 5.
Performance of all five transposition models, based on NREL data base.
| NREL | Liu & Jordan | Klucher | Hay & Davies | Reindl | Perez | ||||||||||
|---|---|---|---|---|---|---|---|---|---|---|---|---|---|---|---|
| Azimuth/Tilt | rMBD | rMAD | rRMSD | rMBD | rMAD | rRMSD | rMBD | rMAD | rRMSD | rMBD | rMAD | rRMSD | rMBD | rMAD | rRMSD |
| S 40 | 2.89 | 5.47 | 7.85 | −0.45 | 3.95 | 6.08 | 0.08 | 4.0 | 6.26 | −0.36 | 3.94 | 6.18 | −0.96 | 3.98 | 6.0 |
| S 90 | 2.40 | 8.81 | 11.76 | −3.06 | 8.11 | 11.46 | 1.09 | 7.82 | 10.63 | −2.41 | 7.72 | 10.68 | −1.13 | 5.99 | 8.72 |
| E 90 | 5.48 | 13.87 | 20.5 | −1.75 | 13.1 | 18.64 | 4.70 | 11.18 | 15.50 | 0.91 | 10.5 | 14.8 | −6.88 | 17.07 | 24.02 |
| W 90 | 2.28 | 13.58 | 18.8 | −6.1 | 13.25 | 18.2 | 3.50 | 13.49 | 17.3 | −1.02 | 13.05 | 17.1 | −11.78 | 17.75 | 25.15 |
| N 90 | −4.60 | 18.3 | 24.10 | −16.7 | 21.00 | 29.05 | 12.33 | 28.20 | 33.78 | 3.47 | 25.85 | 31.8 | −2.65 | 14.31 | 18.89 |
© 2017 by the authors. Licensee MDPI, Basel, Switzerland. This article is an open access article distributed under the terms and conditions of the Creative Commons Attribution (CC BY) license (http://creativecommons.org/licenses/by/4.0/).
Share and Cite
MDPI and ACS Style
Mubarak, R.; Hofmann, M.; Riechelmann, S.; Seckmeyer, G. Comparison of Modelled and Measured Tilted Solar Irradiance for Photovoltaic Applications. Energies 2017, 10, 1688. https://doi.org/10.3390/en10111688
AMA Style
Mubarak R, Hofmann M, Riechelmann S, Seckmeyer G. Comparison of Modelled and Measured Tilted Solar Irradiance for Photovoltaic Applications. Energies. 2017; 10(11):1688. https://doi.org/10.3390/en10111688
Chicago/Turabian StyleMubarak, Riyad, Martin Hofmann, Stefan Riechelmann, and Gunther Seckmeyer. 2017. "Comparison of Modelled and Measured Tilted Solar Irradiance for Photovoltaic Applications" Energies 10, no. 11: 1688. https://doi.org/10.3390/en10111688
Note that from the first issue of 2016, this journal uses article numbers instead of page numbers. See further details here.